
10
Earth Surface and Interior: Dynamics and Hazards
INPUT SUMMARY
Earth’s terrestrial surface is the nexus where diverse systems vital to the habitability of the planet converge. Tectonic processes and flow in Earth’s interior drive deformation of Earth’s surface that can lead to destructive earthquakes, tsunamis, and volcanic eruptions. Climatic processes affect the dynamics of Earth’s ice sheets and glaciers, and along with local tectonic processes, modulate changes in average sea level. Long-term climatic trends (e.g., toward increased drought, storminess, or climate extremes) create a key context within which the intensity, location, and persistence of weather events determine local impacts (e.g., topsoil loss, channel formation, and coastal erosion). Both ecological and hydrological processes respond to changes in water abundance, soil quality, and nutrient availability; to climatic and meteorological trends; and to societal activities. This ensemble of Earth system processes drives continual change of Earth’s terrestrial surface. Given that this surface is also the home to humans and to many resources that sustain society, our greatest task is to understand how Earth’s surface evolves; what controls its response, resilience, and vulnerability to natural and anthropogenic events; and how to use science and space-based observations to guide decision making to ensure a sustainable future.
Space-based measurements of Earth’s surface and interior provide fundamental information about the current state and ongoing dynamics of the planet—critical ingredients for defining and mitigating hazards. Many major processes affecting hazards and habitability can be observed and compared over Earth’s surface only from space. Over the coming decade next-generation satellites could finally have sufficient accuracy, spatial resolution, coverage, and temporal sampling to enhance modeling, forecasting, mitigation, and response to impulsive events (e.g., earthquakes, volcanoes, or landslides), to long-term trends (e.g., sea-level rise, ice-sheet decay, or groundwater depletion), and to chronic and event-driven processes (e.g., erosion and deposition on hillsides, in channels, and along coasts) that impact society and shape our planet.
Based on input from the science community, as well as recent planning documents, the Panel on Earth Surface and Interior: Dynamics and Hazards considered the important science and applications areas that could be significantly advanced over the next decade using mainly space-based measurements. The panel’s science and applications priorities, as addressed in its questions and measurement objectives (Table 10.1), provide a vision for critical advances in understanding Earth processes and hazards.
TABLE 10.1 Summary of Science and Applications Questions and Their Priorities
| Science and Applications Questions | Highest Priority Measurement Objectives (MI=Most Important, VI=Very Important) | |
|---|---|---|
| S-1 | How can large-scale geological hazards be accurately forecast in a socially relevant time frame? | (MI) S-1a. Measure the pre-, syn-, and posteruption surface deformation and products of Earth’s entire active land volcano inventory with a time scale of days to weeks. |
| (MI) S-1b. Measure and forecast interseismic, preseismic, coseismic, and postseismic activity over tectonically active areas on time scales ranging from hours to decades. | ||
| (VI) S-1c. Forecast and monitor landslides, especially those near population centers. | ||
| One objective ranked Important (S-1d). | ||
| S-2 | How do geological disasters directly impact the Earth system and society following an event? | (MI) S-2a. Rapidly capture the transient processes following disasters for improved predictive modeling, as well as response and mitigation through optimal retasking and analysis of space data. |
| (VI) S-2b. Assess surface deformation (<10 mm), extent of surface change (<100 m spatial resolution) and atmospheric contamination, and the composition and temperature of volcanic products following a volcanic eruption (hourly to daily temporal sampling). | ||
| (VI) S-2c. Assess co- and postseismic ground deformation (spatial resolution of 100 m and an accuracy of 10 mm) and damage to infrastructure following an earthquake. | ||
| S-3 | How will local sea level change along coastlines around the world in the next decade to century? | (MI) S-3a. Quantify the rates of sea-level change and its driving processes at global, regional, and local scales, with uncertainty <0.1 mm/yr for global mean sea-level equivalent and <0.5 mm/yr sea-level equivalent at resolution of 10 km. |
| (MI) S-3b. Determine vertical motion of land along coastlines at uncertainty <1 mm/yr. | ||
| S-4 | What processes and interactions determine the rates of landscape change? | (MI) S-4a. Quantify global, decadal landscape change produced by abrupt events and by continuous reshaping of Earth’s surface from surface processes, tectonics, and societal activity. |
| Two objectives ranked Important (S-4b and S-4c). | ||
| S-5 | How does energy flow from the core to Earth’s surface? | (VI) S-5a. Determine the effects of convection within Earth’s interior, specifically the dynamics of Earth’s core and its changing magnetic field, and the interaction between mantle convection and plate motions. |
| Two objectives ranked Important (S-5b and S-5c). | ||
| S-6 | How much water is traveling deep underground and how does it affect geological processes and water supplies? | (VI) S-6a. Determine the fluid pressures, storage, and flow in confined aquifers at spatial resolution of 100 m and pressure of 1 kPa (0.1 m head). |
| Three objectives ranked Important (S-6b, S-6c, and S-6d). | ||
| S-7 | How do we improve discovery and management of energy, mineral, and soil resources? | One objective ranked Important (S-7a). |
Two of the high-priority science and application areas relate to understanding, forecasting, and responding to geologic natural disasters including volcanic eruptions, earthquakes, and landslides (Questions S-1 and S-2).1 Over the past decade tremendous progress has been made in monitoring and modeling volcanoes and earthquake faults from space using high spatial resolution deformation measurements along with frequent imaging and measurements of gravity change. The objectives over the next decade are (1) to forecast earthquakes, volcanic eruptions, and landslides on a time scale relevant to society; and (2) to assess and mitigate the hazards posed by these sudden events by monitoring disaster-prone areas. Complete imaging and modeling of these geologic systems requires measurements that span time scales from seconds to thousands of years and spatial scales from meters to thousands of kilometers. When high spatial resolution maps of deformation generated using Interferometric Synthetic Aperture Radar (InSAR) are combined with the high accuracy and high temporal resolution of Global Positioning System (GPS) data, they can fill a large part of this space-time spectrum. Improved, high-resolution global topography provides a critical component and context for hazard assessment and mitigation. Frequently acquired, high spatial resolution optical and multispectral imager data are especially important for understanding volcanic activity, as well as for supporting disaster response and mitigation. Additional measurements (discussed later) could fuel further advances.
A second high-priority science and application area is to monitor and forecast sea-level change, especially along highly populated coastlines where millions of people will be affected (Question S-3). This effort involves two different but important tasks. The first is to monitor the redistribution of water over Earth between the ice sheets, oceans, and land. Quantifying this redistribution can be done only using very accurate satellite-based measurements of (1) the volume changes of the ice sheets; (2) the mass changes of the oceans, ice, and land; (3) thermal changes of the ocean; and (4) spatial and temporal variations in sea level. These critical measurements are also priorities of other panels, but over the past three decades, geodesists have been at the leading edge of developing the precise measurement tools, such as satellite altimetry, gravity (i.e., mass) change, InSAR, and the terrestrial reference frame. The second sea-level task, not considered by other panels, is to monitor and forecast vertical land motion along coastlines caused by postglacial rebound, sediment loading and compaction, tectonics, recent glacier or ice-sheet melting, and anthropogenic processes. Rates of land subsidence commonly exceed rates of sea-level rise, especially in areas with high sediment compaction (e.g., deltas) or extraction of groundwater or hydrocarbons. The tools needed to monitor vertical land motion are InSAR, GPS, swath altimetry, and gravity change.
A third high-priority area is to monitor, understand, and predict the complex interactions of the “critical zone,” which extends from the top of the vegetation canopy to the base of the weathered bedrock (Question S-4). This zone is the dynamic surface where freshwater flows, soils are created and destroyed, and terrestrial life flourishes—key features on which modern civilization depends. Over time the critical zone has achieved a rough equilibrium where water, nutrient, and energy fluxes are in an approximate balance. However, after centuries of human activity, some of these landscapes may be near tipping points or thresholds at which relatively modest changes in the governing fluxes can cause abrupt, large-scale, and irreversible changes. Major challenges include (1) quantifying the fluxes and the resultant “balance” as reflected in the shape, dynamics, chemistry, and biota of undisturbed landscapes; and (2) predicting and measuring how perturbations owing to tectonics, weather, ecological changes, or human activities (agriculture, construction, fire) have affected (or soon will) the established balance. Progress in understanding and predicting changes in the critical zone relies on a suite of terrestrial and space-based measurements. High-resolution, multispectral, and hyperspectral imagery are used to help detect patterns and rates of
___________________
1 In this report, a “forecast” is a probabilistic assessment of the likelihood and timing of an event. In contrast, a “prediction” is a deterministic statement about where and when the event will occur, and it will be either correct or incorrect. Short-term predictions of some natural hazards may never be possible.
vegetative, mineralogic (topsoil, nutrients), and surface change. A critical missing ingredient is the measurement of bare-earth topography—a goal attainable now with directed airborne surveys and ultimately with global coverage from space-based swath lidar.
The fourth high-priority area is to improve understanding of the dynamics of Earth’s mantle and core (Question S-5). Convection of Earth’s fluid inner core generates the protective magnetic field. Changes in the field on yearly time scales are best monitored from multiple small magnetometer satellites. Mantle and core dynamics are mainly studied using terrestrial measurements such as seismology, combined with advanced modeling of thermal convection. The surface manifestation of mantle convection is plate tectonics, and plate motions are measured using a suite of geodetic tools, such as Very Long Baseline Interferometry (VLBI), Satellite Laser Ranging (SLR), GPS, and InSAR. These same tools are used to maintain the terrestrial reference frame to the 0.1 mm/yr accuracy needed to monitor global sea level. Major shifts in the reference frame, such as those caused by recent megathrust earthquakes, need to be accurately modeled and removed from the sea-level time series.
The fifth high-priority area is to monitor water traveling underground and how it affects geological processes and water supplies (Question S-6). Growing reliance on subsurface water requires measuring, monitoring, and managing aquifer systems in a sustainable way to prevent risks to human health in many parts of the world. Overproduction of groundwater aquifers not only reduces the amount of immediately available water but also can lead to loss of storage capacity, such that the aquifer may no longer be able to be recharged, even if rainfall is abundant. In addition wastewater disposal in oil and gas wells induces earthquakes in regions where such activity has historically been minimal. Ground deformation is a sensitive but underutilized indicator of the health of deep groundwater reserves.
Over the coming decade, next-generation satellites with higher spatial resolution, expanded Earth coverage, and higher temporal sampling promise to enhance observation, quantification, forecasts, mitigation, and response to Earth surface and interior processes that affect society and shape the planet. New spaceborne measurements needed to support the highest priority science and applications objectives are summarized in Table 10.2. Other important spaceborne measurements and complementary terrestrial measurements (notably, GPS), and airborne measurements (notably, lidar) are described in the section “Enabling Measurements.”
TABLE 10.2 Priority Targeted Observables Mapped to the Science and Applications Objectives That Were Ranked as Most Important (MI) or Very Important (VI)
| Priority Targeted Observables | Science and Applications Objectives |
|---|---|
| Surface Deformation and Change | Earthquake, volcano, and landslide dynamics, forecasts, and impacts (S-1a, S-1b, S-1c, S-2a, S-2b, S-2c); dynamics of the deep interior (S-5a); sea-level change (S-3a, S-3b); landscape change (S-4a); and subsurface water flow (S-6a) |
| Surface Topography and Vegetation | Earthquake, volcano, and landslide dynamics, forecasts, and impacts (S-1a, S-1b, S-1c, S-2c); sea-level change (S-3a, S-3b); and landscape change (S-4a) |
| Mass Change | Megathrust earthquakes (S-1b, S-2c); ice mass loss and postglacial rebound (S-3a); and landscape changes (S-4a) |
| Surface Biology and Geology | Volcanic activity and impacts (S-1a, S-2b); and landslide monitoring (S-1c) |
| Surface Water Height | Sea-level change (S-3a); deep Earth dynamics (S-5a); and subsurface water flow (S-6a) |
| Magnetic Field | Dynamics of the deep Earth and its magnetic field (S-5a) |
| Terrestrial Reference Frame | Underpins accurate positioning and navigation of all satellite and aircraft missions; the most stringent requirements come from monitoring sea-level change (S-3a) |
Surface deformation and topography measurements each support a wide variety of science and applications objectives. Deformation measurements, such as InSAR, are an important tool for understanding the dynamics of earthquakes, volcanoes, landslides, glaciers, groundwater, and the deep interior; for quantifying the rates and driving processes of sea-level change and landscape change; and for supporting hazard forecasts and disaster impact assessments. High-resolution topography measurements provide the physical template for the processes that carve the planet and control the critical zone where most terrestrial life occurs. Reliable, repeated high-resolution (~1 m spatial resolution and 0.1 m vertical resolution) topography supports the objectives of quantifying dynamic change and processes in landscapes, as well as making accurate forecasts of how impulsive events (e.g., earthquakes or storms) and long-term trends (e.g., sea-level rise or deforestation) affect landscapes and society. Developing such a capability from space is a high priority. In the meantime, it will be necessary to expand acquisition of airborne lidar.
High-resolution image data are needed to support objectives related to geological hazards and disasters as well as landscape change. In particular, hyperspectral data from ultraviolet to thermal wavelengths are a priority for tracking pre-, syn-, and posteruption volcanic gases, ash, and other eruptive products (like lava); for quantifying the extent and impact of natural and man-made disasters owing to earthquakes, volcanic eruptions, storms, floods, coastal inundation, and wildfire; for exploring resources; and for documenting ecological and mineralogical changes that modulate landscape evolution.
Temporal variations in gravity capture shrinkage and growth of key water resources—glaciers, ice sheets, and subsurface water. Tracking mass changes in both the surface and subsurface using gravity with an increasingly higher spatial resolution, as with Gravity Recovery and Climate Experiment-Follow On (GRACE-FO) and successor missions, will permit quantification of spatial changes in glaciers and ice sheets, seasonal snowpack, and large surface and groundwater reservoirs. Radar altimetry is essential for measuring an accurate mean sea surface, from which high-resolution (<10 km) ocean gravity can be derived, and for measuring sea-surface height—a critical aspect of sea-level change studies.
At a deeper Earth scale, a constellation of vector magnetic satellites would provide fundamental new insights into the dynamics of the deep Earth and its magnetic field.
Underpinning all spaceborne observations is an accurate terrestrial reference frame, which is critical for accurate positioning and navigation of all satellite and aircraft missions, especially now that it is necessary to reliably integrate data from constellations of satellites. Notably, ground networks (VLBI, SLR, and GPS) remain an essential component for reliable, sustained quantification of this terrestrial reference frame. Consequently, a major Earth observing priority for the next decade is to maintain and improve the terrestrial reference frame.
Implementing the vision outlined earlier will enable advances in the following scientific and applications areas:
- Forecasting natural disasters, including the timing and size of earthquakes, the timing and duration of volcanic eruptions, and the timing and location of landslides.
- Responding rapidly to natural disasters and mitigating their consequences.
- Quantifying global, decadal landscape change owing to surface processes, tectonics, and societal activities.
- Understanding and forecasting regional variations in sea-level rise.
- Measuring and forecasting vertical land motion along coastlines to assess and mitigate hazards from relative sea-level rise.
- Monitoring, understanding, and forecasting spatial and temporal variations of Earth’s magnetic field.
- Quantifying mantle convection to understand how it drives plate motions and generates earthquakes and volcanic eruptions.
- Understanding temporal variations of water discharge and subsurface water storage and transport.
- Understanding Earth surface and interior processes caused or influenced by anthropogenic activity.
INTRODUCTION AND VISION
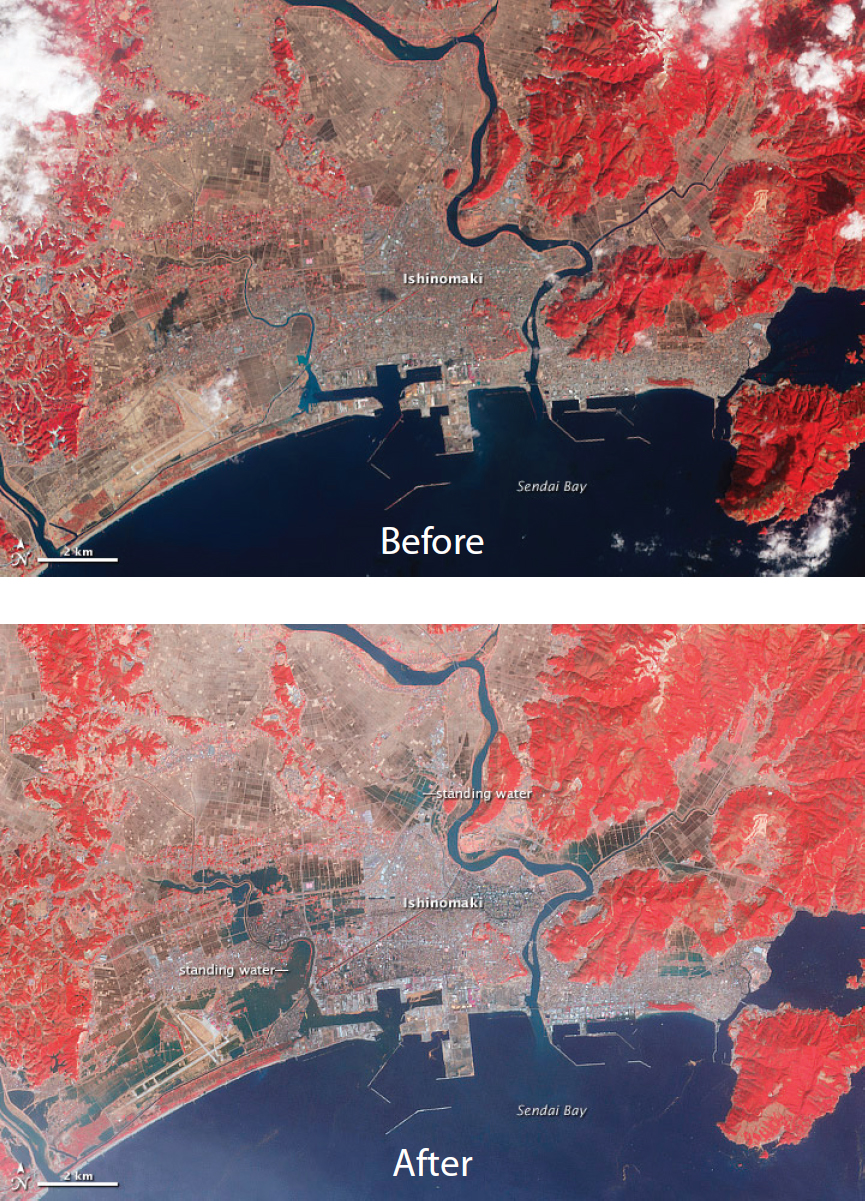
Since the satellite era began, measurements of Earth from space have captured our imagination with gripping images of downwind ash plumes from newly awakened volcanoes or the swaths of destruction wreaked by tsunamis, fires, and typhoons. Imagery of the aftermath shows the incremental response, recovery, or degradation of landscapes, ecological systems, and society (e.g., Figure 10.1). These images and other remotely sensed data from Earth observing satellites play a key role in helping us understand Earth’s surface and interior. Fluid motions in the core generate the magnetic field, protecting us from space radiation. Mantle convection drives plate tectonics and deforms Earth’s surface, creating volcanic eruptions, earthquakes, tsunamis, and landslides, and sometimes causing great destruction. Erosion and sedimentation reshape Earth’s surface and affect water and agricultural systems, as well as infrastructure. Vertical land motions driven by the redistribution of water and ice on the planet change sea levels and shorelines. Last, human activity has a profound impact on water resources, landscape stability, ecological diversity and health, and long-term sustainability. These processes operate on diverse time scales, from continuous (e.g., river erosion) to episodic (e.g., volcanic eruptions) and from minutes (e.g., earthquakes) to millions of years (e.g., subduction zone tectonics).
Earth’s surface is the critical interface at which many other vital systems (atmosphere, hydrosphere, biosphere, tectosphere, and human) interact: interactions that determine the planet’s habitability. Nutrient-rich soils sustain global agriculture and healthy ecosystems. Groundwater aquifers are tapped and increasingly depleted to meet agricultural, industrial, and social needs. Within Earth lie key minerals and energy resources needed to maintain technologies and quality of life. Both the discovery of essential resources and the adverse impacts of their extraction, use, and disposal pose persistent challenges for society. The ability to leverage a growing understanding of these processes and interactions and to answer still-open questions will strengthen society’s ability to forecast, prepare for, and mitigate the impact of disruptive change on multiple time scales.
Enhanced understanding of the dynamics of Earth’s surface and interior and their societal relevance requires both global observations from space as well as diverse and detailed ground and aircraft measurements. Sequential observations over decades enable the definition of long-term trends and the examination of the impact of events, such as volcanic eruptions or surging glaciers, that engender a chain of subsequent responses. Such observations also allow the identification of key thresholds that, when crossed, typically cause disruptive change. For example, what threshold conditions of strain accumulation nucleate destructive earthquakes? Last, a sustained, high-resolution, remote sensing record provides the critical basis for reliable analysis of cause and effect. For example, what combination of seismic shaking, hillslope steepening, rainfall, and vegetation change causes catastrophic collapse of mountainsides?
Key goals of sustained, high-resolution, space-based observation of the Earth surface and interior are (1) to quantify the nature and pace of change, such as melting ice sheets and shifting coastlines; (2) to characterize the precursors, impacts, and key thresholds of disruptive events, such as earthquakes, volcanic eruptions, or wildfires; (3) to delineate incremental change in Earth’s life-sustaining surface (its critical zone; Brantley et al., 2007) in response both to events and to sustained trends (e.g., increased drought, permafrost loss, or ecological shifts); and (4) to assess the impact of human activity on resources, environmental quality, sustainability, and habitability.
This section first summarizes some significant improvements in understanding, monitoring, and forecasting Earth surface and interior processes using remotely sensed observations over the past two decades.
Next, seven science and application challenges are identified and prioritized where spaceborne data could lead to major advances for both science and society. Last, a set of new measurements are proposed that would lead to substantial progress on these science and applications priorities over the next 10 years.
Benefits of Prior Investments in Earth Observing Satellites
Over the past two decades, advances in observational capabilities—including Synthetic Aperture Radar (SAR) interferometry, time-variable gravity, global and bare-earth topography, laser and radar altimetry, magnetometry, and hyperspectral imaging—have underpinned new scientific insights. Some of these insights were based on data from a single satellite, some from a synthesis of data from multiple satellites, and some from the integration of multiple satellite data with airborne observations. Importantly, the invaluable terrestrial reference frame that permits reliable integration of nearly all Earth observations from space was also significantly enhanced during the past decade. Several such advances are summarized here (Davis et al., 2016).
Land-Surface Deformation
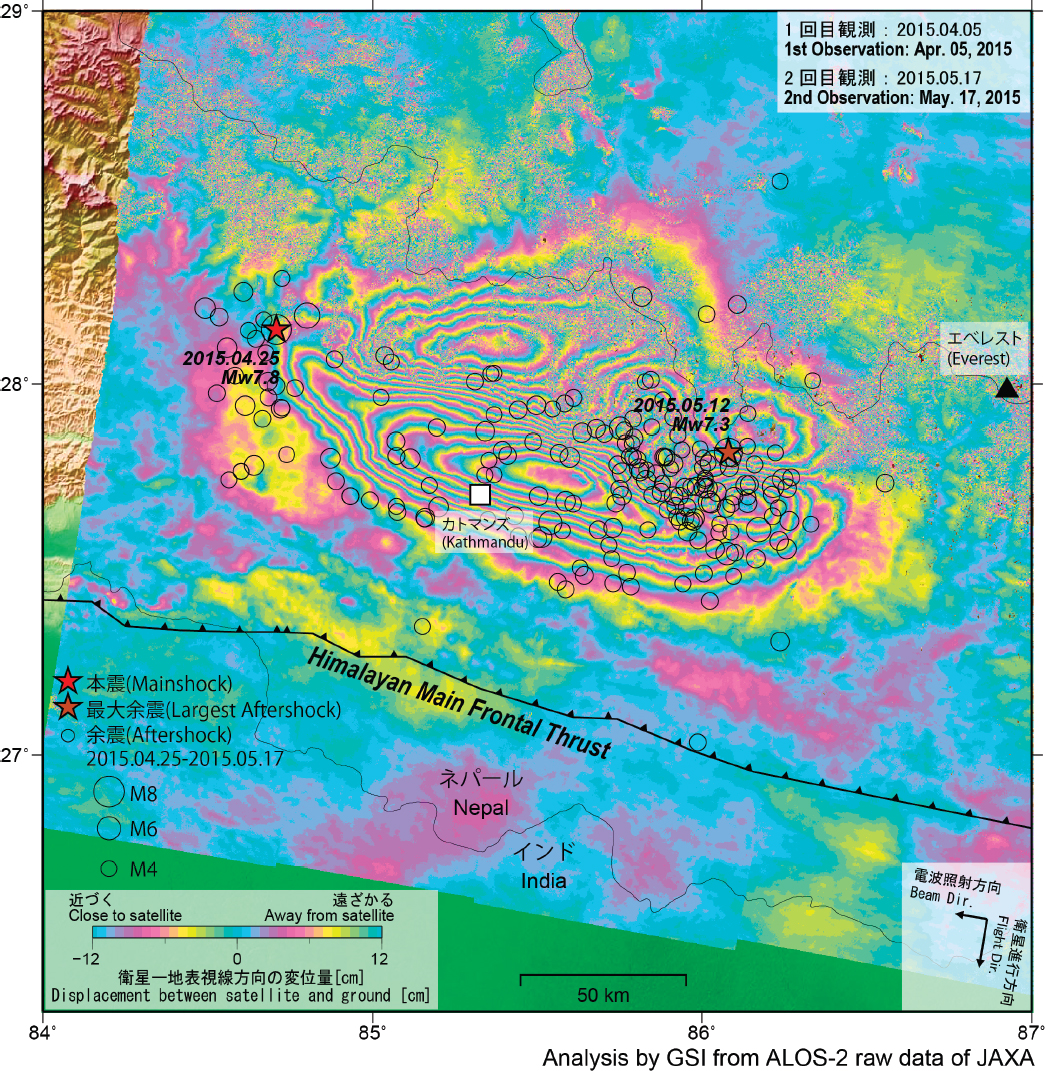
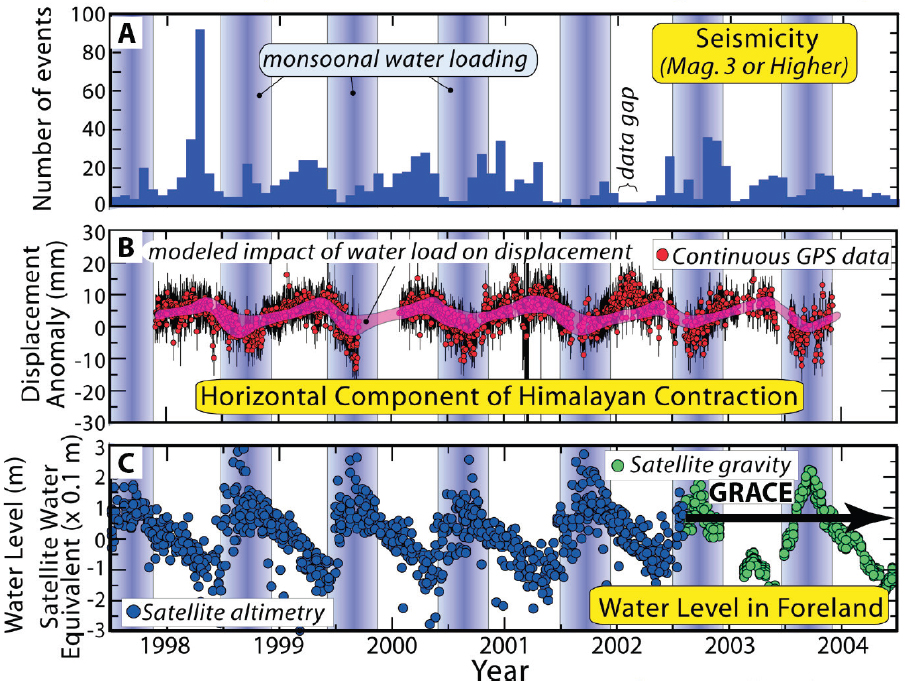
Earth’s surface is constantly changing, and its deformation reveals details of earthquake cycles, plate motion, volcanic processes, sediment deposition and compaction, and groundwater extraction. Land-surface deformation is now commonly quantified using a combination of GPS and InSAR. In vegetated areas where correlation degrades, the use of longer wavelength radar and persistent scatterers (i.e., outcrops or buildings) has permitted coherent deformation patterns to be observed (Bürgmann et al., 2006). L-band, which provides superior phase coherence even in the most challenging snow-covered terrain on Earth, will be used in the NASA-ISRO Synthetic Aperture Radar (NISAR) interferometer. These new capabilities are bringing novel insights. The first L-band, wide-swath interferogram of a large thrust-fault earthquake (Nepal; Figure 10.2) showed that the earthquake and subsequent aftershock left an unruptured gap on the fault surface. This discontinuity suggests that a high seismic hazard exists for the densely populated area abutting the main rupture. Along the Himalayan front, a spatially nuanced and temporally resolved perspective on surface uplift and subsidence is emerging from repeat satellite surveys, revealing some fundamentally new processes and interactions. For example, geodetic and seismic time series, combined with GRACE gravity data, have revealed surprising connections between annual cycles of water loading by monsoonal rains and seismicity in the Himalaya (Figure 10.3).
Detection and Compositional Analysis of Volcanic Plumes
Greatly improved temporal and spatial resolution in multi- to hyperspectral data has driven remarkable new insights on volcanic systems and the plumes they produce. Data from imagers, spectrometers, and sounders in wavelengths spanning from ultraviolet (UV) to thermal infrared (TIR) enable detection of silicate ash composition and particle size, sulfur dioxide, and numerous other gases and aerosols. For example, exploiting multispectral TIR data from ASTER acquired at sub-100 m resolution, Henney et al. (2012) were able to quantify passive SO2 degassing at Lascar Volcano (Chile)—the first time that small (less than 1 km), low-level, passive plumes were detected from space. This advance allows detection any time of day and is many times more sensitive than UV-based retrievals owing to the small spatial scales and detection capability at the vent of the volcano. Such an approach, especially coupled with higher temporal resolution, could lead to critical improvements in our ability both to monitor and forecast eruptions and to explore how weakly emitted plumes (both man-made and natural) affect the chemistry of the atmosphere. For example,
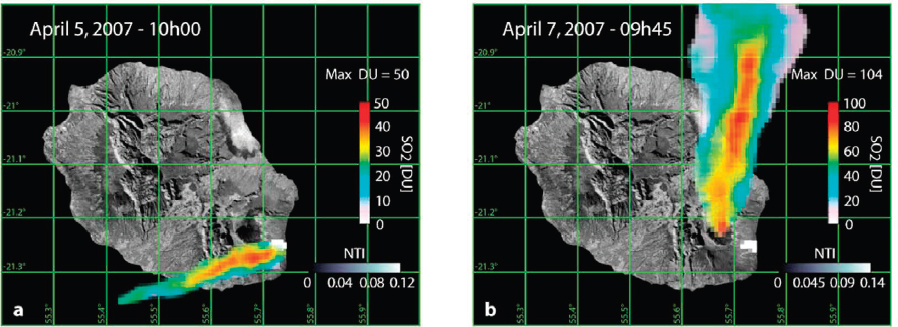
the improving temporal frequency of sensors over the last decade has allowed near-real-time exploration of the dynamics of plumes. Geostationary sensors deliver these data, but at the expense of spatial resolution, and so they can detect only the largest activity (e.g., Prata and Kerkmann, 2007). Smaller plume activity can be explored using polar-orbiting sensors. For example, Gouhier and Coppola (2011) calculated gas fluxes and lava-discharge rates using the combined data from the Moderate-Resolution Imaging Spectroradiometer (MODIS) and Ozone Monitoring Instrument (OMI) sensor for the 2007 eruption of Piton de la Fournaise (Reunion). Their analysis pinpointed the plume’s location, allowed the gas concentration to be inferred (Figure 10.4), and quantified a significant difference between the volume of SO2 that was erupted and the volume that was degassed. This discrepancy revealed a large active hydrothermal system below the summit, a critical indicator of future eruptive activity.
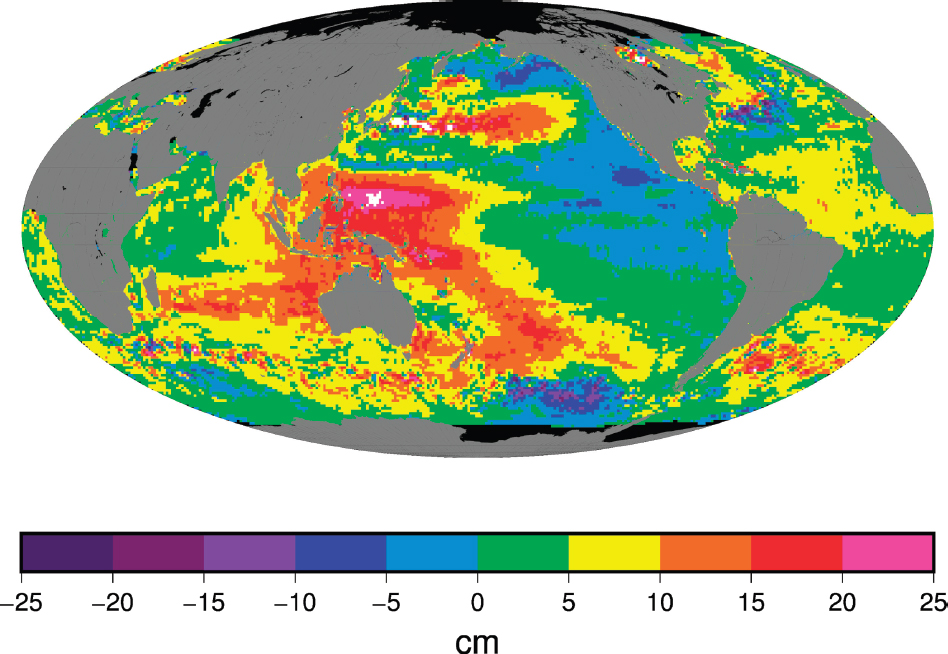
Sea Level and Global Redistribution of Water and Mass
One of the most important discoveries over the past two decades is that sea-level rise is highly variable around Earth, with some regions (e.g., the Western Pacific) rising rapidly and some regions (e.g., parts of the Eastern and South Pacific) actually falling (Figure 10.5). Moreover, sea-level rise along the coast also depends on vertical land motion owing to tectonics, sediment compaction, extraction of groundwater and hydrocarbons, and the rebound of the solid Earth in response to ice unloading, as well as to reduced gravitational pull owing to ice-sheet melting (Milne and Mitrovica, 2008). Unraveling the complex interactions of the solid earth, the cryosphere, and the oceans has been enabled through a combination of space- and ground-based measurements, including (1) satellite radar altimetry to measure ocean volume change; (2) laser altimetry to measure ice-volume change; (3) temporal variations in gravity (e.g., GRACE) to measure the redistribution of the mass of water (solid and liquid) over the surface of the planet; and (4) GPS to measure the viscoelastic rebound of the solid earth (Lange et al., 2014).
Bare-Earth Topography
The shape of Earth’s surface (i.e., its topography: gradient, relief, curvature, convergence) is a catalyst for numerous surface processes, including water and sediment routing, landslide initiation, coastal inundation, and ice-sheet dynamics. Topographic data, like those revealing fault displacements or changes caused by volcanic eruptions, illuminate active tectonic processes and serve as a base upon which many other geophysical measures depend (e.g., InSAR; Pritchard et al., 2004). Over the past two decades increasingly higher resolution digital topography has transformed understanding of controls on the topographic structure of the planet (e.g., Kirby and Whipple, 2012), the way in which watersheds change shape over time (e.g., Willett et al., 2014), and the effect of anthropogenic forcing on coastal subsidence (e.g., Syvitski et al., 2007). Accurate elevation measurements in polar regions have demonstrated that elevation drops as ice-sheet flow accelerates (Pritchard et al., 2009), and have led to the discovery of complex subglacial water-drainage systems (Chu et al., 2016; Smith et al., 2009). Such discoveries depend on both reliable, high-resolution topographic data and repeated acquisitions of such data to document the pace and context of change through time.
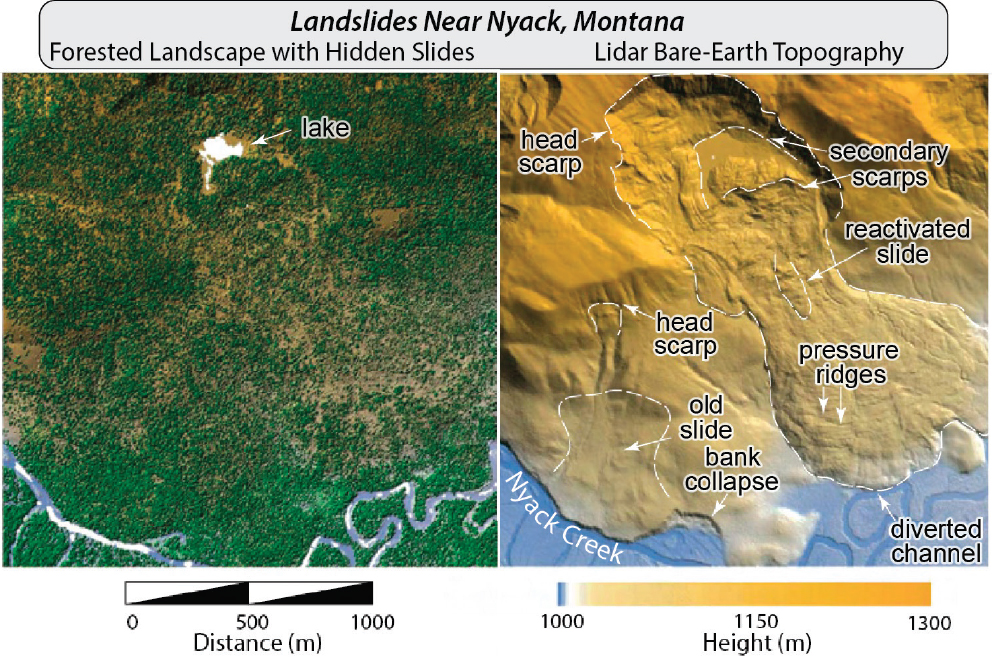
At present, 30 m gridded topographic data are available for the globe (Shuttle Radar Topography Mission [SRTM], ASTER). TerraSAR-X Add-on for Digital Elevation Measurement (TanDEM-X) is providing 12 m topographic resolution (global coverage, but limited access), and DigitalGlobe is currently releasing 2-5 m resolution topography. Many of the digital elevation models (DEMs) built from these data have a common shortcoming in vegetated regions: the “topography” commonly more closely mimics the average canopy height than the actual bare-earth surface. Hence, the gravitational stresses at the ground surface owing to the actual surface slopes remain unknown. Airborne lidar can penetrate to the actual ground surface and also measure vegetative (carbon) mass above the ground. It also offers higher resolution than space-based systems—typically, 1 m or smaller. Data collected from airborne lidar have led to the discovery of major fault systems and previously unknown large landslides (Haugerud et al., 2003; Figures 4.9 and 10.6). These data have also illuminated details of surface processes at submeter scales, documented controls on landscape thresholds (e.g., the triggers for gully formation or landslide initiation), and significantly improved quantification and modeling of numerous surface processes that sculpt Earth’s surface (Hurst et al., 2013).
Vertical Surface Deformation and Mass Change
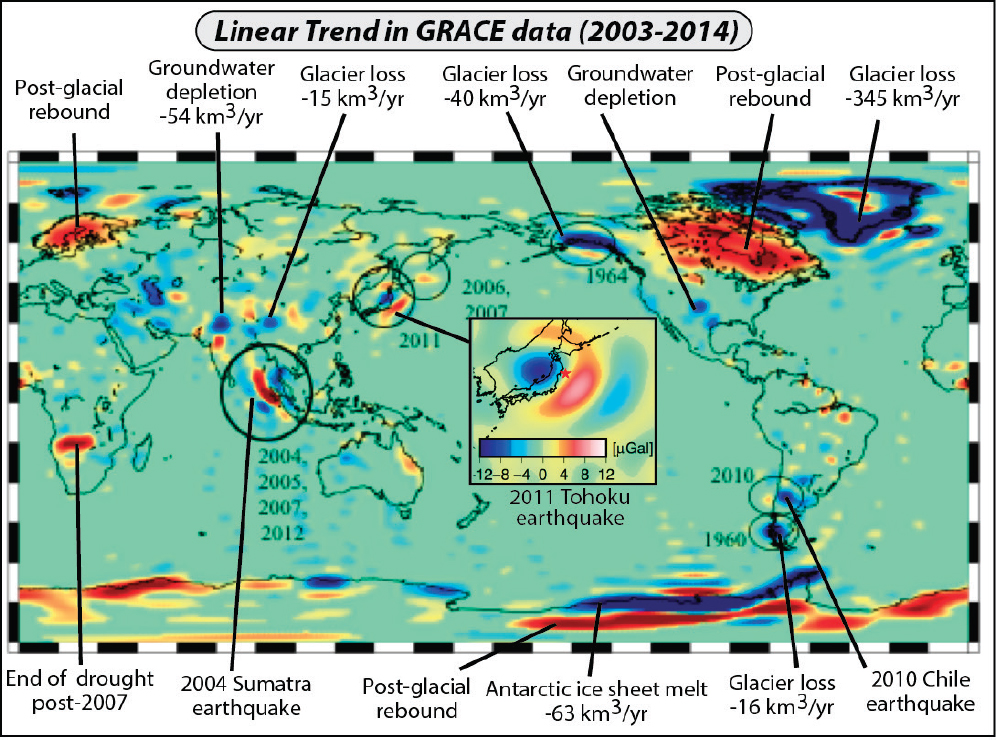
A new, global perspective on vertical land motion has emerged from the GRACE mission. For example, GRACE data have been used to estimate great earthquake (M>8) source parameters that integrate all of the short-term processes that lead to mass change spanning the coseismic and early postseismic period of days to a month (Han et al., 2013). A unique contribution of GRACE has been the measurement of postseismic gravity change, which has improved characterization of the rheological structure of Earth over a wide range of tectonic settings (e.g., Han et al., 2014). Last, GRACE measurements have provided a regional to global context to interpret the mass changes associated with groundwater depletion in deep aquifers, long-term deformation owing to the loss of ice sheets at the end of the Pleistocene, the shrinkage of many alpine glaciers and lake systems over the past 200 years, and modern ice-sheet melting on temporal scales of days to a decade (Figure 10.7).
Challenges and Opportunities
Priorities for advancing understanding of Earth’s surface and interior have been documented in recent studies (Lay et al., 2009; NRC, 2010a, 2010b; NRC, 2012a; Davis et al., 2012, 2016; NASEM, 2017). Those areas for which space-based measurements can make a significant contribution include geologic hazards and forecasts, complex interactions of the critical zone, sea-level change along coastlines, dynamics of Earth’s mantle and core, effect of water traveling underground on geologic processes, and energy and mineral resources. These topics are discussed in the following section. Here, we identify challenges and opportunities that influenced the selection and focus of these topics.
Given that more than half of Earth’s population lives within reach of major earthquakes, volcanic eruptions, or landslides, advance warning of these events could save lives and change the way society progresses. Advance warning can be within reach if sufficient repeat time of key remote sensing data is used to supplement land-based observations. Constellations offer a promising strategy in the sensor-web
approach. Such systems would integrate (1) surface deformation observations from InSAR, seismic, strain, seafloor geodetic, and GPS/Global Navigation Satellite System (GNSS) observations for earthquakes and volcanic eruptions; (2) high-resolution optical and thermal imaging for volcanic eruptions and wildfire; and (3) topography, vegetation dynamics, weather, and societal infrastructure for forecasting coastal inundation, landslides, floods, debris flows, and major erosion/deposition events. Challenges include increasing data spatial and temporal resolution, improving geolocation accuracy, upgrading download capability, and rapidly processing high-volume, rapid data flow to create high-level data products (e.g., maps). Placing these data products in the hands of decision makers as quickly as possible is important both for anticipating and for responding to devastating events.
Merging “big data” and high-performance computing with community analysis and modeling software has the potential to improve forecasts of natural disasters. For example, advances in experimental and computational models for volcanic processes, combined with enhanced monitoring (e.g., global InSAR data with a repeat time of a few days, spatially and temporally enhanced remote sensing of gas emissions, and ground-monitoring data), would enable model-based forecasting—a paradigm shift for volcano science (NASEM, 2017).
The availability of higher resolution remote sensing data will help drive advances in a wide range of applications. For example, as a result of unconventional hydrocarbon production, Oklahoma has had a higher rate of small to moderate earthquakes than California over the past few years. To understand the mechanics of inducing earthquakes, direct measurement of the ground deformation accompanying both oil and gas production, as well as wastewater injection, is needed. Because industrial activity covers vast tracts and is continually changing, high-resolution satellite measurements (e.g., InSAR and imagery) provide a key tool to monitor activity, identify the triggering process, and manage the induced earthquakes.
Novel insights can be gained from innovative analyses of existing data. For example, vertical positioning data from GPS/GNSS can be used to monitor water changes caused by snowpack, soil moisture, and groundwater variations, whereas reflected signals from GPS/GNSS can be used to estimate soil moisture, snow depth, snow-water equivalent, vegetation, firn density, permafrost changes, and sea level (Box 10.1). Such surface reflections could be particularly valuable for providing inexpensive in situ data on the cryosphere, as well as validation data for spaceborne sensors such as Ice, Cloud, and Land Elevation Satellite-2 (ICESat2), NISAR, and Surface Water and Ocean Topography (SWOT). At present, however, few of these capabilities are exploited using existing GPS networks.
New sensors are needed to achieve the key goals of higher resolution, shorter temporal spacing, and improved accuracy. In particular, applications that require topography would benefit from multibeam, space-based lidar to obtain global coverage of bare-earth topography and of the biomass/canopy at <<5 m spatial and 0.1 m vertical resolutions. Such a capability could substantially reduce the need for directed aircraft surveys. A low-cost InSAR capability with multidecadal duration and the ability to revisit anywhere on Earth within a few days would be invaluable for responding to and monitoring natural hazards and for resolving rapid motion, such as surging glaciers, creep events on faults, temporally persistent landslides, reservoir filling and overtopping, or ice-shelf disintegration. Low-cost hyperspectral imaging sensors with spatial resolution at the sub-50 m scale and revisit times approaching 3-5 days would both continue the multidecadal Landsat record and, more importantly, improve Landsat’s detection and mapping capability. Such a system would allow the capture of higher frequency geological/ecological processes and improve the response to natural disasters. A critical element for all of these is the infrastructure for downloading and processing ever-increasing data streams.
Some useful high-resolution data, especially topography and imagery, collected by private companies or other countries are commonly not available or affordable. For example, scientists have only limited access to 12 m topographic data collected by TanDEM-X, a German mission. If the National Aeronautics and
Space Administration (NASA) cannot gain access to these data for the research community, a TanDEM-like follow-on mission could be important to achieve the needed accuracy and resolution. Likewise, most high-resolution (<2 m) optical imagery is being provided by the commercial sector. Rather than developing this capability, NASA and the U.S. Geological Survey (USGS) could negotiate data agreements with the National Geospatial-Intelligence Agency (NGA) to satisfy research objectives. Such agreements will need to include specific requirements for subpixel geolocation accuracy.
Given cost considerations, miniaturization using CubeSats, SmallSats, and satellite constellations could be an efficient pathway to technological development. Particularly promising are (1) a miniaturized time-variable gravity mission with higher spatial resolution (100-150 km or less) that can reduce the aliasing of the measurements that results from high-frequency (<10 days) atmospheric, oceanic, or hydrospheric mass variations; and (2) miniaturized vector magnetometry systems with sufficient accuracy and cadence to separate time variations in the internal field from those in the external field.
Last, a key challenge is maintaining an accurate global terrestrial reference frame—one that provides the essential framework for positioning scientific satellites and aircraft, and also underpins our modern technology and commerce infrastructure. Maintaining the reference frame to a positional accuracy of 1 mm and a rate accuracy of 0.1 mm/yr requires NASA’s continued participation and support of VLBI and SLR for defining the terrestrial reference frame and its changes with time, and for monitoring Earth rotation (Davis et al., 2016). It also requires support for the GPS/GNSS global tracking network and maintenance of the software. The challenge is fivefold: (1) maintaining global participation and funding support with other agencies/countries; (2) increasing capacity; (3) lowering cost; (4) upgrading older sites (some VLBI/SLR instruments are more than 30 years old): and (5) improving real-time capabilities for GPS/GNSS.
PRIORITIZED SCIENCE OBJECTIVES AND ENABLING MEASUREMENTS
This section describes the panel’s science questions, objectives, and measurements, which are summarized in the Science and Applications Traceability Matrix in Appendix B.
Science Questions and Objectives
Question S-1: How can large-scale geological hazards be accurately forecast in a societally relevant time frame?
Over the past century and, in particular, over the past decade, geological disasters—earthquakes, tsunamis, volcanic eruptions, and landslides—have taken a deadly and costly toll on society. For example, the 2004 M9.2 megathrust earthquake in Sumatra produced a tsunami that killed more than 230,000 people in coastal areas surrounding the Indian Ocean. The 2010 Eyjafjallajökull volcanic eruption in Iceland shut down air traffic in Northern Europe, causing an estimated $5 billion loss to the global economy. The 2011 M9.0 Tohoku earthquake and tsunami in Japan (see Figure 10.1) was the costliest natural disaster in world history ($309 billion) and also transformed our understanding of the safety of coastal nuclear power generation. Threats of this scale in the United States occur in the Pacific Northwest (last major earthquake in 1700 and last major volcanic eruption in 1980), Alaska-Aleutian subduction zones (last great [M9.2] earthquake in 1964), and San Andreas Fault system (last major earthquakes in 1857 and 1906).
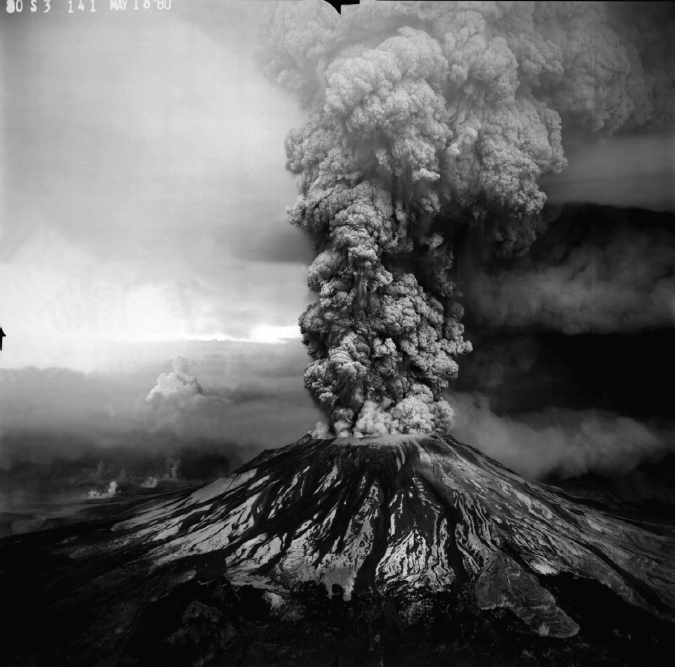
Accurate forecasts of the types of events and their timing can reduce adverse impacts on life and property. However, such forecasts remain a major scientific challenge. Some volcanoes erupt with little to no warning, whereas others produce months of interpretable precursors (e.g., NASEM, 2017). For example, the 1980 Mount St. Helens eruption (Figure 10.8) was preceded by 2 months of earthquakes, volcanic steam
releases, and large-scale surface deformation, which enabled warnings and limited evacuations (Lipman and Mullineaux, 1981), although the timing, directionality, and scale of the eruption was not anticipated. Some catastrophic landslides are triggered by seismic shaking or huge storms, whereas as others lack clear triggers. The M9.0 Tohoku earthquake and a number of other recent large events were preceded by a sequence of seismic and aseismic precursors, but short-term forecasts of earthquakes are not yet in reach. Progress will be made by continuously observing areas prone to earthquakes, volcanic eruptions, or landslides. A broad array of processes need to be observed to successfully capture events. Advances from the last decade of space-based measurements suggest that scientists are on the verge of a breakthrough in natural hazards research if a strategic set of observations are taken now.
Objective S-1a: Measure the pre-, syn- and posteruption surface deformation and products of Earth’s entire active land volcano inventory with a time scale of days to weeks.
- Priority—Most Important: Volcanic eruptions are likely to pose an increasing threat as more people move to coasts along subduction zones, where most volcanoes occur. A combination of ground-based and space-based observations are needed to monitor volcanoes and forecast eruptions. Space-based observations provide a means to collect data on all volcanoes, and may be the only practical avenue for collecting data in remote or dangerous areas. Systematic monitoring has led to accurate forecasts of the timing and duration of some eruptions.
- Relevant quantities: Three quantities need to be measured and monitored. The first is the changing shape of the volcano measured using InSAR. Expansion or contraction of the summit region provides an estimate of the changing magma supply volume and depth beneath the volcano, and larger
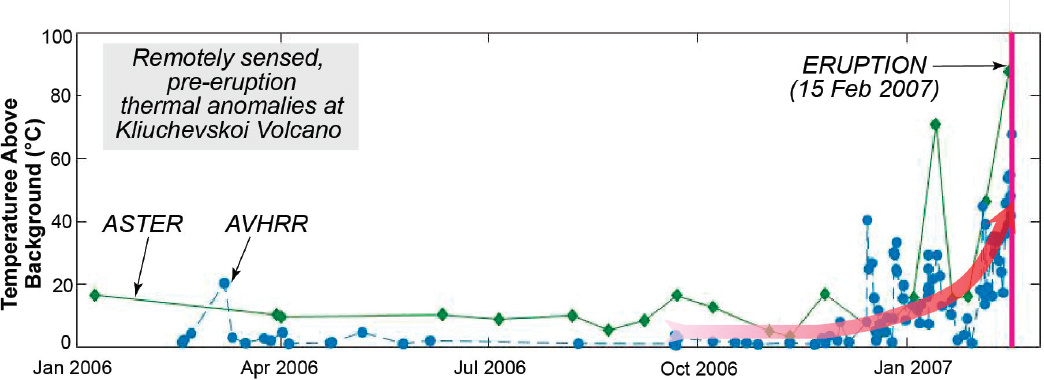
- scale deformation is linked to deeper magma supply. The second quantity is the composition and quantity of the gas emitted prior to and during an eruption as well as the composition of any ash, which provide insight into the drivers and intensity of eruptions. Hyperspectral UV, near infrared, and TIR data are used to measure SO2, H2S, CO2, and ash emissions; and spaceborne lidar and radar are used to estimate plume altitude. The third is the temperature of the ground/lake surfaces to observe shallower changes as the magma reaches the uppermost plumbing system prior to an eruption. Thermal measurements are made using multi- to hyperspectral data spanning the visible to shortwave infrared (VSWIR) and TIR region, depending on the temperature of the surface, but high-quality TIR data are critical for detecting the small-scale temperature changes of the surface leading up to an eruption (Figure 10.9).
- Length and time scales over which responses should be quantified: Changes in SO2, CO2, and other gas emission rates (e.g., Carn et al., 2016) and in ground temperature (Figure 10.9) have been detected from space weeks to months prior to an eruption. Variations in these parameters occur at a much higher frequency as the eruption proceeds, and require much improved temporal observations (e.g., minutes) at spatial scales small enough to enable modeling. Detectable changes in volcano shape, gas emissions, and thermal output prior to a new eruption event occur over time scales ranging from months to minutes. The relevant length scales are 10 m to 200 km for surface and plume measurements, with most shape changes occurring over length scales greater than 1 km. The necessary vertical precision (1-10 mm) and the temporal frequency need to be adjusted to match the activity of a particular volcano. High-repeat/temporal frequency (e.g., hours to days) image-derived/compositional analysis is critical to capture transient behavior in an ongoing eruption and to model the vent-scale processes.
Objective S-1b: Measure and forecast interseismic, preseismic, coseismic, and postseismic activity over tectonically active areas on time scales ranging from hours to decades.
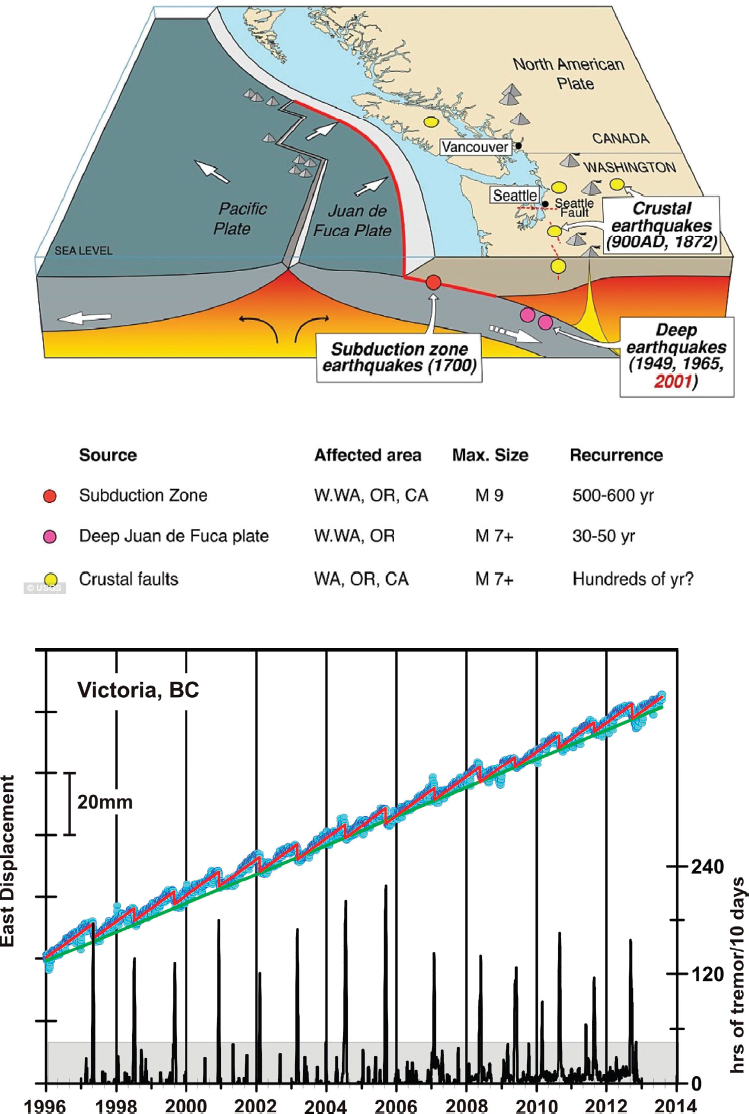
- Priority—Most Important: GPS measurements of surface deformation reveal that earthquake cycles contain much richer behavior than previously thought. For example, the Cascadia subduction zone fault is accumulating elastic energy that will eventually be released in a catastrophic earthquake offshore Washington and Oregon (Figure 10.10). Over the past decade space-based measurements have revealed that this steady strain accumulation is punctuated by creep events that occur at the down-dip limit of the locked fault. Similar transient slip behavior has been observed at most megathrust earthquake zones globally, as well as around the locked zones of the San Andreas fault system. Measuring the details of these transients over time scales of days and years may provide insight into the physics of the earthquake cycle and ultimately support forecasts of the timing of a major rupture on socially relevant time scales.
- Relevant quantities: Four main types of measurements are needed. The first is related to the interseismic crustal deformation surrounding a locked fault. InSAR and GPS measurements will reveal the rate of stress accumulation that will be released by future earthquakes. The length of time since the last rupture multiplied by the rate of interseismic crustal deformation can be used to assess the magnitude and probability of the occurrence of earthquakes. Terrestrial measurements from seismometers and GPS will provide the high temporal sampling needed to observe co- and postseismic deformation and ground shaking. Space-based InSAR and high-resolution optical imagery will provide the high spatial resolution needed to observe the near-fault co- and postseismic deformation. For very large earthquakes, temporal variations in gravity can reveal large-scale offshore deformation not observable by other methods. Last, high-resolution bare-earth topography along areas of surface rupture can be used with surface dating methods to decipher the rupture history of a fault over many earthquake cycles.
- Length and time scales over which responses should be quantified: Surface deformation associated with the earthquake cycle occurs over spatial scales ranging from meters to thousands of kilometers and time scales ranging from seconds to thousands of years. The relevant deformation scales observable from spaceborne radar interferometry range from 10 m to 1000 km. Interseismic motion needs to be measured to a precision of 1 mm/yr over lengths scales of 10 m to 100 km. Particularly critical are measurements of slow slip events (e.g., Figure 10.10) at resolution of 1 mm/week over scale of tens of kilometers. Co- and postseismic processes require frequent acquisitions (12 days or shorter) over seismically active areas. High-resolution bare-earth topography needs to be measured only once before an event at 5 m spatial resolution and 1 m vertical accuracy for topographic correction of interferograms as well as for paleoseismic studies. Investigation of near-fault coseismic processes requires optical or SAR measurements of surface fractures at a spatial resolution of ~1-10 m from satellites or aircraft.
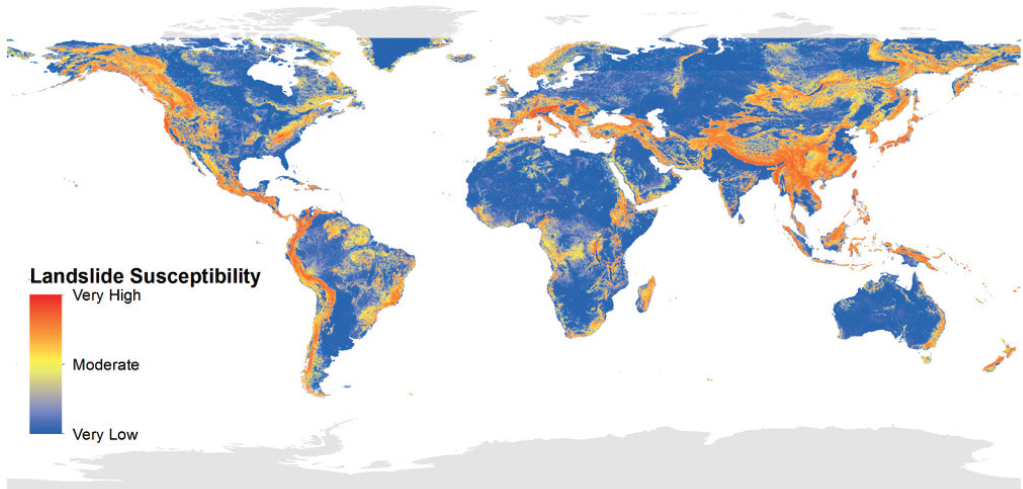
Objective S-1c: Forecast and monitor landslides, especially those near population centers.
- Priority—Very Important: Landslides typically affect fewer people than large-scale volcanic eruptions and earthquakes, yet they regularly cost lives and disrupt economies. Sudden landslides can be triggered by heavy precipitation, earthquakes, or volcanic eruptions. Steep slopes are the most important factor in making an area susceptible to landslides, but other key factors include recent rainfall or wildfire, seismicity and the presence of nearby faults, the strength of bedrock and soils, deforestation, and the presence of roads. Landslide susceptibility has been mapped using space-based data (Figure 10.11), and an online tool, Landslide Hazard Assessment Model for Situational Awareness, has been developed that identifies areas with high or moderate landslide probability every 30 minutes based on the preceding 7 days of precipitation using the Global Precipitation
- Measurement estimates. An important objective is to detect and monitor slow-moving landslides and to shorten forecasts of sudden collapse events (e.g., rapidly moving slides) in order to warn and evacuate local populations.
- Relevant quantities: The important quantities to be measured are high-resolution, bare-earth topography; land-surface deformation; precipitation; and permafrost melt, combined with hyperspectral imaging of vegetation and rock/soil composition to improve and augment existing high spatial resolution land-cover data.
- Length and time scales over which responses should be quantified: The relevant length scales range from meters to tens of km, and time scales range from seconds to years. High-resolution, bare-earth topography at 1-5 m spatial resolution and 0.1 m vertical precision is needed over all potential landslide areas to establish a baseline. Subsequently, more frequently acquired data are required prior to a suspected slide event and then following its occurrence. Land-surface deformation is needed at better than 50 m spatial resolution, and 1 mm/yr precision at a better than seasonal cadence for slow-moving landslides. Hyperspectral imaging in the VSWIR and TIR regions at ~30 m spatial scale and ~weekly time scale is required to map land-cover composition and changes. High spatial resolution images from commercial sources are ideal for linking topography to land cover and eventually for mapping composition from space.
Objective S-1d: Forecast, model, and measure tsunami generation, propagation, and run-up for major seafloor events.
- Priority—Important: Tsunamis are one of the most destructive hazards on Earth, yet satellites are only peripheral in monitoring their generation and propagation. Mapping ionospheric waves has recently provided some limited information on tsunami propagation. Improved models of the shape of the seafloor as well as high-resolution coastal topography are critically needed to improve modeling of tsunami run-up and its impact on coastal populations. The topography of the deep ocean floor (>1,000 m) affects the overall velocity, focusing, and amplitude of the wave as it propagates across an ocean basin. The detailed topography of the shallow ocean floor (<1,000 m) and coastal areas affects the velocity, amplitude, and inundation of the wave as it flows over the land.
-
Relevant quantities: Key measurements are in situ seismicity, ground deformation via GPS, and seafloor pressure changes. The most important contribution from a space or aircraft mission is high-resolution (1 m spatial and 0.1 m vertical), bare-earth topography and bathymetry of coastal areas, which requires aircraft-based lidar and improved seafloor mapping. The large-scale bathymetry of the deep oceans is provided by sparse ship soundings (17 percent of the seafloor is mapped at <1 km resolution) and dense satellite altimeter measurements of the gravity field associated with seafloor bathymetry (83 percent of the seafloor is mapped at 6 km spatial resolution). New swath altimetry technology, such as the planned SWOT mission, could dramatically increase the accuracy and resolution of the global bathymetry.
Satellite altimetry profiles can also provide open-ocean measurements of the tsunami wave that are important for modeling source and propagation effects. Similarly, high spatial resolution measurements of the total electron content of the ionosphere provide a means to indirectly map tsunamis. To provide useful results, the altimeter or GPS array has to be in the right place at the right time.
- Length and time scales over which responses should be quantified: The bathymetry and topography only need to be measured once, followed by repeat measurements after a significant change.
Linkages of S-1 Objectives to Other Panels and Integrating Themes
Extreme events like volcanic eruptions, earthquakes, tsunamis, and large landslides can have spatially extensive consequences on hydrology, ecology, weather, climate, and human habitability. Such events commonly damage or destroy infrastructure, disrupt ecological patterns, rearrange drainage networks, and abruptly alter the biogeochemistry, nutrient fluxes, water budget, and energy balance in affected areas. Hence, they bridge numerous integrating themes and panel objectives. Volcanic eruptions spread ash and nutrients that impact local ecology (Ecology Objective E-2c) and alter both water (Hydrology Objective H-3b) and air quality. Directed volcanic blasts and effusive eruptions can cause localized but catastrophic ecological change (Ecology Objective E-5b) and widespread infrastructure damage. At scales of weeks to months, large, persistent volcanic eruptions affect local weather and precipitation patterns (Climate Objectives C-5a, C-5d, and C-7b; Weather Objectives W-5a and W-6a). At scales of minutes, earthquakes, tsunamis, and landslides abruptly and, typically, nonreversibly alter landscapes, ecological communities, hydrologic systems, and both energy and nutrient fluxes. All of these “extreme events” commonly have large impacts on nearby communities and infrastructure, and potentially affect distant sites (e.g., as volcanic plumes intercept airline routes). The panel’s forecasting emphasis for these extreme events relies in part on identifying thresholds or triggers related to other panels’ objectives: exceedance thresholds for rainfall that trigger landslides; particulate fluxes from volcanos that effectively alter weather or climate patterns and nutrient availability; scales of landslides or volcanic eruptions that significantly disrupt local ecology or hydrology; and coastal and shallow-marine topography that, when combined with seafloor earthquake ruptures, determines tsunami impacts on coastal ecology, hydrology, and infrastructure.
Question S-2: How do geological disasters directly impact the Earth system and society following an event?
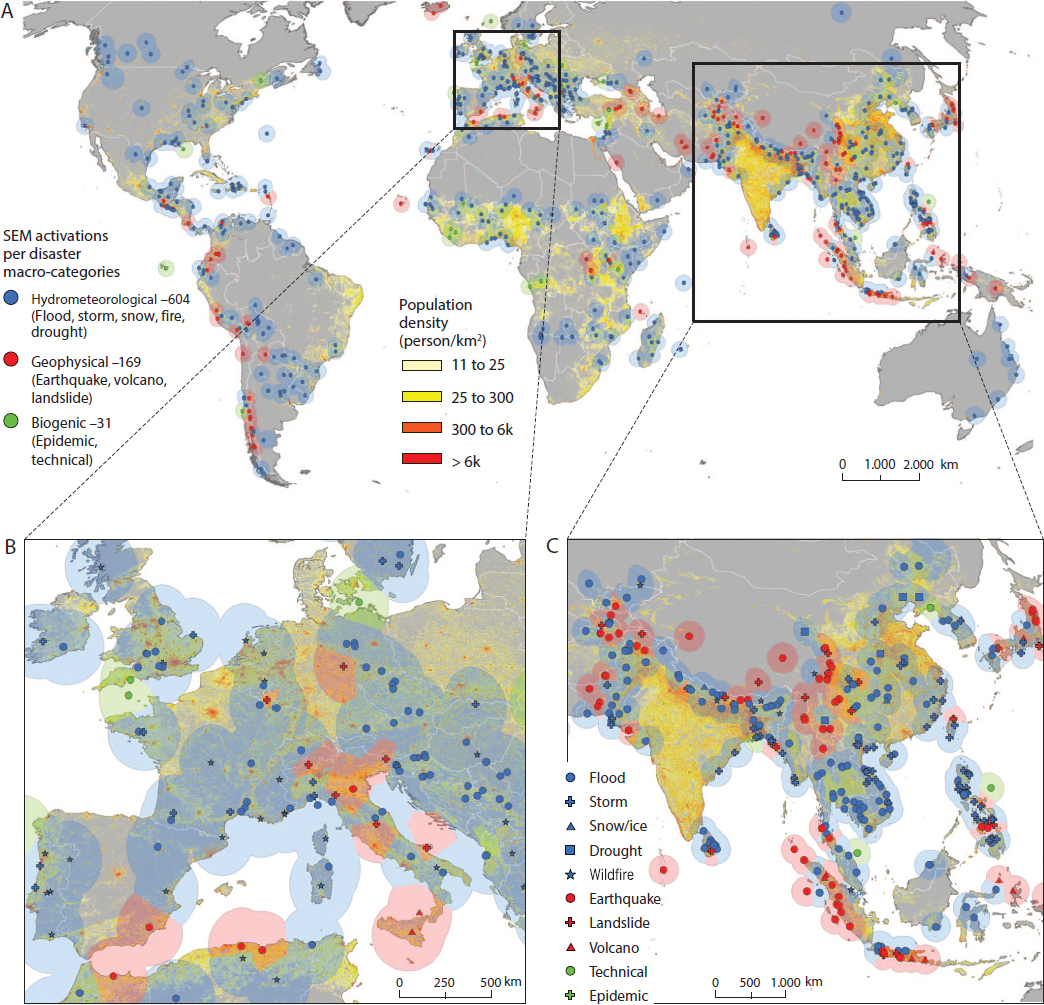
Large geological disasters, such as those discussed earlier, can have major impacts on the Earth system and society. Satellites can see affected areas and collect data at spatial scales needed to assess the impacts during and following a disaster, but only if relevant assets are deployed in a timely manner. Examples of satellite-based emergency mapping of hydrometeorological, geophysical, and biologic disasters are shown in Figure 10.12.
Objective S-2a: Rapidly capture the transient processes following disasters for improved predictive modeling, as well as response and mitigation through optimal retasking and analysis of space data.
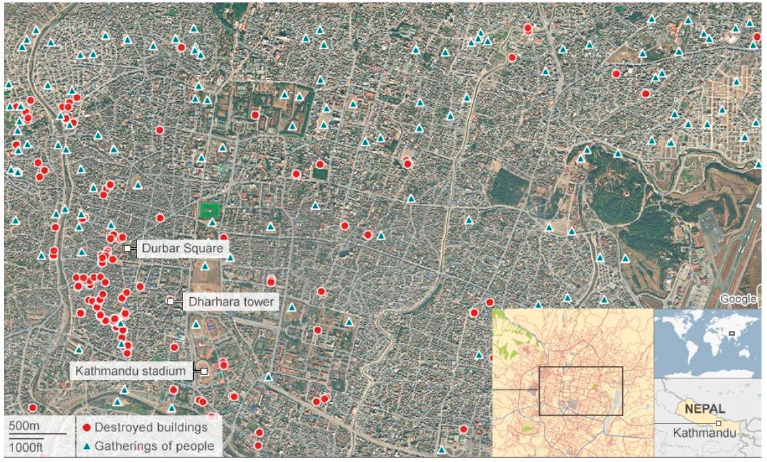
- Priority—Most Important: Rapid capture and delivery of synoptic data by spaceborne assets following a disaster can directly mitigate the loss of life and infrastructure. These data can be obtained by rapidly retasking existing satellites, deploying new satellites dedicated to a specific measurement objective, or by deploying a constellation of future satellites that provide the temporal fidelity required. The International Charter “Space and Natural Disasters” was developed by space-faring nations to reschedule their satellites to observe regions struck by a disaster and to deliver those data to the decision makers in that region. An example of the international response to the 2015 earthquakes and landslides in Nepal is shown in Figure 10.13.
- Relevant quantities: The relevant quantities are largely defined by the disaster and available space assets. High-resolution optical (<5 m) and SAR (<30 m) image data can provide information on the magnitude and extent of damage in the affected areas. Repeated InSAR and high-resolution optical data can provide information on both the magnitude of the ground motion and the decorrelated regions where a majority of the infrastructure may be damaged. Hyperspectral UV through TIR data are especially valuable for monitoring ongoing changes in the temperature, composition, and extent of erupted volcanic materials, including gases, as well as constraining forecasts of the duration of the activity. High-resolution topography enables quantified assessments of landscape change owing to erosion, deposition, and vegetation disturbance. An important objective for all of these data is the rapid dissemination of higher level products to local emergency responders and the global scientific community.
- Length and time scales over which responses should be quantified: The scales are dictated by the extent and duration of the disaster. Inundation from flooding (or tsunamis) and the associated erosion/deposition can persist for days to weeks. In the case of the 2015 Nepal earthquakes (see Figure 10.2), satellite remote sensing information was most valuable when delivered to the remote mountainous areas in hours to days (Figure 10.13). However, the threats from additional large aftershocks may persist for months to years following an event. Volcanic eruptions and their secondary hazards (e.g., lahars, remobilization of ash) can last hours to decades.
Objective S-2b: Assess surface deformation (<10 mm), extent of surface change (<100 m spatial resolution) and atmospheric contamination, and the composition and temperature of volcanic products following a volcanic eruption (hourly to daily temporal sampling).
- Priority—Very Important: Active volcanoes can erupt intermittently or continuously for decades or more. Consequently, ongoing data collection is required to determine whether the eruption is waning, increasing, or transitioning to a new phase. These synoptic data of the estimated 1,500
- active volcanoes around the world can be provided only by spaceborne assets, most critically for those that lie in remote locations and in poorer countries. For example, the 2012-2013 eruption at Tolbachik Volcano in Kamchatka (Russia) triggered a response in the Earth Observing Mission-1 (EO-1) and ASTER sensor webs and led to the acquisition of high spatial resolution image data for the next 6 months of the eruption. Heat flow measured in the SWIR and TIR during the development of one of the largest lava flow fields in the last 50 years, combined with digital elevation models, constrained models of future lava flows.
- Relevant quantities: The primary quantities are land-surface deformation; volume, composition and temperature of the eruptive products, including gases (especially SO2 and CO2); and mass and energy fluxes across the solid earth/atmospheric boundary. Changes in the color of volcanic lakes and the health of nearby ecosystems over time can signal changes in the flux or species of degassing, which are critical to detect both prior to and following an eruption.
- Length and time scales over which responses should be quantified: The data scales (spatial, spectral, temporal) and wavelength region required are directly related to the measured volcanic property. Volcanoes with persistent plumes and those in persistently cloudy regions are best imaged by SAR backscatter data at spatial scales ~30 m or better, which can provide ongoing observations of changes in the active vent and erupted lava. UV, VSWIR, and TIR multi- to hyperspectral data observations (both day and night) at ~30 m or better are effective in regions with less cloud cover, and measure the heat flow and abundance of gas in the column, the composition and particle size of ash in persistent and passive plumes, as well as the land cover and ecosystem changes near the volcano. Consis-
- tent measurements at time scales no longer than 1-3 days throughout the posteruption period are required. Data acquired at even higher frequencies are essential for hazard mitigation (e.g., aircraft interactions with drifting ash clouds, lava/ash flow inundation) and also enable modeling of higher frequency processes, such as changes in lava and gas production, which are directly linked to the underlying magmatic system driving the eruptive activity. Repeat pass InSAR data at spatial scales ~30 m or better and time scales of 1-2 weeks are critical for measuring the inflation or deflation in the volcanic edifice following the eruption, which can signal new or renewed activity. Such data have been used to measure changes in the eruptive products over time (e.g., the cooling deflation of a lava flow), with the decorrelated areas indicating the location of newly emplaced products. To maximize their utility to society, all of these space-based observations need to be rapidly downlinked following acquisition.
Objective S-2c: Assess co- and postseismic ground deformation (spatial resolution of 100 m and an accuracy of 10 mm) and damage to infrastructure following an earthquake.
- Priority—Very Important: Monitoring the ground motion following a large earthquake would improve understanding of how the crust accommodates the stresses imposed through a combination of continued slip on faults, viscoelastic relaxation, and flow of crustal fluids. Identifying the correct mechanism for relaxation is critical for understanding how a fault heals and prepares for the next event. Coseismic models based on GPS, InSAR, seismic waves, and high-resolution optical imagery are used to estimate the immediate change in crustal stress surrounding the rupture zone. Frequent and accurate measurements of postseismic deformation will reveal the rheological properties of the crust and upper mantle. More importantly, measuring the evolution of the deformation after an earthquake provides a window into stress increases on surrounding faults. High spatial resolution optical difference maps as well as InSAR decorrelation maps can be used to identify areas of destroyed infrastructure associated with coseismic events.
- Relevant quantities: The relevant quantities to be measured are similar to the quantities need for Objective S-1b. These are crustal deformation surrounding the fault from InSAR, seismometers, and GPS; temporal variations in gravity, which can reveal large-scale offshore deformation not observable by other methods; and high-resolution, bare-earth topography, which can reveal the repeated deformations over many earthquake cycles.
- Length and time scales over which responses should be quantified: Postseismic processes are strongest immediately following an earthquake and typically decay logarithmically with time. In the first days to weeks following a rupture, the near-field (ideally <100 km from the fault plane) crustal deformation measurements will need to be acquired continuously with ground GPS and at least weekly with InSAR from at least two look directions. Over the time period of 6 months to 10 years following a major rupture, far-field (100-500 km from the fault) and synoptic gravity measurements become more important for monitoring viscoelastic processes.
Linkages of S-2 Objectives to Other Panels and Integrating Themes
Responses to disruptive, extreme geological events like earthquakes or volcanic eruptions require both rapid quantification of event characteristics and timely dissemination of those data. Efficient and accurate observation and prompt communication are critical ingredients underpinning effective societal responses. Weather forecasters, climate modelers, and air-traffic controllers improve their predictions by incorporating fluxes of volcanic gases and aerosols into their models (Weather Objectives W-5a and W-6a). The same space-based sensors for aerosols and gasses are proposed by the Climate Panel and this
panel. Accurate forecasts of intense storms (Weather Objectives W-2a and W-4a) improve preparedness and response for landslides, flooding, and hillslope, river, and coastal erosion. Holistic assessment of the effects of earthquakes, volcanic eruptions, or tsunamis (e.g., spatial extent and character of infrastructure damage; fragility of residual infrastructure; landslide size, spatial frequency, and characteristics of affected slopes, ecology, and hydrology; and inundation or dam failures) enables effective emergency responses to these extreme events. Topographic characteristics, coupled with better understanding of long-term, ongoing ecological and hydrological change (Ecology Objectives E-1b and E-1d; Hydrology Question H-4), enables improved prediction of the impact of extreme events, including estimates of hillslope stability, vulnerability to erosion, and both estimation and development of mitigation strategies for fluxes of sediment, water, and contaminants.
Question S-3: How will local sea level change along coastlines around the world in the next decade to century?
Over Earth’s history, sea level has fallen during glacial periods, when seawater is transferred to the continents and stored as ice, and risen during intervals of warm global temperatures (interglacial periods). During the last Glacial Maximum (26,000 years ago), sea level was approximately 125 m lower than it is today (Peltier and Fairbanks, 2006). During one of the warmest periods in Earth’s history (100 million years ago), the North American continent was split by a vast seaway created by a combination of sea-level rise and tectonically induced subsidence. Global sea level has risen an average of 1.7 mm/yr over the past century, and 3.2 mm/yr from 1993 to 2010 (Church et al., 2013). Sea-level rise over the next several decades is a major concern for society at large. Whereas the coastal zone represents just 2 percent of Earth’s total land area, it generates more than 10 percent of the world’s gross domestic product, and ~600 million people are coastal dwellers. Even moderate sea-level rise over the next century will lead to significant increases in coastal flooding and storm surge, as well as saltwater intrusion into aquifers.
Although a number of missions measuring aspects of sea-level rise are flying or are in development (e.g., Jason-3, SWOT, GRACE-FO, ICESat-2), several important geophysical observables are not being adequately measured. These include observations of (1) vertical land motion, (2) ice-sheet and glacier-surface melt (the first-order product of the warming atmosphere), and (3) the location and properties of the base of the ice sheet (i.e., bedrock topography and seawater intrusion). Lack of knowledge of these important parameters continues to hamper our ability to project future sea-level rise.
Objective S-3a: Quantify the rates of sea-level change and its driving processes at global, regional, and local scales, with uncertainty <0.1 mm/yr- for global mean sea-level equivalent2 and <0.5 mm/yr sea-level equivalent at resolution of 10 km.
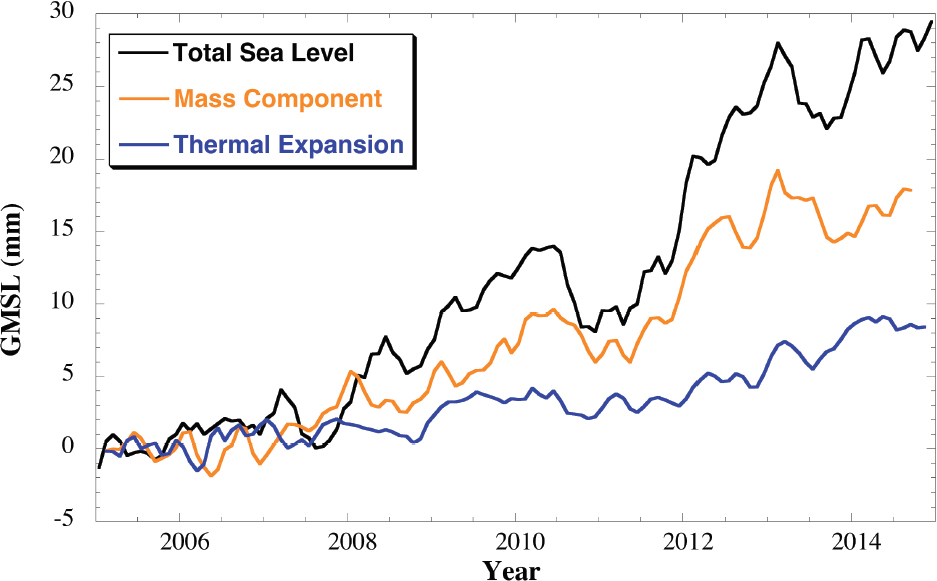
- Priority—Most Important: Sea-level change arises from a combination of ocean volume changes (thermal expansion or contraction of seawater), mass input from the cryosphere, ocean and atmosphere dynamics, gravitational changes, and vertical land motion. The global ice sheets contain the greatest potential for rapid sea-level rise in the coming decades. Over the decade from January 2005 to December 2014, ice sheets and other glaciers contributed approximately 70 percent to
___________________
2 Current altimetry missions, such as Jason-3, have a mission goal of 1 mm/yr, in order to accommodate the inherent measurement uncertainty and the effects of seasonal and interannual variations. The current uncertainty in the global mean sea-level rise rate over the last 25 years has been 0.3-0.5 mm/yr (e.g., Leuliette and Nerem, 2016; Ablain et al., 2017), with acceleration rates estimated to be 0.084±0.025 mm/yr2 (Nerem et al., 2018). As a result, the goal for future systems is to achieve an accuracy as high as 0.1-0.3 mm/yr, with differing opinions among experts about where it should fall in that range in order to adequately capture not only the current rates of sea-level rise but also changes in these rates.
- observed global mean sea level by increasing the mass of the ocean, and thermal expansion of seawater contributed about 30 percent (Figure 10.14). The most rapid accelerations in sea level over the last decade derive from ice sheets, particularly Greenland. Change in Antarctica has the greatest potential to cause sea-level rise in North America in the coming century. To project future sea-level rise, it is necessary to first quantify the current rate of global mean sea-level rise as well as the relative contributions of the driving processes. Achieving this objective requires both observations of the global sea-surface height and the changing ice sheets. The sea-surface height varies regionally at significantly higher rates than the global mean for periods of several years to several decades owing to changes in the winds and ocean circulation (e.g., Savage and Thatcher, 1992).
- Relevant quantities: Sea-surface height has been measured using satellite radar altimeters (e.g., TOPEX/Poseidon, Jason-1, and Jason-2) since 1993. Precise sea-surface height measurements also require geodetic-quality GPS receivers for orbits, microwave radiometers to correct for water-vapor path delays, dual frequencies for ionospheric corrections, and a stable and well-defined terrestrial reference frame (GPS, SLR, VLBI). Maintaining the global tide gage network is required to detect biases and drift.
Observations needed to understand ice-sheet contributions to sea level include ice thickness (the difference between the ice-sheet topography and the bedrock topography) for ice-sheet models, seasonal and interannual ice velocities, time-variable gravity, ice topography and its change,
-
three-dimensional (3D) surface deformation, snow density, coastal sea-level data, and surface melt. Observations of ice-sheet change needed for projections of sea-level rise include ice-surface topography measurements from satellite laser altimetry or lidar, ice velocity using both InSAR and GPS, mass estimates using both GRACE and GRACE-FO, and the basic geometry of the base of the ice sheet through airborne radar campaigns. An unresolved issue is that sea-level and ice-mass changes relative to a terrestrial reference frame are sensitive to geocenter motion, but satellite gravity measurements are not. Thus, independent measurements of geocenter, such as those obtained from SLR, are required.
- Length and time scales over which responses should be quantified: Sea surface height is measured with good precision (2 cm root mean square [RMS] accuracy at 100 km resolution). The current temporal and spatial resolution for altimetry in the deep ocean is sufficient, but improving the resolution to 10 km in coastal waters would better enable the study of dynamical sea-surface height changes, which are different in shallow, coastal waters than in the deep ocean owing to interactions with bathymetry. Measurements over ice sheets (ice thickness, ice velocity, ice topography change, surface melt) need to be made continuously over decades to detect and understand potentially rapid changes. The time sampling can be monthly (or less), and the spatial resolution will depend on the measurement objectives. The spatial resolution of ice thickness near the grounding line needs to be less than 250 m, the spatial resolution of ice-topography change needs to be better than 100 m, and the spatial resolution of ice velocity needs to be better than 250 m.
Objective S-3b: Determine vertical motion of land along coastlines at uncertainty <1 mm/yr.
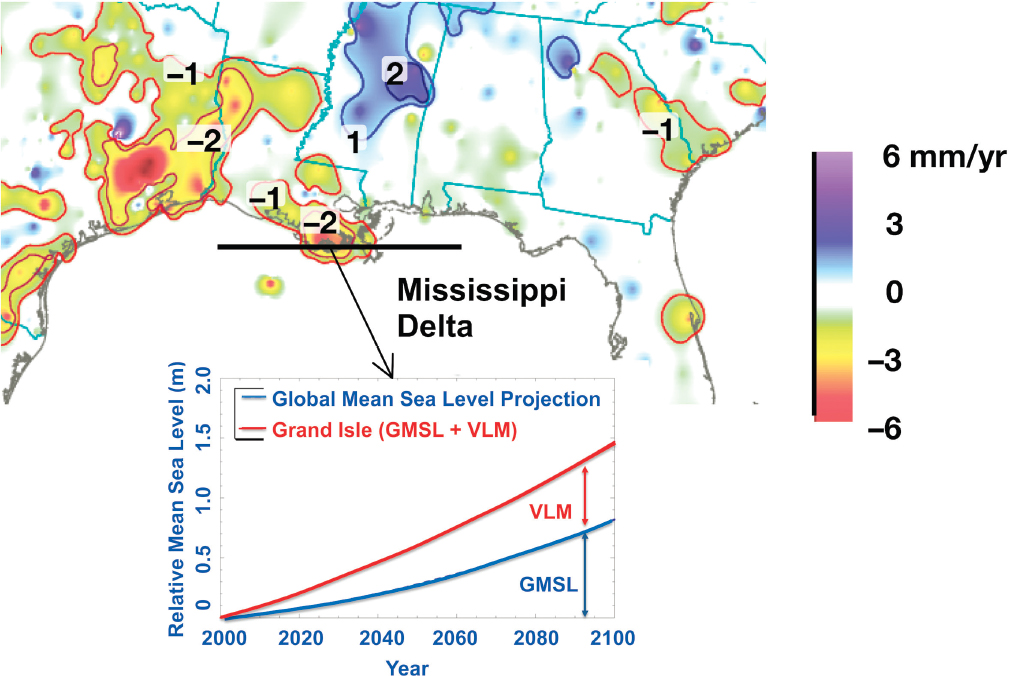
- Priority—Most Important: The influence of vertical land motion on local sea-level rise is profound but poorly constrained. Vertical land motion is driven by natural and anthropogenic processes ranging from changes in the mass load, isostatic (and nonisostatic) adjustment of the solid Earth in response to changes in loading (ice, water, sediment), sediment compaction, extraction of fluids (oil, gas, and water) from underground reservoirs, and tectonics. Currently, vertical land motion is not regularly measured in most areas. Where it has been measured, we now know that land subsidence can be more than an order of magnitude greater than sea-surface elevation changes owing to ocean mass changes and thermal expansion or contraction (Figure 10.15). Thus, in many areas of the world, land subsidence is the leading contributor to coastal sea-level rise. Conversely, coastal areas being uplifted owing to tectonics (e.g., Pacific Northwest) are experiencing a lower rate of sea-level rise than the global average (NRC, 2012b).
- Relevant quantities: The most critical measurement needed to quantify vertical land motion is land-surface deformation, typically measured with GPS, but increasingly with InSAR. Global measurements made once to produce a high-resolution (1 m horizontal, 10 cm vertical), bare-earth topography model are needed, especially for predicting inundation effects. Such global topography measurements would aid in modeling the pathway of water in future sea-level rise scenarios and storm-surge modeling.
- Length and time scales over which responses should be quantified: The processes that drive vertical land motion in many areas (water extraction, sediment compaction) are nonlinear, which means that long-term (>10 years) measurements at monthly or shorter time sampling is required. Because significant changes in vertical land motion (>15 mm/yr) occur at small scales (Figure 10.15), a spatial resolution of 10 km or better is required.
Linkages of S-3 Objectives to Other Panels and Integrating Themes
Improved quantification of the rate and cause of local and global sea-level rise or fall is closely aligned with objectives of all other panels. Ongoing, incremental coastal inundation affects both terrestrial and nearshore ecology and hydrology (Ecology Objectives E-1b, E-1d, E-2b, E-3a, E-4a, E4b, and E-5b; Hydrology Questions H-2 and H-4). The extent and thermal state of the ocean’s surface boundary layer can, for example, influence the intensity and tracks of hurricanes and typhoons (Weather Objectives W-1a, W-2a, and W-3a), as well as modulate long-term climate change (Climate Question C-1; Climate Objectives C-4a, C-4d, C-7c, and C-7d). Potential destabilization of ice sheets owing to global warming and sea-level rise would have catastrophic impacts for coastal nations, even if such an extreme event were to occur over decades. Along with local tectonics, mass loss from ice sheets and glaciers is driving localized coastal uplift and sea-level fall (or conversely, in other locations, sufficient subsidence to accelerate sea-level rise), with related impacts on both ecology and hydrology, as well as infrastructure. Ice loss is closely related to
integrating themes of water and energy budgets, and when considered at longer time scales, of extreme events. Notably maintaining and upgrading the terrestrial reference frame to achieve stringent geodetic objectives is an implicit, shared linkage among all panels.
Question S-4: What processes and interactions determine the rates of landscape change?
Earth’s landscapes serve as the interface between Earth’s interior, atmosphere, hydrosphere, cryosphere, and biosphere, and they define the habitable Earth. Landscapes facilitate mass and energy transfers among these components of the Earth system, and they are shaped by processes facilitating these transfers over a broad range of spatial and temporal scales. Over time scales ranging from decades to millions of years, processes acting to shape Earth’s landscapes play a central role in controlling atmospheric chemistry and climate (Kump et al., 2000), modulating crustal deformation in active mountain belts (Molnar and England, 1990; Willett, 1999), and shaping and filling the sedimentary basins that host water and hydrocarbon resources (DeCelles and Giles, 1996). Climate changes operating over millennia alter the distribution of ice and the transport of sediment, which together produce long-wavelength deformation of Earth’s surface and modulate sea level (Kopp et al., 2009). Weather events commonly amplify coastal and river erosion and can trigger abrupt processes such as landsliding, which disaggregate and transport rock within landscapes and produce measurable changes in Earth’s surface (Hilley et al., 2004). Seasonal melt in or adjacent to snow- or glacier-clad mountain belts can both cause flooding and sustain agriculture during dry seasons.
Our species and the processes that shape Earth’s surface are inextricably bound to and co-evolve with one another. Modern civilization depends on the water and soil resources hosted in landscapes and is impacted by the ways in which they change, including posing risk to humans in the form of landslides, coastal erosion, and flooding (Zoback et al., 2013). The widespread and efficient expansion of human enterprises now affects many of Earth’s surface processes and resources that provide critical support for civilization. Consequently, it is in our vital interest to understand the ways in which Earth surface processes have shaped the development of the planet, operated prior to industrialization, and changed in the face of a rapidly growing population.
A promising path forward is in the progressive quantification of surface processes through the merger of theory with diverse observations of cause and effect of surface processes within landscapes. Success in this effort will help define how and why landscapes evolve, what conditions and interactions set the pace of landscape change, and what roles are played by natural and anthropogenic forcing.
Airborne and space-based observations have played a central role in advancing this understanding (Figure 10.16). For example, long-term satellite observations quantify natural changes in coastal and river erosion, hillslope stability, wildfire pathways, and ecological domains, as well as ways in which humans utilize and alter landscapes and their resources (Harris et al., 2012). Airborne imaging of the nutrient content of vegetation canopies reveals ways in which landscapes facilitate elemental transfers between rocks and the biosphere (Porder et al., 2005).
Objective S-4a: Quantify global, decadal landscape change produced by abrupt events and by continuous reshaping of Earth’s surface from surface processes, tectonics, and societal activity.
- Priority—Most Important: Enhanced understanding of the processes that change landscapes and how they relate to other elements of the Earth system requires a robust image of the landscape change itself. Hence, the magnitude of change, the processes and interactions driving change, the rates of change, and the limitations on those process rates all need to be quantified.
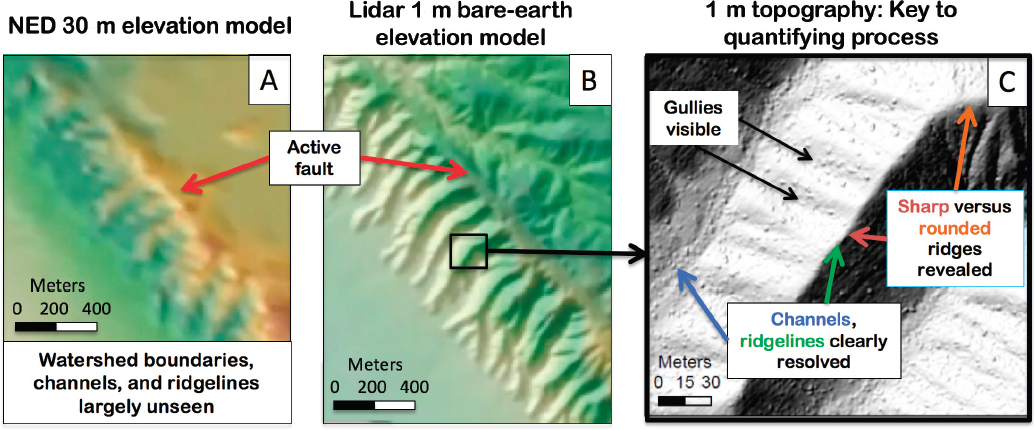
Disruption of Earth’s surface materials, as happens during landslides (Figure 10.16), may transform surface properties while changing elevations, as material is transported and deposited elsewhere or formerly buried materials are exposed at the surface. Similarly, large volcanic eruptions can mantle the terrain with fresh debris that can feed destructive lahars for decades after the eruption has ceased. In contrast, ground elevations can sometimes change without disrupting the attributes of the surface itself. In these cases, deformational processes, such as viscous creep owing to gravity acting on soils on hillslopes or poroelastic deformation that attends groundwater pressure changes, result in surface warping but not in change of its physical and chemical characteristics. Capturing quantitatively impulsive and persistent temporal processes and both modes of topographic change—in which elevation changes may or may not be accompanied by changes in slope or composition of surface materials—is necessary to ultimately understand the processes that drive landscape change.
- Relevant quantities: Earth’s landscape comprises the rock, soil, water, ice, snow, and biomass extending from the base of the vadose zone to the top of the vegetative canopy (the critical zone). A fundamental quantity for understanding global landscape change is change in the bare-earth topography, as derived from swath lidar. From such topography, attributes such as local slope, curvature, and topographic convergence or divergence can be derived and interpreted in terms of their controls on both continuous and impulsive fluxes of water and sediment through the landscape (e.g., soil creep, landslides, debris flows, and channel incision). Another important quantity is the baseline and changing composition of Earth materials, including the water and soil carbon content of the surface zone, the mineralogical composition and spatial configuration of rock and soil, the fraction
- of water that is ice, and the standing water present on Earth’s surface, all of which are relevant for quantifying the nature, rates, and processes driving changes in the character of the surface.
- Length and time scales of surface change: The scales over which landscapes change vary over orders of magnitude, depending on the process at work. Changes in ice-sheet volume and resultant crustal loads produce long-wavelength (hundreds of km) bending of the surface, and flow of deep-earth materials (e.g., subduction) alters this bending over similar length scales for tens of thousands of years following loading or unloading. In contrast, earthquakes disrupt the surface over tens of seconds at scales of centimeters to meters, but can produce permanent warping of landscapes over tens of kilometers around the fault rupture and can affect areas for hundreds of kilometers. The landslides generated by earthquakes commonly initiate during a few minutes of the shaking and cover areas of less than a few square kilometers (Figure 10.17). Accelerated channel incision at the base of a slope can take centuries to induce responses along slopes subjected to soil creep, or seconds on steep slopes subject to landslides. Floods can modify river channels and surrounding floodplains from event to event (months to years), whereas a large rainfall event can reroute the channel over days. Abrupt vegetation disturbance by fire or deforestation or gradual vegetative migration in the face of climate change commonly modify landscape stability and susceptibility to erosion during storms, seismic shaking, or other impulsive events. Overall, understanding landscape change requires a high-resolution, baseline depiction of Earth’s topographic, ecological, and compositional landscapes, as well as the ability to capture changes that occur over short time scales (days to months), particularly in areas where changes have occurred or are likely to imminently occur and in areas where humans and their infrastructure are threatened.
Objective S-4b: Quantify weather events, surface hydrology, and changes in ice/water content of near-surface materials that produce landscape change.
- Priority—Important: The primary observables for this objective would be used to understand the driving factors responsible for landscape changes. Given that quantifying landscape change itself (Objective S-4a) was deemed the highest order objective, quantification of the processes driving these changes was regarded as a vital but slightly lower priority set of observables.
- Relevant quantities: The observables needed to quantify drivers of landscape change include the spatial and temporal distribution of rainfall and snowfall, the total (and changing) amounts of rain and snow present near the landscape surface over time (drivers of root-zone and soil-moisture content), seasonal temperatures that may modulate the fraction of ice and water in the surface and subsurface, freeze-thaw cycles, and human activities (e.g., construction, excavation, or land use change) that alter hillslope character and, thus, sensitivity to precipitation and, ultimately, susceptibility to erosion.
- Length and time scales over which driving factors should be quantified: The appropriate scales of observation depend on the particular process that is interrogated. Minutes-long cloudbursts can drive hillslope failure, but so can passing a saturation threshold after a week of persistent rainfall. Both primary surface changes owing to anthropogenic land-cover change (direct human intervention) and secondary changes (natural response to human intervention) can occur over time scales of months to decades, but many of these drivers act over length scales of meters to kilometers. For example, a river channel may be reconfigured during a flood over hours or days, but the flood is produced by regional storms that affect the hydrology of large areas. For large rivers imaging of these types of processes likely requires high temporal sampling, but could permit coarser spatial resolution. At the most challenging extreme, landslides are generally small features, ranging in dimension from several
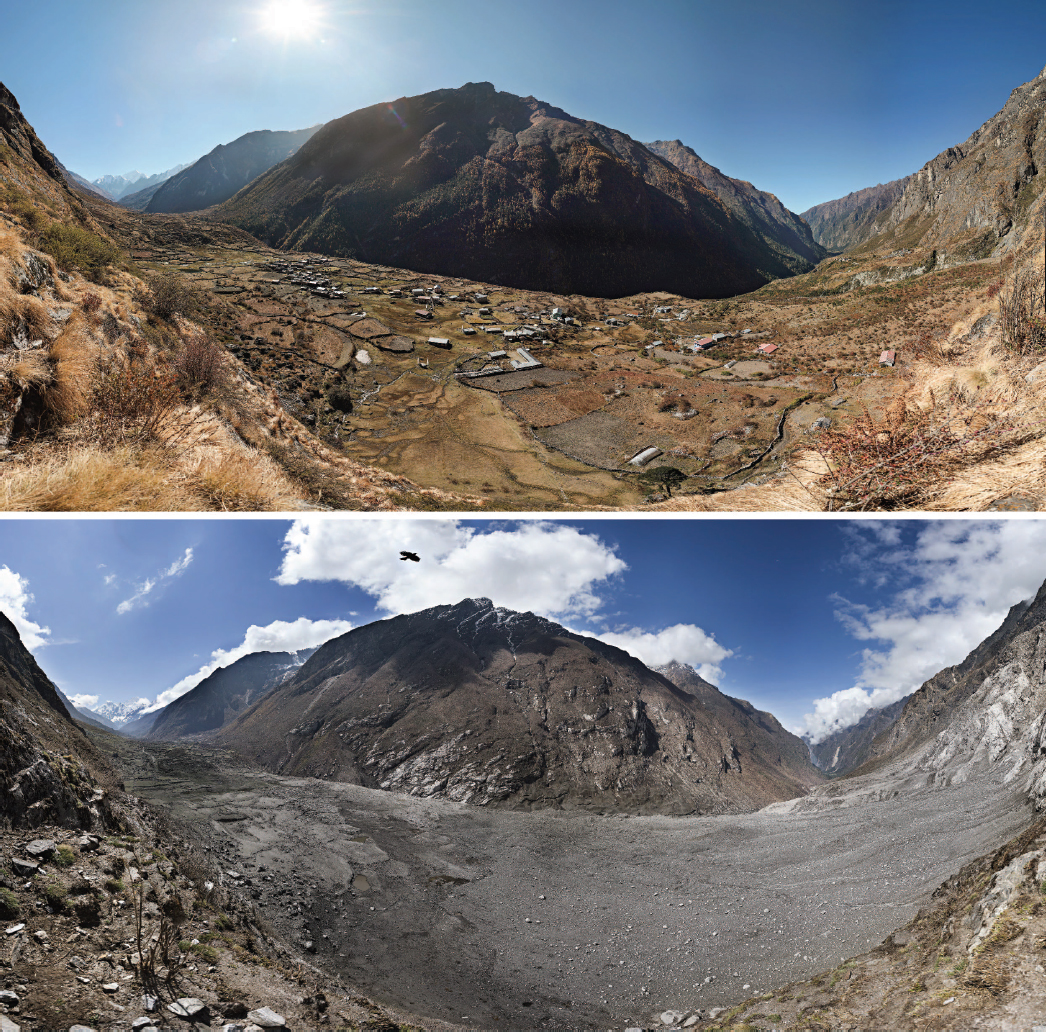
- meters to several kilometers. Hydrologic triggers are locally mediated (e.g., by proximal slopes, vegetation cover, and previous history), and so observations of factors that control this hydrology need to be at the scale of individual landslides. Furthermore, rates of landslide motion vary over seven orders of magnitude, from seconds-long rapid failure or mobilization of rock and soil in a debris flow to continuous landslide creep that can persist for decades.
Objective S-4c: Quantify ecosystem response to and causes of landscape change.
- Priority—Important: Understanding the coevolution of landscapes and ecosystems is a central and vibrant locus of inquiry in landscape development. Achieving this objective strongly relies on the quantification of the landscape change (Objective S-4a) associated with variations in ecosystem characteristics.
- Relevant quantities: Ecosystem response and causes refer to the extent, biogeochemical composition, and health of the aboveground biomass; its species composition; interaction among species; its mechanical characteristics (such as root strength and surface roughness); and its soil-generation and transport characteristics, and how these factors vary with landscape position, changing landscape properties, and time. Relevant quantities for characterizing this response include nutrient composition/status of the ecosystem, distribution of the carbon stock (as a function of aboveground elevation) in the biomass, biomass water-cycling characteristics, species composition of the aboveground biomass, surface shear strength imparted by vegetation communities, biogeochemical fluxes from the biomass to the soil, and the history of wildfires (Lamb et al., 2011; see also Figure 10.18).
- Length and time scales over which responses should be quantified: Length scales should be matched to those required to image different landscape elements (i.e., from meters to entire landscapes: hundreds of km2). Baseline observations need to be collected throughout the year to adjust for seasonal variations in biomass properties. Imaging change over time needs to be flexible, depending on the processes leading to landscape changes under investigation. High-impact events such as wildfires impose abrupt changes, whereas persistent groundwater drawdown creates incremental impacts. Thus, a means of acquiring global baseline measurements at high spatial resolution that could be revisited for specific areas at different return frequencies is necessary.
Linkages of S-4 Objectives to Other Panels and Integrating Themes
Landscapes are situated at the interface between the geosphere, atmosphere, hydrosphere, cryosphere, and biosphere. The physical shape and composition of the land surface, its soils, and its ecology are critical controls on the ways in which water, carbon, nutrients, and energy cycle through the critical zone, making this interface a nexus for many integrating themes. Along with soil characteristics, surface water, snowmelt, and groundwater (Hydrology Objectives H-1c, H-3b, H-4a, H-4b, and H-4c; Ecology Objective E-1d; Climate Objective C-2e; and Weather Objectives W-1a, W-3a, and W-4a) are fundamental controls on erosion and deposition at the surface and on the structure of the ecosystem. They also modulate soil and rock resistance to failure (in part through vegetation properties). Climate change, temporal variability in land use (Hydrology Objectives H-2a and H-4d), and societal activity affect the shape, structure, vulnerability, and resilience of landscapes and associated ecological and hydrological systems (Ecology Objectives E-1b, E-1e, E-3a, and E-5b), including water and air quality, groundwater recharge, and food production. High-resolution, lidar-based topography and its changes through time provide a critical and spatially nuanced template for predicting and assessing fluxes of sediment, energy, water, nutrients, and carbon through landscapes (Weather Objectives W-3a. W-4a; Hydrology Objectives H-1a, H-2a, H-4a, and H-4b; and Ecology Objectives E-4a, E-5a, E-5b, and E-5c). Lidar enables more reliable quantification
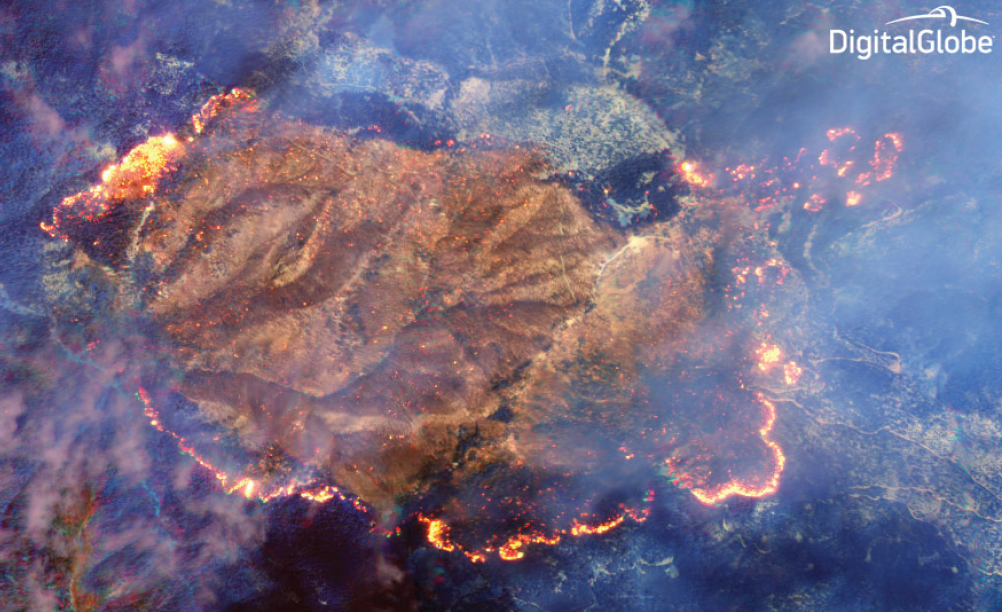
of the likely impacts of changes in climate, weather, forestry, agriculture, or other societal uses, and also illuminates the 3D structure of both aboveground ecosystems and carbon inventories. The variables, such as surface slope and shape, rainfall rates, vegetation cover and type, and soil character, that control the rates and character of surface processes will also determine how the landscape, including its hydrologic and ecologic character, responds to and recovers from both incremental and extreme events, either natural or anthropogenic.
Question S-5: How does energy flow from the core to Earth’s surface?
Earth has a liquid core, which slowly cools by energy transfer through the mantle to the surface. A solid inner core has crystallized out of the core fluid. In the remaining fluid of the outer core, thermal and chemical convection with speeds of tens of kilometers per year generate Earth’s magnetic field (Figure 10.19), which prevents Earth’s atmosphere from being depleted by the solar wind and shields society from harmful radiation. Core motions and waves are responsible for prominent changes in Earth’s magnetic field, as seen in features such as the movement of the geomagnetic poles and the South Atlantic magnetic anomaly. Angular momentum exchange with the overlying mantle further leads to subtle variations in Earth rotation, which are manifested in changes of the length of the day, precession, and nutation of the rotation axis.
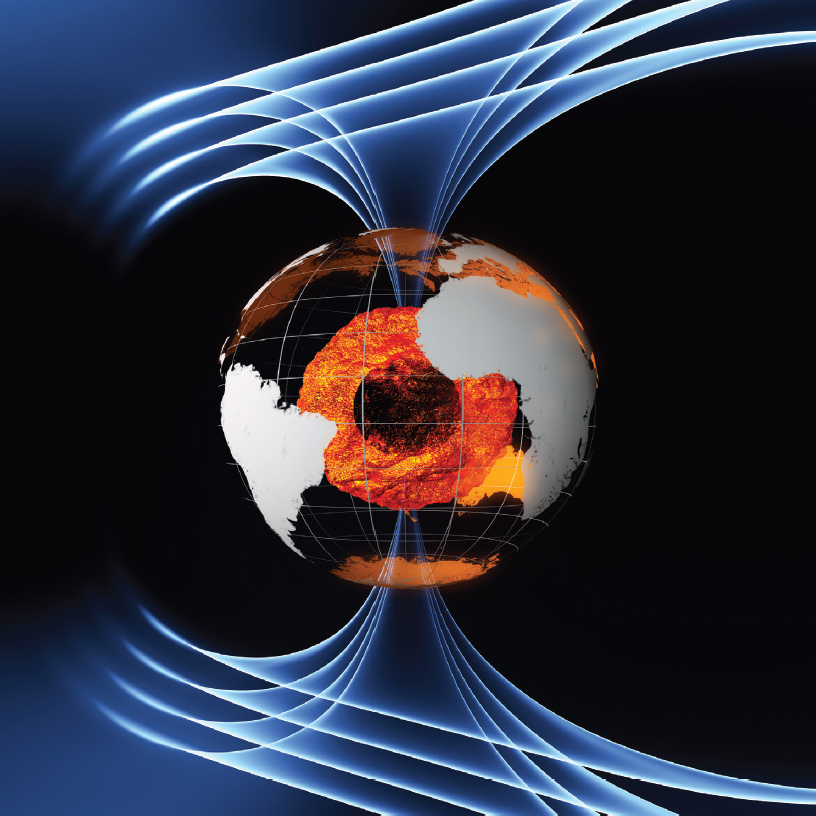
Heat transfer from the core to the surface also drives convection and flow of Earth’s viscous mantle. Cooling at the surface generates rigid lithospheric plates that slide across the viscoelastic asthenosphere. These geodynamic processes are evident in plate motions, variations in geoid height, and dynamic topography. New tectonic plates are created at volcanic midocean ridges and are recycled back into the mantle at subduction zones, generating both earthquake and volcanic activity. These plate tectonic processes cycle CO2, water, and other fluids through Earth’s interior and atmosphere, helping to create and maintain a habitable planet.
Although plate tectonics explains the occurrence of earthquakes, volcanoes, mountain belts, and geologic features, fundamental questions remain. Specifically, what is the nature of plate boundary deformation; what fraction of the strain rate is elastic, to be released in future earthquakes; and what fraction
is inelastic, forming diffuse deformation far from the plate boundary (Figure 10.20)? We do not know how much water is trapped in the deep interior. How much does this water affect mantle viscosity and the initiation of plate tectonics? We know that density and temperature variations lead to circulation of Earth’s mantle, but does this circulation extend through the entire mantle or is it partitioned with depth? How does this circulation influence surface topography, plate motions, and the evolution of plate boundaries?
Objective S-5a: Determine the effects of convection within Earth’s interior, specifically the dynamics of Earth’s core and its changing magnetic field, and the interaction between mantle convection and plate motions.
- Priority—Very Important: Better characterization of deep Earth dynamics and its drivers is key to understanding deep Earth phenomena such as geomagnetic field variations, mantle convection, and plate motions. Because Earth’s deep interior cannot be probed directly, our understanding is largely based on indirect measurements and observations. The primary challenge in reaching a better understanding of deep Earth dynamics is overcoming the present sparsity of observations and the nonuniqueness in their interpretation. Opportunities for improving the observational basis include
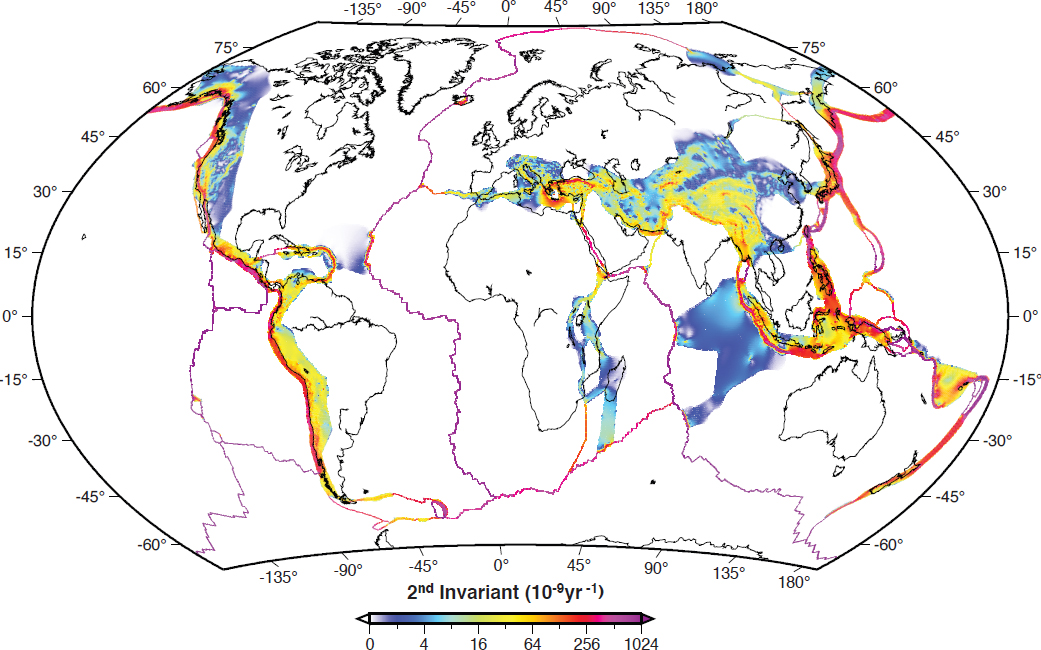
- (1) multisatellite simultaneous measurements of the magnetic field to separate internal contributions and relate them to motions in the core, and (2) establishing more accurate terrestrial reference frames for monitoring Earth rotation parameters, deformation, and mass transport.
- Relevant quantities: Accurate global monitoring of the magnetic field provides valuable insights because the magnetic field of the core passes almost unobstructed through the mantle. Other helpful measurements include changes in the gravity field and earth-rotation parameters. Core and mantle structure can be inferred from imaging by seismic waves. Models of mantle convection require knowledge of the physical parameters of Earth’s interior—specifically, density and viscosity. The thickness of the elastic lithosphere and viscosity structure of the asthenosphere can be constrained using long time series of GPS measurements combined with time-dependent gravity measurements. The distribution of density within the mantle, determined from seismic models, can be constrained using gravity and topography data. Improved understanding of the nature of deforming plate boundaries—specifically, the level of coupling between the rigid crust and mantle and the convecting asthenosphere and how that coupling relates to surface faulting—requires both temporal and spatial measurements of strain accumulation. Continuous time series measured by GPS and repeat InSAR images provide the temporal resolution needed to assess levels of transient behavior, earthquake processes, aseismic deformation, long-term tectonic motions, and accommodation of relative plate motions across continental boundaries.
- Length and time scales over which responses should be quantified: Earth’s core magnetic field changes on subannual to decadal time scales and thus needs to be monitored continuously from space. Exchange of angular momentum between core and mantle from changes in earth-rotation parameters also requires continuous monitoring.
Objective S-5b: Determine the water content in the upper mantle by resolving electrical conductivity to within a factor of 2 over horizontal scales of 1,000 km.
- Priority—Important: Significant quantities of water, perhaps several times the volume of the surface oceans, may be stored in Earth’s deep interior, distributed as point defects in the nominally anhydrous minerals that make up the bulk of the mantle. The actual volume and distribution remain highly uncertain, but water (or more precisely, hydrogen) modifies both rheological properties and melting relationships, with potentially significant impacts on the dynamics and geochemical evolution of Earth. Quantitative understanding of Earth’s deep water cycle and the distribution of volatiles in the interior would clarify key aspects of the dynamic Earth, ranging from the initiation and maintenance of plate tectonics to the nature of the asthenosphere and the stability of ancient cratons.
- Relevant quantities: Conductivity imaging with electromagnetic induction methods is likely the best probe for constraining the distribution of water in the mantle on a global scale. For plausible variations in water content, conductivity can vary by orders of magnitude. Satellite magnetometers have a unique potential to provide new 3D global views of upper mantle and transition zone water content—in particular, shedding light on large-scale variations between continental and oceanic domains.
- Length and time scales over which responses should be quantified: Mantle conductivity changes over geological time scales and is best determined over spatial scales of hundreds of kilometers globally. This scale requires a constellation of polar-orbiting satellites taking simultaneous magnetic vector measurements over multiple years.
Objective S-5c: Quantify the heat flow through the mantle and lithosphere within 10 mW/m2.
- Priority—Important: The heat flow from Earth’s interior is of primary importance for understanding the dynamics of deep Earth processes, and it also has a role in basal heating under the large ice sheets. However, accurate measurements of heat flow are challenging because (1) the interior heat flow is much smaller than the solar energy, and (2) observable geophysical parameters, such as acoustic velocity and electrical conductivity, are related only weakly to temperature.
- Relevant quantities: Methods for determining heat flow include direct downhole measurements, hyperspectral surface imaging, and mapping Curie isotherm depth from magnetic anomaly surveys.
- Length and time scales over which responses should be quantified: Lithospheric heat flow changes over geological time frames and, therefore, has to be measured only once. Relevant length scales are of the order of tens of kilometers.
Linkages of S-5 Objectives to Other Panels and Integrating Themes
Earth’s magnetic field plays a critical role in shielding the biosphere and society from harmful radiation and enabling global communication, and so an improved understanding of its character and temporal variability could prove invaluable. A significant increase (or decrease) in radiation would have a notable impact on weather and climate (Weather Objectives W-1a, W-3a, and W-10a; Climate Objectives C-2a, C-2g, C-2h, C-6c, and C-7c) and on hydrologic and ecologic systems, as well as global fluxes of energy and (likely) carbon and water. Given the importance of hydrology at the base of ice sheets, improved understanding of the thermal flux from Earth’s interior to their bases would improve estimates of ice-sheet stability and vulnerability as related to sea-level rise (Climate Objectives C-1a to C-1d).
Question S-6: How much water is traveling deep underground and how does it affect geologic processes and water supplies?
Water flowing beneath Earth’s surface helps sustain life. Growing populations and climate change are rapidly claiming surface-water supplies, which are the easiest and cheapest to manage and exploit. Consequently, it is becoming increasingly important to measure, monitor, and manage aquifer systems in a sustainable way or else risk human health in many parts of the world. Furthermore, deep groundwater is central to geological processes including earthquake generation, rock formation, and landscape evolution. High pore pressures are an often invoked yet seldom measured catalyst for tectonic and hydrologic processes, such as faulting, volcanic eruptions, and subsurface flow dynamics. As a result the geological challenges and societal needs for deep groundwater monitoring are well aligned. Synoptic global observations from space play a key role in addressing this worldwide challenge.
Objective S-6a: Determine the fluid pressures, storage, and flow in confined aquifers at spatial resolution of 100 m and pressure of 1 kPa (0.1 m head).
- Priority—Very Important: Overproduction of groundwater aquifers not only risks loss of immediately available water but also can lead to permanent loss of storage capacity. If drawdown leads to irreversible permeability and porosity changes, the aquifer may no longer be able to be recharged, even if rainfall is plentiful.
- Relevant quantities: The relevant measurements include vertical surface deformation from InSAR and GPS, as well as estimates of surface water (including snowpack) and surface-to-groundwater fluxes,
- as observed in large basins using gravity (see Figure 10.3). For predictive measurements, forecasts of water use, precipitation, and runoff are required.
- Length and time scales over which responses should be quantified: Broad areal coverage that spans watersheds at a scale fine enough to resolve inhomogeneities in aquifer structure (km scale) are needed. Temporal sampling needs to resolve any seasonal effects. In areas prone to InSAR decorrelation weekly or better sampling is needed to identify reliable scattering points.
Objective S-6b: Measure all significant fluxes in and out of the groundwater system across the recharge area.
- Priority—Important: Groundwater flow is coupled to recharge and withdrawal forcings: when it rains, water is commonly captured in underground reservoirs; it is later available for use in drier periods. Modeling flow throughout the water cycle for any region requires measuring or estimating all relevant fluxes between the various elements of the system (e.g., Jasechko et al., 2016).
- Relevant quantities: The relevant measurements include precipitation, streamflow, recharge and extraction rates, water use by humans, plus any natural discharges, evapotranspiration, and soil moisture.
- Length and time scales over which responses should be quantified: Areal coverage that spans watersheds at a scale fine enough to resolve inhomogeneities in aquifer structure, plus areas of precipitation catchment or surface flow relevant to aquifers are needed. For most of these characteristics, 100 m to km scale is sufficient. Monitoring individual producing wells requires sampling at 10 m postings or less. Stream gauges need to be deployed in streams with flow rates that are not constant or predictable over an annual cycle.
Objective S-6c: Determine the transport and storage properties in situ within a factor of 3 for shallow aquifers and an order of magnitude for deeper systems.
- Priority—Important: Remotely sensed hydraulic head data, combined with observations from in situ wells, are needed to solve for aquifer conductivity and storage parameters. Once the calibrations are known and flow is determined to be in an elastic range, detailed spatially resolved aquifer descriptors can be retrieved. These parameters then form the basis of the groundwater model.
- Relevant quantities: The relevant measurements include vertical surface deformation from InSAR and GPS, plus ground-based head data at multiple wells in the watershed. Such measurements require production records from some wells and drawdown tests at several.
- Length and time scales over which responses should be quantified: Areal coverage that spans watersheds and basins at a scale fine enough to resolve inhomogeneities in aquifer structure are needed. Monitoring individual producing wells requires sampling at 10 m postings or less. For the drawdown tests, data are needed on the scale of hours over days to estimate conductivity. Basin-wide temporal sampling needs to resolve any seasonal effects.
Objective S-6d: Determine the impact of water-related human activities and natural water flow on earthquakes.
- Priority—Important: Wastewater disposal and water injections for enhanced geothermal systems (e.g., Figure 10.21) induce earthquakes in regions where such activity has historically been minimal. Determining whether natural or anthropogenic subsurface flow can raise earthquake hazard potentials in seismically active areas requires a means to estimate pressure changes at depth and to relate those changes to stress distributions.
- Relevant quantities: The relevant measurements include vertical surface deformation from InSAR and GPS, as well as the locations of any preexisting faults that might be triggered by changes in pressure. For predictive measurements wastewater reinjection estimates are required.
- Length and time scales over which responses should be quantified: Areal coverage that spans production zones and basins at a scale fine enough to resolve inhomogeneities in reservoir structure are needed. Monitoring individual producing wells requires sampling at 10 m postings or less. Temporal sampling needs to resolve any production or reinjection effects.
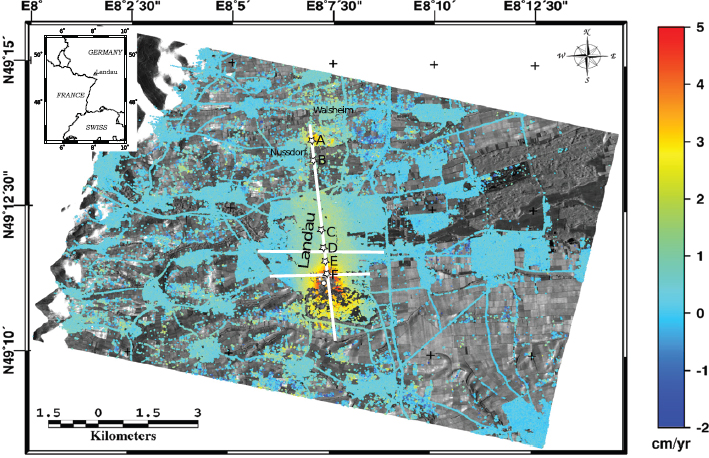
Linkages of S-6 Objectives to Other Panels and Integrating Themes
Water is clearly an integral part of multiple Earth systems, and it is central to the hydrology, climate, weather, and ecosystems panels. Although surface water fluxes are moderately well characterized, deep water is one of the most difficult components of the water cycle to measure (Hydrology Objective H-3b). As has become apparent in the past two decades satellite-based measurements, particularly data from InSAR and GRACE that measure deformation and water loads, respectively, shed light on the deep, confined reservoirs in Earth’s interior—information that can advance a wide range of science objectives (Hydrology Objective H-4c). Although the spatial resolution of GRACE is currently limited, repeat gravity measurements can quantify seasonal to annual changes in the total mass of water in large groundwater basins (e.g., Figure 10.3), as well as estimate the snow-water equivalent at the end of the snow-accumulation season (Hydrology Objective H-1c). Higher resolution geodesy and gravity measurements will enable better quantification of groundwater change, help address Hydrology and Ecosystem objectives (H-1c, H-4c, E-1d, E-2b, and E-5b), and are clearly related to water fluxes and extreme events, particularly drought (Hydrology Objective H-4c).
Question S-7: How do we improve discovery and management of energy, mineral, and soil resources?
Extraction of natural resources, including ores and water, is critical for providing food, energy, and industrial raw materials needed for modern civilization. Moreover, the quality of soils (their geochemistry, nutrients, permeability, thickness, and durability) are determinative ingredients for agriculture and ecology, and thereby modulate sustainability. The surface expressions of the chemical compositions of many resources, including soils, are visible in the spectrum of reflected and emitted energy signatures. These signatures can be effectively monitored with high spatial resolution data collected from spaceborne instruments. Production of subsurface resources (e.g., water or hydrocarbons) can cause surface deformation that can be monitored from space using InSAR. In situ calibration wells provide important verification points. For example, discovery and management of offshore hydrocarbon resources benefit from frequent high-resolution images of sea-surface oil slicks (Figure 10.22).
The primary need is for high-resolution sensors in the optical, thermal, and infrared portions of the spectrum. Once the raw measurements are corrected for atmospheric influences, it is possible to infer surface chemical composition by comparing the reflectance spectra to a library of known materials. Challenges include having sufficient spectral information (bands) at fine enough resolution to permit the identification of target minerals, despite the interference of the atmosphere, while fitting within bandwidth limits.
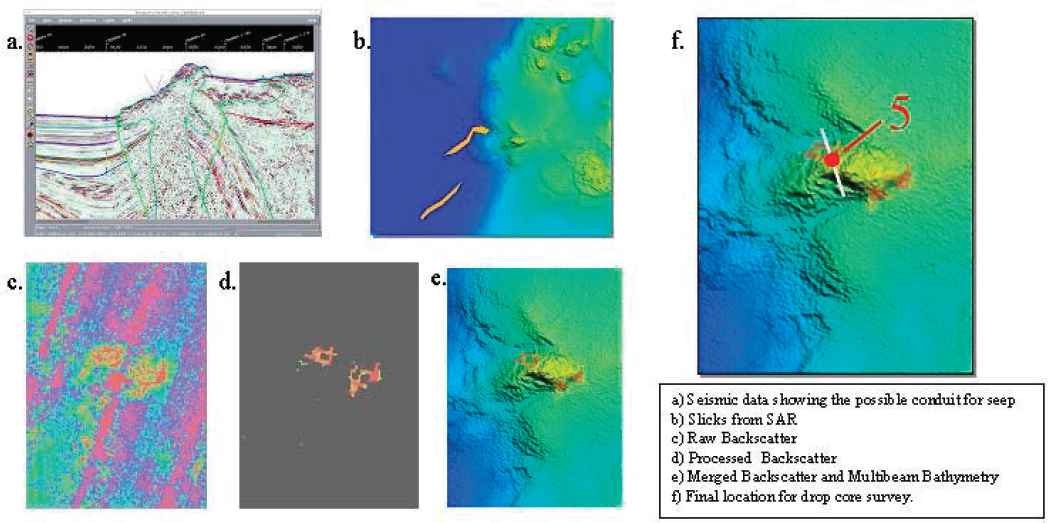
Objective S-7a: Map topography, surface mineralogic composition and distribution, thermal properties, soil properties/water content, and solar irradiance for improved development and management of energy, mineral, agricultural, and natural resources.
- Priority—Important: Resource management is an important application area that is furthered through the use of government-collected data sets.
- Relevant quantities: The relevant measurements include 1 m spatial resolution optical visible data, 30 m or better hyperspectral VSWIR imaging, and TIR data. Because many satellites provide meter-scale optical/infrared spectrum data, this objective can likely be met through simple data sharing agreements among data providers. However, development of hyperspectral VSWIR and TIR data is required. Additional needs include 30 m or better resolution bare-earth topography and vertical surface deformation from InSAR and GPS.
- Length and time scales over which responses should be quantified: The length and time scales of most of these measurements are highly variable, depending on the circumstances. Deformation rates can be rather high in areas of active production (>10 mm/yr), although the aerial extent of reservoirs is usually less than a few hundred meters. Consequently, 5-50 m spatial resolution is needed for deformation monitoring. Temporal variations in land cover and infrastructure development generally occur over weeks to years, and so the 30-60 m multi- and hyperspectral data need to be acquired at least biweekly.
Linkages of S-7 Objectives to Other Panels and Integrating Themes
Earth materials provide a vital framework for the biosphere and human society. The composition, hydrological properties, and geobiochemistry of soils are fundamental to the health of ecosystems and hydrologic networks. These properties determine runoff, infiltration, erosion, nutrient fluxes, and much of the structure of plant and animal communities—key components of the integrating themes of energy and water cycles (Hydrology Objectives H-1a and H-4a; Ecology Objectives E-1b, E-3a, and E-5b). The irregular spatial distribution of key mineral and energy resources and their subsequent extraction commonly introduces localized challenges related to water, energy, ecosystem quality, and sustainability—important attributes of both the Hydrology and Ecosystem panels’ objectives.
Enabling Measurements
A wide variety of spaceborne measurements are needed to help achieve the science and applications objectives described earlier. Some of these measurements support multiple objectives, although requirements may differ for each objective. A description of each measurement type—including how the measurement is made, the maturity of the measurement technology, trade-offs (e.g., temporal and spatial resolution, technological approaches), and extent to which the measurement is new—appears in the following sections.
Terrestrial Reference Frame (1 mm Positional Accuracy; 0.1 mm/yr Rate Accuracy)
The Terrestrial Reference Frame serves as the reference frame for all Earth science satellite observations. The terrestrial reference frame includes motion of the geocenter relative to the frame.
- Measurement basis: In the United States terrestrial reference frame activities are organized by NASA and strongly supported by international partners and the International Earth Rotation Service. The networks used for the terrestrial reference frame are a sparse global network of VLBI and SLR stations
- that are collocated with GPS/GNSS instruments. A much denser, well-distributed global GPS/GNSS network (~200 sites) is needed for precise orbit determination with low latency. GPS/GNSS is also used to tie the global tide gauge network to the reference frame. A precise determination of the terrestrial reference frame requires the complementary measurements from all three systems (VLBI, GPS, and SLR). However, only SLR has a demonstrated capability to measure geocenter motion at monthly time scales.
- Measurement maturity: VLBI, SLR, and GPS were developed over many decades by NASA and its partners. They are mature, but many existing facilities that support VLBI, SLR, and GPS tracking are aging and require upgrades or replacements to be able to reach the required accuracy and stability goals. In addition, investment is needed for extending analysis from its current emphasis on GPS to include signals from the other GNSS constellations: GLONASS, GALILEO, and BEIDOU. This expansion requires investment in both new receivers (which track all GNSS signals) and software development.
- Trade-space definition: It will be important that the VLBI/SLR/GNSS sites have a good global distribution with an adequate number of southern hemisphere stations; this is a current shortcoming of the legacy networks. Running a network with an adequate number of stations every day would reduce the impact of individual station problems and maintain better accuracy of global parameter estimates like Earth orientation parameters. On the precision side simulations indicate that polar motion and Earth orientation from a 30-site, next-generation network will be 2-3 times more precise than the best research and development experiment (“CONT”) campaigns (14-17 stations).
-
Continuity versus new: The accuracy of the terrestrial reference frame requires long time series at globally distributed VLBI/SLR/GPS stations. Because of the dynamic nature of processes from Earth’s surface and interior, continuity of the measurements is implicitly necessary. The equipment at the existing terrestrial reference frame sites has to be maintained and, in many cases, upgraded. This requirement is true for all three techniques. For VLBI and SLR the majority of the development cost for building new ground stations has been expended. Completion of the deployment of the new systems and funding for ongoing operational costs will be required to achieve the goals as defined earlier. Note that the great majority of VLBI and SLR sites are operated by international collaborators.
New work is needed to tie the three ground systems together, in terms of both modeling the measurements and making new in situ measurements. Many of the GPS/GNSS sites were installed when daily downloads were state of the art. New real-time telemetry is needed, with higher sampling rates, so that the GPS/GNSS data can be used in early warning systems for earthquakes, volcanoes, and tsunamis, as well as to image atmospheric water-vapor events. Support for new GPS/GNSS stations in undersampled regions, such as Africa and South America, as well as new hardware providing access to the signals from the European, Russian, and Chinese systems are also needed. New efforts are required to tie tide-gauge records into the terrestrial reference frame. These efforts could include the use of reflected GPS/GNSS signals for water-level sensing when possible (see Box 2.1).
Land-Surface Deformation
Surface deformation requirements for the panel’s science objectives are highly variable (Table 10.3). Some applications require spatial resolution of <5 m with measurement precision of ≤10 mm and weekly or more frequent sampling. Other applications need lower spatial resolution of 100-500 m with seasonal or better sampling. Very frequent observations are sometimes needed to capture the rapid deformation following some earthquakes and volcanic eruptions. These event-dependent requirements can sometimes be achieved by tasking all relevant international space assets.
-
Measurement basis: Two different but complementary technologies can be used to measure surface deformation. Ground-based GPS receivers can be deployed in point locations to continuously measure three components of surface deformation at mm accuracy at decadal scales. A prominent example is the U.S. Plate Boundary Observatory (Holt and Shcherbenko, 2013), which consists of about 1100 permanent sites deployed at 10-100 km spacing over western North America. Typically, the receiving units provide samples every 15 seconds, but they can acquire data at up to 20 Hz to function as strong motion seismometers (Box 2.1). Over 10,000 other continuous GPS sites around the world are operated by governments and organizations. These sites provide the measurements of global plate motions needed both for scientific studies and for defining the moving reference frame. The GPS receiving units (and satellites) are tied to the terrestrial reference frame, and so they can achieve better than 1 mm position and 1 mm/yr velocity accuracies, respectively. All of the measurement requirements listed in Table 10.3, except the spatial resolution, could be achieved with GNSS.
The second technology used to measure surface deformation is repeat-pass InSAR deployed on a satellite, an aircraft, or fixed on the ground. A single interferogram represents the deformation of the surface of Earth in the line of the boresight of the radar between the reference and repeat acquisition times. The best spatial resolution of the measurement is half the length of the antenna (~5 m). The single InSAR accuracy is mostly limited by the two-way delay (20-200 mm) of the microwaves as they propagate through the troposphere. Any small-scale disruption of the surface owing to, for example, vegetation growth will decorrelate the measurement. Hence, the time between the reference and repeat acquisitions is limited to years or weeks depending on the properties of the surface. Other large-scale error sources associated with orbital and ionospheric effects produce errors >100 mm at length scales >100 km. The ionospheric errors can be corrected using a two-frequency radar as planned for NISAR. Therefore, a single interferogram represents a scalar, relative deformation measurement. Two or more components of deformation can be achieved by observations from ascending and descending orbits. High precision of 1 mm/yr can be achieved through 50 or more repeated
TABLE 10.3 Land-Surface Deformation Requirements for Different Science Objectives
| Objective | Spatial Resolution | Precision | Frequency | Duration |
|---|---|---|---|---|
| S-1a | 10 m | 10 mm | Event dependent | |
| S-1b | 10 m | 10 mm | 12 days | 10+ yr |
| S-1c | 50 m | 1 mm/yr | <Seasonal | |
| S-2a | 10 m | 10 mm | Event dependent | |
| S-2b | 10 m | 1 mm/yr | Event dependent | |
| S-2c | 100 m | 1 mm/yr | Event dependent | 5+ yr |
| S-3a | 100 m | 10 mm/yr | <Seasonal | |
| S-3b | <50 m | 5-10 mm | Weekly | 10+ yr |
| S-4a | <5 m | 5-10 mm | Weekly | 10+ yr |
| S-5a | 100 m | 10 mm | ||
| S-6a | 5 m | 10 mm | Weekly | |
| S-6b | 5 m | 3 mm/yr | Weekly | |
| S-7a | 5 m | 10 mm | Weekly |
NOTE: Requirements for the Most Important objectives are marked in bold.
-
measurements taken over a year. The radar can also be mounted on an aircraft or on the ground to monitor motions of intermediate scale (<10 km) and small (<5 km) scale, respectively.
-
Measurement maturity: GPS is a mature 3D measurement technique. Improvements over the next decade will come from the inclusion of new GNSS signals and availability in real time. GPS relies on a well-defined terrestrial reference frame. However, GPS/GNSS networks are supported by multiple U.S. agencies and international partners, and so their long-term existence cannot be guaranteed.
Radar interferometry is a mature measurement with well-established processing workflows and decades of scientific results to demonstrate its utility. Spaceborne radar interferometry has been performed using a number of non-U.S. platforms; a joint U.S.-Indian mission (NISAR) is scheduled for launch in 2021. Additionally, less accurate airborne InSAR is part of the NASA portfolio of measurements. The international constellation of radar satellites approaches the needed postings and vertical precisions specified earlier, but not at the temporal sampling needed to reduce atmospheric propagation artifacts. The newer Sentinel-1 series satellites are beginning to offer a typical cadence of 24 days in tectonically active areas and could provide 6-day repeated measurements in the case of a major geological disaster. NISAR has a much more capable radar that can achieve high spatial resolution over a wide swath on a 12-day cadence with two look directions. In addition, it offers a second channel for ionospheric correction, which will dramatically increase the accuracy of the measurements over length scales greater than 20 km. NISAR is designed for a 3-year lifetime, but no engineering barriers prevent collection of 10 years of usable data. Some recent radar satellites have operated successfully for 2 decades, whereas others have lasted only 6 years.
-
Trade-space definition: Most of the preceding needs can be met by continuing existing capabilities but at denser temporal sampling. A NISAR follow-on mission is required to maintain a set of continuous L-band observations. A follow-on mission should offer as fast a repeat (more frequent than 12 days) and as high a spatial resolution as possible. NISAR’s 12-day repeat was driven by the need to cover the equatorial regions for ecosystems (cryosphere requested a 1-day repeat). If that equatorial restriction could be relaxed, more frequent (even 3 day) L-band repeat could be obtained, which is ideal for fast-moving targets like ice streams and frequent revisit for earthquakes. A follow-on mission would be cheaper than the original NISAR owing to technology inheritance and reduction of risk.
An alternative to a NISAR follow-on is to fly a constellation of SAR satellites with a simpler and cheaper architecture and, hence, perhaps less capability (e.g., no polarimetry, narrower swath), in order to provide global coverage, fast repeat, left/right looks, and free data access. The optimal configuration for science users would be a constellation that allows rapid repeats, both for quick response and for minimizing phase errors through multiple observations. This strategy would likely mean abandoning global coverage every orbit so that each platform could operate with a lower duty cycle and, hence, produce less total data. No other existing mission comes close to that goal, although Sentinel-1 could if its data acquisition policy is changed.
For groundwater-related topographic change, airborne laser elevation maps can be added as needed. Especially in sparsely vegetated areas, most applications would benefit from the availability of the TanDEM-X digital elevation model (DEM)—a matter of cost/negotiation.
- Continuity versus new: The NISAR mission scheduled for launch will provide the requisite resolution. However, continuation of these types of measurements past the NISAR mission will be necessary to establish the appropriate baselines for understanding continuous landscape deformation. Additionally, the Uninhabited Aerial Vehicle Synthetic Aperture Radar (UAVSAR) mission is currently active, although increased spatial and temporal coverage could be enabled by a constellation of autonomous imaging vehicles on a site-specific basis.
-
The surface deformation needs are the enhanced capabilities promised by NISAR, but with increased temporal sampling. Development of an international constellation of similar or identical satellites operated as an array is needed.
High-Resolution Bare-Earth Topography
Global maps of bare-earth topography serve multiple critical roles, including (1) providing a pre-event (e.g., earthquake, volcano, landslide, tsunami) reference surface; (2) imaging changes owing to these processes (Objectives S-1a, S-1b, S-1c, S-1d); (3) assessing areas of potential landslides and volcanic lahars (Objective S-2c); (4) forecasting coastal inundation or emergence owing to local sea-level change (Objective S-3b), and (5) relating topographic forms to the processes (e.g., erosion, landslides) that created and modified them (Objective S-4a). However, high-resolution, bare-earth topography is currently available for less than 1 percent of the terrestrial surface. Moreover, nearly all high-resolution topographic maps have been created with airborne lidar, which imposes significant practical limits on the extent of coverage. Although lidar-based topographic mapping from space on a contiguous and high-resolution grid poses a major technological challenge, it is a necessary and logical next step that promises to transform understanding of landscape evolution and the interactions of processes that shape them.
- Measurement basis: The topographic depiction needs sufficient spatial resolution to discriminate landscape-forming elements from one another, such as hillslopes, river channels, floodplains, and landslides. Moreover, the baseline depiction needs sufficiently high resolution to allow changes in the distribution of these landscape elements and related surface processes to be measured. Numerous studies over the last two decades have shown that digital topography with spatial resolution of considerably less than 5 m (and preferably ~1 m with ~10-fold greater vertical resolution) is required to resolve these differences and quantify these changes. However, changes in Earth’s landscapes occur at vastly different rates. Thus, the most practical and cost-effective strategy for acquiring the necessary time series may be the acquisition of a global, baseline high-resolution data set that would be revisited as necessary in select areas (e.g., following a major flood, earthquake, volcanic eruption, or wildfire). Because high-resolution data cannot yet be acquired efficiently from space, an airborne platform is currently used. The rapid development and (now) widespread deployment of drone-based technologies could enable the autonomous collection of these high-resolution data, potentially by a constellation of vehicles. However, collecting 1 m topography using drones at a global scale faces obstacles of sovereignty.
- Measurement maturity: Airborne lidar is a mature technology that has been commercially deployed and is commonly used. Data processing workflows have been developed and refined, particularly for bare-earth topography, canopy structure, and aboveground biomass, although some human intervention is necessary to achieve research-grade data sets. Autonomous vehicle maturity lags behind that of the measurement itself, but widespread commercial and scientific applications will likely continue to produce rapid advances in this area in the coming decade. Space-based, global coverage remains an important but unrealized goal at present.
- Trade-space definition: Resolution requirements for these data are determined by the scale of the individual landscape elements that are changing, the magnitude of those changes, and the noise characteristics of the data. Many studies suggest that changes in landscape processes are resolvable only at meter scales, such that 10 m data (10 m × 10 m pixels) are insufficient. Furthermore, many landscape metrics, such as hillslope or channel gradients, are derivative quantities sensitive to systematic data noise. Last, all global elevation data sets contain elevation information contaminated
- by the effects of aboveground vegetation. In most places the lack of a true bare-earth description of Earth’s landscapes inhibits quantification of change across landscapes and between landscape elements. For these reasons, the value of the proposed topography degrades appreciably both at spatial resolutions exceeding several meters and with the inclusion of confounding elements such as vegetation.
- Continuity versus new: Technology development is needed to permit sustained, high-resolution (≤5 m horizontal, ≤1m vertical), bare-earth topographic mapping from space. This mapping needs to be spatially continuous (interpolation between highly resolved, but narrow strips is inadequate), and it also needs to be locally to regionally repeatable/refreshed based on anticipated or actual disruptive events.
Moderate-Resolution Topography (10 m Horizontal, 1 m Vertical; Low Earth Orbit)
Topography is needed to be able to calibrate many geophysical data sets (Questions S-1, S-2, S-3, S-5), provide a coarse description of spatially variable change of Earth’s surface (Questions S-2, S-4), and predict surface-water flow patterns (Question S-6).
- Measurement basis: Water-flow predictions require knowing where water is and how it is routed across landscapes. Such data are important for measuring surface topography, which retains the surface water that ultimately feeds aquifer systems. Topographic data with 30 m postings at several meter accuracy provide a useful starting point.
- Measurement maturity: Several technologies have been deployed that are capable of generating the requisite data resolution.
- Trade-space definition: The TanDEM-X DEM is not available for general scientific use. This lack of availability is a matter of organization and collaboration, rather than fundamental scientific and engineering capabilities. The trade-offs in topographic accuracy are relatively straightforward. Notably, topographic data, such as TanDEM-X, provide the topography of the vegetation canopy, which is only a coarse approximation of Earth’s actual surface. Commercial optical stereo data could provide a freely available DEM (e.g., Arctic DEM) with resolution and accuracy that exceeds that of TanDEM-X, albeit with the same limitations of failing to resolve the bare Earth wherever vegetation is present.
- Continuity versus new: The relevant data exist.
Hyperspectral UV/VNIR/SWIR/TIR (~ 30 m Spatial Scale; Revisit Between 1 and 7 Days)
Hyperspectral image data support Objectives S-1a, S-1c, S-2a, S-2b, S-4a, S-4c, and S-7a. Current Landsat-class observations are made in 7-10 wavelength bands. However, imaging spectroscopy with spectral resolutions of 10-20 nm (i.e., hundreds of wavelength bands) is possible with current technology and is critical for discriminating mineral, rock, gas, and vegetation species. This level of imaging spectroscopy is required in the full wavelength range from the UV to the TIR (0.3-12.5 microns). For general mapping and change detection, acquisition of these data at the 7-day time scale is adequate. To capture higher frequency events and phenomena, high spatial resolution data are required at the 1-3 day time scale. The higher spatial resolution, coupled with the higher temporal frequency, will provide the ability to monitor many transient events at volcanoes, capture small-scale phenomena proximal to the vent, and detect trends and precursory activity. These data will fuel a fundamental leap forward in the ability to understand volcanic activity and forecast future eruptions. Furthermore, the compositional information derived from
data at finer spectral and temporal scales will support a variety of science and applications objectives—for example, (1) determining the gas species and ash particle size distribution in volcanic plumes; (2) mapping resources and surficial deposits related to natural processes, geologic disasters, and anthropogenic activity; (3) determining the magnitude and surface change resulting from landslides; (4) estimating the scale of river avulsion and erosion/deposition events; and (5) assessing the impact of human activities.
- Measurement basis: NASA has a long history of multi- to hyperspectral imaging of Earth’s surface. The Landsat program of satellites has provided data at the sub-100-m spatial scale in the visible/near infrared (VNIR) and shortwave infrared (SWIR) since the 1970s. TIR imaging at approximately the same spatial scale became possible in the 1980s, although with only one or two wavelength bands. The ASTER sensor, launched in 1999 and still operating, provides improved spatial and spectral resolution in the VNIR/SWIR region and, for the first time, five spectral channels in the TIR. This multispectral TIR capability allows derivation of compositional information and improved temperature detection. Other sensors such as Hyperion, a hyperspectral VNIR/SWIR instrument on the EO-1 spacecraft, showed that collection of useful hyperspectral data from Earth orbit was possible. The Sentinel-2 multispectral spacecraft series with 13 spectral bands (4 VNIR bands at 10 meters, 6 SWIR bands at 20 meters, and 3 TIR bands at 60 meters spatial resolution) provides 5-day repeat coverage and thus fulfills several of the measurement requirements. Last, the previous decadal survey recommended a data continuity mission called Hyperspectral Infrared Imager (HyspIRI), which combines hyperspectral VNIR/SWIR with multispectral TIR. The mission would greatly expand the current imaging capabilities of ASTER and Sentinel-2 and replicate any data planned for future Landsat missions. However, the mission concept was not approved for Phase-A development.
- Measurement maturity: The UV/VNIR/SWIR/TIR measurement capability is mature in general and relatively low cost. New developments in optics and detector technology enabled by the NASA Instrument Incubator program and the Planetary Science Division has made deployment of such sensors on small satellites possible, thus enabling a constellation solution. Three or four satellites in opposing polar orbits with Landsat-like resolution would image the equator every 4-5 days and the polar regions less than once a day. If the sensors had the capabilities of HyspIRI, those numbers would decrease to ~1 image every day at the equator and every 2 hours closer to the poles. Satellites in geostationary orbits provide even greater temporal resolution data (~15-60 min), which is useful for detecting larger events with much shorter time scales and to support rapid responses to new eruptions. However, the spatial resolution is poor (many km pixels), which limits detection capability. Furthermore, spaceborne detection of CO2 and water vapor in volcanic emissions remains a challenge.
- Trade-space definition: A thorough study of the trade space for a sensor class having capabilities approaching these requirements has been completed by the HyspIRI Study Group. Data from such a class of sensor would not only provide Landsat-quality data but would also improve all derived science data products. HyspIRI’s TIR sensor would have greatly improved temporal revisit times (5 days at the equator versus 16 days for ASTER and Landsat), but not enough to detect high-frequency change or mitigate the obscuration of clouds in persistently cloudy regions. The multispectral TIR is slightly improved from that of ASTER, but it would not provide the spectral resolution of VNIR and SWIR data: the resolution required for detailed measurements of specific minerals or gas constituents, or to unravel complexly mixed temperatures. Furthermore, these sensors could be decoupled and placed on smaller satellites in opposing orbits, thus allowing the improved temporal resolution required.
- Continuity versus new: Except for Sentinel-2, the legacy instruments currently acquiring multispectral data are well past their design lifetimes. Landsat 8 is operational, but the TIR sensor is already
- degraded. ASTER continues to operate 10-plus years past its planned 5-year mission, although the SWIR sensor failed in 2009. Commercial sensors are improving spectral capability (e.g., the latest Worldview-3 satellite or those operated by Planet Lab), but they do not provide TIR data, have the repeat time needed for longer term monitoring and postevent observation, or have a global mapping scope. These same issues pertain to planned hyperspectral missions such as Environmental Mapping and Analysis Program (EnMAP) and Hyperspectral Imager Suite (HISUI). Therefore, a critical gap is looming for moderate spatial resolution (~30 m) multi- to hyperspectral image data. These data bridge scales between the low spatial resolution imaging sensors designed primarily for weather observations and the high spatial resolution commercial imagers. The measurements made by the Landsat class of sensors will continue, but these data are not adequate to enable the needed step-change forward in the science. Global imaging spectroscopy from space with much higher temporal fidelity and spectral resolution than planned would provide this capability.
High-Resolution (Sub-m) Global Optical and Multispectral Observations
High-resolution optical data provide the most cost-effective means of determining where landscape change is happening or is likely to happen (Questions S-1, S-2, S-3, S-4).
- Measurement basis: Acquisition of high-resolution (<5 m horizontal-spacing postings) optical imagery can assist in mapping the extent of damage in areas where natural hazards have adversely affected humans and infrastructure (Question S-2). In areas devoid of vegetation, stereo high-resolution optical/multispectral satellite observations may be used to construct elevation models (<2 m horizontal-spacing postings) that can be used to quantify landscape change, including coastal inundation (Questions S-3, S-4). Both change detection and stereo applications require subpixel geolocation accuracy. Additionally, near-infrared observations may divulge important, spatially dense (<1.5 m multispectral resolution) information about the extent of vegetation cover and properties of the surface, such as relative vegetative health over seasonal repeat times. Such broad coverage, high-resolution data could be used to guide repeat, high-resolution surveys to areas where landscape change is most apparent. Such resurveys can also be used to quantify changes in the location and activity of humans. Localized activity could then be associated with imaged landscape changes to determine the impact of human activity on landscapes across global-scale watersheds.
- Measurement maturity: High-resolution spaceborne optical and near-infrared imaging is demonstrated and mature. Commercial satellites already in place (WorldView-2/3, WorldView-4) meet the operational requirements.
- Trade-space definition: The required technology is operational and has been commercialized.
- Continuity versus new: Continuity is an important requirement, but commercial viability likely will lead to future continuity of these data.
Time-Variable Gravity—Mass Change
Time-variable gravity measurements are important for revealing deformation associated with seismic activity (Objectives S-1b, S-2b), quantifying the rates of sea-level change and its driving processes; Objective S-3a), documenting seasonal snow- and ice-loading and melt losses in large catchments and mountain ranges (Objective S-4a), and quantifying significant fluxes in and out of large groundwater systems across the recharge area (Objectives S-6b, S-6c).
- Measurement basis: The GRACE (2002-2017), and Gravity Field and Steady-State Ocean Circulation Explorer (GOCE; 2009-2013) missions have been used to investigate Earth’s mean and time-varying gravity across a spectrum of spatiotemporal wavelengths. GRACE yields time-variable gravity at a resolution of approximately 300 km at the equator and with an accuracy of about 2 cm water equivalent. At higher latitudes the resolution is approximately twice as good owing to the spatial convergence of the satellite tracks. Although this resolution and accuracy is sufficient to quantify large-scale mass changes (i.e., ice-sheet mass balance, global ocean mass, water storage in the largest hydrological basins), it is rather coarse for most water problems, because most watersheds are too small to be resolved with 200-300 km resolution. Moreover, the time-variable gravity data from GRACE is insufficient to detect mass changes of individual glaciers on the Greenland and Antarctica ice sheets. Improving spatial resolution to 100-200 km at the equator and reducing error from 2 cm to 1 cm water equivalent thickness would allow its application to studies of smaller hydrological basins, smaller glaciers, and smaller magnitude earthquakes.
-
Measurement maturity: Deriving gravity by precisely measuring the change between satellite positions has become a mature measurement approach. The measurement accuracy of GRACE-FO is anticipated to be slightly better than GRACE because it will use better accelerometers, star trackers, refined geophysical background models, and an experimental laser interferometer that has the potential to improve ranging accuracy by 20 times or more. However, the limiting error source in time-variable gravity is aliasing of gravity signals that vary faster than the monthly averaging, and that cannot yet be modeled accurately.
Achieving spatial scales of 100-200 km and an accuracy of <1 cm water equivalent RMS would require additional GRACE-FO satellite pairs or new technology such as an advanced gravity gradiometer. This innovation would allow the gravity fields to be resolved at higher temporal resolution in order to measure (not model) the high-variability mass signals. Flying at lower orbits may also be required, but technology (i.e., a drag-free thruster system) would have to be developed to reduce contamination from atmospheric drag. Flying in such a low orbit would also reduce the lifetime of such a mission.
- Trade-space definition: Flying a gravity mission similar to GRACE-FO toward the end of the next decade would incrementally improve spatial and temporal resolution of gravity measurements. Such a mission would allow both the continued observation of Greenland and Antarctica total mass balances and the quantification of their contribution to accelerating sea-level rise. Enhanced resolution would both allow measurements of water-storage change in very large (>500,000 km2) hydrological drainage basins, including snow and ice in major mountain ranges, and contribute to measurements of very large (>M8) earthquakes. However, to make significant improvements that would advance studies of earthquakes, glacial isostatic adjustment, and glacier-scale processes would require constellations of gravity satellites, development of new gradiometer technology, or both (Pail et al., 2015). One potential way to advance would be to fly a large gravity mission like GRACE-FO with more advanced instruments, along with several lower-cost CubeSat missions in order to form a constellation.
- Continuity versus new: Future gravity missions are needed to maintain at least the continuity of the GRACE/GRACE-FO gravity measurement, primarily for global mean sea-level change studies. However, investing in constellations of gravity missions in optimal complementary orbits or improved gradiometers would likely reduce errors and resolution, increase temporal resolution, and allow time-variable gravity measurements that would considerably improve our understanding of earthquakes and glacial isostatic adjustment as well as cryospheric and hydrologic change.
Radar Altimetry—Sea-Surface Height
Radar altimetry is essential for measuring sea-surface height, which is critical for sea-level change studies (Objective S-3a). It is also important for measuring surface water distribution (Objective S-6a), and for measuring an accurate mean sea surface, from which high-resolution (<10 km) ocean gravity can be derived (Objective S-5a).
- Measurement basis: Radar altimeters operating in the Ku-band (with an additional C-band to estimate ionosphere path delays) have been used to measure sea-surface height with good precision (2 cm RMS accuracy at ~50 km resolution) since 1993. More recently, improved accuracy has been demonstrated for a series of Ka-band altimeters flown over the same ground track with overlapping missions (TOPEX/Poseidon, Jason-1, Jason-2, Jason-3). This approach has proven vital for linking records for climate studies. However, this level of accuracy also requires precise GPS receivers for orbit determination and microwave radiometers to correct for water vapor path delays. The planned SWOT mission will use Ka-band interferometric radar to improve accuracy to less than 1 cm over a swath with 2-5 km resolution. Coupled with topography, this resolution would allow definition of the surface forcing term for the water-flow model in a watershed, as well as detection of surface water area at smaller scales than is possible with traditional radar altimetry.
- Measurement maturity: Nadir Ku-band has been flown since the early 1990s, and the first Ka-band radar altimeter was launched in 2013. Thus, the measurement is mature. Radar interferometry is also mature, although its use for observing sea-surface height and surface water is still experimental and needs to be demonstrated with SWOT.
-
Trade-space definition: Until SWOT demonstrates the predicted level of accuracy and resolution, traditional Ku- or Ka-band radar altimeters will be needed to maintain the observations necessary for quantifying global and regional sea-level change. Improvements in reducing the radar and radiometer footprints to get similar accuracy over the deep ocean all the way to the coastline would be a benefit. A continuation of the global tide-gauge network is also required to detect biases and drifts that have been common in the historical record. Many of these bias changes and drifts are the result of problems with the microwave radiometer correction. Adding an internal calibration mode in the radiometer loop would improve the stability of the sea surface height measurement.
To utilize SWOT for hydrological studies, remote measurement of the forcing terms require instruments observing precipitation, runoff, soil moisture, and evapotranspiration. Many satellites feed the precipitation models, and these can often provide forecasts of incoming fluxes. Streams are often monitored with gages that yield surface runoff.
- Continuity versus new: At a minimum, continuity of at least one nadir-pointing altimeter with an accuracy at least as good as Jason-3 is critical for global and regional sea-level change studies. If SWOT science goals are met, then future missions based on that design would lead to significant improvements.
Magnetic Field Vector (Low Earth Orbit)
Measurements of the magnetic field at satellite altitude are sensitive to spatial and temporal variations in the core field (Objective S-5a), electrical conductivity of the mantle (S-5b), and the large-scale crustal field (Objective S-5c). Higher resolution technology under development has the potential to map smaller scale structures of the crustal field down to about 100 km wavelength (Objective S-5c).
- Measurement basis: In situ magnetic field vector with 0.1 nT per component precision and 0.5 nT per component absolute accuracy at length scales of 100 km to global. To achieve the science objectives the next generation of magnetic satellites has to carry accurate vector instrumentation at low enough cost to enable a constellation of satellites to meet science objectives. A 1-hour local time sampling of 12 satellites (each covering 2 local times) achieves optimal separation of internal and external magnetic fields. Science objectives include (1) identifying core dynamics with shorter temporal and spatial scales, (2) mapping electrical conductivity and water content of the mantle and lithosphere, (3) monitoring magnetic variations of tidal and steady ocean flow, (4) mapping the Curie isotherm depth to determine lithospheric heat flow, and (5) improving the accuracy of geomagnetic reference models for navigation, attitude control, and resource management. This constellation would also address ionospheric, magnetospheric, and heliospheric science objectives. New technology under development (guidestar laser measurements from polar orbiting satellite) will potentially offer much higher precision.
- Measurement maturity: After the successful Oersted, Challenging Mini-satellite Payload (CHAMP), Scientific Application Satellite-C (SAC-C), and Swarm magnetic missions, spaceborne vector magnetometry can be considered a mature technology. Accurate monitoring systems require vector magnetometers with omnidirectional accuracy, precise attitude determination, and an absolute reference for calibration. For a constellation of magnetic satellites the primary technological challenges lie in miniaturizing the systems, including the large star camera baffles, eliminating thermomechanical distortions in the attitude determination systems, and minimizing stray magnetic fields from thermoelectric currents and adjacent instruments.3
- Trade-space definition: A single polar orbiting satellite would enable the secular variation of the geomagnetic field to be monitored with sufficient accuracy for global geomagnetic reference models for navigation, attitude control, and resource management. A constellation of vector magnetic satellites would also enable progress in the science objectives listed earlier.
- Continuity versus new: Geomagnetic field models require continuous time series of measurements to track the secular variation of the geomagnetic field. The study of core processes also requires continuous coverage. The 3-year gap between CHAMP and Swarm caused a significant degradation in the accuracy of geomagnetic field models and limited our ability to understand processes and waves in Earth’s core. Ideally, at least one geomagnetic satellite would be in orbit at all times. A one-time constellation of satellites with limited life span would enable progress toward additional science objectives.
Magnetic Field Intensity (Suborbital)
Mapping small-scale magnetic field variations caused by crustal magnetization is important for deriving the compositional and thermal structure of the continents (Objective S-5c). Over the oceans a complete mapping of the magnetic field would reveal the magnetic reversals over the past 200 million years as well as the plate tectonic history of the old ocean basins where shipboard surveys are sparse.
- Measurement basis: In situ magnetic field intensity with 0.01 nT precision and 10 nT absolute accuracy at length scales ranging from 1 km to 1,000 km.
- Measurement maturity: Magnetic intensity measurements have been made from aircraft for over 70 years. Unmanned aerial vehicles present a new opportunity for magnetometry.
___________________
3 New technology in development at NASA is discussed at https://arxiv.org/abs/1610.05385.
- Trade-space definition: The objective of airborne magnetic surveys is to map the crustal magnetic field, which does not change over time. The primary challenge is to survey remote areas, in particular the southern oceans.
- Continuity versus new: The crustal magnetic field has to be surveyed only once. Repeat measurements offer limited benefit.
Soil Moisture
The amount of water in the soil and on the surface as snow is a key part of the water balance and has major ecological impacts (Objectives S-4b, S-6b). Remote sensing estimation of these terms is also needed to develop the water-flow model.
- Measurement basis: The SMAP radar failure makes it difficult to achieve the spatial resolution needed to adequately estimate the surface forcing term for hydrologic models. A spaceborne radiometer without an active sensor that allows upscaling of the soil moisture measurements cannot achieve adequate resolution. Hence, an active radar with km resolution at daily sampling is needed. Daily sampling is needed to capture precipitation events.
- Measurement maturity: The technology has been developed, but needs to be made reliable and available.
- Trade-space definition: The amount of water stored in the soil (soil moisture) and the amount lost through evapotranspiration are relatively difficult to estimate. Soil Moisture Active-Passive (SMAP) would have yielded soil moisture, and other microwave radiometers can give soil moisture at 10 km resolution. Recent work using radar backscatter to augment the SMAP radiometric data suggests that soil moisture may be determinable at the km scale, a much more helpful measurement than the coarser radiometric-only satellites.
- Continuity versus new: Soil moisture approaches could consist of flying a reengineered SMAP mission that combines both active and passive L-band instruments operating at L-band. An orbital P-band radar, more equivalent to the Airborne Microwave Observatory of Subcanopy and Subsurface (AirMOSS) aircraft system, might be advantageous for capturing root-zone soil moisture, once that system is shown to be sufficiently accurate. This approach would likely entail a dual polarization on the receive system to compensate for the Faraday rotation from the ionosphere, which could compromise the active radar calibration accuracy.
Ice Thickness
Knowledge of ice thickness for outlet glaciers around Greenland and Antarctica is essential for documenting where ice sheets are vulnerable to change in coming decades. Thickness is also vital for models used to forecast potential impacts of grounded ice melt/discharge to sea-level rise (Objective S-3a).
- Measurement basis: The only way to meet the required accuracy/resolution (250 m horizontal resolution near grounding line, uncertainty <10 m vertical) is from suborbital (aircraft) radar that penetrates the ice and is reflected off the bedrock.
- Measurement maturity: Systems to measure ice thickness are robust, and many are already flown. However, more coordinated flights are necessary to observe important regions.
- Trade-space definition: Any measurement of a region never observed is an improvement over no measurement. At the very least, measurements need to be made over areas where demonstrated glacier thinning is occurring.
- Continuity versus new: No new technology is needed, just coordination of observations to cover the edges of both Greenland and Antarctica.
Ice Velocity
Knowledge of ice velocity for the Greenland and Antarctica ice sheets is vital for computing the ice discharge from the outlet glaciers (Objective S-3a).
- Measurement basis: Ice velocity with a 250 m resolution (less than the width of most glaciers) and an accuracy of better than ±1 m/yr RMS can be measured from space using optical and SAR pixel tracking for fast-moving ice streams, and InSAR to provide higher precision for slower moving ice. This capability has been demonstrated in the past, although InSAR measurements have not always been available at the monthly time scale required. Moreover, because many of the sensors have inclinations of ≤81 degrees, they cannot sample the main ice streams in Antarctica.
- Measurement maturity: Optical and SAR pixel tracking as well as InSAR are robust and mature measurement types.
- Trade-space definition: Continuous observations are necessary, and so one-off missions or long gaps between missions will reduce measurement usefulness. The Sentinel-1 series of SAR measurements will provide multidecadal measurements of ice-stream velocity over the lower latitude areas of Greenland and the Antarctic peninsula, although they lack the high-latitude coverage of the major Antarctic ice streams. Because the signal-to-noise ratio is low over ice sheets, small CubeSat SAR/InSAR missions with very short (1-day) repeat intervals may be able to meet the requirements and provide sufficient temporal resolution to monitor grounding line retreat as well as to detect rapid velocity changes.
- Continuity versus new: NISAR should meet the low-latitude requirements when it is launched, but future InSAR missions are necessary to ensure continued and higher latitude observations.
Ice Topography and Change
Although similar to the bare-earth topography measurement, knowledge of topography change over the Greenland and Antarctica ice sheets and other ice caps and glaciers is different in that a time series, not a single estimate, is required to estimate ice-sheet mass balance (Objective S-3a).
- Measurement basis: Satellite laser altimetry or lidar, such as from the previous ICESat or the future ICESat-2 mission, can likely achieve the required resolution and accuracy—spatial resolution on the scale of the area of a glacier (100 m × 100 m), accuracy in the mean of better than 10 cm RMS—and be able to resolve yearly changes with an accuracy better than 25 cm/yr.
- Measurement maturity: ICESat-2 is being flown to test the capability of a photon-counting lidar system. Airborne lidars have been used for much of the last decade over Greenland and Antarctica as part of Operation Icebridge.
- Trade-space definition: Extended time series of observations are necessary, and so one-off missions or long gaps between missions will reduce the usefulness of the data. Lidar-based ice-topography change has higher resolution than satellite gravity, making it a better tool for observing the mass
- balance of individual glacier systems. However, this calculation requires an estimate of snow density and the amount of firn on the ice in order to deduce mass change from the surface topography change. The trend in ice topography is also sensitive to errors in glacial isostatic adjustment models.
- Continuity versus new: A mission beyond ICESat-2 is required to meet the goals of continuous observations of ice topography change in order to study glacier-scale dynamics. Improved systems to reduce error in height and improve spatial coverage would be beneficial.
Snow Density
Snow density is required to correct ice topography change measurements in order to derive ice mass change (Objective S-3a).
- Measurement basis: Snow density can currently be estimated from passive microwave radiometers and models with a resolution of several hundred kilometers and an accuracy of 4-5 cm RMS in terms of snow-water equivalent. Experiments have also used SAR data to obtain snow density with an accuracy of 0.03 g/cm3 averaged over broad regions of the Himalayas.
- Measurement maturity: Estimation of snow density from passive microwave radiometers and models is mature, but is only accurate at spatial scales larger than ice topography measurements. Use of SAR data is still mainly experimental, but shows promise of higher accuracy and smaller horizontal resolution.
- Trade-space definition: To be most useful for ice topography data, the resolution needs to be close to that of the satellite lidar systems (~10 km × 10 km). However, if snow and firn is isotropic on the ice sheet, lower spatial resolutions could be used.
- Continuity versus new: No specific satellite instruments are needed; the calculations can be made from instruments used for other objectives.
Surface Melt
Surface melt is useful for determining where the surface of the ice sheet is melting (Objective S-3a).
- Measurement basis: The areal extent of surface melt can be deduced from visible imagery from space, but provides no quantitative information on the amount of mass lost.
- Measurement maturity: Current optical imagery is sufficient to detect and measure extent of surface melt. Thus, the technique is mature.
- Trade-space definition: A high-resolution image (~1 m pixel size) would be most useful. Daily observations of the ice sheet would be useful, but at least weekly would be sufficient.
- Continuity versus new: No new instruments are needed, just continuation of optical sensors or accessibility to commercial optical data.
RESULTING SOCIETAL BENEFIT
Implementing the program outlined earlier would create numerous societal benefits. At short time scales the greatest benefit likely derives from hazard mitigation: a goal that requires the ability to forecast, quantify, and lessen the impact of major impulsive events. At longer time scales, the ability to characterize the evolution of Earth’s surface as a function of interactions among topography, weather, climate, ecology, hydrology, and society provides a basis to delineate the combinations of initial conditions and external
forcing (natural and anthropogenic) that drive both abrupt and incremental landscape change, ranging from landslides and floods to topsoil loss and groundwater depletion. The observations proposed here promise to lead to a marked improvement in quantifying the processes that drive landscape change and impact habitability. Notable societal benefits for implementing each major science question include the following:
- Forecasting natural disasters, including the timing and size of earthquakes and any associated tsunamis, the timing and duration of volcanic eruptions, and the timing and location of landslides. The most costly natural disaster in world history was the 2011 M9.0 Tohoku earthquake and tsunami, but even smaller events, such as the 2010 Eyjafjallajökull volcanic eruption in Iceland, take a toll on society. Satellite-based measurements are the only practical means for monitoring geological hazards around the world: key information for making forecasts.
- Responding rapidly to natural disasters and mitigating their consequences. The “library” of high-resolution space-based observations of disaster-prone areas permits rapid quantification of the impacts of geological disasters on landscapes and societal infrastructure, both during the event and in its aftermath. Detectable impacts may be caused by impulsive events, such as earthquakes or volcanic eruptions, or by more sustained events, such as drought or extensive wildfires.
- Understanding and forecasting how sea level will change along coastlines, where ~600 million people currently live. Sea-level rise on the coast is a product of changes in ocean volume and mass, as well as vertical land motion. Remote sensing measurements of sea-surface height and ice-sheet characteristics are essential for understanding the drivers and rates of sea-level change. Space- and land-based geodesy permit quantification of the amount and rate of uplift or subsidence of the land surface. When these data are combined with high-resolution coastal topography, the magnitude of both incremental inundation and storm-driven flooding can be forecast and potentially mitigated.
- Quantifying global, decadal landscape change and how that change affects the groundwater, soil, and biological resources on which society depends. Most landscapes are shaped incrementally by fluvial, hillslope, coastal, cryospheric, and ecological processes. The use of high-resolution time series underlies the ability to delineate trends of change and to develop societal strategies to mitigate or arrest changes that threaten societal health and sustainability.
- Monitoring, understanding, and forecasting spatial and temporal variations of Earth’s magnetic field. Global navigation and protection from excessive cosmic radiation depend on the shape, strength, and persistence of Earth’s magnetic field. A constellation of satellites with vector magnetometers can measure spatial and temporal variations in the magnetic field needed to update global geomagnetic field models.
- Quantifying mantle convection to understand how it drives plate motions and generates earthquakes and volcanic eruptions. Mantle tractions drive lithospheric strain accumulation that loads faults, causes earthquakes, and triggers volcanism. Space- and land-based geodetic measurements, combined with seismic models, are used to predict mantle motions. A more accurate terrestrial reference frame and a detailed long-term land surface deformation field serve to quantify the level of mantle coupling. Together, this information will underpin improved forecasts of crustal deformation and the resultant seismic and volcanic hazards, and inform strategies to enhance resilience to destructive earthquakes and eruptions.
- Understanding temporal variations of subsurface water storage and transport. Global population growth and increasing extraction of groundwater for agricultural, municipal, and industrial uses are depleting this truly vital resource. Both geodesy and gravity measurements enable systematic tracking of the location and pace of groundwater extraction, which is growing in importance, given the mismatch between the rapid rate of withdrawal and the slow infiltration that replenishes groundwater supplies.
- Improving the discovery and management of energy, mineral, and soil resources. The chemical composition of these resources can be mapped using high-resolution spectral imaging, and data from moderate-resolution multispectral satellites and SAR satellites can be used to detect and monitor surface oil spills, dispersal plumes, contaminants, soil loss, nutrient depletion, and ecological change.
Overall, many Earth surface and interior processes are caused or influenced by anthropogenic activity. Today, tectonically inactive areas are riddled with earthquakes owing to wastewater injection, and invasive species and wildfires are adversely affecting landscape stability, nutrient availability, and overall sustainability. Together, detailed topography, temporally dense time series of high-resolution imagery, and highly resolved geodetic measurements are key elements for defining rates of change, forecasting developing hazards, and creating new strategies to reduce harmful societal impacts.
REFERENCES
Ablain, M., J.F. Legeais, P. Prandi, M. Marcos, L. Fenoglio-Marc, H.B. Dieng, J. Benveniste, and A. Cazenave. 2017. Satellite altimetry-based sea level at global and regional scales. Surveys in Geophysics 38(1):7-31.
Bettinelli, P., J.P. Avouac, M. Flouzat, L. Bollinger, G. Ramillien, S. Rajaure, and S. Sapkota. 2008. Seasonal variations of seismicity and geodetic strain in the Himalaya induced by surface hydrology. Earth and Planetary Science Letters 266(3-4):332-344.
Booth, A.M., S.R. LaHusen, A.R. Duvall, and D.R. Montgomery. 2017. Holocene history of deep-seated landsliding in the North Fork Stillaguamish River valley from surface roughness analysis, radiocarbon dating, and numerical landscape evolution modeling. Journal of Geophysical Research: Earth Surface 122(2):456-472.
Brantley, S.L., M.B. Goldhaber, and K.V. Ragnarsdottir. 2007. Crossing disciplines and scales to understand the critical zone. Elements 3(5):307-314.
Bürgmann, R., G. Hilley, A. Ferretti, and F. Novali. 2006. Resolving vertical tectonics in the San Francisco Bay Area from permanent scatterer InSAR and GPS analysis. Geology 34(3):221-224.
Carn, S.A., L. Clarisse, and A.J. Prata. 2016. Multi-decadal satellite measurements of global volcanic degassing. Journal of Volcanology and Geothermal Research 311(1):99-134.
Chambers, D.P., A. Cazenave, N. Champollion, H. Dieng, W. Llovel, R. Forsberg, K. von Schuckmann, and Y. Wada. 2017. Evaluation of the global mean sea level budget between 1993 and 2014. Surveys in Geophysics 38(1):309-327.
Chu, W., T.T. Creyts, and R.E. Bell. 2016. Rerouting of subglacial water flow between neighboring glaciers in West Greenland. Journal of Geophysical Research: Earth Surface 121(5):925-938.
Church, J.A., P.U. Clark, A. Cazenave, J.M. Gregory, S. Jevrejeva, A. Levermann, M.A. Merrifield, et al. 2013. Sea level change. In Climate Change 2013: The Physical Science Basis (eds. T.F. Stocker, D. Qin, G.K. Plattner, M. Tignor, S.K. Allen, J. Boschung, A. Nauels, Y. Xia, V. Bex, and P.M. Midgley). Contribution of Working Group I to the Fifth Assessment Report of the Intergovernmental Panel on Climate Change. Cambridge: Cambridge University Press.
Davis, J.L., Y. Fialko, W.E. Holt, M.M. Miller, S.E. Owen, and M.E. Pritchard. 2012. A foundation for innovation: Grand challenges in geodesy. In Report from the Long-Range Science Goals for Geodesy Community Workshop, UNAVCO, Boulder, CO.
Davis, J.L., L.H. Kellogg, J.R. Arrowsmith, B.A. Buffett, C.G. Constable, A. Donnellan, E.R. Ivins, et al. 2016. “Challenges and Opportunities for Research in ESI (CORE).” Report from the NASA Earth Surface and Interior (ESI) Focus Area Workshop, November 2-3, 2015, Arlington, VA.
DeCelles, P.G., and K.A. Giles. 1996. Foreland basin systems. Basin Research 8:105-123.
Dolan, P., D. Burggraf, K. Soofi, R. Fitzsimmons, E. Aydemir, O. Senneseth, and L. Strickland. 2004. “Challenges to Exploration in Frontier Basins—The Barbados Accretionary Prism.” Presented at the AAPG International Conference and Exhibition, October 24-27, Cancun, Mexico.
Gouhier, M., and D. Coppola. 2011. Satellite-based evidence for a large hydrothermal system at Piton de la Fournaise volcano (Reunion Island). Geophysical Research Letters 38(2):L02302.
Han, S.C., R. Riva, J. Sauber, and E. Okal. 2013. Source parameter inversion for recent great earthquakes from a decade-long observation of global gravity fields. Journal of Geophysical Research Solid Earth 118(3):1240-1267.
Han, S.C., J.M. Sauber, and F. Pollitz. 2014. Broad-scale postseismic gravity change following the 2011 Tohoku-Oki earthquake and implications for deformation by viscoelastic relaxation and afterslip. Geophysical Research Letters 41(16):5797-5805.
Han, S.C., J.M. Sauber, and F. Pollitz. 2015. “Postseismic Gravity Changes Caused by Persistent Viscoelastic Relaxation after a Series of Great Earthquakes since 2004.” Presented at the GRACE Science Team Meeting, September 21-23, Austin, TX.
Harris, N.L., S. Brown, S.C. Hagen, S.S. Saatchi, S. Petrova, W. Salas, M.C. Hansen, P.V. Potapov, and A. Lotsch. 2012. Baseline map of carbon emissions from deforestation tropical regions. Science 336:1573-1576.
Haugerud, R.A., D.J. Harding, S.Y. Johnson, J.L. Harless, C.S. Weaver, and B.L. Sherrod. 2003. High-resolution lidar topography of the Puget Lowland, Washington. GSA Today 13:4-10.
Heimlich, C., N. Gourmelen, F. Masson, J. Schmittbuhl, S.W. Kim, and J. Azzola. 2015. Uplift around the geothermal power plant of Landau (Germany) as observed by InSAR monitoring. Geothermal Energy 3(1):2.
Henney, L., L. Rodríguez, and I. Watson. 2012. A comparison of SO2 retrieval techniques using mini-UV spectrometers and ASTER imagery at Lascar volcano, Chile. Bulletin of Volcanology 74:589-594.
Hilley, G.E., R. Bürgmann, A. Ferrietti, F. Novali, and F. Rocca. 2004. Dynamics of slow-moving landslides from permanent scatterer analysis. Science 304:1952-1955.
Holt, W.E., and G. Shcherbenko. 2013. Toward a continuous monitoring of the horizontal displacement gradient tensor field in southern California using cGPS observations from plate boundary observatory (PBO). Seismological Research Letters 84(3):455-467.
Hurst, M.D., S.M. Mudd, M. Attal, and G. Hilley. 2013. Hillslopes record the growth and decay of landscapes. Science 341:868-871.
Jasechko, S., J.W. Kirchner, J.M. Welker, and J.J. McDonnell. 2016. Substantial proportion of global streamflow less than three months old. Nature Geoscience 9:126-129.
Kirby, E., and K.X. Whipple. 2012. Expression of active tectonics in erosional landscapes. Journal of Structural Geology 44:54-75.
Kopp, R.E., F.J. Simons, J.X. Mitrovica, A.C. Maloof, and M. Oppenheimer. 2009. Probabilistic assessment of sea level during the last interglacial stage. Nature 462:863-867.
Kreemer, C., G. Blewitt, and E.C. Klein. 2014. A geodetic plate motion and global strain rate model. Geochemistry, Geophysics, Geosystems 15(10):3849-3889.
Kump, L.R., S.L. Brantley, and M.A. Arthur. 2000. Chemical weathering, atmospheric CO2, and climate. Annual Review of Earth and Planetary Sciences 28:611-667.
Lamb, M.P., J.S. Scheingross, W.H. Amidon, E. Swanson, and A. Limaye. 2011. A model for fire-induced sediment yield by dry ravel in steep landscapes. Journal of Geophysical Research 116:F03006.
Lange, H., G. Casassa, E. Ivins, L. Schröder, M. Fritsche, A. Richter, A. Groh, and R. Dietrich. 2014. Observed crustal uplift near the Southern Patagonian Icefield constrains improved viscoelastic Earth models. Geophysical Research Letters 41:805-812.
Lay, T., R.C. Aster, D.W. Forsyth, B. Romanowicz, R.M. Allen, V.F. Cormier, and J. Gomberg. 2009. Seismological Grand Challenges in Understanding Earth’s Dynamic Systems. Report to the National Science Foundation. Washington, DC: IRIS Consortium.
Leuliette, E.W., and R.S. Nerem. 2016. Contributions of Greenland and Antarctica to global and regional sea level change. Oceanography 29(4):154-159.
Lipman, P.W., and D.R. Mullineaux, eds. 1981. The 1980 Eruptions of Mount St. Helens, Washington (No. 1250). Reston, VA: U.S. Department of the Interior, U.S. Geological Survey.
Milne, G.A., and J.X. Mitrovica. 2008. Searching for eustasy in deglacial sea-level histories. Quaternary Science Reviews 27(25-26):2292-2302.
Molnar, P., and P. England. 1990. Late Cenozoic uplift of mountain ranges and global climate change: Chicken or egg? Nature 346:29-34.
NASEM (National Academies of Sciences, Engineering, and Medicine). 2017. Volcanic Eruptions and Their Repose, Unrest, Precursors, and Timing. Washington, DC: The National Academies Press.
Nerem, R.S., B.D. Beckley, J.T. Fasullo, B.D. Hamlington, D. Masters, and G.T. Mitchum. 2018. Climate-change-driven accelerated sea-level rise detected in the altimeter era. Proceedings of the National Academy of Sciences 115(9):2022-2025.
NRC (National Research Council). 2010a. Landscapes on the Edge: New Horizons for Research on Earth’s Surface. Washington, DC: The National Academies Press.
NRC. 2010b. Precise Geodetic Infrastructure: National Requirements for a Shared Resource. Washington, DC: The National Academies Press.
NRC. 2012a. New Research Opportunities in the Earth Sciences. Washington, DC: The National Academies Press.
NRC. 2012b. Sea-Level Rise for the Coasts of California, Oregon, and Washington: Past, Present, and Future. Washington, DC: The National Academies Press.
Pail, R., R. Bingham, C. Braitenberg, H. Dobslaw, A. Eicker, A. Güntner, M. Horwath, E. Ivins, L. Longuevergne, I. Panet, and B. Wouters. 2015. Science and user needs for observing global mass transport to understand global change and to benefit society. Surveys in Geophysics 36(6):743-772.
Peltier, W.R., and R.G. Fairbanks. 2006. Global glacial ice volume and Last Glacial Maximum duration from an extended Barbados sea level record. Quaternary Science Reviews 25:3322-3337.
Porder, S., G.P. Asner, and P.M. Vitousek. 2005. Ground-based and remotely sensed nutrient availability across a tropical landscape. Proceedings of the National Academy of Sciences 102(31):10909-10912.
Prata, A.J., and J. Kerkmann. 2007. Simultaneous retrieval of volcanic ash and SO2 using MSG-SEVIRI measurements. Geophysical Research Letters 34(5):L05813.
Pritchard, H.D., R.J. Arthern, D.G. Vaughan, and L.A. Edwards. 2009. Extensive dynamic thinning on the margins of the Greenland and Antarctic ice sheets. Nature 461:971-975.
Pritchard, M.E., and M. Simons. 2004. An InSAR-based survey of volcanic deformation in the central Andes. Geochemistry, Geophysics, Geosystems 5(2).
Reath, K.A., M.S. Ramsey, J. Dehn, and P.W. Webley. 2016. Predicting eruptions from precursory activity using remote sensing data hybridization. Journal of Volcanology and Geothermal Research 321:18-30.
Savage, J.C., and W. Thatcher. 1992. Interseismic deformation at the Nankai Trough, Japan, subduction zone. Journal of Geophysical Research: Solid Earth 97(B7):11117-11135.
Smith, B.E., H.A. Fricker, I.R. Joughin, and S. Tulaczyk. 2009. An inventory of active subglacial lakes in Antarctica detected by ICESat (2003-2008). Journal of Glaciology 55(192):573-595.
Stanley, T., and D.B. Kirschbaum. 2017. A heuristic approach to global landslide susceptibility mapping. Natural Hazards 87(1):145-164.
Syvitski, J., A.J. Kettner, I. Overeem, E.W.H. Hutton, M.T. Hannon, G.R. Brakenridge, J. Day, C. Vörösmarty, Y. Saito, L. Giosan, and R.J. Nicholls. 2007. Sinking deltas due to human activities. Nature Geoscience 2:681-686.
Voigt, S., F. Giulio-Tonolo, J. Lyons, J. Kučera, B. Jones, T. Schneiderhan, G. Platzeck, et al. 2016. Global trends in satellite-based emergency mapping. Science 353(6296):247-252.
Willett, S.D. 1999. Orogeny and orography: The effects of erosion on the structure of mountain belts. Journal of Geophysical Research: Solid Earth 104(B12):28957-28981.
Willett, S.D., S.W. McCoy, J.T. Perron, L. Goren, and C. Chen. 2014. Dynamic reorganization of river basins. Science 343(6175).
Zoback, M.L., E. Geist, J. Pallister, D.P. Hill, S. Young, and W. McCausland. 2013. Advances in natural hazard science and assessment, 1963-2013. Geological Society of America Special Paper 501:81-154.


