


Below is the uncorrected machine-read text of this chapter, intended to provide our own search engines and external engines with highly rich, chapter-representative searchable text of each book. Because it is UNCORRECTED material, please consider the following text as a useful but insufficient proxy for the authoritative book pages.
34 Introduction Based on the rationale provided in the previous chapter, the following states and services were chosen for regional rural case studies: 1. California: Lake Transit Authority 2. Colorado: Colorado Department of Transportation Statewide NetworkâBustang and South Central Council of Governments 3. Iowa: Regional XII Council of Governments Western Iowa TransitâDenison to Harlan Commuter Service 4. Kansas: Statewide Regional Transit ModelâFlint Hills Implementation, Transportation Works for Kansas 5. Maine: Portland Intercity Service, ShuttleBus-Zoom 6. Michigan: Alger County Transit 7. Minnesota: Minnesota Department of TransportationâCentral Community Transit Implementation âTransit for our Futureâ Initiative 8. Montana: Flathead Transit and North Central Montana Transit, Regional Connections Fostered Through Community Organizations 9. New Mexico: New Mexico Regional Transit Districts, North Central Regional Transit District 10. Oregon: Oregon Department of Transportation Transit Network Program, North by North- west Connector Program 11. Vermont: Rural Regional ServicesâJoint Schedules on Regional Routes 12. Wisconsin: Regional Service in Southwest Wisconsin, Scenic Mississippi Regional Transit Bus Each of these case studies is presented within this chapter. Chapter 5 addresses the lessons learned from the case studies. Case Study: California Lake Transit Authority Introduction Lake Transit Authority (LTA) operates fixed route and demand response public transportation in Lake County, Cali- fornia, with connecting regional bus services in Napa and Men- docino Counties. The agency was created in 1996 and recently celebrated its twentieth anniversary. The overall vision state- ment is clear and simple: âMobility for all citizens of Lake County.â In order to achieve this, LTA provides different types C h a p t e r 4 Case Studies Source: Courtesy of Lake Transit Authority. Lake Transit logo. Source: Courtesy of Lake Transit Authority. Lake Transit bus.
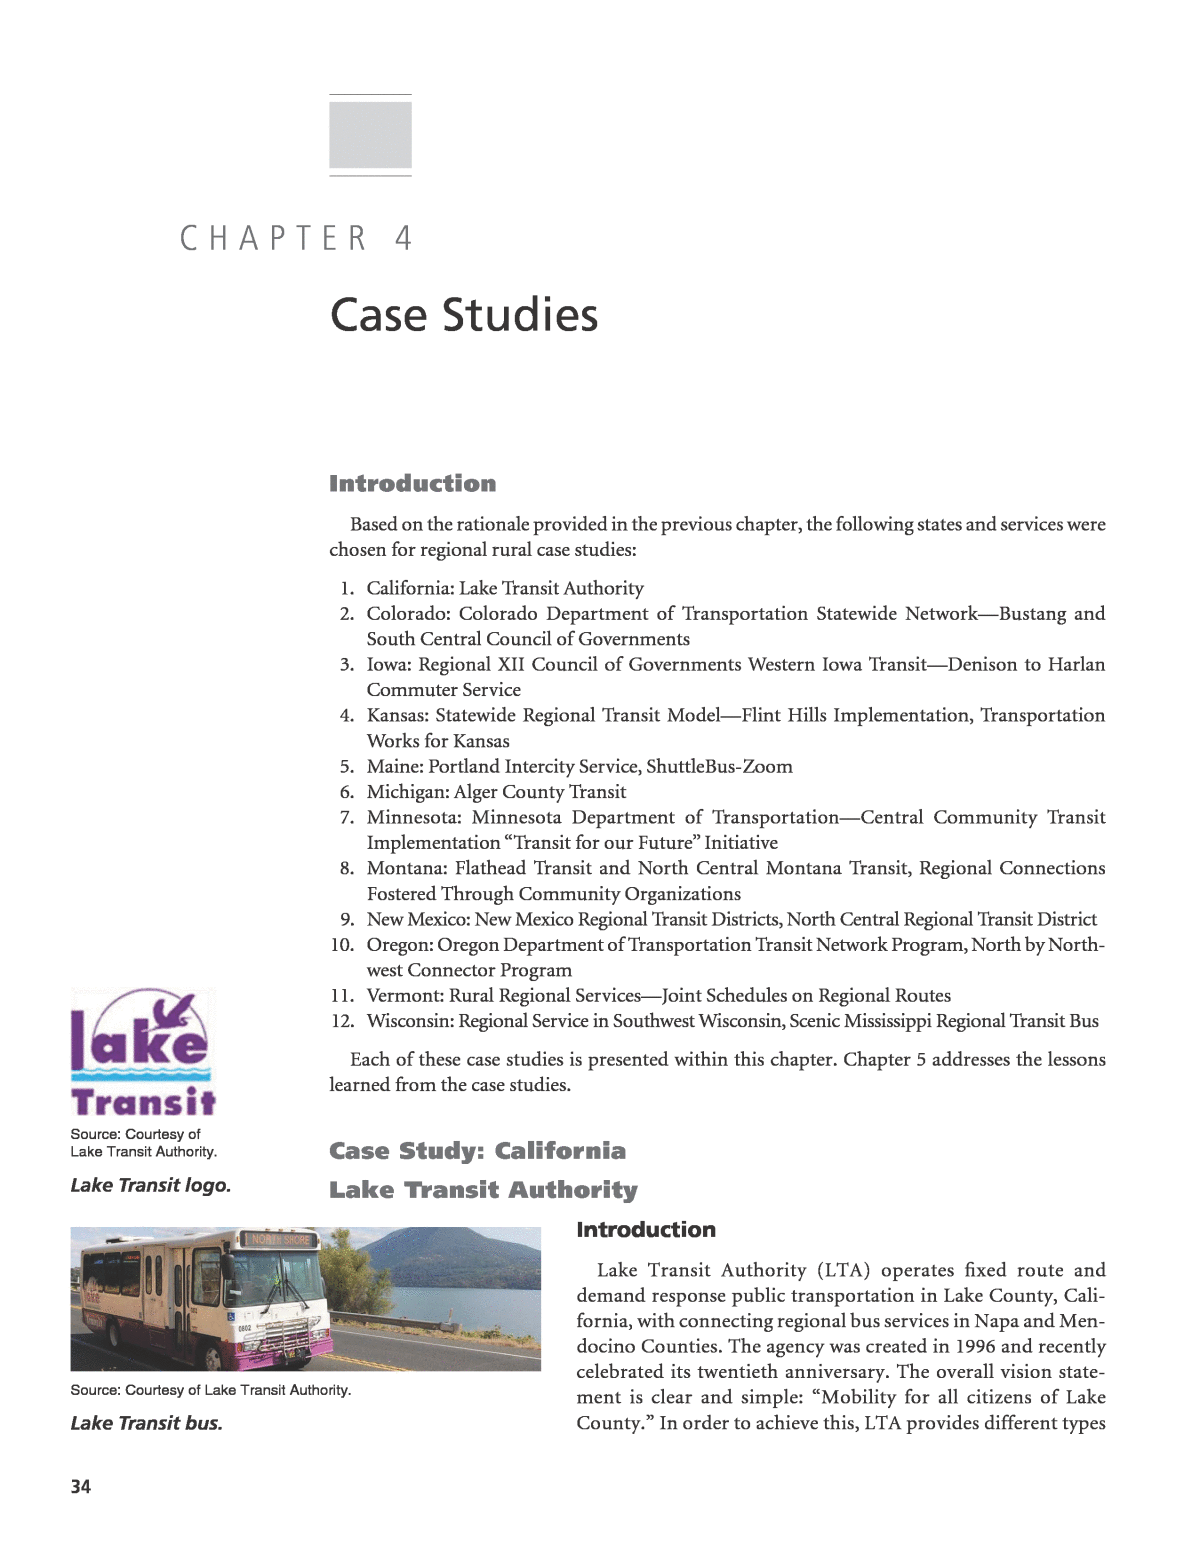
Case Studies 35 of services, including routes that it describes as regional and intercity, that provide connec- tivity between local services in Lake County and larger destinations (and transit hubs) like Napa (Calistoga, Deer Park) and Mendocino (Ukiah) Counties. LTA uses Section 5311(f) rural intercity funding for its regional services because these services make connections with the national intercity network outside the county, even as they meet regional needs for a variety of trip purposes. Organizational Structure LTA is a JPA under California legislation that facilitates creation of multi-jurisdictional enti- ties to meet public needs. The three components of the JPA are Lake County, City of Clearlake, and City of Lakeport. There is no direct participation from Mendocino or Napa Counties. The LTA is governed by an eight-member board: two members of the County Board of Supervisors, two Lakeport City Council members, two Clearlake City Council members, and two citizens selected by the Lake County Board of Supervisors. This board governs the Lake County/City Area Planning Council, which is the Regional Transportation Planning Agency that allocates and administers Local Transportation Funds and State Transit Assistance funds in the region. It is also the designated Consolidated Transportation Services Agency (CTSA) for Lake County. CTSA coordinates public transit and human service transportation. LTA contracts for transit management services and a separate contractor provides transit operations and maintenance. There are no public employees involved in managing, operating, or maintaining transit services in Lake County, although there is consideration being given to making the Transit Manager an employee. State Context and Policy Development The State of California provides a regulatory and funding framework that can support regional services by facilitating the creation of JPAs through the designation of regional organizations to allocate and administer state transportation and transit funds, and by designation of regional coordination entities. The California Department of Transportationâs Division of Rail and Mass Transportation (DRMT) utilizes FTA Section 5311(f) funding to provide regional routes for a number of providers. There are currently 33 subrecipients providing regional intercity routes under this program, and program expenditures have grown beyond the 15 percent Section 5311(f) set-aside. According to DRMT the major limiting factor for further growth in rural regional services is a lack of funding. The existing regional operators in the program are now facing an across the board funding reduction because the state has used previous reserves and is now limited to the 15 percent allocation from the Section 5311 program. Caltrans sees significant demand for fund- ing for these types of regional services, but is unable to meet it at current funding levels. Because Lake Transit is not a unique program in its use of Section 5311(f) funding for regional routes, Caltrans has not provided any special or unique support to Lake Transit, although Caltrans has identified it as an exemplary program of this type. Example of Regional and Intercity Services LTA operates a variety of service types to meet service needs. There are 10 routes: 6 are iden- tified as regional and intercity (see Figure 4â1) and 4 routes are funded in part with Section 5311(f) funding, crossing county lines to make connections with systems in other counties.
36 Best practices in rural regional Mobility Route 7 LakeportâUkiah operates four times per day between Lakeport (Lake County) and Ukiah (Mendocino County). In Ukiah, there are connections to Greyhound (at the airport), Amtrak Thruway bus, and Mendocino Transit Authority (MTA). MTA and Amtrak Thruway bus connections are at Pear Tree Center and the airport. There is an express service, with sched- uled stops at Mendocino College and Veterans Clinic in Ukiah (as well as the other transporta- tion terminals). LTA accepts transfers from MTA for a $1.00 discount on its fares, and has free transfers to other LTA buses (if the trip is within the same fare zone as the transfer point). The four round trips are not scheduled to serve commuters, though there are morning and evening trips. By having that much frequency, there is good connectivity to Greyhound and Amtrak Thruway buses. Route 7 operates Monday through Saturday. The route is approximately 35 miles long, and one-way travel time is scheduled for just under 90 minutes. At the eastern end of the route, in Lakeport, the Route 7 bus is interlined with Route 4. Route 4 LakeportâClearlake provides eight daily round trips in this corridor along the south side of Clear Lake, of which four in each direction offer interlined connections with Route 7. These trips are an extension of the intercity/regional route to the eastern end of the county. This service is funded in part with Section 5311(f) rural intercity funding. Schedules on this route are hourly in the morning and evening, with 2-hour headways for some late morning and later evening trips. One-way running time is about 50 minutes to cover 27 miles. Stop locations are at major intersections and key shopping centers. Service is Monday through Saturday; the last westbound trip and first eastbound trip in the morning do not operate on Saturday. Route 3 ClearlakeâDeer Park provides a connection to Napa County, with transfer oppor- tunities to the Napa VINE Route 10 Calistoga Shuttle or to the St. Helena Shuttle in Calistoga. Source: Courtesy of Lake Transit Authority. Figure 4â1. Lake Transit routes.
Case Studies 37 Transfers are accepted each way between the two systems. This route offers four daily roundtrips, with two of them extending to St. Helena Hospital in Deer Park. The end-to-end scheduled run- ning time is approximately 85 minutes to cover 45 miles for trips that connect Clearlake and Deer Park. Another major destination on the route is Twin Pine Casino. There is also ridership from students and staff at a charter school in Middletown. This route is partly funded with Sec- tion 5311(f) rural intercity funding, based on the connection to VINE service and its connection to the intercity network. LTA lists other routes as regional or intercity, but they do not cross county lines or connect with intercity modes. LTA has several local routes in Lake County, and provides ADA paratransit dial-a-ride services where fixed route service requires it. Ridership and User Characteristics These three routes serve a very rural area. The population of key stops on these three rural intercity routes is presented in Table 4â1. The largest city is Ukiah, with a population of 16,075 in 2010. Clearlake has a population of 15,250. Other stops range in population from just over 1,000 to 5,000. Table 4â2 presents information about the characteristics of users and trips on three intercity routes and a comparison with the entire system. These regional routes are somewhat differ- ent from the overall system. Route 3 and Route 4 provide connectivity to points outside Lake County and also serve educational institutions, accounting for the higher student/college rider- ship. These longer routes have lower boardings per hour than the system as a whole. Riders on these regional routes are somewhat less transit dependent, and have incomes comparable with those of passengers systemwide. Another major difference is the higher percentage of passengers making long-distance bus connections. Eleven percent of Route 3 and 10 percent of Route 7 riders are making connections, compared with 4 percent systemwide (the same percentage as Route 4, which is entirely within Lake County). Farebox recovery levels are comparable between intercity routes taken as a group and the system, though the Ukiah route has lower ridership (boardings) and farebox recovery. Funding One of the unique things about Lake Transit intercity routes is that they are funded in part with FTA Section 5311(f) rural intercity funding. Like most transit systems, farebox revenue Stop Location County Population Ukiah Mendocino 16,075 Upper Lake Lake 1,052 Lakeport Lake 4,753 Kelseyville Lake 3,353 Clearlake Lake 15,250 Middletown Lake 1,323 Calistoga Napa 5,155 Deer Park Napa 1,267 Source: U.S. Census Bureau. American FactFinder, Census 2010 Population. Table 4â1. Populations of major stops on Lake Transit Regional Intercity Routes 3, 4, and 7.
38 Best practices in rural regional Mobility is the initial source for operating funding, but that leaves a significant net operating deficit. In California, there are a number of potential sources of transit funding for such systems. These include Local Transportation Funds (LTF), generated from a quarter-cent sales tax collected in the county. These funds are used for a variety of purposes in addition to the allocation provided to Lake County Transit. State Transit Assistance (STA) funds are provided by the state from fuel excise taxes. Federal funds administered by Caltrans include the Section 5311 non-urbanized area funding program, utilized by Lake Transit as part of the funding mix. All of these sources are fairly typical for rural transit systems. Lake Transit is able to use the Section 5311(f) rural intercity funding program for regional intercity routes. These funds are administered by Caltrans through a separate application pro- cess. Although Lake Transit does not currently take advantage of it, Caltrans complements Sec- tion 5311(f) by providing toll credits for local match for new services. Lake Transit has been able to use Section 5311(f) funds for capital to purchase buses for regional intercity routes, but it has depended on this funding source for operation of its regional intercity routes. Route 3 Route 4 Route 7 System 2008 Ridership1 20,168 40,000 12,992 326,8744 2014 Ridership1 21,000 38,000 17,027 335,328 2015 First Half2 10,372 20,065 7,509 196,461 2015 Annualized2 20,744 40,130 15,018 392,922 Passengers/Rev Hr. (first half 2015) 2 5.77 9.17 4.16 7.18 Farebox Recovery 19.6% 24.9% 9.5% 19.2% User Characteristics3 Employed Full-time 12 15 11 18 Part-time 33 19 33 18 Retired 15 7 59 20 Not Employed 39 59 56 44 Student Ridership 45 29 63 31 Income Below $35K 100 92 86 92 Income Below $10k 27 57 60 47 Transit Dependent (No car, no license, or neither) 72 85 85 94 Trip Purpose School/College 31 28 45 21 Work 25 7 20 23 Shopping 11 28 15 26 Recreation 17 17 20 19 Medical 8 24 15 17 Social Services 3 17 15 7 Long-Distance Conn. 11 4 10 4 Sources: 1Lake County/City Area Planning Council, Transit Development Plan & Marketing Plan, Final Report, June 2015, pp. 6â4, 6â9, 6â15. Total System Ridership is from 2010â2011, p. 1â6. 2 Lake Transit Authority 2015â2016 First Half Report, June 11, 2016. 3 Lake County/City Area Planning Council, Transit Development Plan & Marketing Plan, Final Report, June 2015, pp. 2â5 to 2â11. 4 2010â2011. Table 4â2. Lake Transit intercity/regional ridership and user characteristics.
Case Studies 39 Caltrans requires that routes funded under this program be 50 miles or longer, and has set a ceiling of $300,000 per year per operating grant. Federal guidance for Section 5311(f) calls for services to provide a âmeaningful connectionâ to the national intercity bus network. FTA defines âmeaningful connectionâ in terms of serving common stops with schedules allowing transfers to and from intercity bus services. Lake Transitâs Route 7 provides a connection to the Greyhound network in Ukiah (Mendocino County), and on Route 3 to VINE routes that connect to intercity services in Calistoga (Napa County). Route 4 is funded under this program because it provides connections between these two routes. The three routes function together as one long multi- county route. Federal Section 5311(f) requirements stipulate that these funds not be used for commuter services. An examination of Lake Transit schedules for Routes 3, 4, and 7 shows they are designed to make meaningful connections with Greyhound services and Amtrak Thruway buses, with schedules throughout the day to permit a variety of trip purposes, including school/ college, shopping, medical, work, and intercity connections. Lessons Learned ⢠Through careful service design, regional routes can be developed that serve a variety of trip purposes and make meaningful connections to national intercity bus services. ⢠Connectivity through shared stops, scheduling, and fare transfer policies are important ele- ments in developing viable services. ⢠Even in very rural areas, rural regional intercity services can generate ridership and farebox recovery levels comparable with many local rural fixed route services. California Case Study Bibliography and Selected Sources Lake County/City Area Planning Council. Transit Development Plan & Marketing Plan. Final Report, Mobility Planners, AMMA Transportation Planning, and Transit Marketing LLC, June 2015. Lake Transit Authority. 201516 First Half Report Executive Summary, Operating Statistics Summary, and Finan- cial Status Report. Presented at the Lake Transit Authority Board Meeting, May 11, 2016. http://laketransit. org/wp-content/uploads/2014/04/5-11-16-LTA-Agenda-Packet-Final.pdf. Ogbonna, James. California Department of Transportation, Division of Rail and Mass Transportation, Branch Chief, telephone interview, March 30, 2017. U.S. Census Bureau. American FactFinder, Census 2010 Population. http://factfinder.census.gov/faces/nav/jsf/ pages/community_facts.xhtml. Wall, Mark. Lake Transit, Transit Manager, email communication, July 1, 2016. Case Study: Colorado Colorado Department of Transportation Statewide NetworkâBustang and South Central Council of Governments Introduction This case study presents a state DOT that is implementing a state-led approach for the creation of a statewide network of intercity and regional services to provide needed connectivity and transportation choices between rural and small urban places and the stateâs major urban areas. In the past, Coloradoâs tran- sit program was completely discretionary with regard to local or regional services. However, as the state became involved in choosing routes and services for a statewide intercity network, it identified regional needs as well and so became more involved Source: Bustang website, http://www.ridebustang.com/. Bustang bus.
40 Best practices in rural regional Mobility in planning for and then implementing such service. Local initiatives to develop projects that would result in a statewide network often run into institutional issues which the state has helped to overcome. Organizational Structure The Division of Transit & Rail (DTR) in the CDOT â. . . is responsible for planning, develop- ment, operation and integration of transit and rail into the statewide transportation system.â It was created by the legislature in 2009, and administers federal and state transit grant programs in Colorado. The state grant program is known as FASTER, and was created by the same legislation that created the transit division. DTRâs guiding principles include the creation of more modal choices; increased mobility from connecting networks of local, regional, and intercity services; and partnering with local agencies, transit providers, the private sector, and other stakeholders. These guiding principles have come into play as DTR has taken the responsibility to create a linked statewide network of services that includes local transit agencies, private contractors, and unsubsidized private transit providers. State Context and Policy Development There is history that has led to the DTR taking an active role in creating a statewide network. In the mid-1980s, the state transit program was faced with the loss of all Trailways intercity bus service when the firm pulled out of the state. Although there was also Greyhound service, Trailways had provided a comprehensive network of regional services. Some of these regional intercity routes were replaced by Greyhound and its affiliate Texas, New Mexico and Oklahoma Coach Lines (TNM&O). A number of these routes were funded by CDOT under the FTA rural intercity bus program (initially called Section 18[i], later Section 5311[f]). In addition, some local transit operators developed regional connections to fill gaps. In 2005, Greyhound merged TNM&O into the parent company and eliminated unprofitable routes as part of a national restructuring. The former TNM&O east-west route across the state on U.S. 50, although funded by CDOT, was eliminated, and communities along that route asked CDOT for assistance. CDOT provided funding for a study of options and eventually led to CDOT issuing a grant solicitation using Section 5311(f) funding for service from Gunnison to Salida to Denver, and for a feeder connection from Pueblo to Salida. Subsequently CDOT developed and issued route specific solicitations for service in the U.S. 40 corridor for service between Denver and Salt Lake City (funded jointly with Utah), support for services to rural points on I-76 in northeastern Colo- rado, and finally for service on U.S. 50 east from Pueblo to Wichita (jointly funded with Kansas). To evaluate these services and identify where similar services might be justified in the future, CDOT conducted the Colorado Statewide Intercity and Regional Bus Network Study in 2008. An update was completed in 2014. These studies proposed a statewide intercity network that included services provided by the market and a number of subsidized routes that could be largely funded under Section 5311(f). It also identified a need for a statewide network of regional services. The regional network defined different levels of proposed service depending on the marketâ with low levels in corridors primarily addressing human service transportation needs, and high- frequency service for commuter services into major employment centers. The regional network included a number of services already provided by local public transit systems, and a substantial expansion of both existing and new services. At that time there was no funding available for these expanded regional services. Shortly after the 2008 plan, the state legislation reorganized the transit program at CDOT, creating DTR, and providing state funding for some transit projects. Initially the funding
Case Studies 41 was limited to capital funding and was provided to local systems under a competitive dis- cretionary grant program. It also provided a basis for future transit program development. The other development during this period was the loss of regional commuter service from Colorado Springs into Denver. This service, branded as FREX, ended when a sponsoring local jurisdiction declined to provide needed funding. Therefore, CDOTâs update of the statewide regional and intercity bus plan in 2014 included a focus on three items: developing a proposal for CDOT operation of commuter bus service into Denver; maintaining intercity service; and enhancing the rural regional service to complete the network. The plan further defined regional services as those including long-distance commuter service into the urbanized area and rural regional service, thus allowing rural/small town residents to make a one-day round trip to and from regional activity centers, as well as less than daily essential service for human service needs. Subsequently, the recommendations of this plan were included in the 2015 Statewide Transit Plan, which documented the unmet needs (see Figure 4â2) and the existing ser- vices operated by local public transit entities that could be classified as regional services (see Figure 4â3). Source: Colorado Statewide Transit Plan, p. 78. Figure 4â2. Statewide regional and inter-regional service gaps.
42 Best practices in rural regional Mobility Following these studies, CDOT moved to implement the commuter bus recommendations, using state FASTER funding now available for operating assistance. The service, under the âBustangâ brand, is operated under contract to CDOT and has been well received. Ridership in the first year exceeded forecasts. Additional planning and strategy development work focusing on the intercity and rural regional network resulted in more detailed route and service proposals. This included potential timetables (to consider potential connections, the possibility of in-kind match, and assessment of duplication of unsubsidized service); a strategy for shifting intercity program routes to competitively bid contracts; and extending the statewide branding concept to rural regional services and the intercity network as Bustang âOutriderâ service, with a goal of implementing a connected statewide network. Funding includes the Section 5311(f) allocation with Greyhound in-kind match for maintaining the intercity network, and a combination of shifting of resources and limited state operating funds to initiate rural regional services. There is more state funding available for capital, and CDOT will be purchasing buses to be used for intercity and rural regional services, which will lower operating costs, improve services, and allow common branding. An example of this approach is the planned development of rural regional services. The over- all approach involves developing an RFP process to contract for intercity and new rural regional services, and working with existing operators to determine if and how they can be integrated into the statewide branded network of commuter, intercity, and rural regional bus routes. The example below describes one of the successful existing rural regional services that addresses criti- cal long-distance medical transportation needs as a case study in itself. It also presents some of the issues involved in expanding that service to serve a broader market as part of the statewide Source: Colorado Statewide Transit Plan, p. 48. Figure 4â3. Regional transit routes in Colorado.
Case Studies 43 network. It demonstrates the important role of human service agency transportation funding in supporting a rural regional service. Example of Regional and Intercity Services SCCOG Transit is the provider of general public transit services in Las Animas and Huerfano Counties in Colorado. It provides door-to-door demand response service locally, serving senior citizens, persons with disabilities, Medicaid clients, and the general public. Much of the demand (and the local service) is concentrated in the cities of Trinidad (2015 city population 8,153) and Walsenburg (2015 population estimate 2,898). SCCOG Transit operates a rural regional route 3 days per week from Trinidad through Walsen- burg and into Pueblo. Trinidad is 86 miles from Pueblo, and is the county seat of Las Animas County; while Walsenburg is 50 miles from Pueblo and is the county seat of Huerfano County. The regional route is open to the general public, and generates approximately 1,500 (1,522 in 2015) round trips per year. The service provides door-to-door service at origin towns and at the destinations. The regional route starts picking up riders at approximately 8:45 a.m., and may also pick up passengers in Aguilar on the way to Walsenburg. It is scheduled to arrive in Pueblo between 10:45 a.m. and 11 a.m., and begins pickup in Pueblo at 3:00 p.m. leaving by 3:30 p.m. (or whenever the last riderâs appointment ends), arriving at the end of the run at about 5:30 p.m. The existing service uses the full capacity of the 12- to 14-passenger accessible cutaway small bus used by SCCOG, particularly when there are persons with mobility devices on board (see Figure 4â4). The buses used by SCCOG on this route are fueled by natural gas. They average 9 to 10 passengers per trip, so buses are generally full, and there are peaks that fill the bus. Approximately 15 percent of riders pay a cash fare ($7.00 from Trinidad, or about $0.08 per mile). The remaining riders have their trips paid for by Medicaid or the Area Agency on Aging. About 45 percent of passengers are on Medicaid, 12 percent are in the Area Agency on Aging pro- gram (over 60 years of age), and about 3 percent are clients of the Las Animas County Rehabilita- tion Center. Medicaid funding is very important for supporting this service. In Colorado, Medicaid will pay for client transportation when it is provided on a multi-passenger vehicle for more than one member at a time. The member travelling the furthest distance is reimbursed at the full rate, the member travelling the second furthest distance is reimbursed at one-half of the rate, and any additional members are reimbursed at one-quarter of the rate. If there are several Medicaid client members on a trip, a significant portion of the cost is covered by Medicaid. The Medicaid program benefits as well, with significant cost savings over sending the members individually. Source: SCCOG. Figure 4â4. Cutaway bus used by SCCOG.
44 Best practices in rural regional Mobility The route between Trinidad, Walsenburg, and Pueblo on I-25 is also served by Greyhound Lines, though the service has been substantially reduced and now consists of two northbound departures from Trinidad at 7:05 a.m. and 2:00 p.m., with the second bus stopping in Walsenburg at 2:40 p.m. Arrivals in Pueblo are at 8:35 a.m. and 3:35 p.m. Southbound from Pueblo there is a single Greyhound bus leaving Pueblo at 2:55 a.m., arriving in Walsenburg at 3:50 a.m. and in Trinidad at 4:30 a.m. These schedules would not allow anyone from Trinidad and Walsenburg the option of a day trip to Pueblo, particularly because the return trip would have to take place in the early morning hours of the following day. Because of the schedule, SCCOG service does not compete with Greyhound even though they serve the same points. The CDOT Regional and Intercity Plan recognized the success SCCOG has had in providing this rural regional service on a scheduled basis, open to the general public, and it proposed building on it as part of the overall state network. The CDOT proposal calls for providing a larger vehicle, a 30-seat coach with lift and at least two wheelchair positions, to allow for a larger load. In addition, the CDOT vision would provide funding to expand the frequency to 5 days per week, which SCCOG estimates would increase ridership from 1,500 trips per year to between 2,500 and 3,000 trips per year. CDOTâs estimate of potential demand is approxi- mately 3,900 trips per year for the expanded service. The CDOT proposal would utilize the transit center in Pueblo (which is also served by Greyhound) as a stop. A route with a similar coach on a similar schedule would eventually be funded to operate from Lamar to Pueblo, meeting the Trinidad bus at the Pueblo transit center. One of the buses would do local drop- offs (and afternoon pick-ups) in Pueblo, while the other bus would continue to Colorado Springs to a timed connection with a Bustang schedule to Denver. The expanded SCCOG service would continue to be operated by the same agency, but vehicle and information would be branded as part of the statewide network. Ticketing would continue to include cash fares, and the option to use a credit card or smartphone payment would be available as part of the statewide system. The CDOT proposal offers a significant expansion of service and capacity and the potential to serve a broader public. It also illustrates a number of the service planning issues that can arise when developing rural regional services. These include the following: ⢠Local pick-up: The larger bus may offer more capacity, but there are questions about whether it can access neighborhoods to do pick-ups at individual residences. With more riders, the time required for service may be too great, making it difficult to make the schedule and subjecting riders to very long pick-up and drop-off rides. A transfer from a separate local small bus or van might be required if the service expands, potentially making the trip more difficult for some users. ⢠Local distribution in Pueblo: A similar issue exists at the other end of the trip. Could a larger vehicle access the medical offices? Would the distribution process for a larger group take too long (particularly if it included riders from the Lamar bus)? ⢠Fare payment: SCCOG believes that most passengers who would be paying a fare do not have credit cards or smartphone apps that would allow them to purchase tickets over the internet, or to pay by phone on boarding. Cash at the farebox will still be needed as a payment method. ⢠Continuation of Medicaid usage/funding: The service is intended to address travel needs that include the need for Medicaid NEMT trips to Pueblo. With limited state funding for operations, CDOT would like to provide incremental funding to expand service, rather than supplant existing Medicaid funding. A concern is that the Medicaid program may decide that this service is a type of intercity bus service, and purchase tickets in lieu of the current funding method. The Medicaid program goal is to provide trips for its members, who have no other transportation, with the least cost to the program. SCCOG staff has expressed interest in the concept of including service in the statewide net- work, and has identified these as critical issues in maintaining the existing rural regional service
Case Studies 45 base. Recognizing that there is already some service in this corridor, and that there are issues to be resolved, CDOT has listed this route to be considered for inclusion in the branded Rural Regional network in FY2017â2018 or the following year. Lessons Learned ⢠Both local and state level planning have identified rural regional needs. There is ongoing involvement in the planning process across levels, with local transit providers and planners participating in the development of state proposals for new service, and state support and involvement in local service planning. ⢠To a much greater extent than most states, there is direct state involvement in the design and implementation of regional services, as exemplified by the CDOT operated Bustang com- muter bus service, but also found in CDOT planning for a statewide network that will include rural intercity bus routes and rural regional services. ⢠The existing SCCOG rural regional route provides a service open to the general public, but its ridership and funding base is human service agency/medical trips that are funded by agencies. ⢠Including human service agency services requires considering service planning issues, sched- uling, capacity, accessibility, pick-up, drop-off, and the requirements of the agency funding programs if this source of support is to continue. It is a goal of CDOT to meet both kinds of needs if possible, with the two types of service combined to create a stronger base. Colorado Case Study Bibliography and Selected Sources Colorado Department of Transportation, Division of Transit & Rail. Transit & Rail Program, Denver, undated. https://www.codot.gov/programs/transitandrail. Colorado Department of Transportation. Colorado Statewide Intercity and Regional Bus Network Study, Denver, 2008. Colorado Department of Transportation, Division of Transit & Rail. Intercity and Regional Bus Network Plan, Denver, April 2014. Colorado Department of Transportation, Division of Transit & Rail. Statewide Transit Plan, Denver, March 2015. LSC Transportation Consultants, Inc. Enhancing Transit Services in South-Central Colorado. Final Report, pre- pared for South Central Council of Governments, April 8, 2014. Vander Broek, Nate. Transit Director, South Central Council of Governments, email communication and tele- phone interview, January 8, 2016. Case Study: Iowa Region XII Council of Governments Western Iowa TransitâDenison to Harlan Commuter Service Introduction This rural transportation service, operated by Region XIIâs Western Iowa Transit, was included as an example of the creative use of multiple funding sources to address a need for a regional service. One-half of the funding comes from a Community Development Block Grant (CDBG) administered by the Iowa Economic Development Administration, 37.5 percent of the funding is from a private employer, Monogram Foods, in Harlan, Iowa, which is in Region III, and ridersâ fares make up the remaining 12.5 percent of the program funding. Monogram Foods Solutions, LLC, founded in 2004, purchased the Harlan plant in 2013. They produce and distribute packaged meat products, snacks, and appetizers. Based in Memphis, Tennessee, they have facilities in Bristol, Indiana; Harlan, Iowa; Chandler, Minnesota; Schulenburg, Texas; Martinsville, Virginia; and Plover, Wisconsin.
46 Best practices in rural regional Mobility Organizational Structure The Region XII Council of Governments (COG) was organized in 1973 to assist local govern- ments in Audubon, Carroll, Crawford, Greene, Guthrie, and Sac Counties in western Iowa (see Figure 4â5). Originally chartered to serve grant-writing and planning needs for the area, the COG has grown into the agency that facilitates multi-community collaboration and develop- ment of all types. Region XII COG has three departments: Local Assistance, Workforce Develop- ment, and Western Iowa Transit. Today, Region XII COG is the transportation planning authority for the region. Western Iowa Transit provides on-demand transportation services in Audubon, Carroll, Crawford, Greene, Guthrie, and Sac Counties. Figure 4â6 shows the location of Region XII in Iowa. Source: Courtesy of Region XII Council of Governments, Inc. Figure 4â5. Region XII Council of Governments building in Carroll, Iowa. Source: Courtesy of Region XII Council of Governments, Inc. Figure 4â6. Region XII in Iowa.
Case Studies 47 State Context and Policy Development Iowa has a long history of regionalizing its transit services, beginning in 1976. Today, Iowa has 99 counties divided into 16 regions. Within each region, a designated transit system or agency is responsible for administering and providing transit service. Service within each rural region is demand response transportation. County governments decide on the level of service within their county. Despite the regional organization of transit, there are few examples of rural regional transit routes crossing county lines or linking different regions. Iowa DOT also uses Sec- tion 5311(f) intercity bus funding to support rural intercity routes that provide connectivity to the major cities and the national intercity bus network. However, there is no particular defined source of funding for regional routes; if a local need is identified, then the county or region is free to address it within the available programs and funding. The ability to implement the regional route described in this case study arose in part because of a change in policy by a different state agency. The Iowa Economic Development Authority (IEDA) updated its federal CDBG program to allow funds to be used for trans- portation to employment. Through the Career Link program, transportation services that remove barriers to employment are eligible. Individuals living in non-entitlement com- munities can receive transportation services to job activities and adult educational training opportunities. The Career Link program is under the CDBG Job Creation, Retention, and Enhancement Fund. Example of Regional and Intercity Services A recent example of the development of a rural regional service in Iowa is the planning and funding for Denison to Harlan commuter service in Region XII. Tysons Foods closed its meat packing plant in Denison, leaving approximately 400 people looking for new employment. During discussions on how to meet the needs of those workers, the Region XII COG real- ized that 27 miles south in Region III, Monogram Foods was looking for new employees (see Figure 4â7). Crawford County, where Denison is located, has an unemployment rate of 5.4 percent of the civilian non-institutionalized population age 16 and older. Harlan, in Shelby County where Monogram Foods is located, has an unemployment rate of 2.8 percent and a smaller labor force. Western Iowa Transit had already been running vanpool commuter service, through its JobJet program in Denison, to the Tyson plant for several years. At the time of the plant closing, it had two full vans serving the plant. Based on this JobJet commuter service, Western Iowa Transit proposed a regional transit service to link approximately 80 employees with a new job site at Monogram Foods in Harlan. Source: Monogram Website, http://www.monogramfoods.com/locations/. Figure 4â7. Monogram Foodâs Harlan location.
48 Best practices in rural regional Mobility The new shuttle service to the Monogram plant has three departure times, serving the three shifts, 5:00 a.m., 6:00 a.m., and 2:30 p.m. The return trips depart at 3:45 p.m., and 12:45 a.m. They have 80 employees who use the service; trips cost $1.00 per day per employee. Service departs from the Walmart parking lot in Denison and arrives at the Monogram plant about 40 minutes later. The shuttle service is posted on Region XII COGâs website and is open to the public. The shuttle started running in March 2016. Ridership and User Characteristics Region XIIâs six counties cover 3,462 square miles in west central Iowa. The combined total population is approximately 74,084 and it has a combined population density of 21.4 people per square mile. Table 4â3 provides land area and population for Crawford and Shelby Counties. Table 4â4 provides a demographic comparison of the two counties. Crawford County is slightly larger, with a slightly larger labor force and higher unemployment rate. Funding A unique combination of funding supports the service. The IEDA is funding 50 percent through the Career Link program, Monogram Foods is funding 37.5 percent, and rider fares are expected to support the remaining 12.5 percent. The Career Link program, part of Iowaâs CDBG programâs Job Creation, Retention, and Enhancement Fund, is an industry driven program investing in training and transportation to help low and moderate income individuals obtain employment. Area Total Population Total Land Area(Square Miles) Population Density (Per Square Mile) Crawford County, IA 17,259 714.19 24.17 Shelby County, IA 12,034 590.78 20.37 Iowa 3,078,116 55,856.86 55.11 United States 314,107,083 3,531,932.26 88.93 Source: U.S. Census Bureau. American Community Survey, 2010â14, Source geography: Tract. Table 4â3. Land area and population for Crawford and Shelby Counties. County Population Land Area (Square Miles) Population Density (Per Square Mile) Percent Population Non-White Percent Population Age 65 or More Percent Population with a Disability Median Family Income Labor Force Number Unem- ployed Unem- ployment Rate Crawford County 17,259 714.19 24.17 8.45% 16.93% 12.19% $56,820 8,989 489 5.4% Shelby County 12,034 590.78 20.37 3.43% 21.90% 15.08% $63,522 7,068 200 2.8% Sources: U.S. Census. American Community Survey, 2012â2014; U.S. Department of Labor Statistics, 2016. Table 4â4. Crawford and Shelby County demographic comparison.
Case Studies 49 The Career Link program provides grants to non-entitlement cities (populations under 50,000) or counties. The funds flow through local government to a non-profit transportation entity providing transportation services predominantly to low to moderate income individuals that reside in non-entitlement communities. Eligible activities include operation of transporta- tion services to job activities and adult educational training and instructional opportunities. The maximum grant award for employment related transportation projects is $150,000, with a 50-percent cash match required. Matching funds can be a combination of funds from participat- ing businesses, and local, state, and federal funds. Thanks to the support from the IEDA and Monogram Foods, 90 people are able to access employment and a new regional route between Denison and Harlan is available to the general public. The CDBG program is an entitlement program under the U.S. Department of Housing and Urban Development (HUD). HUDâs website states that âthe program works to ensure decent affordable housing, to provide services to the most vulnerable in our communities, and to create jobs through the expansion and retention of businesses.â According to the U.S. Office of Community Planning and Developmentâs National Expendi- ture Report for all CDBG disbursements in FY2015, 0.12 percent or $3,796,980 of the national CDBG funds were spent on transportation services. Lessons Learned ⢠This example of rural regional services demonstrates a process for identifying a particular rural regional need, identifying stakeholders, developing a service plan, and obtaining funding from non-traditional sources that may be required to implement rural regional services. ⢠As stated by Chris Whitaker, Local Assistance Director of the Region XII COG: âIt is impor- tant to be open minded, listen to the employer and the employeesâ needs and try and adapt your services to meet some of their needs.â Iowa Case Study Bibliography and Selected Sources Crawford County News. Crawford County Awarded $110,000 Transportation Grant to Support Daily Com- muters, cbc online, March 25, 2016. http://www.1380kcim.com/news/2016/crawford-co-awarded-110000- transportation-grant-to-support-daily-commuters/. Hanson, Nicole. Community Investments Team Leader, Iowa Economic Development Authority, telephone interview, February 24, 2016. HUD Exchange. CDBG National Expenditure Reports (PY02âPY14), Community Development Block Grant Program, U.S. Department of Housing and Urban Development. https://www.hudexchange.info/programs/ cdbg/cdbg-expenditure-reports/. Accessed June 28, 2016. Iowa Economic Development Authority. Job Creation, Retention, and Enhancement Fund, Career Link, 2016. http://www.iowaeconomicdevelopment.com/CDBG/CDBGJob. Monogram Foods Solutions, LLC. http://www.monogramfoods.com/features/. Region XII Council of Governments. Agency Information 2008â2014. http://www.region12cog.org/. Accessed June 14, 2016. Region XII Council of Governments. Transportation Planning. http://www.region12cog.org/local_assistance/ transportation.asp. Accessed June 14, 2016. Region XII Council of Governments. Public Transit. http://www.region12cog.org/western_iowa_public_transit/ public_transit.asp. Accessed June 14, 2016. U.S. Census Bureau. American Community Survey, 2010â2014. U.S. Department of Labor. Bureau of Labor Statistics, April 2016. Whitaker, Chris. Local Assistance Director, Region XII Council of Governments, telephone interview, June 27, 2016.
50 Best practices in rural regional Mobility Case Study: Kansas Statewide Regional Transit ModelâFlint Hills Implementation and Transportation Works for Kansas Introduction The Transportation Works for Kansas (T-WORKS) transportation program is state legisla- tion that supports and encourages a regional approach to transportation across sectors. As part of T-WORKS, the KDOT public transportation program unit assembled a study team consist- ing of KDOT representatives and the consulting teams of Olsson Associates, SRF, and URS to develop a plan titled KDOT Regional Transit Business Model Implementation. This plan rede- fined the regional boundaries based on current travel patterns, creating ten Coordinated Transit Districts (CTDs). Nine of the ten CTDs have primarily rural-focused districts, which are the focus of the implementation plan. The tenth district is urban and comprises Douglas, Johnson, Shawnee, and Wyandotte Counties. Figure 4â8 shows the new CTD boundaries. Previously, Kansas was broken up into 15 CTDs. Within each CTD, stakeholder teams com- posed of transit providers, city and county officials, medical providers, and social agencies were created. KDOT staff facilitates regular meetings of the teams and offers incentives to the teams for implementing the rural regional strategies outlined in the implementation plan. State Context and Policy Development In 1992, the Kansas CTD law formalized the regional trans- portation coordination effort. The T-WORKS transportation program, signed into law by the Kansas state legislature in May 2010, provided a financial investment to advance coordina- tion beyond current localized efforts. The T-WORKS trans- portation program is a 10-year, 8 billion dollar transportation program designed to create jobs, preserve highway infrastructure, and provide multimodal economic development opportunities across the state. In 2014, the KDOT Office of Public Transportation published KDOT Regional Tran- sit Business Model Implementation with strategies for the provision of transit services throughout rural Kansas that make the most efficient use of the additional transit funding made available by the state legislature as part of the T-WORKS transportation program. Led by KDOTâs Office of Public Transportation staff, each CTD stakeholder team, and a state study team met four times over the course of a 2-year period to develop KDOT Regional Transit Business Model Implementation that details strategies to support the regional transit approach. The KDOT Office of Public Transportation recognized that regional coordination initiatives take time and require partnerships. It worked to develop partnerships with all the key stakeholders in each CTD and allowed enough time for trust to build among the partners. The additional resources and flexibility between CTDs helped as well. State Regional and Intercity Support KDOT Regional Transit Business Model Implementation offers multiple implementation strategies for the CTDs. While specific strategies and elements are tailored to individual CTDs, there are some consistent strategies offered across the state. The implementation plan strategies include offering the CTDs coordinated dispatch software, new intercity routes, and mobility management staff. The KDOT team offers technical and financial support to the CTDs and sug- gests using the following strategies to implement rural regional transit: Source: Flint Hills ATA Bus Facebook Page, https://www.facebook.com/ FlintHillsATAbus/. Flint Hills ATA bus. Source: Transportation Works for Kansas website, http://tworks.ksdot.org/. Logo for Transportation Works for Kansas. Source: https://www.facebook.com/ FlintHillsATAbus/photos/. Logo for a Flint Hills ATA bus stop.
Case Studies 51 ⢠Regional routes. Allow multiple providers to coordinate, combine, and share trips, while preventing duplication. ⢠Coordinated scheduling. Utilizes Global Positioning System (GPS), vehicle-based tablets, and scheduling software to give providers detailed information of other trips in their area. ⢠Mobility management. Gives transit providers a regional resource for driver or rider training and facilitates administrative transit connections between transit providers, employers, medi- cal centers, and social agencies. ⢠Regional governance structure. Provides a framework to make service and funding deci- sions related to regional transit, including oversight, financial participation, legal context, and regional branding. ⢠Branding elements. Convey the connection between the provider, the CTD, and KDOT pub- lic transportation program to the public. During the 2-year development of Regional Transit Business Model Implementation, the KDOT public transportation program unit and representatives from consulting teams formed stakeholder committees for each CTD and conducted information gathering meetings in each region; they collected data and established project visions and goals. Each region developed an action plan that narrowed the broader strategies to the most promising and appropriate, relative to the characteristics of their area and the resources available. As part of the implementation plan the KDOT Office of Public Transit procured coordinated dispatch software for six lead agencies in six of the ten CTDs. This software can be utilized by all transit providers in a CTD to enhance coordination and scheduling. Working with Reveal Management Services, Inc., KDOT installed a statewide technology infrastructure to enable Source: KDOT Regional Transit Business Model Implementation. Figure 4â8. New CTD boundaries.
52 Best practices in rural regional Mobility transit agencies to share knowledge, information, and resources. Reveal was implemented as the centralized paratransit scheduling and dispatching system. The latest software implementation enabled automated vehicle tracking and mobile data functionality across the state to provide better customer service and maximize cost efficiencies. Funding Public transportation in Kansas is supported by the FTA, state, and local funding programs. These federal and state funding programs, which are augmented by local match, provide fund- ing for the 83 general public transit service providers and 59 transit providers that service older adults and people with disabilities throughout Kansas. Figure 4â9 illustrates the state and federal CTD operation costs for FY2015. The T-WORKS program ensures that every county in Kansas receives $8 million dollars in transportation investment, made up of highway preservation, highway expansion and modern- ization, aviation, transit, and rail projects. Transit services are allocated $100 million of the $8 billion over the 10 years of the program. As a result, transit funding in Kansas increased from $6 million to $11 million annually starting in 2013. Source: Appendix to the KDOTâs 2016 Annual Report. Figure 4â9. CTD operating revenue FY2015.
Case Studies 53 Transit funding formulas are recalculated annually. Figure 4â10 illustrates the new transit fund- ing allocations. This includes approximately $1.3 million for supporting regional transit approaches. The KDOT public transportation program unit utilized the increased state dollars from the T-WORKS Transit Program to offer funding to the CTDs for hardware and personnel for (a) coordinated scheduling, staffing, and administration and (b) operations and capital for intercity services. Figure 4â11 illustrates the preliminary allocation of the KDOT funding available to support the strategies to implement rural regional transit. Example of Regional and Intercity Services The Flint Hills Area Transportation Agency, Inc., (Flint Hills ATA) is a private non-profit corporation founded in 1976 by a group of county residents concerned about a lack of pub- lic transportation. As a stakeholder in the Flint Hills CTD, it is one of the early adopters of KDOT Regional Transit Business Model Implementation. In 2014, the Manhattan urbanized Source: T-WORKS Transit Program fact sheet, KDOT website: http://kdotapp.ksdot.org/TWorks/docs/doing-biz_transit.pdf. Figure 4â10. T-WORKS transit funding allocations from 2010. Source: KDOT Regional Transit Business Model Implementation. Figure 4â11. KDOT match allocation for regional strategies.
54 Best practices in rural regional Mobility area became eligible to receive Section 5307 funds. As a result, the Flint Hills Regional Transit Administration was established to serve as the designated recipient of Section 5307 funds. Through the implementation plan, the Flint Hills CTD engaged the Kansas University Trans- portation Research Center to complete a 2015 feasibility study to examine the achievability of fixed route transit service in Junction City and across the river and jurisdictional boundaries to Grandview Plaza, Kansas. The study area consisted of approximately 14 square miles, including the city limits for Junction City and Grandview Plaza, as well as the connecting intercity transit service which links Junction City to Manhattan. Flint Hills ATA had been operating the existing demand response transit service separately in Junction City and Grandview Plaza from 2010 to 2015 with a steady increase in ridership. The Junction City/Grandview Plaza Fixed Route Feasibility Study was sup- ported by multiple Flint Hills CTD stakeholders including, the Flint Hills ATA, Geary County Commission, KDOT staff, and a 20-member advisory committee. Based on the study, and resources from T-WORKS, a fixed route service crossing the Smokey Hill River and jurisdictional boundaries was established in key areas of Junction City and Grand View Plaza. This route was integrated into the larger tri-county regional transit system going 25 miles north to Manhattan, Kansas. It increased connectivity across the region. The tri-county services also started as part of KDOT Regional Transit Busi- ness Model Implementation. In 2011, Flint Hills ATA began a pilot program in partnership with KDOT to add additional regional services. These buses ran outside the normal City of Manhattan-Riley County demand response services. They were expanded into portions of western Pottawatomie County, Geary County (Junction City), and Fort Riley. The pilot program ran from February 2011 through April 2012, at which time the pilot ended and ATA partnered with Geary, Pottawatomie, and Riley Counties to continue the regional services as part of their regular 5311 services. Regional routes now include âThe Intercity Shut- tle,â which operates weekdays between Manhattan-Fort Riley and Junction City, and the Wamego-Manhattan service. These are operated as demand response (reservation required) in these corridors, with fixed stops in Fort Riley. Demand response ridership in 2011 (March to December) was 3,818. Ridership increased to 6,115 in 2012 and to 8,124 in 2013, a 33 percent increase from 2012 to 2013. Ridership for 2014 through April was 3,434, a 22-percent increase in ridership over the same time the year before. KDOT purchased a vehicle for the new Manhattan to Wamego route, representing the first regional route and first vehicle purchased with T-WORKS regional transit dollars. Mobility managers have also been hired (through the T-WORKS program) in the Flint Hills Region through a partnership with the Flint Hills Regional Council and KDOT. Mobility manager per- sonnel and administrative expenses are reimbursed at 100 percent for the first year and 80 per- cent after that with T-WORKS regional transit dollars. Outcomes and Future Outlook KDOTâs regional transit business model initiative resulted in multiple projects that are under- way in regions across the state, with more to come. Regional routes are now operating in mul- tiple CTDs making the following connections: ⢠Emporia to Topeka ⢠Emporia to Andover, El Dorado, and Wichita ⢠Manhattan to Wamego Source: https://www.facebook.com/FlintHillsATAbus/photos Flint Hills ATA Bus, 2015, Transit Day at the Kansas Capitol.
Case Studies 55 The KDOT Office of Public Transit procured coordinated dispatch software for the lead agen- cies in each CTD. This software can be utilized by all providers in a region to enhance coordina- tion and scheduling. KDOT reports in their KDOT Regional Transit Business Model Implementation that by encouraging regional coordination and supporting mobility management, transit services will be provided using fewer resources, thus allowing Kansas transit providers to deliver more rides to people in need. They also report that increasing the amount of available transportation in rural areas will help increase the economic prosperity and health of the region. People in rural areas will be able to access more employment, healthcare, and educational opportunities, result- ing in increased economies in rural areas and enriched lives for rural residents. In the South West CTD, as a part of the T-WORKS regional effort, Dodge City was identified as a community with a need for fixed route transit. In May 2015, a mobility manager was hired and operation of three fixed route bus services began. Since the passage of the T-WORKS in 2010, transit ridership in the rural areas increased 21 per- cent. In 2014, transit ridership increased 7 percent, providing more than 12 million rides. The CTDs will continue to be supported by the KDOT Office of Public Transit until 2020. In FY2015, KDOT allocated $11 million for public transit across the state. By 2020, the tools and infrastructure will be in place to continue the regional services developed and implemented by this plan. According to KDOT, the major factor inhibiting development of additional regional services is the need for local funding participation. Because of the state incentives that include funding for the local share of vehicles for regional services and regional mobility management, the local funding needs may actually be quite low when shared among several jurisdictions. The challenge has been making more regions in the state aware of these possibilities. Lessons Learned ⢠KDOT Regional Transit Business Model Implementation is an example of a top-down regional transit implementation model. The T-WORKS legislation demonstrates how state policy can foster regional transit. This model demonstrates strategies that support leadership, additional resources, multiple players to aid coordination, and significant funding. By having state leadership and resources, there are fewer regulatory barriers and more partnerships to support local implementation. ⢠State-procured coordinated dispatch software can be utilized by all providers in a region to enhance coordination and scheduling. ⢠By encouraging regional coordination and supporting mobility management, transit ser- vices can be provided using fewer resources, thus allowing transit providers to deliver more rides to people in need. This will enable rural residents to access employment, health- care, and educational opportunities resulting in increased economies in rural areas and enriched lives for rural residents, helping to increase the economic prosperity and health of the region. Kansas Case Study Bibliography and Selected Sources Davis, Cory. Comprehensive Transportation Planning Manager, Kansas Department of Transportation, Bureau of Transportation Planning, telephone interview, March 30, 2017. Dodge City/Public Transportation. D-TRAN Fixed Route. http://www.dodgecity.org/index.aspx?nid=727. Accessed June 10, 2016.
56 Best practices in rural regional Mobility Dodge City Fixed Route Bus Schedule, April 27, 2015. Fixed Bus Route System Coming to Dodge City. Dodge City Daily Globe. [Online] April 2, 2015. http://www. dodgeglobe.com/article/20150402/NEWS/150409935. Accessed June 10, 2016. Flint Hills Transportation Agency, Inc. Annual Report for the Year Ending June 30, 2014. Manhattan, KS, 2014. Kansas Department of Transportation. Appendix to the Kansas Department of Transportationâs 2016 Annual Report, Kansas City. Kansas Department of Transportation. KDOT Regional Transit Business Model Implementation, Kansas City, 2014. KDOT Regional Transit Business Model Implementation, Guidelines for Transitioning to the New CTD Bound- aries. Kansas Department of Transportation, Office of Public Transportation, Kansas City, 2015. Kansas Department of Transportation. KDOT Regional Transit Business Model Implementation PowerPoint presentation. http://reap-ks.org/publication/05-02-14-kdot-regional-transit-business-model-implementation- presentation-powers/wppa_open/. Accessed June 3, 2016. Kansas Department of Transportation. Moving Kansas Forward, Annual Report, Kansas City, 2016. Kansas University Transportation Research Center. Junction City/Grandview Plaza Fixed Route Feasibility Study. Final Report, Kansas City, November 2015. Riley County Kansas. ATA Bus. Riley County/Home/Government/Affiliated Agencies/ATA Bus. [Online] http:// www.rileycountyks.gov/795/ATA-Bus. Accessed June 9, 2016. Smith, Anne. Director, Flint Hills Area Transportation Agency, telephone interview, January 6, 2016. T-WORKS Transit Program. Transportation Works for Kansas: Kansas Department of Transportation, Fact Sheet, Kansas City, 2010. T-WORKS Transit Program. Doing Business with KDOT, Fact Sheet, Kansas City, 2010. Case Study: Maine Portland Intercity ServiceâShuttleBus-Zoom Introduction In 2015, ShuttleBus-Zoom partnered with Greyhound to leverage Section 5311(f) funding to run an intercity route along Routes 1 and 9 from Portland to Biddeford. This intercity route offers new transportation options to Biddeford, Saco, Old Orchard Beach, and Scarborough. ShuttleBus-Zoom used Greyhound miles to match Section 5311(f) funding. This new route crosses jurisdictional boundaries, makes intercity connections, and expands services to previously underserved areas, thus meeting local transportation needs as well. ShuttleBus-Zoom provides public transportation to the Cities of Biddeford and Saco and the Town of Old Orchard Beach. It is overseen by the Biddeford-Saco-Old Orchard Beach Transit Committee, a governmental entity consisting of three mem- bers from each of the three municipalities, and one elected official from each. It originated in 1978 through an inter-local agreement by the Cities of Biddeford and Saco and the Town of Old Orchard Beach to provide public transportation under the name ShuttleBus-Zoom. ShuttleBus-Zoomâs Portland Intercity Service leverages a unique partnership with Grey- hound Lines, Inc. (Greyhound), one of the largest private motor-coach operators in the United States. Greyhound offers intercity, charter, and package express services across the United States and into Canada. With two bus stations/stops in Portland, Maine, riders can travel to hundreds of destinations in the United States and Canada. Greyhound partners with several public transit systems, providing in-kind or matching miles for the FTA Section 5311(f) fund- ing program to help increase intercity transit across the country and bring more passengers to their services. Source: www.shuttlebuszoom.com/home. Logo for ShuttleBus-Zoom. Source: www.shuttlebuszoom.com/photo-gallery. ShuttleBus-Zoom buses.
Case Studies 57 State Context and Policy Development State law, Title 23 M.R.S.A. Section 4209, requires the Maine Department of Transportation (MaineDOT) to divide the state into geographic regions to coordinate and provide public tran- sit. There are eight designated transit regions and nine regional transit providers in the state. ShuttleBus-Zoom is Transit Region 8âs designated transit agency. Example of Regional and Intercity Services In 1978, the Cities of Biddeford and Saco and the Town of Old Orchard Beach entered an inter-local agreement to form a quasi-municipal government entity to provide public transportation under the name ShuttleBus-Zoom. This agreement allows ShuttleBus-Zoom to execute contracts and obtain and dispense funds for the purpose of providing public transportation. In 2014, Al Schutz, Executive Director of ShuttleBus-Zoom, learned about the 5311(f) inter- city bus program from MaineDOT and Mr. Schutz thought that this could help his declining local route from Biddeford to Portland. He contacted Greyhound and revised the route to con- nect with Greyhound services in Portland and destinations like the newly opened Baxter Acad- emy for Technology and Science. The Baxter Academy for Technology and Science, one of the few charter schools in Maine, needed transportation for its students coming from more than 20 towns and Mr. Schutz was able to enter into an agreement to meet those needs. With a letter from Greyhound pledging miles as a match, Mr. Schutz was awarded 5311(f) intercity funding for the Portland intercity route and started operations in June 2015. The revised route and new partnership with Greyhound increased ridership by 7 percent in the last year. Mr. Schutz is now considering partnering with Greyhound to carry cargo from Portland to Biddeford. ShuttleBus-ZOOM Family of Services ShuttleBus-Zoom operates five types of transit service throughout Biddeford, Saco, and Old Orchard Beach with some services making connections to the Greater Portland area. Both the Intercity/Portland bus and the Zoom Turnpike Express have a transfer system that links to METRO and the South Portland Bus System. The ShuttleBus-Zoom route descriptions below are taken from the FY2013âFY2017 MaineDOT Locally Coordinated Transit Plan for ShuttleBus. Tri-Town Local Route. The Tri-Town local route operates with two buses 7 days a week serv- ing the Cities of Biddeford and Saco, and the Town of Old Orchard Beach. The first bus serves three communities via Elm Street, while the second bus provides service via Alfred Street. The buses operate along the same route but in reverse order. Trolley Service. In summer months, ShuttleBus runs a popular trolley service between Old Orchard Beach and Pine Point in Scarborough. On weekdays, the trolley runs from 10:00 a.m. to 10:00 p.m. Weekend trolley service runs from 10:00 a.m. to midnight. Portland Intercity Service. The Tri-Town to Portland intercity service, or âPortlandâ bus, runs daily from Biddeford to Portland with stops in Saco, Old Orchard Beach, Pine Point, Scarborough, and South Portland (primarily the Maine Mall). From June 15 to September 15, the service operates two extra runs on Sunday. The bus runs Monday through Friday from 6:25 a.m. to 10:20 p.m., Saturday from 8:30 a.m. to 7:05 p.m., and Sunday from 10:45 a.m. to 5:05 p.m. Source: http://abduzeedo.com/logo-design-greyhounds Logo for Greyhound.
58 Best practices in rural regional Mobility UNE Norâeaster Express. Since September 2007, Shuttle- Bus has operated the Norâeaster Express route between Uni- versity of New Englandâs Hills Beach campus and downtown Biddeford and Saco. One bus serves the route 7 days per week during the academic year. The bus runs Monday through Thursday from 7:30 a.m. to 9:45 p.m., Friday from 7:30 a.m. to 11:05 p.m., Saturday from 12:00 p.m. to 11:05 p.m., and Sun- day from 11:40 a.m. to 7:30 p.m. ZOOM Turnpike Express. The ZOOM Turnpike Express travels from park and ride lots in Biddeford and Saco, via the Maine Turnpike, to Congress Street and the University of Southern Maine, and back during morning and afternoon rush hours. The bus runs weekdays during heavy commuter times from 6:00 a.m. to 6:40 p.m. Regional and Intercity ServiceâPortland Intercity Service ShuttleBus-Zoomâs Portland Intercity Service offers multiple daily trips departing from Greyhoundâs Portland terminal and ending at ShuttleBus-Zoomâs Biddeford location. Monday through Friday, the bus runs from 6:25 a.m. to 10:20 p.m., Saturday from 8:30 a.m. to 7:05 p.m., and Sunday from 10:45 a.m. to 5:05 p.m. From June 15 to September 15, the service has two extra runs on Sunday. The bus stops at the following locations: ⢠Portland: 950 Congress Street ⢠Portland City Hall: 389 Congress Street ⢠Scarborough: 200 US RT1 ⢠Old Orchard Beach: 11 1st Street ⢠Saco: 130 Maine Street ⢠Biddeford: 13 Pomerleau Street The Purple Line on the map in Figure 4â12 depicts the ZOOM Turnpike Express Route, and the Green Line running south of the ZOOM Turnpike Express is ShuttleBus-Zoomâs Portland Source: www.facebook.com/shuttlebuszoom/photo-gallery. Boarding a ShuttleBus. Source: http://ShuttleBuszoom.com/rates/intercity-portland/: Inter-city bus map. Figure 4â12. ZOOM Turnpike Express (Purple Line) and ShuttleBus-Zoomâs Portland Intercity (Green Line) routes.
Case Studies 59 intercity route. ShuttleBus-Zoomâs Portland intercity route costs are determined by zones. One- way single zone travel is $1.50, travel through two zones is $3, and travel through three zones is $5. Ten-ride passes through two zones cost $23, and $39 for three-zone travel. Ridership and User Characteristics The Cities of Biddeford and Saco and the Town of Old Orchard Beach are located on the coast of southern Maine in York County. As seen in Figure 4â13, they have a combined popula- tion of 48,736 over 75.98 square miles making the population density 641.45 per square mile. Portland, the largest city in Maine, is 20 miles north of Biddeford with a population density of 3,078 people per square mile. Located on a peninsula with the historic port district, Port- land is a tourist attraction as well as home to several large employers, colleges, universities, hospitals, and medical centers. The Maine Medical Center, located in Portland, is the largest hospital in Northern New England with 28,000 inpatient visits and about 500,000 outpatient visits annually. Source: KFH Group, Inc., data from U.S. Census Bureau, Census 2010, Summary File, Population by Census Block Group. Figure 4â13. Population density for the cities of Biddeford and Saco and the town of Old Orchard Beach.
60 Best practices in rural regional Mobility ShuttleBus-Zoomâs Executive Director estimates that approximately 40 percent of trips on the Portland intercity service are for local errands and transferring to Portland local metro service, 30 percent are for employment, and the remaining 30 percent are uncategorized. Funding ShuttleBus-Zoomâs $2.9 million annual operation is supported by state and federal funds, advertising and contract services, fares, and funding from four municipalities. This holds true for all five transit services. Biddeford, Old Orchard Beach, and Saco each pay $125,000 for bus ser- vice and Scarborough pays $25,000. Mr. Schutz estimates that about half of ShuttleBus-Zoomâs Portland Intercity Service funding comes from the 5311(f) operating grant, which requires a 50-percent match. ShuttleBus-Zoomâs partnership with Greyhound provides the 50-percent match using Greyhoundâs intercity miles. Fifteen percent of each stateâs Section 5311(f) allocation is set-aside for rural intercity bus service (5311[f]). To be considered intercity, service must not be primarily used as a commuter service, be a fixed route, be capable of carrying luggage, and make a meaningful connection with a national intercity transportation provider. Operating funds under this program require a 50-percent match. Transportation providers can use âin-kindâ or âmilesâ as the match. Initially implemented in 2007, âin-kind matchâ defines intercity bus routes to include both a subsidized segment (5311[f]) and a connecting unsubsidized segment. The value of the unsubsidized seg- ment can be used as in-kind match for the match on the 5311(f) operating funds for the sub- sidized segment. In return for bringing passengers to Greyhoundâs Portland station and selling Greyhound tickets, ShuttleBus-Zoom receives a letter from Greyhound dedicating miles from the northern (unsubsidized) part of Greyhoundâs Portland route to be used as 50-percent match for their Bid- deford to Portland service. As part of the agreement, ShuttleBus-Zoom operates the Biddeford to Portland route 5 days a week making meaningful connections to Greyhoundsâ services and sells interline tickets with Greyhound. An average of two ShuttleBus-Zoomâs Portland intercity passengers connect and transfer to Greyhoundâs regional bus service daily. In addition to federal and municipal support from the Cities of Biddeford and Saco and the Town of Old Orchard Beach, ShuttleBus-Zoom partners with private agencies. Many town- ships and businesses that ShuttleBus-Zoom serves contribute financially to support the service. Walmart contributes $6,000 a year; Southern Maine Health Center contributes $6,500 a year; and businesses like senior centers, shopping centers, and health care providers partner with ShuttleBus-Zoom to ensure the people they serve have transportation to their services. Shuttle- Bus-Zoom recently utilized Section 5307 funding to hire a mobility manager to help foster these public private relationships. Lessons Learned ⢠Through leveraging public private partnerships with community businesses and Greyhound, ShuttleBus-Zoom is able to provide bus service to smaller communities on local routes that are bypassed by Interstate 95. ShuttleBus-Zoom utilized 5311(f) intercity funding and in-kind matches to address regional travel needs. ⢠ShuttleBus-Zoomâs Executive Director shared the following advice for other transit manag- ers: âWith stifling overregulation from the federal government, transit managers stop trying to innovate, but you have to be willing to take a risk and run with it. With a common sense attitude and running your service as a business you can provide the transportation services your community needs. We have to be willing to take risks and push the envelope while
Case Studies 61 complementing that with a common sense business attitude in operating services. Go out and take risks and make gains.â Maine Case Study Bibliography and Selected Sources Gallagher, N. âFirst year may chart the course for Baxter Academy,â Portland Press Herald, June 30, 2014. Greyhound. Greyhound Partners with ShuttleBus-Zoom to Expand Service in Maine, June 4, 2015. https://www. greyhound.com/en/media/2015/06-04-2015. Accessed June 23, 2016. Greyhound. All Routes from Portland, ME. http://locations.greyhound.com/bus-routes/all-destinations/ portland/me. Accessed June 27, 2016. Maine Department of Transportation. MaineDOT Locally Coordinated Transit Plan Region 8: ShuttleBus, FY2013, Augusta. Maine Department of Transportation. Maine Strategic Transit Plan 2025. Final Report, Augusta, April 19, 2015. Mainly Media. February 26, 2015. http://courier.mainelymediallc.com/news/2015-02-26/News/New_funds_ pumped_into_local_transit_system.html. Accessed June 23, 2016. Meiklejohn, B. âNew Funds Pumped into Local Transit System,â Biddeford-Saco-OOB Courier. [Online] Febru- ary 26, 2015. Schutz, Al. Executive Director, ShuttleBus-Zoom, telephone interview, June 24, 2016. ShuttleBus-Zoom. Inter-City/Portland Bus Routes & Rates. http://ShuttleBuszoom.com/rates/intercity-portland/. Accessed June 23, 2016. U.S. Census Bureau. American Community Survey, Geography Tracts: 2010â2014. U.S. News and World Report. Maine Medical Center. http://health.usnews.com/best-hospitals/area/me/maine- medical-center-6110430. Accessed June 24, 2016. Case Study: Michigan Alger County Transit Introduction Michiganâs Upper Peninsula (the UP), a large rural area of 16,452 square miles, is home to about 308,000 people. The UPâs 15 counties are divided into three planning and service delivery regions: ⢠Eastern UP (EUP): Chippewa, Luce, and Mackinac Counties ⢠Central UP (CUP): Alger, Delta, Dickinson, Menominee, Marquette, and Schoolcraft Counties ⢠Western UP (WUP): Baraga, Gogebic, Hough- ton, Iron, Keweenaw, and Ontonagon Counties The sparse population and long distances between population centers create significant barriers to effec- tive regional transit. In addition, many counties in the UP border Wisconsin and people often need to cross the state line for work, medical care, or higher education. There are a large number of rural county and city transit systems in Michigan; however, few have developed regional links that cross county lines. The Michigan Department of Transportation (MDOT) approach to the development of regional services is permis- sive, allowing local initiatives and providing technical assistance. Alger County Transit (ALTRAN) is an example of a rural transportation provider that developed successful regional service. ALTRAN provides a regional connection from Alger County to the closest urban center, Marquette, which is 45 miles away. Source: 2016 Coordinated Mobility Plan: Prosperity Region 1, KFH Group. Map of the UP. Source: Alger County Transit website, http://www.altranbus.com/ Logo for Alger County Transit.
62 Best practices in rural regional Mobility State Context and Policy Development The ALTRAN Munising to Marquette route evolved from service that was started under an MDOT demonstration program that provided funding to establish and demonstrate regional routes. In the past, MDOT had programs aimed at creating and supporting regional services; however, over the past decade, these have not been continued. In addition to the ALTRAN regional route, Straits Regional Ride links communities in Cheboygan, Emmet, and Presque Isle with flexible routes linking des- ignated bus stops. The Straits program was also started under the MDOT regional demonstration program. Another rural regional program in Michigan is operated by the Thunder Bay Transportation Authority Dial-a-Ride, which serves the residents of Alpena, Alcona, and Montmorency Counties and the City of Alpena. The Alger County example was chosen for this case study because it is an example of a fixed route, fixed schedule rural regional route serving multiple needs. More recently, the need for regional mobility has been recognized at the highest levels of the state. Governor Snyder released a special message to the legislature in June 2014, on the topic of aging, titled âMaking Michigan a Great Place to Live Well and Age Well.â The special message included the following language regarding access to transportation: âMichiganders, including many older adults, need regional mobility and transit providers need to become more regionally focused. This is both an urban and rural issue.â Another MDOT program that potentially could address the need for regional trips is the stateâs intercity bus program. However, meeting regional needs for same-day trips is difficult when the intercity routes are timed to make connections in distant hubs. For example, although there are intercity bus services in the UP, they primarily serve to connect points in the UP to places beyond the region. Indian Trails has two routes that traverse the region, one from east to west and one from north to south. The service makes daily stops in Menominee, Powers, Escanaba, Gladstone, Iron Mountain, Marquette, Manistique, Gwinn, and Ishpeming. Service does not extend into Alger County. To be able to connect with nationwide bus networks, the Indian Trails buses in the UP run during the very early hours of the morning, between approxi- mately 12:00 a.m. and 8:00 a.m. Because the service runs only once daily, a person seeking to travel to Marquette for employment or medical care would have to stay until the next day in order to catch a ride back to Escanaba or Marquette, both about 45 miles from Alger County. Figure 4â14 is a map of the intercity bus system in Michigan. In the UP region, the 15 counties have an agreement to provide inter-county services. Coun- ties allow other countiesâ transit services to pick up passengers in their regions and vice versa. The regional transit services available in the CUP vary greatly by county. Alger, Delta, Mar- quette, and Schoolcraft Counties have created public transit authorities. Only the Marquette and Alger agencies have regular inter-county services. Dickinson and Menominee Countiesâ public transportation is only available through local community action agencies. Formal transit pro- viders, health care providers, human service agencies, and one tribal organization also provide limited regional transit services for people who qualify. Example of Regional and Intercity Services Organizational Structure Alger County initiated countywide public transit services in January 1982. The Alger/Marquette Community Action Board operated transit services until March 1990 when ALTRAN, an Act 196 transit authority, was created to provide countywide transit services in Alger County. Source: Courtesy of Alger County Transit. Alger County Transit bus.
Case Studies 63 Source: Michigan Department of Transportation. Figure 4â14. Michiganâs intercity bus system.
64 Best practices in rural regional Mobility ALTRAN provides several types of service, including local countywide dial-a-ride service (branded as Ride to Work service) to 350 to 400 people daily in the 915 square mile Alger County; a weekday rural regional route from Munising in Alger County, 45 miles west to the regional center of Marquette, located in the neighboring county; local demand response service on Friday/Saturday evenings; and seasonal âBackpacker Transportationâ from Munising and Grand Sable to stops in the National Lakeshore Park. There are many partners that play a role in supporting regional transportation in the UP. From FTA funding for regional routes and underserved populations, to local initiatives and agencies serving targeted populations, many factors contribute to meeting regional transporta- tion needs in the UP. Transportation planning and coordination efforts have been underway in Alger County for a number of years. The Alger 2014 County Coordinated Transportation Plan reported that ALTRAN meets regularly with stakeholders to discuss transportation needs. ALTRAN manage- ment meets monthly with 26 human service agencies and quarterly with the all governmental agencies (including the city, county, townships, schools, hospital, Park Service, and Forest Ser- vice). ALTRAN staff provides an annual update for the Chamber of Commerce. As part of that process, ALTRAN requests input from the Chamber about the need for services identified by the business community. Similarly, ALTRAN staff seek input from the Visitorâs Bureau on a regular basis about the transit needs of tourists. ALTRAN staff meets regularly with agencies and employers in cases where transit service impacts their clients and employees. The meetings inform the coordinated transportation plan- ning process and collect input on mobility issues. For example, ALTRAN meets regularly with Kewadin Casino, the largest employer using the Ride to Work service, to obtain input and fill gaps in their schedules. ALTRAN works with community partners to improve mobility options for people with dis- abilities, older adults, and persons with lower incomes. The Commission on Aging funds trans- portation and they provide regular input to ALTRAN on the needs of older adults. ALTRANâs Munising to Marquette Connection In 1997, about 10 Alger County residents asked the executive director of ALTRAN if she could expand service into Marquette. She worked with them to arrange a schedule and route to Marquette that would work for all of them. This was established originally as a commuter route. MDOT provided some funding over a 4-year period for this service. Over the years, ALTRAN was able to expand the service through partnerships with health and human service providers. Today, the Munising to Marquette route provides regional service weekdays from 6:15 a.m. to 5:00 p.m. The 29-passenger bus makes three round trips a day with an average of 25 passen- gers each trip. ALTRAN reports that in the winter, the bus can fill up and reservations become oversubscribed. The schedule is as follows: ⢠Bus leaves Munising at 6:15 a.m., 11:15 a.m., and 3:15 p.m. ⢠Bus leaves Marquette at 8:00 a.m., 1:00 p.m., and 5:00 p.m. The commuter bus will pick up passengers with reservations along the 45-mile route. They have an agreement with Marquette County that allows them to pick up passengers in Marquette County and collect and keep the fares from those rides. About 15 miles of the route are in
Case Studies 65 Marquette County. The Marquette County transit system does not cover that area, so the ALTRAN service is not duplicative or competitive, but complementary. The trip purposes vary from employment, NEMT, educational, personal errands, and con- nections to regional transportation. ALTRAN reported that through coordination with the Marquette General Hospital Dialysis Unit, they are able to transport an average of six patients 45 miles from Alger County to dialysis in Marquette daily. The hospital pays for patient trans- portation for clients from Alger County regardless of their Medicaid status. In addition to the hospital, Northern Michigan University, car dealerships, and shopping and commercial services in Marquette are desirable destinations for residents of Alger County. ALTRAN runs Backpacker Transportation service, transporting passengers from Munising Falls Visitor Center along Pictured Rocks National Lakeshore Park to Grand Sable Visitor Center (45 miles) with stops at tourist destinations along the route. Ridership and User Characteristics Alger County is a 915-square-mile rural county on the southern shore of Lake Superior. It is home to 9,522 people, 2,327 of whom live in the City of Munising. The population density is approximately 10 persons per square mile. ALTRAN is the only public transportation service available in Alger County. There is no intercity bus service or taxi service in the county. Alger County is a tourist area with most businesses relating to tourism. The 2014 Alger County Coordinated Transportation Plan reported that there are approximately 38 businesses in the county whose workers use public transportation/Ride-to-Work service to get to and from their jobs. The unemployment rate for Alger County is 9.5 percent, the percentage of the population age 65 or older is 22.27 percent, and 18.82 percent of the population report having a disability. The median family income in Alger County is $50,098 and 50.65 percent of children are eligible for free/reduced lunch. In comparison, the median income in Marquette is $61,374. There is one federally qualified health center in Alger County and there are two in Marquette County. Many residents in Alger County need to travel to other communities to access services. ALTRAN is able to provide transportation to these services in an efficient and cost-effective way. Funding MDOT reported that in FY2014, 35 percent of ALTRANâs system revenue came from fares, 16 percent from federal sources, about 39 percent from state sources, and 10 percent from local and tribal sources. These percentages vary somewhat from year to year. ALTRAN reports that the local sources include annual funding of about $25,000 from the local Commission on Aging, approximately $15,000 from the City of Munising as local matching funds, and about $5,000 from local Native American tribes through the Tribal Slot Revenue Payments grant program. The Tribal Slot Revenue Payment grants are not awarded to ALTRAN every year. A one-way trip on the Munising to Marquette route costs $7.00; repeat passengers can pur- chase a 40-trip pass for $120. ALTRAN staff estimates that 96 percent of passengers use the 40-trip passes. ALTRAN leverages local partnership opportunities by providing services to social programs like meals on wheels and school systems, for a fee. On the Munising to Marquette route, they carry cargo (auto parts) on less crowded return trips. ALTRAN receives federal funding through several MDOT programs. Section 5311 (rural for- mula) provides funding through formula money for operating and capital assistance. The Special- ized Services Program for unmet needs for individuals with disabilities and older adults helps fund
66 Best practices in rural regional Mobility ALTRAN services. The former Section 5316 (Job Access and Reverse Commute [JARC]) has been used to provide funding for developing new or expanded transportation services to connect welfare recipients and low income persons to jobs and employment related services. ALTRAN was the recipient of JARC funding, which provided funding for 50 percent of the net operating deficit of the service. The State of Michigan provides funding matches for these federal programs. Outcomes Through inter-county partnerships and collaboration with service providers, ALTRAN is able to help residents in Alger County access social services, medical services, and employment in Marquette City, which is 45 miles away. As noted above, Alger County is much more rural, and many services are only available in the regional population center. For those unable to drive or without access to a vehicle, this regional transit route provides the only link to these services. ALTRAN leadership identified complementary markets and funders and designed a service package that meets the needs of multiple populations with one service. They successfully make three 45-mile round trips a day, with 40 percent of the revenue from fares. Lessons Learned ⢠Inter-county partnerships and collaboration with service providers enabled Alger County Transit to help rural residents to access social services, medical services, and employment in the closest urban center. ⢠Identifying complementary markets and funders and designing a service package that meets the needs of multiple populations with one service enabled Alger County Transit to develop a successful service. Michigan Case Study Bibliography and Selected Sources Alger County Transit. Local Transportation. http://www.altranbus.com/local.html. Accessed June 14, 2016. Central Upper Peninsula Planning and Development Regional Commission. Central Upper Peninsula: Regional Transit Mobility Planning, Governor Snyderâs Special Message on Aging, May 2015. Cotey, Rochelle. Executive Director, ALTRAN-Alger County Transit, telephone interview, June 20, 2016. Edgar, S. Administrator, Office of Passenger Transportation, Michigan Department of Transportation, email communication, March 30, 2017. Google. Directions from Munising Falls Visitor Center to Grand Sable Visitors Center, Google Maps, https:// www.google.com/maps/dir/Munising+Falls+Visitor+Center,+1505+Sand+Point+Road,+Munising, +MI+49862/Grand+Sable+Visitor+Center,+Pictured+Rocks+National+Lakeshore,+E21090+County+R oad+H58,+Seney,+MI+49883/@46.5041129,-86.5648285,10z/data=!3m1!4b1!4m13!4. Accessed June 14, 2016. KFH Group, Inc. Coordinated Mobility Plan: Prosperity Region 1, Michigan 2-1-1 and Michigan Department of Transportation, Lansing, 2016. Michigan Department of Transportation. ALTRAN Transit Authority, MDOT/Doing Business/Passenger Transportation, Lansing, http://www.michigan.gov/mdot/0,1607,7-151-9625_21607-162099â,00.html. Accessed June 14, 2016. Michigan Department of Transportation. Alger County Public Transportation Human Services Transportation and Job Access Plan, Alger County Coordinated Plan, Lansing, 2014. Michigan Department of Transportation, Public Transit Facts, Lansing, 2015. Michigan Gaming Control Board. Tribal Casino Slot Revenue Payments & Slot Information, March 7, 2017. Monette, Kim. Acting Executive Director, ALTRAN-Alger County Transit, telephone interview, March 7, 2017. U.S. Census Bureau. American Community Survey, 2010â2014. U.S. Department of Health and Human Services, Center for Medicare Medicaid Services. Provider of Services File, September 2015. U.S. Department of Labor. Bureau of Labor Statistics, April 2016.
Case Studies 67 Case Study: Minnesota Minnesota Department of Transportation, Central Community Transit ImplementationâTransit for Our Future Initiative Introduction This state case study involves policies and programs to encour- age rural and small urban transit systems to regionalize and meet multiple goals, including the provision of regional services. The state program is discretionary, providing planning support and transition funding, but dependent on local initiative to develop projects and apply for funding. State Context and Policy Development The Minnesota Department of Transportation (MnDOT) administers federal and state transit programs through its Office of Transit, which also directs planning and research studies, provides technical assistance, ensures program compliance, and coordinates statewide pedestrian and bicycle activities. In Min- nesota, state statutes require that public transportation be available to all citizens in all counties, with the result that there are 59 separate local and regional public transportation providers in the state. As part of its statewide planning responsibility, the Office of Transit conducted the Greater Minnesota Transit Plan in 2009, which provided a 20-year strategic plan for public transpor- tation in the state outside the Twin Cities, the area known as Greater Minnesota. That study identified future needs and funding requirements. Subsequently the Greater Minnesota Transit Investment Plan of 2011 focused on setting priorities through a new process, and included the development of different futures that might take place under scenarios of reduced funding (this followed the economic crisis of 2008) as well as increased transit funding. One of the outcomes of this study was recognition that having many small transit systems limited potential efficien- cies and left needs for regional connections unmet. For transit to be able to survive and thrive in a future that might involve reduced resources, changes would be needed that involved a higher level of cooperation among providers, and potential organizational changes that could reduce the administrative, capital, and operating costs of providing transit statewide. Transit for Our Future Initiative Provides Funding for Regional Projects The Office of Transit developed the Transit for Our Future Initiative to encourage and assist established public transit providers to develop and implement local solutions for improving effi- ciency and service statewide. The initiative developed a framework for this effort that includes three levels of joint action that could be implemented by two or more transit systems to achieve these objectives. These are described by MnDOT as the âthree CsââCoordination, Coopera- tion, and Consolidation: ⢠Coordination. A formal relationship between multiple systems, each of which maintains a separate identity and authority, including vehicle operation. Coordination may focus to a large extent on information sharing or providing information. Examples might include joint support for a mobility coordinator, travel trainer, or joint grant preparation. ⢠Cooperation. Involves more joint decision-making and activity between multiple agen- cies under formal interagency agreements, managing resources of a distinct organization or Source: http://www.dot.state.mn.us/transit/riders.html Transit rider boarding a STRIDE vehicle.
68 Best practices in rural regional Mobility service. Examples might include a joint mobility manager, joint purchasing, and sharing of resources such as technology or facilities. ⢠Consolidation/Partnering/Merging. Combining all operational authority and control into a single agency that provides service based on agreements between the agencies. The basic example is combining multiple systems into a single system with its own policy board, brand- ing, and services. MnDOT developed Guidance for Coordination, Cooperation, and Consolidation that pro- vides more detail on each strategy, a toolkit, directions for getting started, and a sample scope of work for technical studies that might be needed to develop and implement strategies. It includes information on legal relationships that can be used to implement any of the three Cs. In Min- nesota, these include JPAs or intergovernmental service agreements, either of which can be used by local governments to provide public services (such as transit). Much of the focus of this document is on options intended to improve efficiency and effectiveness through sharing of information or resources, rather than on developing regional routes or services. This set of strategies is intended to serve as the basis for established Section 5311 rural and Section 5307 urban transit operators to jointly apply for funding under the MnDOT Transit for Our Future Initiative. The minimum grant is $5,000, and the local share is 15 percent (20 per- cent for capital). Funding can be used for virtually anything except bus purchases. Potential uses listed on the application include operational enhancements, service modifications (including regional routes), and transition activities or costs. Program design objectives and characteris- tics include consolidated service design with a region-wide focus, providing access to the most desired regional trade centers with greater frequency. MnDOT provides technical assistance in developing these projects. The overall strategy includes MnDOT funding for transit restructuring studies, which are rec- ommended for any joint project that includes organizational restructuring or increased services, including development of regional routes and services. Often a project that combines two or more systems organizationally also includes development of regional services that cross juris- dictional boundaries of former partners. Identification of regional needs, gaps, and potential services is part of the study. MnDOT Identification of the Need for Rural Regional Services Implementation of this program to support regionalization of transit systems has been con- current with other MnDOT initiatives that include a focus on regional services. In 2014 the Minnesota Intercity Bus Study reviewed and identified the statewide network of intercity bus services, many of which are funded by MnDOT through its administration of the FTA Section 5311(f) program. Although this network links regional centers with the Twin Cities and gate- ways to service beyond state boundaries, in most cases it does not provide for same-day round trips to regional centers, nor does it serve commuter needs. In the Southeast Minnesota Travel Study, MnDOT examined the regional transit needs of an 11-county region in southeast Minnesota. This study included a review of existing services, house- hold surveys, transit user surveys, and analysis of travel patterns from cell phone locations. This information was used to analyze major corridors and develop conceptual regional services. The study found several different transit market segments. In terms of expanded services, the preference is for regional public transit services, particularly express commuter routes. The study developed conceptual corridors and estimated demand for each, broken into work and non-work trips. This sets the stage for subsequent planning to determine operators, schedules, vehicles, and fares. Another state study that addresses the need for regional transit is the 2016 update to the Greater Minnesota Transit Investment Plan, which is the statewide plan for transit improvement.
Case Studies 69 Technical Memorandum #2 reported on a statewide Wikimap and online destination survey. It reports that both transit users and non-users âidentified a need for trips crossing county lines and connections to cities in other Districts.â Travel patterns include connections from Greater Minnesota to the Twin Cities (addressed by the intercity network for non-work trips, and grow- ing commuter services for work trips), and connections from smaller towns to regional centers (which are more easily addressed by transit operations coordinating or consolidating at the regional level). Progress under the MnDOT Initiative Over the past 3 years, the Transit for Our Future Initiative has funded a number of projects, some of which resulted in regional transit entities (with regional services), and others which did not. Some of these projects included the following: ⢠Faribault and Martin Counties. 2013â2014 restructuring study resulted in consolidation of two county systems under a JPA. ⢠Blue Earth, Nicollet, and Le Sueur Counties. 2015 restructuring study led to a service plan for new regional service with implementation under Saint Peter Transit (acting as a lead agency). ⢠Kandiyohi, Renville, and Meeker Counties. 2014 restructuring study led to consolidation of Kandiyohi Area Transit and Renville County Heartland Express into a single new provider: Central Community Transit (CCT). In 2015, Meeker Transit joined CCT under its JPA. Another project began as an effort by two systems to jointly fund a Compliance Coordina- tor, but that did not work out and ended with one system maintaining the buses of the other as a resource sharing measure. Four counties joined together to create a regional route known as Buffalo Ridge, but the demand was not there and the route was discontinued. Example of Regional and Intercity Services CCT is an example of using the MnDOT policy initiative to create a single regional system out of three separate county systems. Kandiyohi Area Transit is based in Willmar, in south- western Minnesota. Willmar is a regional center (2015 esti- mated population 19,638), located in Kandiyohi County (2015 estimated population 42,542). A 2014 restructuring study under the Transit for the Future Initiative led to the creation of a regional advisory committee, and eventually Kandiyohi Area Transit consolidated with Renville County Heartland Express in neighboring Renville County. Jurisdictions that had oper- ated the two systems included the two counties and the city of Willmarâeach represented on the policy board of the CCT system under a JPA adopted by each jurisdiction. A transition grant under the Transit for the Future Initiative supported the effort by providing funding for the creation of a new identity, rebranding the combined fleet, marketing, and costs associated with combining internal systems. CCT is a single regional transit provider, though initially it did not result in any new sched- uled regional services. CCT provided countywide demand response service in both counties: an hourly deviated fixed route scheduled service in Willmar (weekdays) and a weekday advance reservation route making four daily round trips from Willmar to New London and Spicer, both small towns in Kandiyohi County. The Willmar service includes stops at a college, medical facili- ties, the bus station (Willmar is served by the Section 5311[f ] funded Jefferson Lines service), major shopping areas, and social and health services. Source: http://www.cctbus.org/ CCT Bus.
70 Best practices in rural regional Mobility In 2015, continued work on regional restructuring led to the addition of adjacent Meeker County to the CCT JPA. The board expanded to 16 members with the addition of 4 Meeker County rep- resentatives. Another transition grant is anticipated from MnDOT to fund rebranding of the fleet, marketing, and telephone and computer system changes. Expansion of CCT to a three-county system includes the planned implementation of new regional routes, connecting Willmar with Litchfield (in Meeker County) and Olivia (in Renville County), as shown in Figure 4â15. These Source: Nelson\Nygaard Consulting Associates, Inc. Kandiyohi, Renville and Meeker Transit Restructuring Plan. Final Summary Report, p. 7-5. Figure 4â15. CCT restructuring plan.
Case Studies 71 regional routes are to be deviated fixed route services. The WillmarâLitchfield route is to operate Monday, Wednesday, Friday, and Saturday; and the WillmarâOlivia route Monday through Saturday. Both will operate at least three round trips per service day. Combined with the inter-community routes and structured (zoned) demand response service within each county, a regional network of services will result from the consolidation of the three separate county systems. These regional routes connect the principal activity centers in the three counties, but it should be noted that Willmar offers more services, jobs, and shopping due to its larger population. Olivia, the principal center in Renville County, has a population of 2,484, according to the 2010 Census, while Litchfield in Meeker County has a population of 6,726. The distance from Will- mar to Litchfield is 27 miles; and the distance from Willmar to Olivia is 26 miles. Proposed fare options would result in a fare of either $4.00 or $5.00 for each of these trips (before any senior or other discounts), a fare per mile of $0.15 to $0.19. Lessons Learned State transit programs can support the creation of regional transit organizations and services without top-down mandates by offering the following: ⢠Technical assistance; ⢠Funding for restructuring and feasibility studies; ⢠Studies or plans to help identify needs for regional services; ⢠Templates for organizational structures, agreements, and contracts; ⢠Funding for transition costs, including rebranding, marketing, changes to hardware and soft- ware, and human resources costs; and ⢠Funding for operations of new regional services (until they can be included in ongoing grants to the consolidated system). Depending on local interest, response to such a state program will take time, in the absence of ongoing incentives or mandates. With support, local areas can combine and create regional entities that can be more cost-effective, make better use of technology, be fully compliant with program requirements, and meet previously unserved regional needs. Minnesota Case Study Bibliography and Selected Sources Minnesota Department of Transportation. Greater Minnesota Transit Investment Plan, St. Paul, 2011. Minnesota Department of Transportation. Greater Minnesota Transit Plan, St. Paul, 2009. http://www.dot.state. mn.us/transit/reports/transit-report/pdf/greater-mn-transit-plan.pdf Minnesota Department of Transportation. Greater Minnesota Transit Investment Plan, St. Paul, 2017. http:// www.dot.state.mn.us/transitinvestment/pdf/gmtip-public-comment-draft.pdf Minnesota Department of Transportation. Guidance for Coordination, Cooperation, and Consolidation, St. Paul, August 2013. Minnesota Department of Transportation. Minnesota Intercity Bus Study, St. Paul, 2014. Minnesota Department of Transportation. Southeast Minnesota Travel Study, St. Paul, 2016. Minnesota Department of Transportation. Transit for Our Future Initiative, St. Paul, 2014. http://www.dot.state. mn.us/transit/transit-for-our-future/. Accessed April 2016. Minnesota Department of Transportation. Transit for Our FutureâSystem Design Objectives and Charac- teristics, St. Paul. http://www.dot.state.mn.us/transit/transit-for-our-future/docs/design-characteristics- regional-transit-system.pdf. Nelson\Nygaard Consulting Associates, Inc. Kandiyohi, Renville and Meeker Transit Restructuring Plan, Final Summary Report, Minnesota Department of Transportation, St. Paul, 2016.
72 Best practices in rural regional Mobility Case Study: Montana Flathead Transit and North Central Montana Transit and Regional Connections Fostered Through Community Organizations Introduction Flathead Transit in northwest Montana and North Central Montana Transit (NCMT) in north central Montana have engineered a way to meet the need for intercity and regional connections. With help from regional community organiza- tions, both areas have developed transit systems that con- nect northern rural counties with small urban centers over 100 miles south. As seen in Figure 4â16, the origins for these regional routes are on the Amtrak route, and destinations connect with airports and intercity bus service. The sections below illustrate Flathead Transitâs unique utilization of com- munity partners and the Section 5311(f) mile matching pro- gram to meet local and regional transit needs. The second example in this case study, NCMT, illustrates another unique example of community players combining resources to con- nect rural underserved communities with services in larger communities. Both of these systems serve tribal areas. Flathead Transit is administered by the Confeder- ate Salish and Kootenai Tribes (CSKT) and NCMT includes the Fort Belknap and Rocky Boy Reservations in its service area. State Context and Policy Development In Montana, the Department of Transportation (MDT) administers the federal rural transit programs. MDTâs federally mandated 2008 statewide transportation plan, TranPlan 21, notes the decline in intercity bus service and the consequent need for regional connections. A statewide inter- city bus plan completed by MDT in 2012 further analyzed the need for such service, focusing on the need for intercity services that would make stops in the state during daylight hours when local transit providers could provide connections. Subsequent regional planning efforts identified needs for regional connections which led to the development of rural regional/intercity routes that utilize Section 5311(f) funding. The state transit program provided technical and fiscal support for these two services in the same manner that it does for all subrecipients, with no particular additional state role. Examples of Regional and Intercity Services There are similar services that have developed in Montana where similar demand character- istics exist. Northern Transit Interlocal (also known as Golden Triangle Transit) utilizes Section 5311(f) to provide service in the I-15 corridor from Great Falls to the Port of Sweet Grass and westward. Big Sky (Skyline) regional intercity bus service is another regional intercity service in Montana. In terms of their role and operating characteristics, all of these fall in between the many local Section 5311 rural operations and the intercity services, such as Jefferson Lines, that link Montana with the national intercity network. In addition, the Missoula Ravalli Transporta- tion Management Association (TMA) has implemented a regional vanpool program in western Montana that also provides one-time intercity rides. Source: Courtesy of Confederated Salish and Kootenai Tribes. Logo of the Confederated Salish and Kootenai Tribes. Source: Courtesy of Opportunity Link, Inc. NCMT public transit bus.
Case Studies 73 Flathead Transit The Flathead Reservation has a little over 1.2 million acres of land in four counties: Lake, Sanders, Missoula, and Flathead. The reservation is unusual in many ways. Eighty percent of the people living on the reservation are not members of the tribes. The tribes are self-governed; they have their own tribal court and college. Population density for the counties served by the Confederated Salish and Kootenai Tribesâ public transit systems in that region is low. As shown in Table 4â5, the average population density is 20.43 people per square mile for the four counties combined. Currently, the region is served by two transit systems run by the CSKT. CSKT Transit provides public transportation throughout the Flathead Reservation and surrounding areas and Flathead Transit provides intercity transportation between Whitefish, total population of 6,357, and Missoula, total population of 66,788. Organizational Structure In 1998, the tribes created the Department of Human Resources Development (DHRD), to address the 41 percent unemployment rate for tribal members. At the time, social services for Source: Montana Department of Transportation website. Figure 4â16. Regional transit in Montana.
74 Best Practices in Rural Regional Mobility tribal residents were spread over a large geographic area with limited transportation options. As part of the DHRD program, the services were combined in one location, creating a one-stop center and removing the burden of travel to different locations to access services. The services offered at the one-stop center include Temporary Assistance for Needy Families (TANF), Workforce Investment Act (WIA), Vocational Rehabilita- tion, Fatherhood, Low-Income Energy Assistance (LEAP), Office of Community Services, all Elder programs, and Food Stamps. The Food Stamp program is run by the county so the tribes gave the county office space in their one-stop center and eliminated the need to travel to a separate location for county services. The DHRD director, Arlene Templer, in her 2013 presentation at the Native Nations Institute for Leadership, Emerging Leaders Seminar, recounted that combining all the programs under one roof eliminated turf issues. The DHRD found that TANF participants were missing appointments and unable to stay employed due to a lack of transportation. In response, DHRD bought two vans for the TANF program. Eventually, DHRD started receiving state transit funding through Montanaâs TransADE funding pro- gram, later switching to FTA funding through the state, includ- ing Section 5311 and JARC. Tribal transit funding is also used to support the CSKT Transit services. Through an earmark, the DHRD was able to buy a facility that included offices to use as a transportation hub. CSKT used their own local funding to purchase a gas station that is also located at the one-stop center. Revenue from the gas station is used to match the federal trans- portation grants. DHRD used a second earmark to build service bays to maintain the vehicles. The DHRD also receives a grant to conduct Commercial Driverâs License training, which serves as workforce development and provides âhomegrownâ drivers. Flathead Transit Services Today, Flathead Transit, a service of the CSKT, provides daily passenger service between Missoula and Whitefish. The schedule is shown in Figure 4â17. The route starts in Pablo at Four Counties Combined Four Counties Combined Flathead County, MT Lake County, MT Missoula County, MT Sanders Coun ty, MT Montana United States Source: U.S. Census Bureau. American Community Survey, 2010â2014. Total Population 243,744 92,373 28,987 111,011 11,373 1,006,370 314,107,083 Total Land Area (Square Miles) 11,931.81 5,087.68 1,490.17 2,593.42 2,760.54 145,546.56 3,531,932.26 Population Density (Per Square Mile) 20.43 18.16 19.45 42.8 4.12 6.91 88.93 Table 4â5. Population and land area for CSKT Transitâs service area. Source: Courtesy of Kim Swaney, Char-Koosta News. The fleet of 2010 DHRD buses. Source: www.greyhound.com/en/media/2013/12-09-2013. Greyhound press release.
Case Studies 75 10:00 a.m., arrives in Missoula at 11:30 a.m., and then continues to Whitefish, arriving at 3:10 p.m. There are 10 stops (Missoula, Evaro, Arlee, Ravalli, Saint Ignatius, Pablo, Polson, Lakeside, Kalispell, and Whitefish) along the 200-mile one-way route. The 22-passenger van leaves White- fish at 4:00 p.m. and arrives back in Pablo at 8:30 p.m., with the same 10 stops along the way. The average fare is $33 one way. Tickets can be purchased in Saint Ignatius (Stuartâs Cenex), Pablo (Quick Silver), Polson (KwaTaqNuk), and Kalispell (Brianâs Conoco). Passengers can connect with Greyhound, Jefferson Lines, and local transit services in Mis- soula, and with Amtrak in Whitefish. The bus service is funded through MDTâs 5311(f) program and is matched with Greyhound miles. No state or local funds are required because of the Grey- hound match. Using intercity bus âmilesâ to match 5311(f) funds is an innovative way to fund regional transit services. By partnering with a private intercity bus service, rural transit providers can use 5311(f) funds to provide feeder routes to intercity bus services and count miles from the intercity section of the route, operated by a private agency as the match for their feeder service. Corky Sias, the CSKT Tribal Transit Program Manager reports that the Flathead route aver- ages about 11 riders a day. Riders include older adults, people connecting to other regional routes, college students, and tourists visiting national parks. Flathead Transit added a 12-foot trailer to the back of the bus so that the bus can also carry commercial freight on the route from Missoula to Whitefish. Mr. Sias estimates that packages average about 200 pounds each and the cargo mainly consists of car parts, tires, and blood for the Red Cross. The packages are picked up from the Greyhound and Jefferson lines and Flathead Transit takes them north. The revenue from the cargo transport goes back into the transit system and helps sustain the route, which is funded through the MDT 5311(f) program. The Flathead Reservation has a Section 5311 funded deviated fixed route transit system: CSKT Transit. It serves the reservation area 5 days a week from 6:00 a.m. to 5:30 p.m. (Monday through Source: Courtesy of Confederated Salish and Kootenai Tribes. Figure 4â17. Flathead Transit schedule.
76 Best Practices in Rural Regional Mobility Thursday) and 8:00 a.m. to 4:30 p.m. on Friday. The system averages 200 riders a day. A one-way fare is $2.00 unless the trip is covered by a social service program. The service also goes to Mis- soula and Kalispell twice a day. Passengers can use this route to connect with the Flathead route. North Central Montana Transit NCMT is a public transportation system designed to serve the Hi-Line communities of Hill and Blaine Counties in north central Montana. As given in Table 4â6, these counties have a population density of 3.23 per square mile with a total combined population of 23,010 people spread over 7,126 square miles. NCMT serves the surrounding communities and connects with the Fort Belknap and Rocky Boy Reservations. Rocky Boy Reservation is the smallest in Montana, located in the Bear Paw Mountains. The tribe owns a ski area and steel manufacturing facility. Despite these activities, unemployment is high and almost half of the reservationâs 1,931 members live in poverty. Most residents live far away from towns and services. The Fort Belknap Reservation and additional tribal lands encompass 650,000 acres of plains and grasslands. Some points of interest on Fort Belknap Reservation are Aaniiih Nakoda College, Saint Paulâs Mission Church, and natural areas that serve as tourist sites. Organizational Structure The Northwest Area Foundation (NWAF) is an organization dedicated to helping communi- ties in eight states (Idaho, Iowa, Minnesota, Montana, North Dakota, Oregon, South Dakota, and Washington) and 75 Native Nations. It established Opportunity Link, Inc. (OL), in 2004. OL is a non-profit organization committed to assisting 11 counties and 3 reservations in Mon- tana to achieve and sustain independence, prosperity, and a better way of life. NCMT is operated by OL and was established in partnership with North Central Mon- tana area organizations including local and tribal government agencies, social service organizations, and educational institutions. NCMT serves Hill and Blaine Counties and the surrounding communities. This includes coordinating services with Fort Belknap and Rocky Boy Reservationsâ transit systems. Blaine County is located just below Canadaâs border. It has a population density of 1.56 persons per square mile. Hill Countyâs population density is higher at 5.67 because the Area Two Counties Combined Blaine County Hill County The Town of Havre Hill County without Havre Montana United States Source: U.S. Census Bureau. American Community Survey, 2010â14, Source geography: Tract (Community Commons). Population Density (per Square Mile) 3.23 1.56 5.67 2,543.05 2.34 6.91 88.93 Total Land Area (Square Miles) 7,126.51 4,227.56 2,898.95 3.80 2,895.15 145,546.56 3,531,932.26 Total Population 23,010 6,576 16,434 9,668 6,766 1,006,370 314,107,083 Table 4â6. Population and land area for the NCMT service area. Source: Courtesy of Northwest Area Foundation, www.nwfa.org. Source: Courtesy of Opportunity Link, Inc. Opportunity Link logo.
Case Studies 77 Town of Havre (population density 2,543.05) is located in this county. If you subtract the Town of Havre, Hill County would have a population density of 2.34, well below the national (88.39) and state (6.91) averages. Havre is the County Seat of Hill County and the largest town in that region. People living in this region often have to travel long distances to access employment, educational services, and health care needs. These great distances make providing public transit challenging. OL recognized the need for a transportation service to connect people living in this region with services in Havre and Great Falls. In 2008, OL enlisted the Western Transportation Insti- tute (WTI) at Montana State UniversityâBozeman to develop a plan for implementing public transportation in the region. WTIâs research team conducted meetings with tribal and county officials to identify needs and local resources. WTI formed a transportation advisory commit- tee (TAC) consisting of elected officials, representatives from senior centers, transportation agencies, medical and educational facilities, social service providers, and community based and minority advocacy organizations. The TAC also included representatives from the Fort Belknap and Rocky Boy Reservations. In 2009, the TAC approved a coordinated transportation plan for the north central Montana region and by early 2010, NCMT was serving approximately 350 rides per week. In addition to state and federal funding, local partners including Blaine and Hill Coun- ties, Northern Montana Hospital in Havre, and local organizations help to support the service. NCMT Services NCMT runs several routes throughout the Hill and Blaine County region, connecting rural residents with services in Havre. They also have a route that connects their region to the City of Great Falls, over 100 miles away, with larger medical, educational, and retail facilities (see Figure 4â18). The Havre to Great Falls route runs one round trip on Tuesdays and Thursdays. In the morn- ings, the trip starts at 6:40 a.m. in Fort Belknap with more than 10 pick-up points in the Havre/ Fort Belknap area, including a park and ride lot. The route then runs 112 miles to the Great Falls Transfer Center and ends at GTF International Airport at 10:45 a.m. The afternoon trip starts at 2:15 p.m. at the airport and ends at 6:20 p.m. in Fort Belknap via Havre. Source: Courtesy of Opportunity Link, Inc. Figure 4â18. NCMT route Great Falls to Fort Belknap.
78 Best practices in rural regional Mobility The Great Falls Transfer Center is on the corner of 4th Street and 1st Avenue South, down- town Great Falls, Montana (see Figure 4â19). The Great Falls Transit District (GFTD) acquired the vacant Greyhound bus depot on July 28, 2000, using a Montana Air Quality and Congestion Initiative (MACI) grant and property-tax funds. Since January 2002, the transfer center offers connections to intercity bus service. Riders of NCMT can connect with GFTD systems and Rim- rock Trailways. GFTDâs transit system serves the communities of Great Falls and Black Eagle. OL is in a unique position to break down historically isolated silos of service and act as a resource broker between diverse communities, races, incomes, and governments. Their suc- cess stems from being able to contribute big picture strategic thinking along with ground level achievements as well as providing critical services as a collaborator, innovator, and facilitator. Factors for Success Both of these transit systems are good examples of coordination and support among multiple community players, including tribal and local governments, community organizations, private intercity bus companies, social service agencies, and educational institutions. In both cases, community organizations with a broader mission than just transit identified transportation as a need for the well-being of the populations they serve and took on the role of coordinating and meeting transit needs for the region. In northwest Montana, the CSKT recognized the need for transportation to help their com- munity reach services and employment. They leveraged several resources and strategies to meet the transportation needs of the community, including land use. By creating a one-stop center, they reduced transportation needs without driving more miles. People can access all the social services and educational programs in one place. The CSKT leveraged multiple funding sources and programs, combining transportation into the network of services provided to their members. For example, they leveraged vocational dol- lars to train drivers, whom they could then hire. The tribes partnered with the state and private transportation companies and used federal 5311 and 5311(f) funding to meet the transportation needs of their region and connect people in rural areas to population centers in Kalispell and Missoula. Source: Great Falls Transit District website, http://www.gftransit.com/transfer_center.htm. Figure 4â19. The Great Falls downtown transfer center.
Case Studies 79 In north central Montana, OLâcommitted to assisting 11 counties and 3 reservations achieve and sustain independence, prosperity, and a better way of lifeâalso took on the role of public transportation provider. OL was able to leverage community partners and state and federal support to connect its rural community with resources 100 miles south in Great Falls, Montana. In rural areas, underserved populations can become isolated. Without transportation, these populations are unable to access services and amenities needed to live a healthy life. Both of these social welfare organizations recognized the need for intercity transportation and developed partnerships and unique systems to meet that need for the populations that they serve. Lessons Learned ⢠Coordination and support among multiple community players, led by community organi- zations with a broader mission than just transit, helped make these two examples a success. ⢠Leveraging multiple community partners, funding sources, programs, and land use was important in these efforts. ⢠Creating a one-stop center reduces the need for transportation to multiple destinations. ⢠In Montana, the major factor influencing the development of rural regional services is demand. State policies and programs have not limited the development of regional services, which have emerged in response to local needs. Montana Case Study Bibliography and Selected Sources American Indian Relief Council. Reservations/Montana. http://www.nrcprograms.org/site/PageServer? pagename=airc_res_mt_flathead. Accessed June 17, 2016. Community Commons. Health Indicators Report, Community Health Needs Assessment (CHNA), 2010. http:// assessment.communitycommons.org/CHNA/report?reporttype=libraryCHNA. Accessed June 20, 2016. Confederated Salish and Kootenai Tribes of the Flathead Reservation. Transportation Program, Home/Services/ Human Resource Development/Transportation Program 2015. http://cskt.org/. Accessed June 17, 2016. CSKT Flathead Transit partners with Montana DOT and Greyhound to implement service between Missoula and Whitefish. Char-Koosta News, December 12, 2013. http://www.charkoosta.com/2013/2013_12_12/ CSKT_transit_from_Missoula_to_Kalispell.html. Great Falls Transit District. Downtown Transfer Center. http://www.gftransit.com/transfer_center.htm. Accessed June 16, 2016. Kack, D. Get on the Bus: Connecting Small Communities on Montanaâs Hi-Line. Western Transportation Insti- tute, Montana State University, Bozeman, 2010. Kraft, Adam. Montana Department of Transportation, Transportation Planning Division, email communica- tion, March 28, 2017. Montana Department of Transportation. TranPlan 21. Public Transportation Policy Paper, Helena, 2007. Montana Department of Transportation. Montana Public Transit Systems, Helena, 2014. http://www.mdt. mt.gov/publications/docs/maps/public_transportation.pdf. Accessed June 15, 2016. Montana Governorâs Office of Indian Affairs/Fort Belknap Indian Community. http://tribalnations.mt.gov/ fortbelknap. Accessed June 17, 2016. Opportunity Link. Mission and Background. http://opportunitylinkmt.org/mission-background/. Accessed June 15, 2016. Opportunity Link. North Central Montana Transit. http://opportunitylinkmt.org/north-central-montana-transit/. Accessed June 16, 2016. Sias, Corky. CSKT Tribal Transit Program Manager, telephone interview, June 17, 2016. Templer, A. Engaging the Nationâs Citizens and Effecting Change: The Salish and Kootenai Story. Emerging Lead- ers Seminar, November 7, 2013. https://nnidatabase.org/video/arlene-templer-engaging-nations-citizens- and-effecting-change-salish-and-kootenai-story. U.S. Census. Community FactsâAmerican Fact Finder 2010. http://factfinder.census.gov/faces/nav/jsf/pages/ community_facts.xhtml. Accessed June 20, 2016. U.S. Census Bureau. American Community Survey, 2010â2014. http://assessment.communitycommons.org/ CHNA/report?reporttype=libraryCHNA.
80 Best practices in rural regional Mobility Case Study: New Mexico New Mexico Regional Transit Districts, North Central Regional Transit District Introduction The state of New Mexico allows Regional Transit Districts (RTDs) to hold referendums to increase local taxes to help fund transit. As of June 2016, New Mexico has four RTDs, two of which have passed an increase to the GRT for financial support. In addition to local and regional transit providers, the state DOT also provides regional transit services directly, including a commuter rail line (Rail Runner), and a network of regional commuter buses (park and ride services). The North Central Regional Transit District (NCRTD) was the first RTD and the first to pass a GRT. NCRTD connects communities and pueblos throughout north central New Mexico, covering Los Alamos, Rio Arriba, Santa Fe, and Taos Counties. There are six pueblos in NCRTDâs service area: Ohkay Owingeh, San Ildefonso, Tesuque, Pojoaque, Santa Clara, and Nambé. NCRTD initiated service in 2007 and has a unique service model for a rural system. In general, it charges no fares to ride and the service is mostly flex route, providing over 20 flex routes in the over 10,000-square-mile service area. The NCRTD system illustrates the ability of a regional entity to develop and implement regional services with additional connectivity provided by services developed and imple- mented by the state. This is a good example of a regional taxation authority enabling the creation of a largely rural regional transit system that crosses jurisdictional boundaries. State Context and Policy Development In 2003, New Mexico passed the Regional Transit District Act, NMSA 1978, Chapter 73, Article 25. This allowed and encouraged the formation of RTDs in New Mexico to provide, among other things, regional public transit services. Example of Regional and Intercity Services History and Organizational Structure In November 2003, an Organizing Committee (then called the Working Group) began meet- ing and established the major guiding principles of the NCRTD. This 10-member entity was certified as the NCRTD by the New Mexico Transportation Commission in 2004, making it New Mexicoâs first RTD. In 2006, NCRTD developed a service plan, consolidating existing services in the City of Española and Rio Arriba County under the NCRTD. Taos County joined the NCRTD in 2007. Figure 4â20 outlines the geographic area of the NCRTD service area (note: the bus routes are outdated); NCRTD has added more routes since the Long Range Strategic Plan was published. Figure 4â21 provides an updated route map in the Regional and Intercity Services section of this case study. NCRTD is governed by a 14-member board of directors consisting of local officials repre- senting four counties, four cities, and six tribal entities. It serves as the administrative entity NCRTD bus. Source: North Central Regional Transit District Facebook page, https://www.facebook.com/ridethebluebus/photos. Source: North Central Regional Transit District website, http://www.ncrtd.org/. NCRTD logo.
Case Studies 81 responsible for administration of transit services for north central New Mexico. NCRTD covers a service area of 10,079 square miles with a fleet of 43 buses. Table 4â7 outlines the details of the fleet. NCRTD funds regional services using revenue from the GRT. It funds transit services, oper- ated by Los Alamos County, the City of Santa Fe, and Rail Runner. The 2015 NCRTD Long Range Strategic Plan reports that âNCRTD does an excellent job coordinating with transit systems in the four-county region. Coordination includes route plan- ning and funding to ensure a high level of regional mobility.â Regional and Intercity Services NCRTD operates 20 flex routes. It also operates 2 fare-based premium services: the Taos Express (now called the Chile Line) and the Mountain Trail Route. Fares are charged on both premium services, but not on the other routes. Routes are divided into the following service areas and run mostly weekdays: ⢠Rio Arriba/Espanola ⢠Los Alamos ⢠Northern Pueblos ⢠Santa Fe ⢠Taos Source: NCRTD Long Range Strategic Plan. Figure 4â20. Map of the NCRTD.
82 Best practices in rural regional Mobility Source: NCRTD Website http://www.ncrtd.org/ncrtd-routes.aspx. Figure 4â21. NCRTD route map.
Case Studies 83 NCRTD also operates a reservation-based dial-a-ride service in the Pojoaque and Nambé Pueblos. Mountain Trail Route is a premium service to ski and tourist attractions. The route begins at the South Capital Rail Runner Station (connecting to multiple regional and local services) continues through downtown Santa Fe north on Route 475 to Ski Santa Fe recreational areas. This route charges a fare: tickets are $5 each way and bikes are accommodated on a first-come, first-served basis. The Chile Line provides seasonal connections between the Town of Taos and the Village of Taos Ski Valley some 20 miles away. Unlike the rest of the Chile Line, this is a fare-based service. Passengers pay between $2.00 and $5.00. The Chile Line flex route operates along 10 miles of State Highway 68 and makes connections to service throughout Taos County and to Santa Fe, connecting with the New Mexico Rail Runner which goes all the way to Albuquerque. NCRTD buses serve key regional destinations including the Los Alamos National Laboratory, Buffalo Thunder Resort and Casino, and Cumbres and Toltec Scenic Railroad in Chama at the regionâs northern most reaches. In Santa Fe, NCRTD buses connect with New Mexico Rail Runner Express to Albuquerque and Belen. New Mexico Department of Transportationâs (NMDOT) park and ride regional bus network operates four routes in the North Central Region. NCRTD coordinates with and con- nects to all NMDOT routes in their region. Ridership and User Characteristics NCRTD provided 184,320 annual passenger trips in FY2015 on routes it operated. The routes funded by NCRTD provided an additional 317,616 annual passenger trips. Figure 4â22 provides ridership data for FYs 2013, 2014, and 2015. The U.S. Census Bureau, American Community Survey (2010â2014), estimates the total pop- ulation for the NCRTD to be 237,446, over 10,083 square miles, making the population density approximately 23.55 persons per square mile. Table 4â8 breaks down the population and total land area for the NCRTD region by county. RTD conducted an overall needs assessment based on the transit dependence index analysis in the 2014 Transit Service Plan Update, identifying the Town of Taos, the area southeast of Taos, the City of Espanola, and the County of Santa Fe as having the greatest need for transit services. This analysis utilized factors related to population density, age, income status, and vehicle avail- ability. Figure 4â23 illustrates the location of higher transit dependent populations. In addition to identifying major trip origins and destinations, the 2014 Transit Service Plan Update reviewed current transit services in the region and recommended revisions that NCRTD Vehicle Fleet Number of Vehicles Type of Vehicle 3 25- to 28-Passenger Buses 8 8- to 14-Passenger Buses 21 5-passenger Paratransit Vans 3 Contingency Fleet Source: http://www.ncrtd.org/about-ncrtd.aspx. Table 4â7. NCRTD fleet.
Source: NCRTD website, 2016 Ridership Reports. http://ncrtd.org/ridership-reports.aspx. 269,146 312,093 317,616 193,027 209,750 184,320 0 50,000 100,000 150,000 200,000 250,000 300,000 350,000 FY 12-13 FY 13-14 FY 14-15 N um be r o f O ne W ay T ri ps NCRTD Funded Routes NCRTD Operated Routes Figure 4â22. NCRTD ridership. Source: U.S. Census Bureau. American Community Survey, 2010â14, Source geography: Tract. Report Area Report Area Los Alamos County, NM Rio Arriba County, NM Santa Fe County, NM Taos County, NM New Mexico United States Population Density (Per Square Mile) 23.55 164.64 6.85 76.65 14.96 17.15 88.93 (Square Miles) Total Land Area 10,082.52 109.17 5,860.83 1,909.43 2,203.09 121,298.4 3,531,932.26 Total Population 237,446 17,974 40,155 146,361 32,956 2,080,085 314,107,083 Table 4â8. NCRTD population and land area. Source: 2014 Transit Service Plan Update. Figure 4â23. NCRTD transit dependent populations.
Case Studies 85 coordinated directly with the five other systems in the NCRTD service area. This resulted in changing competing routes into complementary routes. The Transit Service Plan Update helped NCRTD increase connectivity by making recommendations that eliminated service duplication, modified existing routes and schedules, reduced the number of timing points, and tailored ser- vice for seasonal fluctuations when serving tourist areas and colleges. There are seven colleges and universities in NCRTDâs region. Table 4â9 lists educational institutions, student population, and locations in the region. Many institutionsâ students and employees use NCRTDâs services. For example, four of the seven Santa Fe routes bringing people into Santa Fe from the surrounding areas stop at the Santa Fe Community College. Funding In 2008, NCRTD was the first RTD to secure a GRT for public transit, adopting a 0.125 percent tax. In FY2015, NCRTD reported that 75 percent of their revenue ($7.2 million) was from GRT, 19 percent from federal grants, 4 percent from member local match, and 2 percent miscellaneous. The Fiscal Year 2017 Budget report adopted on June 10, 2016, shows a decrease in the percentage of GRT revenue and an increase in federal allocation. In its FY2017 budget, NCRTD is proposing that the GRT source will provide 58 percent of operating revenue, federal allocations 30 percent, Los Alamos County contributions 3 percent, and miscellaneous revenues 9 percent. The Fiscal Year 2017 Budget reports that the region has been in a recession and tax revenue reflects this, showing limited growth. Figure 4â24 contains a summary of NCRTDâs revenue over the last 5 years. NCRTD develops and delivers rural regional services and supports regional routes delivered by other entities. It also connects with regional transit providers, for example, NMDOT runs the Park and Ride Express, which connects with NCRTD services. New Mexico and the federal government recognized NCRTD for its outstanding services. In 2015, Therese McMillan, FTA Acting Administrator, presented NCRTD with the FTA Admin- istratorâs Award for Outstanding Public Service in Rural Transportation. NCRTD was also the NMDOT FY2014 Section 5311 Transit System of the Year recipient. Lessons Learned ⢠NCRTDâs success in increasing and expanding transportation services since its inception in 2004 illustrates the ability of a regional entity to develop and implement services with County City College/University 2012 Student Population Los Alamos Los Alamos University of New Mexico 710 Rio Arriba Española Northern New Mexico College 3,873 Santa Fe Santa Fe Institute of American Indian Arts 350 Santa Fe Santa Fe Santa Fe Community College 6,480 Santa Fe Santa Fe Santa Fe University of Art and Design 650 Santa Fe Santa Fe St. Johnâs College 450 Taos Taos University of New Mexico 1,705 NCRTD Regional Total 14,218 Source: 2014 NCRTDâs Transit Service Plan Update. Table 4â9. Students in the NCRTD area.
86 Best practices in rural regional Mobility additional connectivity provided by other agencies. This example demonstrates the role of the regional taxation authority in enabling the creation of a largely rural regional transit system. ⢠In FY2014, NCRTD conducted a route and schedule analysis. After consolidating routes and adjusting service times to connect to other regional services, NCRTD ridership increased by 8.6 percent, to 209,750 riders for FY2014. This increase is eight times the 2013 national aver- age for increased trips on public transportation. New Mexico Case Study Bibliography and Selected Sources Felsburg Holt & Ullevig. Long Range Strategic Plan. North Central Regional Transit District, 2015. http://www. ncrtd.org/about-ncrtd.aspx. Accessed June 30, 2016. KFH Group, Inc. Transit Service Plan Update: Final Report. 2014. http://ncrtd.org/ncrtd-transit-service-plan. aspx. Accessed July 5, 2016. North Central Regional Transit District. 255 Mountain Trail Non-Winter Schedule. http://www.ncrtd.org/ uploads/FileLinks/b305b80b23be4acbb456f233ad191ceb/255_Mountain_Trail___6_23_16.pdf. Accessed July 1, 2016. North Central Regional Transit District. Annual Report. 2015. http://ncrtd.org/uploads/FileLinks/ad079f8eb- 84c49e49e233770613806f4/NCRTD_2015_AnnualReport_FINAL.pdf. July 5, 2016. North Central Regional Transit District. Fiscal Year 2017 Budget, adopted by RES#2016-20, June 10, 2016, Espa- ñola, New Mexico. Sampson, R. New Mexicoâs North Central Regional Transit District: Embracing the Regional Rural Reality, Com- munity Transportation Association, Winter Spring 2014. U.S. Census. American Community Survey, 2010â2014. Case Study: Oregon Oregon Department of Transportation Transit Network Program and Northwest Connector Program Introduction The Northwest Connector is a multi-county regional transit network that provides transit services across five counties in Northwestern Oregon. Recently rebranded from its former name, the North by Northwest Connector, its services are designed to attract multiple types of riders. Source: NCRTD Fiscal Year 2017 Budget. Figure 4â24. NCRTD revenue. Source: Tillamook County Transportation District. Connector logo.
Case Studies 87 It has a number of strategic partners including two tribal confederations, an urbanized area transit system, Greyhound, Amtrak Thruway bus, and local towns that are supporting improved pedestrian access and stops. The five county transit agencies listed below form a multi-county regional transit net- work, the Northwest Oregon Transit Alliance (NWOTA), that facilitates Northwest Connector service: ⢠Tillamook County Transportation DistrictâThe Wave ⢠Lincoln County Transportation Service District (LCT) ⢠Columbia County (CC Rider) ⢠Sunset Empire Transit District (SETD) ⢠Benton County Rural Transit (BCRT) The project began with a $3.5 million U.S. DOE grant and is defined by a regional intergovernmental agreement. Partner agencies remain independent. They jointly apply for funding and share administrative costs for the NWOTA. The project includes development of regional routes (by modifying local services) and higher quality transfer points at major stops where riders could make scheduled connections. New services are combined under a common brand which is incorporated into existing agency brands. A regional visitor pass is common to all the participating systems, sup- porting regional travel between Willamette Valley and the coast, but each retains its individual local fare structure. Organizational Structure In 2010, the five transit agency directors, informally supported by state and regional techni- cal support staff, applied for a grant from U.S. DOE Energy Efficiency and Conservation Block Grant (EECBG) Program, under the General Innovation Fund category and were awarded a 3-year, $3.5 million pilot project using bus service to reduce fossil fuel emissions. The two counties and three transit districts developed a coordinating council and intergov- ernmental agreement, officially forming the NWOTA. The grant allowed the partners to launch a pilot program of regional strategies aimed at increasing transit use by commuters and visitors, and decreasing community dependence on fossil fuels. These strategies included the following: ⢠Co-branding and marketing; ⢠Regional route and service coordination; ⢠Increasing frequency and days of service; ⢠Construction of bus-stop furnishings; ⢠Creating a centralized website; and ⢠Partnership development for the NWOTA partners. Today, Northwest Connector transit services are supported by the individual partner transit agencies, state and federal grants, and other partnerships. All the transit agency partners are financially independent and receive individual financial support through ODOT grants and local support. The Lincoln County Transportation District, Tillamook County Transportation District (TCTD), and Sunset Empire Transportation District have local property tax support as well. Several of the intercity services are supported by 5311(f) funds. For example, ODOT funded the Lincoln City to Grand Ronde/Salem service with Section 5311(f) intercity funds. The local match for this particular route is being provided by the Confederated Tribes of the Grand Ronde and the Confederated Tribes of the Siletz Indians. Source: Tillamook County Transportation District. North by Northwest Connector bus.
88 Best practices in rural regional Mobility The North by Northwest Connector coordinates and co-markets Columbia County Rider, Sunset Empire Transportation District, Tillamook County Transportation District, Benton County Transit, and Lincoln County Transit. It combines the resources of the partner transit agencies to provide seamless transit services along the northwest Oregon coast from Astoria to Newport with connections to inland population centers including Albany, Salem, and Portland, and transit connections in Rainier. State Context and Policy Development The overall ODOT intercity program is called the Transit Network Program. It uses a number of funding sources including 5311(f), 5311, and state dollars. It is described in the Oregon State Management Plan. It has five components: information systems (GTFS for all transit providers, timetables, and maps); state contracted service (ODOTâs POINT network and Amtrak Thru- way); intercity bus discretionary grants; multimodal transit hubs; and transportation options program coordination. Recently ODOT purchased route planning software for use by all transit providers, enabling them to use their GTFS data for service planning and Title VI compliance. ODOT encourages private for-profit companies to compete for service contracts. They are eligible for capital grants, but not for operating grants. The grant program is described as dis- cretionary (local transit providers initiate projects, the state evaluates and selects among them), but the state may fund intercity projects of statewide importance outside the discretionary grant program by providing either contracts or grants. Thus, ODOT can design and fund an intercity grant project as well as a contracted project. For the original development of the Northwest Connector, ODOT was not a co-applicant for the DOE funding. It provided only staff time in an advisory role. The routes included in the Northwest Connector network are funded under various grant programs, including Section 5311(f). Given this basic program structure, it is not surprising that Oregon has several examples of rural regional mobility covering large regions in addition to the North by Northwest Con- nector. The Confederated Tribes of the Umatilla Indian Reservation KAYAK network covers a large area whose jurisdictional boundaries are based on historic tribal areas and meets transit service needs. Another regional network with regional services is Cascades East Transit, oper- ated by Central Oregon Intergovernmental Council. ODOT is supportive of the development of regional networks and regional services, and sees that there is potential for additional regional service development in other areas, if there is funding and willing local leadership. Examples of Regional and Intercity Services The Northwest Connector system provides transit services across five counties in northwest- ern Oregon. The system also provides connections to Amtrak and cities in the I-5 corridor including Kelso, Portland, and Albany (see Figure 4â25). The NWOTA coordinates services by improving and, in some cases, eliminating transfer points. For example, the TCTD service used to stop in Otis and passengers had to transfer to Lincoln Countyâs bus services. Now TCTD goes into Lincoln City, eliminating the transfer, and the agencies share the cost of the extended run. Route and service changes built on the strengths of the five existing systems took into account connections to intercity transit services and focused on improvements that served major travel markets identified by a market study. Route and service changes implemented under the North- west Connector focused on improving connections between the partner agencies. Connecting
Case Studies 89 routes between counties existed before the project; however, except for one route from Portland to Tillamook, all other inter-county transit travel required a transfer, usually in a remote area near a county line. Also, while inter-county trips can be made using the regional visitor pass, transferring to the next county still requires passengers to pay a new fare. The final report for the U.S. DOE grant, North by Northwest Connector: Successes and Les- sons Learned reported the following major service adjustments during the initial years of pro- gram implementation covered by the grant. Lincoln-Benton County Connections Before. BCRT and LCT were cooperating to provide âCoast to Valleyâ service from Corvallis to Newport. The service was fixed route service funded with New Freedom funding, primarily serving medical and hospital access needs for coastal residents. The LCT bus started in Newport Source: North by Northwest Connector website: http://nworegontransit.org/. Figure 4â25. Map of the Connector service area.
90 Best practices in rural regional Mobility and travelled inland (east), and the BCRT bus started in Corvallis and travelled west. The two buses would meet at Ellmaker Wayside, a remote rest area roughly near the mid-point, exchange passengers, and then go back to their respective starting points. After. Seven-day fixed route service was initiated on this route as part of the Connector pilot project, and a new connection to the Albany Amtrak station was made. In addition, BCRT and LCT set up a more efficient arrangement to eliminate the mid-point transfer. The LCT bus now makes one run all the way from Newport to Albany/Corvallis and back twice a day while the BCRT bus runs between Albany and Corvallis. Because operational costs for each party were roughly the same, no cost-sharing arrangement was needed for this change. Tillamook-Lincoln County Connections Before. Between Tillamook and Lincoln counties, the transfer point was Otis (population approximately 10), and the layover time for a transit connection was typically several hours. After. As a result of the Connector project, the TCTD bus now runs all the way into Lincoln City and LCT helps defray TCTDâs extra operational costs. The change also provided an oppor- tunity for direct service from Tillamook to the Chinook Winds Casino in Lincoln County (for access to both jobs and recreation). On weekdays, the connection to Salem is made by Salem Area Mass Transit District (SAMTD), but on weekends, TCTD operates the full trip to Salem and Lincoln two times per day. To address the cost of the service changes, LCT secured FTA 5310 funds for service between Nehalem (in Tillamook County) and Lincoln City (in Lincoln County) and used these funds to pay TCTD for providing the service as a contractor. The 5310 funds provide a 90/10 federal/local match, with the local share provided by the tribes. Clatsop-Tillamook County Connections Before. Between SETD in Clatsop County and TCTD in Tillamook County, the transfer point was Tolovana Park, located south of Cannon Beach. After. SETD and TCTD moved the transfer point to a better location in mid-town Cannon Beach, where riders can access a greater number of community amenities and services, and also connect to the ODOT-funded NW POINT intercity passenger service that serves Portland and the north coast. Schedules have been adjusted to reduce transfer wait times. Both partners were able to absorb minor operational cost increases resulting from these changes through efficiencies gained through service adjustments elsewhere. Columbia-Clatsop County Connections Before. Travel from Portland to Astoria on the northern tier of the system (along the Colum- bia River Highway U.S. 30) required two transfers and about 6 to 8 hours. A transfer between Columbia County Rider buses was required in St. Helens, and an additional transfer was needed in Westport, a rural community with limited amenities, to access the SETD system. Service was available weekdays only. After. Connecting times between SETD and Columbia County Rider have been better coordinated and the Connector pilot project allowed SETD and Columbia County Rider to test 7-day service. However, there is still significant room for improvement between Portland and the coast via this route. An interim recommendation from the consulting team was to move the SETD/Columbia County Rider transfer point to Clatskanie, a larger community with significantly more destinations and services than Westport. However, political and financial constraints in Columbia County precluded SETDâs ability to provide service within Columbia County during the pilot project.
Case Studies 91 Currently, the transfer point is at the Rainier Transit Center, and this trip takes approximately 3.5 hours. Plans call for the transit center site (formerly a gas station) to be re-developed to meet public transit needs. The transit center will have rider amenities such as restrooms, a place to wait for the bus, and park and ride parking on site. The Oregon Connect V Program and a federal intercity grant to be used as the match dollars provided funding for this project. The Connect V funding totaled $678,308 and a federal intercity grant totaled $135,662. Weekday intercity service from the Amtrak station in Kelso, Washington, to Astoria, Oregon, was initiated in 2013, allowing travel through Columbia and Clatsop counties without a transfer. Because changes to connections and service between Columbia County Rider and SETD have yielded minimal improvements to efficiency and convenience, SETD is working on an alternate initiative to help improve visitor access via the northern tier of the Northwest Connector system. The ODOT POINT bus traveling on Highway 26 has fewer stops and is a much faster way to reach Portland. Ridership and User Characteristics Like most rural areas, Columbia, Clatsop, Tillamook, Lincoln, and Benton Countiesâ primary mode of travel was by single-occupant vehicle. Seasonal travel to the coast caused traffic conges- tion on several routes but the counties wanted to keep their rural small town character and not expand their roads. Also, the seasonal nature of the traffic made highway expansion and funding difficult to justify. The majority of transit users are transportation disadvantaged: people with dis- abilities, older adults, those without access to a personal vehicle, and people with lower incomes. The five counties served by the Northwest Connector cover 4,245 square miles with a com- bined population of 244,067, making the average population density 57.5 people per square mile. Table 4â10 breaks out the population, land area, and population density for the five coun- ties and compares it with the state and United States. The coastal counties have lower popula- tion densities and are attractive vacation and recreational destinations for the more densely populated Willamette Valley. By creating the regional network, the local transit providers were able to expand their rider- ship. The participating Northwest Connector agencies added new types of riders, namely, tourist and recreational riders with their intercity services making connections to the Willamette Valley. Report Area Report Area Benton County, OR Clatsop County, OR Columbia County, OR Lincoln County, OR Tillamook County, OR Oregon United States Source: U.S. Census Bureau. American Community Survey, 2010â14, Source geography: Tract. Population Density (Per Square Mile) 57.5 127.27 44.91 75.03 47.09 22.98 40.63 88.93 (Square Miles) Total Land Area 4,244.8 676 829.08 657.38 979.76 1,102.58 95,988.34 3,531,932.26 Total Population 244,067 86,034 37,236 49,325 46,138 25,334 3,900,343 314,107,083 Table 4â10. Five-county population, land area, and population density.
92 Best practices in rural regional Mobility The NWOTA developed a marketing and branding strategy that incorporated the Northwest Connector name into existing individual agency brands and identities. This helped connect the five diverse counties and attract multiple types of riders. Tourists and employees from the Willamette Valley could use the Northwest Connector service to travel out to the coast and between the five counties using regional bus passes. The idea was that consistent branding would help visitors use the system. The name and brand are currently being updated. Over 1,600 Connector visitor bus passes were sold in 2014. Funding In 2010, the five transit agencies were awarded a $3.5 million grant from the U.S. DOE EECBG Program to initiate the North by Northwest Connector pilot project. This is the first project of its kind funded by the U.S. DOE, and serves as a national model for rural transit coordination in other areas of the country. The pilot program funding was for a 3-year project covering plan- ning, administration, and service expansion. A key task of the U.S. DOE grant was to examine ways to sustain the program after grant funds expire. Example strategies include new revenues from sales of regional advertising and visitor passes, charitable fundraising activities in partnership with the North by Northwest Transpor- tation Foundation, Oregonâs energy tax credit program, tribal partnerships, business sponsor- ships, and ongoing funding from the FTA. The Northwest Connectorâs coordinating agency, NWOTA, is supported through contribu- tions from the five partners and additional grant funding, including grants awarded by ODOT specifically to support the partnership. In addition, each of the five transit partners contributes approximately $10,000 a year to the NWOTA. About one-half of this is used for administrative expenses. Other NWOTA expenses include items such as website maintenance, national con- ferences, legal/audit/insurance, and marketing. NWOTA contracts with the Columbia Pacific Economic Development District to provide the equivalent of one full-time administrator. Factors for Success The new Northwest Connector services established an integrated, multi-tier, vertical, and hori- zontal mobility networkâsupplemented by Amtrakâs Cascades service through the Willamette Val- ley as well as private intercity bus routesâcreating a ladder-like matrix of connectivity throughout the region. With services that are frequent, reliable, and easy to understand, the Northwest Con- nector appeals to a wider audience of travelers. From people looking for essential transit options to reach employment or health care to tourists looking for a way to reach key destinations along the coast or in the valley and college students and faculty accustomed to living less dependent on private automobile ownership, the Northwest Connector system meets more types of travel needs. After the NWOTA formed, it started community outreach and branding efforts in 2011 and launched the NW Connector system in 2012. As a result of the U.S. DOE pilot project, the five- county region now has the following: 1. Centralized coordination program (NWOTA), 2. Centralized website, 3. Regionalized transit services, 4. Regional route and service coordination, 5. Regional bus stop furnishing and improved pathways, 6. Regional fare system, 7. Enhanced branding and marketing system, and 8. Employer and visitor transit programs.
Case Studies 93 The coordinating council meets monthly to collaborate and monitor progress on major tasks. The U.S. DOE final report, North by Northwest Connector: Successes and Lessons Learned, reported that âAll partners had to broaden their perspectives beyond the customer base in their individual service areas. Achieving a regional outlook required compromise, and sometimes challenging financial tradeoffs.â The centralized NWOTA website provides public information about the Northwest Con- nector, and is being updated to improve its functionality. This includes coordinated route and fare information for riders across all five counties. The website also has a memberâs only side with management tools to benefit all five partner agencies. Originally, the agency-only side of the website was developed to manage regional GTFS data to facilitate adjustment of routes and stops, but ODOT now provides for GTFS feeds for each agency across the state. The route and stop module is also set up to keep track of stop furnishings, and provide information on avail- able stop amenities to users. Careful analysis of data and market trends helped to focus regionalization efforts where they are most effective. The Northwest Connector program has achieved two major regional service planning objectives: (1) improved connections between the five partner agenciesâ transit systems and (2) improved connections between the Willamette Valley population centers and the five counties. To make responsible service changes, a detailed market analysis was performed during system implementation. The market analysis looked at identifying new markets for transit services. The market analysis served as a powerful tool to help agencies make data driven decisions regarding local and regional routes and schedules; stops and connections; service provision; and expansion. Analysis of data and market trends helped focus regionalization efforts where they would be most effective. For example, developing a regional fare structure for both commuters and visitors was considered early on. However, the market analysis helped the partners under- stand that investment in a regional commuter pass program most likely would not be worth the potential return. Alternatively, the analysis provided significant justification for a visitor pass program, including valuable information on geographic areas where marketing activities would likely have a positive effect. Small adjustments to regional routes and coordination of services between the partner agen- cies helped improve services and increase ridership. Specific improvements to intercity services were discussed in the Factors for Success section. In addition to regional transfer adjustments, service hours and fare structures were also analyzed for seamless coordination. Routes and ser- vice that existed at the onset of the project were used as a foundation for regionalization. Signifi- cant ridership increases on the system have resulted from the partnerships. For example, since TCTDâs Route 4 was extended to Lincoln City in the spring of 2012, ridership on this route has increased over 74 percent on weekends and 71 percent on weekdays. To implement the route changes, however, LCT had to be willing to allow TCTD to operate within its service area, reduce its own service, and pay TCTD for increased operational costs. The North by Northwest Connector: Successes and Lessons Learned report found that when the partner agencies evaluated their individual services in the context of a regional system, many partners identified future partnering opportunities. The following are examples: ⢠TCTD worked with SETD and local veterans to identify better ways of providing veterans in Tillamook County with transportation to appointments at Camp Rilea in Clatsop County. ⢠LCT worked with TCTD and both the Siletz and Grand Ronde Tribes, to explore connec- tions between the Chinook Winds Casino in Lincoln City, and the Spirit Mountain Casino in Grand Ronde. ⢠The Connector Alliance, as a group, is also exploring new service to Salem along the Salmon River Highway in partnership with the Tribes. (LCT is sponsoring this initiative for the group.)
94 Best practices in rural regional Mobility ⢠SETD identified a need for Amtrak Thruway bus service from the train station in Longview/ Kelso to Astoria, and is working to incorporate new intercity service on that route into the Connector system. Performance measures gathered during the DOE grant period showed that on the whole, regional ridership increased. Figure 4â26 shows the overall systemwide ridership, including all fixed routes within all five transit service areas. The North by Northwest Connector: Successes and Lessons Learned report found that transit service provided by the five Connector agencies is responsible for about 5 million fewer miles driven in the region each year. This reduction in total vehicle miles traveled (VMTâstatistics that are influenced by the number of transit riders served per mile of bus operation) in turn has the potential to relieve congestion, reduce vehicular delay, and decrease greenhouse gas emissions. In addition to the increased services and service hours of the Connector, NWOTA was recog- nized by the National Association of Counties with its 2013 Achievement Award. Lessons Learned ⢠A highly connected, ladder-like mobility network with services that are frequent, reliable, and easy to understand appeals to a wide audience of travelers. ⢠Partners need to broaden their perspectives beyond their individual customer base. Compro- mise and financial tradeoffs may be needed to achieve a regional outlook. ⢠Community outreach and branding efforts are important, as is a centralized regional website that is well-maintained. ⢠Careful analysis of data and market trends helps to focus regionalization efforts where they are most effective. ⢠Small adjustments to regional routes and coordination of services between the partner agen- cies help improve services and increase ridership. ⢠Participating partners may identify future partnering opportunities. Source: North by Northwest Connector: Successes and Lessons Learned report Figure 4â26. Connector systemwide annual ridership from 2011 to 2013.
Case Studies 95 Oregon Case Study Bibliography and Selected Sources Davis Evans and Associates, Inc. North by Northwest Connector Successes and Lessons Learned. Final Report, North by Northwest Connector Alliance: Columbia County Rider, Sunset Empire Transit District, Tilla- mook County Transportation District, Lincoln County Transit an Benton County Rural Transit, Portland, Oregon, 2013. Lincoln County Oregon Transit. North by Northwest Connector. http://www.co.lincoln.or.us/transit/page/north- northwest-connector. Accessed June 2, 2016 McArthur, M., and Henry, H. Connector Frequently Asked Questions: Northwest Oregon Transit Alliance (undated). PCC students design concept for Rainier Transit Center. The Chief News, April 26, 2016. http://www.thechief- news.com/news/pcc-students-design-concept-for-rainier-transit-center/article_88a43bf6-0c25-11e6-83cf- 3b771cca9654.html. Pilant, Doug. Executive Director, Tillamook County Transportation District, telephone interview, May 31, 2016. POINT. NorthWest POINT. Portland-Astoria. http://www.oregon-point.com/nw_point.php. Accessed June 2, 2016. Richardson, C., Viggiano, S., Adams, S., and Burke, M. North by Northwest Connector Management Plan, A Strategic Approach to Regional Transit Coordination, October 2016. Sampson, Rich. Connecting Northwest Oregon: A Heroic Effort. Community Transportation, Summer 2015. Sunset Empire Transportation District. Routes. Lower Columbia Route, Plan Your Trip. http://www.ridethebus. org/Lower_Columbia_Weekday.aspx. Accessed June 2, 2016. Sunset Empire Transportation District. Plan your Trip. http://www.ridethebus.org/Map_My_Ride.aspx?start=P ortland&end=Astoria. Accessed June 2, 2016. U.S. Census Bureau. American Community Survey, Community Health Needs Assessment, Community Com- mons, 2010â2014. http://assessment.communitycommons.org/CHNA/report?reporttype=libraryCHNA. Accessed July 13, 2016. Case Study: Vermont Rural Regional ServicesâJoint Schedules on Regional Routes Introduction Over the past 15 years, the Vermont Agency of Transportation (VTrans), with the support of the stateâs legislature, has worked with the stateâs local transit providers to address the need for regional connectivity. The result is an extensive network of regional services providing regional commuter services and rural regional links between rural transit system services. The state transit funding program has used CMAQ funding to sup- port the development of many regional routes. In many cases, transit operators have developed unique ways of jointly imple- menting regional services, sharing costs, and providing a con- venient one-seat ride. This case study will examine the role of the state program in supporting the development of regional service, and provide an example that illustrates ways that rural transit operators have implemented services that increasingly offer a high level of statewide rural regional mobility. State Context and Policy Development State Policies and Development of Rural Regional Services VTrans administers federal transportation programs in Vermont, including FTA Section 5311 and Section 5311(f) rural transportation assistance programs and Section 5310 for non- urbanized areas. Source: DVTA The Moover Bus used on the Bennington-Brattleboro Service.
96 Best practices in rural regional Mobility The state has only one urbanized area, Burlington, and transit service in that area is provided by the stateâs only public transit authority, Chittenden County Transportation Authority (CCTA). CCTA is considered a municipality. It serves the communities of Burlington, Essex, South Burl- ington, Shelburne, Williston, Winooski, Milton, Hinesburg, and a portion of Colchester. CCTA operates regional express routes under the name LINK Express that serve Montpelier, Middle- bury, and St. Albans (located outside the urbanized area). In 2011, CCTA and Green Mountain Transit Agency (GMTA) became a single organization, making CCTA a regional transit authority because of GMTAâs services in Washington, Lamoille, Franklin, and Grand Isle Counties. CCTA is governed by a 13-member board of commissioners, including 2 commissioners from Burlington and 1 from each of the other towns and counties in its expanded service area. Outside the CCTA/GMTA service area, all of Vermontâs transit providers are private non- profit organizations. Figure 4â27 presents a map of public transportation providers. In Ver- mont, the role of county governments is limited to functions related to law enforcement, courts, and local jails, so many services are provided through private non-profit organizations. Service areas of transit providers are not always defined by county or township boundaries. Development of Regional and Intercity Services Statewide The focus on regional solutions began with the realization that regional and intercity bus services provided by the stateâs regional intercity bus carrier, Vermont Transit, were rapidly shrinking. Deregulation of the intercity bus industry in 1982 started the reduction, and subse- quent events led to continued service reductions. The Vermont Statewide Intercity Bus Study performed for VTrans in 1998 documented a reduced network providing service to 50 cities and towns in the state. By the most recent update in 2013, this number had declined to only six places with intercity service. Efforts to use FTA Section 5311(f) funding to maintain service in some corridors by providing bus capital were not successful in retaining service. In 2005, Greyhound Lines, owner of Vermont Transit, closed the firm and maintained limited Greyhound frequen- cies in two corridors. This gap initially became most apparent at the local level when the need to provide regional work trips was identified in CCTA planning. CCTA is a public entity providing transit service to the Burlington urbanized area (Vermontâs only UZA). In 2003, CCTA conducted a Short-Range Transit Plan. While it addressed many needs within the CCTA service area, it also identified a need for work trips from rural areas into Burlington, from Burlington to the state capitol, Montpelier (which is non-urbanized), and to the state office complex in Waterbury (non-urbanized and located between Burlington and Montpelier). The 2003 transit plan defined potential commuter routes between Burlington, Montpelier, Waterbury, St. Albans, and Middlebury. At the same time, VTrans was developing a state ânew startsâ policy that would provide fund- ing to local public transit providers for new services at the state level for a limited period. At the end of the period, if the service met performance thresholds established for that type of service, it would be included in the ongoing program with state and FTA funding support. VTrans identified CMAQ funding as the source of support for the new starts program, with 3 years of operating funding to allow service to develop full ridership. CCTA used the new funding to develop three regional routes, all branded as new LINK ser- vices. Commuter schedules from Burlington to Waterbury and Montpelier (2003); from Mid- dlebury to Burlington (2004); and from St. Albans to Burlington (2005) were implemented by CCTA. Service to Middlebury has weekday service provided by CCTA and Saturday service pro- vided by ACTR. These services featured a limited number of stops, schedules that allowed travel in either direction morning and afternoon, and commuter (multi-ride) fares. Stops included downtowns and park and ride lots, and they were launched with a significant marketing effort.
Case Studies 97 Source: Vermont Agency of Transportation PPID Division, Systems Planning Unit. Figure 4â27. Vermontâs public transportation providers.
98 Best practices in rural regional Mobility Success of these routes and support of the VTrans funding program led other transportation providers across Vermont to implement regional commuter routes, and connect rural, non- urbanized places to each other. Many services were entirely within the service area of a particular provider, but operators (most of them private non-profit organizations) also worked with each other to jointly develop and operate connecting routes. By 2010, there were 12 regional com- muter routes statewide, operated by 9 different providers. Organizational consolidation reduced the number of providers over time, and these routes are still operating. Additional routes have been developed and implemented using CMAQ funding through VTrans. There are now 31 routes that VTrans classifies as rural commuter, and 10 routes that are classified as express com- muter as part of its annual statewide assessment of transit performance. Figure 4â28 presents a map of Vermont showing regional commuter routes. In addition to these regional routes, VTrans uses CMAQ funding, transferred into its Sec- tion 5311(f) rural and intercity program, to fund three rural intercity routes: one connecting Burlington to Albany via Rutland and Bennington; a second route connecting White River Junc- tion with Springfield (Massachusetts) via Brattleboro; and a third route connecting Rutland and White River Junction. VTrans also provides comprehensive transit information covering all transit providers serving the state on its Go! Vermont website and telephone information source (which also provides car- and vanpool matching, bicycle information, and intercity bus schedules). Examples of Regional and Intercity Services Many routes in Vermont link rural areas multiple times per day, and connecting routes may be jointly operated without requiring riders to change buses at the border of the providerâs service area. Route 2 Commuter One early example of this service model is the Route 2 Commuter, which operates between St. Johnsbury (2010 population 6,193) and Montpelier (2010 population 7,855). The trip takes 80 minutes each way, including stops, to cover 36.1 miles. The Route 2 Commuter schedule includes two morning and two evening schedules between Montpelier and St. Johnsbury, an additional morning trip to Montpelier from a park and ride lot midway between these two towns, and a mid-day round trip between Montpelier and the park and ride lot. Two providers jointly operate this service. Rural Community Transit (RCT), a private non- profit based in St. Johnsbury, operates two round trips. The other schedules are operated by GMTA, the Montpelier-based arm of CCTA. The complete timetable is presented by both pro- viders in their public information. There are different fares: RCT trips are fare-free and GMTA trips have a $2.00 fare. Productivity on this route averages six boardings per hour. Schedules are designed to connect to other regional routes in Montpelier, facilitating trips beyond this one route. The significant lesson of this service is that it serves two rural towns in different transit service areas through a cooperative service that does not require passengers to change buses at the border, and does not require a complicated cost allocation or contract. Bennington-Wilmington This model has most recently been implemented in the southern part of the state by two private non-profit transit providers. Both Southeast Vermont Transit, Inc. (SEVT), and Green Mountain Community Network, Inc. (GMCN), are private non-profit organizations created to provide public transportation in their respective service areas. SEVT was formerly known as the
Case Studies 99 Source: KFH Group from data provided by VTrans provider websites, ESRI Data. Figure 4â28. Regional commuter routes in Vermont.
100 Best practices in rural regional Mobility Deerfield Valley Transit Association (DVTA). Its routes and services are now called The Moover. Originally, DVTA and GMCN both applied to VTrans for funding to operate scheduled service between Bennington (GMCNâs hub on the west end) and Wilmington (the main hub for The Moover services), filling a gap in the stateâs transit network. VTrans provided 3 years of operat- ing support using CMAQ funding, and the service started on July 9, 2012. The original grant proposal was jointly submitted by the two organizations in late 2011. Ten years earlier, DVTA led a regional team in producing the Brattleboro-Bennington Feasibility Study, which included focus groups, surveys, public hearings, and meetings with local policy-makers. The proposed route also included a number of subsequent regional and statewide transit plans. The service was designed to service demand from many different ridership markets: persons con- necting to intercity bus services at either end of the route, persons seeking medical and shopping services not available in the towns along the route, veterans needing access to VA medical facili- ties, employees, students, persons making recreational trips, riders with special needs, and anyone without access to a personal vehicle. Though it is a handshake agreement between GMCN and SEVT, the application addressed the administrative and operational roles of each agency. The service pattern originally called for each operator to provide two round trip per day schedules, with GMCN reducing its service to one round trip for 3 months each year. The Moover operates two morning round trips from Wilmington (2010 CDP population 463) to Bennington (2010 CDP population 9,074). GMCN operates the late afternoon round trip. Both operators show all schedules in their information. Schedules are designed to facilitate connections at each end. The Bennington terminus (see Figure 4â29) is the GMCN transit center which offers multiple routes to other towns, including the GMCN connection to Williamstown, Massachusetts (connects to Peter Pan intercity bus service to New York), and regional GMCN service to Manchester, Vermont (where it connects to Marble Valley Regional Transit Authority service to Rutland). The GMCN transit center in Bennington is also the stop for Vermontâs Section 5311(f )-funded Vermont Translines service between Albany and Burlington, and is the stop for the Yankee Trails local commuter bus service to Albany. In Wilmington, there is a timed connection to The Moover service to Brattleboro, which offers a connection to southbound Greyhound service (funded by VTrans with Section 5311[f ]). Source: DVTA. Figure 4â29. Green Mountain Community Network (GMCN) Bennington Transit Center.
Case Studies 101 Both operators agreed to follow the DVTA fare-free policy on this route (even though GMCN has fares on its other routes). Deviations are provided by advance reservation. The one-way trip between Wilmington and Brattleboro takes 40 to 45 minutes and covers 22 miles. Schedules are designed to allow for work trips, and the service carries a limited number of employment trips, student trips, and mobility for seasonal workers in resort areas of southern Vermont. A 2014 survey of riders and potential riders demonstrated the variety of potential markets, with 29 percent of respondents working in one of the endpoints, 32 percent seeking connections to points out of the region, 6 percent desiring school trips, and 42 percent seeking to make trips for medical purposes, shopping, and other purposes. Ridership has not grown as rapidly as hoped, with a combined annual ridership in 2015 of 4,142, approximately three boardings per service hour for the combined service. The route uses Route 9 through Green Mountain National Forest and Woodford State Park, areas which generate little ridership. A transfer in Wilmington is required for persons making the trip across southern Vermont from Brattleboro (2010 CDP population 7,414) to Bennington. The connecting buses are shown in schedules, and there is minimal wait time. Nevertheless, these factors may be affecting ridership. Because the Bennington-Brattleboro route is fare free, there is no farebox contribution to either participating transit system. Both DVTA and GMCN had applied to VTrans for CMAQ funding for the initial 3 years of operation, with the thought that at the end of 3 years, if the service met the stateâs performance criteria, they would be folded into the base combined state/ federal operating grant for each system. However, at the end of the third year the route had not yet achieved the minimum state target for boardings per hour for rural commuter services; however, it was providing acceptable performance on the other performance measure: cost-effectiveness (defined as the cost per passenger trip). The use of performance measures to evaluate each sys- temâs portion of service separately is problematic for The Moover because it operates two daily round trips, whereas GMCN operates only a single trip for 3 months per year. The Mooverâs costs are higher because of the additional round trip, but the ridership is similar to that of the single GMCN schedule so its performance appears lower. When the two routes are combined, the overall boardings per hour measured for the combined service is higher than for The Moover alone, but still below the VTrans ridership standard, though the cost-effectiveness of the com- bined route meets the stateâs criteria. SEVT and VTrans are working on ways to increase rider- ship through schedule changes and marketing. Lessons Learned ⢠State support is important. Although rural regional routes have been implemented in a number of states that do not have an explicit policy supporting this type of service, the state- wide experience in Vermont demonstrates that local public transit operators can and will implement regional routes that provide connections if there is policy and funding support from the state. The use of CMAQ funding for startup and initial operation of rural regional (commuter) routes proved to be a boon to the creation of a statewide network of connected regional services, allowing the systems to design the connections and test the markets. In addi- tion, Vermont provides a high level of state funding to support public transportation. ⢠Cooperation between operators. Neighboring transit systems can jointly develop services that do not require passengers to change at service area borders and still meet multiple regional needs. In particular, splitting schedules between operators means (a) passengers get a one-seat ride, (b) each system shares the cost, and (c) each system gets to count a proportionate num- ber of riders and share in the revenue. Splitting schedules can be accomplished with minimal effort through memoranda of understanding (MOUs), cost allocation studies, and contracts. ⢠Need for regional performance evaluation. Vermontâs annual transit performance evalua- tion, which is used as a factor in funding decisions, includes categories by service type. Rural
102 Best practices in rural regional Mobility regional routes across the state are compared with each other, rather than with other types of services. Nevertheless, the process does not treat joint operations as a single project, which can mean that the performance of operators in a joint service can appear to differ. This does not present an accurate picture of the combined service, and may jeopardize ongoing funding because one or more schedules appear to have an unacceptable performance. ⢠Ability to link very small towns. Although some of Vermontâs regional routes were designed to provide service to commuters traveling to and from the stateâs only urbanized area (Burl- ington), many regional routes link small towns with each other. This demonstrates that care- ful consideration of needs and trip purposes can lead to successful rural regional services that do not necessarily have a trip end in a large population center. ⢠Network connectivity. Designing services so that they have scheduled connections to rural regional services increases overall feasibility and provides for much more widespread rural regional mobility. Vermont Case Study Bibliography and Selected Sources Chittenden County Transit Authority. About Chittenden County Transportation Authority. www.cctaride.org/ about-ccta/. Accessed July 18, 2016. Deerfield Valley Transit Association and Green Mountain Community Network. New Start Proposal for Pro- viding Public Transit Service between Wilmington and Bennington. November 10, 2011. http://factfinder. census.gov/faces/nav/jsf/pages/community_facts.xhtml. Frank, A. Succeeding with Commuters after Intercity Failure. Presented at the 19th National Rural Public and Intercity Bus Transportation Conference, Burlington, VT, October 24â27, 2010. Southeast Vermont Transit. Wilmington-Bennington Action Plan. http://www.census.gov/quickfacts/table/ PST045215/5007975,00. Accessed June 8, 2016. Vermont Agency of Transportation. Public Transit Route Performance ReviewsâAnnual Report for State Fiscal Year (SFY) 2015. http://www.census.ogv/quickfacts/table/PST045215/5046000. Case Study: Wisconsin Regional Service in Southwest Wisconsin, Scenic Mississippi Regional Transit Bus Introduction SMRT is a rural regional bus system serving Crawford, Vernon, and La Crosse Counties in southwest Wisconsin. The service is intended to serve a variety of users: commuters, seniors, disabled persons, riders going to medical facilities or on educational trips, shoppers, and the general public. State Context and Policy Development The Wisconsin Department of Transportation (WisDOT) supports the development and provision of public transit in the stateâs urban and rural areas, along with a statewide inter- city bus network. Federal funding, including rural transit assistance under Section 5311 and the rural intercity program under Section 5311(f), is used together with State Urban Mass Transit Operating Assistance. The state funding is provided on a formula basis to eligible applicants including municipalities with populations greater than 2,500 and transit authorities and commissions. Source: http://lacrossetribune.com/news/local/smrt-bus-service-up-and- running/article_9ecfa0a4-a7d4-11e2-adce-0019bb2963f4.html. New SMRT bus connects La Crosse, Vernon, and Crawford Counties.
Case Studies 103 There is no particular program designed to support rural regional transit services; however, the state has provided funding through its normal pro- grams to support service such as that provided by SMRT. In addition to SMRT, there are several other regional services in the state, such as the Ozaukee County Express, the Washington County Commuter Express, Bay Area Rural Transit, and the Beloit-Janesville Express. These are categorized by the state as commuter/regional bus routes in the Wisconsin Get-Around Guide, which provides details on public transit services in the state. Example of Regional and Intercity Services How It Came to Be The concept for a regional service developed from a desire for a transit service to provide employment trips between Prairie du Chien (population 5,757) and La Crosse (population 52,440). The city of Prairie du Chien developed an interest in a regional transit solution as a result of the findings of a business retention and expansion survey that found a shortage of quali- fied employees and a lack of reliable transportation options. The cityâs shared-ride subsidized taxi service did not provide a regional connection, and did not address this need for work trips. From the cityâs perspective, the primary rationale for developing regional transit service was to support economic development. When the concept was introduced to the Crawford County Transportation Coordinating Committee (TCC), additional goals were identified. The regional planning organization, Mis- sissippi River Regional Planning Commission (MRRPC), participated in the Crawford TCC, and also in the coordination committees in Vernon and La Crosse Counties. Once aware of the general concept, coordinating committees recommended expanding the concept to include stops in their counties. A regional advisory committee was formed that included representatives of MRRPC and three transportation coordinating committees. Prairie du Chien engaged a con- sultant to perform a feasibility study. It examined demographic and travel pattern data, engaged stakeholders, included open houses, and presented service options and ridership forecasts. The study expanded its focus to include multiple markets such as work, medical, shopping, and edu- cational trips. Connectivity with service providers was identified as a key aspect of service design. The study team worked with the staff of the WisDOT and the state committed to funding startup if local match could be obtained. During 2011 and 2012, there were difficulties with the implementation process. Prairie du Chien agreed to contract for the service, but the local match was an issue. MRRPC sought local funding support from governments, businesses, and institutions in the region. Eventually, WisDOT operating and capital funding availability coincided with the provision of local sup- port. Two rounds of bidding for operation of the system resulted in the selection of a contract operator. Buses arrived and service operations began on December 2, 2012. The Regional Services There are three fixed routes: the Blue, Yellow, and Red Routes (see in Figure 4â30). On the map, the Blue Route is not shown separately, because it follows the same route as the Yellow Route, but with different stops and schedules. All three routes are fixed route, fixed schedule services, with one bus on each route. Service is operated Monday through Friday only. Service hours vary as follows: ⢠The Blue Route links Viroqua, Westby, and Coon Valley with La Crosse, with a morning round trip (5:37 a.m. to 8:24 a.m.), a mid-day trip (10:30 a.m. to 12:40 p.m.), and a late after- noon trip (4:05 p.m. to 6:49 p.m.). Routings of the three trips vary somewhat. Source: Courtesy of the City of Prairie du Chien. SMRT logo.
104 Best practices in rural regional Mobility Source: Courtesy of the City of Prairie du Chien. Figure 4â30. SMRT routes and service area.
Case Studies 105 ⢠The Yellow Route serves the same towns as the Blue Route, but has alternative stops, and complementary schedules, with two morning services, a mid-day service, and an afternoon return trip. ⢠The Red Route is in a different corridor, starting in Prairie du Chien and linking Lynxville, Ferryville, De Soto, Genoa, Stoddard, and La Crosse. There is an early morning schedule, a mid-day schedule, and an afternoon service. The schedules offer an early morning route and return service that would allow for a full 8-hour workday in La Crosse, with the overall span of service beginning at approximately 5:45 a.m. and final drop-offs at approximately 6:15 p.m. The exact time varies by route. Stops are located at major employers, downtown areas, medical facilities, Technical College (students and faculty ride free with ID), University of WisconsinâLa Crosse campus, Viterbo Uni- versity, major shopping destinations (Walmart and Shopko), and the Amtrak station (optional on demand). Stop locations in towns are defined, with flag stops offered in rural areas between towns. In La Crosse, six stops are at the shelters/stops of the local bus system, and free transfers are available. The fare is $3.00. There are discounted punch cards (20 percent savings) and a monthly pass for regular users. Buses are 26-passenger body-on-chassis buses, with lifts and two wheelchair positions, bike racks, and Wi-Fi internet access. The buses are publicly owned. The service is operated by a private contractor, with buses that are owned by Prairie du Chien. Ridership Figure 4â31 presents the growth of ridership since the projectâs inception (not including the partial first month). Ridership grew steadily over the first 22 months, flattening out in late 2014. A reduction in service hours of approximately 20 percent accounts for this flattening out of ridership. The year of 2015 proved to be highly variable, with some months showing increases Source: Data supplied by Peter Fletcher, Mississippi River Regional Planning Commission. Figure 4â31. SMRT ridership.
106 Best practices in rural regional Mobility over the previous year. Revisions to routes and schedules in October 2015 led to an upturn in ridership, and the first quarter of 2016 showed continued increases. Some lessons learned as routes and schedules have been developed are that the heaviest rid- ership is directional, going from rural areas and smaller cities toward the larger employment market/services of La Crosse, and it is heavier in the peak hours. There is limited demand for trips between small towns. A review of ridership for a week in March 2016 reveals that the aver- age boardings per vehicle trip (10 trips per day) was 7.42, with the highest average of 18 riders on the first morning inbound trip. Sustainability and the Future Based on the continued growth of ridership, support of sponsors and communities, contin- ued support of Prairie du Chien, and the continuation of funding through WisDOT, it would appear that existing services will continue. Looking ahead, at the request of La Crosse County, MRRPC has initiated a planning study to look at the feasibility of additional SMRT service routes that would connect Monroe and Trempealeau Counties with La Crosse. User and Trip Purpose Characteristics A user survey is performed periodically. The most recent survey showed that service addresses a number of different markets: ⢠Gender of riders â 49.1%, male â 50.9% female ⢠Age of riders â 20.8% under age 25 â 37.7% ages 25 to 44 â 37.7% ages 45 to 64 â 3.8% age 65 or older ⢠Trip purpose â 54.1% work â 14.8% school â 13.1% medical â 18% other ⢠Rider satisfaction â 78.7% very satisfied â 21.3% satisfied â 0.0 % unsatisfied Services are intended to meet needs for work, educational, medi- cal, and general trip purposes, and apparently they meet that need. Unusual for a rural service is the low percentage of senior riders and the equal gender balance. It would appear that riders are quite satisfied with the service. Organizational Structure SMRT can be characterized as having a very lean organizational structure. The City of Prairie du Chien is the lead agency, acting as both fiscal agent and grant applicant. The service is oper- ated under contract by Running, Inc., a private firm that operates the cityâs shared-ride taxi Source: Courtesy of the City of Prairie du Chien. Bus service replaced vanpool service to Organic Valley Cooperative.
Case Studies 107 service under a separate contract. The city provides a limited amount of funding to MRRPC for staff time to oversee the contractor and work with regional partners. Policy guidance is provided by the advisory committee of the original feasibility study, which includes representatives of the transportation coordinating committees of the three counties, MRRPC, and the City of Prairie du Chien. Funding The FY2016 operating budget for SMRT is $352,483: $49,500 in user fares, $60,000 in con- tributions, $73,313 in local general fund match revenue from the City of Prairie du Chien, and a $169,670 grant from WisDOT. The WisDOT grant utilizes FTA Section 5311 rural program funding combined with state match from the State Urban Mass Transit Operating Assistance program. Funding under this program is formula-based. The funding from contributions represents a unique aspect of SMRT funding. While the city provides a significant amount of the local operating match, other villages, towns, and counties in the service area have been asked to contribute as well. There is no allocation or mandated amount, and the systemâs service design is not based on whether a jurisdiction has provided funding or not. The theory is that if a regional system had to depend on getting a certain amount of funding from each jurisdiction served, it probably would not be implemented. The willing- ness of Prairie du Chien to provide the match regardless of the contributions of others has been key to the initiation and continuation of service. The other aspect of the use of contributions is that the request for funding support is also made to the business community, medical providers, educational institutions, foundations, and other organizations. As a result there are a number of sponsors featured on the system website and in other publicity. They include Gundersen Health System, Vernon Memorial Healthcare, Dairyland Power Cooperative, Crossing Rivers Health, Organic Valley Cooperative (dairy), Otto Bremer Foundation, and Ho-Chunk Nation (which provides funding through Vernon County). Lessons Learned ⢠Combine multiple markets. Include commuters, students, medical trips, and shoppers as potential riders. ⢠Complement and connect with other services. SMRT connects with the local bus in La Crosse, at park and ride lots, serves the Amtrak stop, and connects with the City of Prairie du Chien shared-ride taxi service for first-mile/last-mile service. ⢠Seek support from the business community. Sponsorships help provide local match and are recognized on the SMRT website and schedules. Services are identified in business publications. ⢠Provide information to riders. Even if there is a limited marketing budget, be sure to work with county aging units and have an up-to-date website. ⢠Local champions are important. The MRRPC has played a significant role in developing and implementing this regional service. The City of Prairie du Chienâs role as lead agency, grant applicant, and guarantor of local share has been crucial. Wisconsin Case Study Bibliography and Selected Sources City of Prairie du Chien. Annual Budget. 2016. Community Transportation Association of America. Scenic Mississippi Regional Transit: A Connected Com- munity Responds to a New Transit Provider. Spring 2013. http://web1.ctaa.org/webmodules/webarticles/ articlefiles/DigitalCT_Spring13_SMRT.pdf.
108 Best practices in rural regional Mobility Fletcher, Peter. Transportation Planner, Mississippi River Regional Planning Commission, email communication and telephone interview, June 8, 2016. Frable, G. SMRT BUS-Improved Transportation Option for Southwestern Wisconsin. Presented to the 2014 Wisconsin Transportation Conference, Green Bay, WI, October 20, 2014. Scenic Mississippi Regional Transit. SMRT website. www.ridesmrt.com. Vierbicher Associates, Inc. Bus Transit Feasibility Study. Prepared for the Crawford County Transportation Coor- dination Committee, October 12, 2010. Wisconsin Department of Transportation, Transit Section. Wisconsin Get-Around Guide, Madison, Winter 2017. http://wisconsindot.gov/Documents/travel/pub-transit/get-around.pdf.
