
4
The Master’s Degree
Master’s degree programs in many science, technology, engineering, and mathematics (STEM) fields have a reputation of successfully meeting market and workforce demands, at least in part because of their flexible nature, and because the master’s degree opens multiple educational and career pathways for students. As of 2015, there were 3.7 million people in the U.S. labor market whose most advanced degree was a master’s in a STEM field (NSB, 2018c). For these reasons, an increasing number of U.S. universities are offering programs designed specifically for students seeking a master’s degree. Although the incentives for creating master’s programs can be varied and multifaceted, the adaptability of the master’s degree is suggested by the high rate of development of new inter- or multidisciplinary programs involving multiple academic departments (CGS, 2005). While career prospects for holders of a master’s degree vary by field, a master’s program can help students develop research skills, expand on content knowledge, gain technical expertise in a program geared to industry, and for some students, provide an opportunity to explore the discipline in a deeper way either to become a more attractive candidate for a doctoral program or to test interest in a particular field.
Chapter 2 provides detail on the overall landscape of master’s level enrollment and degrees awarded by gender, race and ethnicity, citizenship status, and additional breakdowns by broad field of study; however, additional focus on careers appears in this chapter for master’s students and in Chapter 5 for Ph.D. students. According to an analysis of Census Bureau data, more gainfully employed STEM professionals have master’s degrees than Ph.D.’s, with the one exception being among life and physical scientists (AFL-CIO, 2016). In addition, the Bureau of Labor Statistics (BLS, 2013) projects that occupations requiring STEM
master’s degrees will be the fastest growing segment in many STEM fields, including those in mathematics and in computer, life, physical, and social sciences.
CORE EDUCATIONAL ELEMENTS OF MASTER’S DEGREES
There are many types of master’s programs (NRC, 2008), just as there are many reasons that students pursue the master’s degree. Generally, STEM master’s degree programs take one of three forms. The more traditional-style STEM master’s degree program focuses on building subject matter expertise and includes a research project leading to a thesis or another type of capstone project. Within this type of degree program, there are professions such as engineering and psychology that recognize the master’s as a terminal degree, while in others, such as biology and physics, students enroll less frequently with the intent of seeking only a master’s degree. Some students may enroll in a Ph.D. program and, during the course of their studies, decide the Ph.D. degree does not fit their career plans, because they do not get the mentoring or other forms of support they need to succeed at that level, or because the master’s degree allows them to secure well-paying jobs without having to complete a Ph.D. (CGS, 2010). For others, the decision may not be mutual because institutions have the authority to ask Ph.D. students who do not perform adequately to leave the program early; if they have completed enough requirements of the program, they may receive a master’s degree.
Additionally, there are master’s degree programs in which students may enroll with the intention of seeking a master’s, and then have the option to enroll in a Ph.D. program during the course of their study. Looking at time to completion, 41 percent of students completed their master’s degrees within 2 years, 60 percent within 3 years, and 66 percent within 4 years (CGS, 2013).
Another type of STEM master’s degree is the 2-year Professional Science master’s (PSM). This degree program, developed in the late 1990s with input from industry leaders and funding from the Alfred P. Sloan Foundation, is designed specifically to fill the need for scientists who have been trained to work primarily outside of academia. The PSM degree combines rigorous, discipline-based coursework in science and mathematics with training in management, law, and other business areas. This degree is typically self-financed by the student.
Thanks in part to funding from the Alfred P. Sloan Foundation to establish the program in 1997—the foundation’s funding ended in 20101—as well as more recent funding from the National Science Foundation, there are now 355 PSM programs offered by 165 U.S. institutions.2 The Council of Graduate Schools (CGS) has developed a guide for schools intending to develop a PSM program, and there is a national PSM office, formerly run by CGS and now operated by the Keck Graduate Institute. According to 2014 data, the fields with the most PSM
___________________
1 See https://sloan.org/programs/completed-programs/professional-science-masters-degree#history (accessed February 26, 2018).
2 See https://www.professionalsciencemasters.org/program-locator (accessed January 23, 2018).
programs are environmental and climate sciences (47), biotechnology (41), other biological sciences (36), and computer and information sciences (28) (Komura, 2015). Approximately 80 percent of these programs are delivered at in-person settings, while the remaining 20 percent are delivered online or as a combination of in-person and online instruction. In 2014, slightly over half of the enrollees were male, 15.3 percent were from underrepresented groups, and 21.8 percent were temporary residents. Using the Carnegie Classifications for Higher Education,3 PSM host institutions vary by research focus and size: 56 master’s colleges and universities (larger programs); 43 research universities, very high research activity; 30 research universities, high research activity; 13 doctoral research universities; nine other; six master’s colleges and universities (smaller programs); and five master’s colleges and universities (medium-size programs).4
When CGS asked recent graduates to identify the benefits from having earned a PSM degree, 80.8 percent said it was to acquire specific skills and knowledge, 46.6 percent said it was to increase opportunities for promotions, and 26.5 percent said it was to meet requirements of a current or prospective employer (Allum, 2013). Recent program graduates ranked their satisfaction highly, with 87 percent selecting “very satisfied” or “generally satisfied” for the quality of the scientific and/or mathematics training and the internships and “real world” practical experiences they gained through their programs. Other aspects of the program that recent graduates rated with high satisfaction included the distinctive nature of the program (83 percent); quality of the nonscientific professional training they acquired (82 percent); networking opportunities (78 percent); and post-graduation employment prospects (72 percent) (Allum, 2013).
Many master’s programs are characterized by flexibility and adaptability to the changing nature of scientific and technical disciplines and to workforce demands, and many attempt to integrate the physical, biological, and social sciences, and in some cases the humanities and arts. The variation in master’s degree programs gives them a comparative advantage over Ph.D. programs in that a given program can tailor the number of credit hours, types of experiences, depth of research, and the development of technical skills and transferrable competencies to quickly meet changing student and employer needs. While master’s degree programs can also serve as test beds for innovation in graduate education, the efficacy of the programs requires additional evaluation, assessment, and research. With a shorter time to degree than the Ph.D., and because many students fund their own master’s degree program, institutions may establish and adapt master’s programs to respond to workforce demands, sometimes in partnership with industry, and to anticipate emerging interdisciplinary fields.
Despite the variation, the committee believes that there should be common criteria for what constitutes a master’s degree, no matter the STEM field, as
___________________
3 See http://carnegieclassifications.iu.edu/definitions.php (accessed March 26, 2018).
4 See https://www.professionalsciencemasters.org/reports-statistics/carnegie-classifications (accessed March 26, 2018).
part of providing an ideal graduate STEM education to all students as described in Chapter 6 in full. To find a vision for core educational elements of master’s degrees, the committee reviewed CGS’s Alignment Framework for the Master’s Degree.5 This alignment framework was the product of a year-long dialogue that included 150 graduate school deans (Augustine, 2017). Of the three defining characteristics of master’s degree programs, the section on competencies in the CGS framework describes four elements that should be common among master’s degree programs:
- Disciplinary and interdisciplinary knowledge: Master’s students should develop core disciplinary knowledge and the ability to work between disciplines.
- Professional competencies: Master’s students should develop abilities defined by a given profession (e.g., licensing, other credentials).
- Foundational and transferrable skills: Master’s students should develop skills that transcend disciplines and are applicable in any context, such as communications, leadership, and working in teams. These dimensions are especially critical as the lines that traditionally define scientific and engineering disciplines become blurred—and more scientific research and application are characterized by the convergence of disciplines.
- Research: Master’s students should develop the ability to apply the scientific method, understand the application of statistical analysis, gain experience in conducting research and other field studies, learn about and understand the importance of research responsibility and integrity, and engage in work-based learning and research in a systematic manner.
RECOMMENDATION 4.1—Core Competencies for Master’s Education: Every STEM master’s student should achieve the core scientific and professional competencies and learning objectives described above:
- Institutions should verify that every graduate program they offer provides for the master’s core competencies outlined in this report and that students demonstrate that they have achieved them before receiving their degrees.
- Graduate departments should publicly post how their programs reflect the core competencies for master’s students, including the milestones and metrics they use in evaluation and assessment.
- Federal and state funding agencies should adapt funding criteria for institutions to ensure that all master’s students they support—regardless of mechanism of support—are in programs that ensure that they develop,
___________________
5 See http://cgsnet.org/alignment-framework-master%E2%80%99s-degree (accessed March 26, 2018).
-
measure, and report student progress toward acquiring the scientific and professional competencies outlined in this report.
- Graduate students should create an individual development plan that includes the core competencies, as outlined in this report for master’s degrees, as a key feature of their own learning and career goals and that utilizes the resources provided by their university and relevant professional societies.
- Students should provide feedback to graduate faculty and deans about how they could help students better develop these competencies.
CAREER OUTCOMES OF STEM MASTER’S DEGREE HOLDERS
As noted above, one of the challenges in understanding how the master’s degree fits into the overall STEM career picture arises from the lack of current research and data on the STEM master’s degrees. The most recent data on employment of U.S. scientists and engineers with master’s degrees were collected in 2013 (NSB, 2016b6). These data show that master’s degree holders play a vital role in the STEM workforce. Of the 2.6 million employed scientists and engineers with master’s degrees as their highest degree, 53 percent work in industry, 12.6 percent work for state and federal governments, 11.7 percent have jobs at 2-year and precollege institutions, and 9.4 percent work at 4-year universities and colleges. Of the 2.9 million STEM master’s degree holders in the workforce, the largest fields are social and behavioral sciences at 918,000; engineering at 788,000; and computer science and mathematics at 719,000 (Table 4-1). In terms of the distribution of STEM master’s degree holders across broad sectors of employment, the majority were working in business or industry (65.6 percent), followed by education (21.2 percent), and then government (13.2 percent).
In contrast to the job market for STEM Ph.D.’s, where there are concerns about increasingly limited opportunities for tenure-track academic positions, the entry-level job market for those holding master’s degrees is projected to grow nearly twice as fast as the entry-level job market overall, in large part because of technology-driven changes in the U.S. economy. According to the BLS, jobs requiring a master’s degree for entry are projected to grow the fastest—18.4 percent from 2012 to 2022, compared to 10.8 percent growth in overall employment (BLS, 2013). For example, the BLS projects that employment in occupations requiring master’s degrees in computer science or mathematics will grow by 26.3 percent from 2012 to 2022, compared to an 18.0 percent increase for bachelor’s degree and 15.3 percent for jobs requiring a Ph.D. Similarly, in the life, physical, and social sciences, the BLS projects the demand for an entry-level master’s degree will grow by 13.6 percent and for Ph.D.’s by 12.6 percent. A 2016 analysis
___________________
6 See https://www.nsf.gov/statistics/2016/nsb20161/#/report/chapter-3/s-e-workers-in-the-economy (accessed January 23, 2018).
| Field | Total Number | Education (%) | |
|---|---|---|---|
| 4-Year Institutions | 2-Year and Precollege Institutions | ||
| S&E | 2,934,000 | 10.6 | 10.6 |
| Computer science and mathematics | 719,000 | 7.6 | 7.9 |
| Biological, agricultural, and environmental life sciences | 345,000 | 24.9 | 11.3 |
| Physical and related sciences | 163,000 | 17.2 | 12.3 |
| Social and related sciences | 918,000 | 10.2 | 20.5 |
| Engineering | 788,000 | 6.0 | 0.9 |
SOURCE: Adapted from NSB, 2018b.
conducted by Fortune magazine and the career site PayScale found that 13 of the top 15 graduate degrees for getting jobs are in STEM fields (Dishman, 2016).
Workforce issues for master’s STEM degree holders also vary by citizenship status. International students’ degrees were heavily concentrated in computer sciences, economics, and engineering, where they received more than 4 out of 10 of all master’s degrees awarded in 2013. Within engineering, students on temporary visas earned more than half of the master’s degrees in electrical and chemical engineering (NSB, 2016b). For students interested in pursuing jobs in the tech sector, the job market for domestic talent allows most students to pursue jobs with a bachelor’s degree; however, for international students, the master’s degree provides them with prospects for employment and residency in the United States (Wingfield, 2017). Given the heavy mix of international students enrolled in STEM master’s degree programs, the policies, political landscape, and economic environment in the United States can significantly affect the relationship between master’s education and workforce opportunities for international students.
A 2014 study found that employers increasingly view the master’s degree as a professional credential in its own right, dispelling the notion prevalent in some disciplines that master’s degrees are granted only to students unable to complete a doctoral program (Gallagher, 2014). Employers reported that they viewed the master’s degree as a screening tool and as a discrete demonstration of technical skills and competency. The study also showed that employers are increasingly viewing the master’s degree as a key qualification for future leadership roles.
The amount a master’s degree can enhance one’s careers prospects varies by field. For some STEM occupations, there is an associated “wage premium” that varies by specialty (Table 4-2). For example, within engineering, civil engineers,
| Business or industry (%) | Government (%) | |||
|---|---|---|---|---|
| For-profit Businesses | Self-Employed Unincorporate Businesses | Nonprofit Businesses | Federal Government | State or Local Government |
| 53.6 | 4.0 | 8.0 | 6.3 | 6.9 |
| 66.8 | 2.4 | 6.0 | 4.3 | 4.9 |
| 36.8 | 2.9 | 8.1 | 8.1 | 7.8 |
| 52.8 | 3.7 | 4.3 | 5.5 | 3.7 |
| 31.2 | 6.3 | 15.4 | 6.4 | 10.2 |
| 75.1 | 3.0 | 2.3 | 7.4 | 5.3 |
mechanical engineers, and architectural and engineering managers had median wages that were between 9 and 13 percent more for workers who had a master’s degree compared with those of workers who had a bachelor’s degree. In contrast, petroleum, mining, and geological engineers had a median wage that was about 7 percent less for workers with a master’s degree than a bachelor’s degree, and chemical engineers had a median wage that was about the same for workers who had either education level.
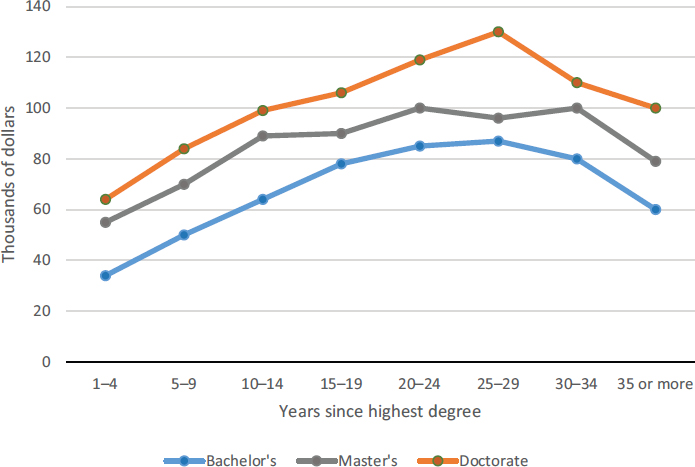
The most recent employment data from CGS (Allum, 2013), which documented initial hiring outcomes for 2012-2013 PSM graduates, found that almost 95 percent of the 2012-2013 graduates were employed in full-time positions, and 67.8 percent reported earning $50,000 or more in annual salary. Data from the National Center for Science and Engineering Statistics show that the median salary for all STEM master’s degree holders also exceeded $50,000 in the first 4 years after graduate school (Figure 4-1).
In light of the flexibility of the STEM master’s degree, both in terms of the degree structure and career pathways available to graduates, the committee makes the following recommendation.
RECOMMENDATION 4.2—Career Exploration for Master’s Students: Master’s students should be provided opportunities for career exploration during the course of their studies.
- Faculty, who serve as undergraduate advisors, should discuss with their students whether and how a master’s degree will advance the students’ long-term educational and career goals.
| Occupation | Employment with Bachelor’s Degree | Percentage of Workforce with Bachelor’s Degree | Employment with Master’s Degree |
|---|---|---|---|
| Mathematicians, statisticians, and other miscellaneous mathematical science occupations | 12,613 | 32 | 15,340 |
| Environmental scientists and geoscientists | 30,737 | 47 | 25,079 |
| Network and computer systems administrators | 76,462 | 39 | 21,479 |
| Web developers | 63,354 | 54 | 18,520 |
| Biological scientists | 26,993 | 43 | 21,414 |
| Chemists and materials scientists | 35,304 | 49 | 15,473 |
| Information security analysts | 23,569 | 45 | 8,658 |
a The wage premium represents the wage increase for workers with a master’s degree over that for workers with a bachelor’s degree in the occupation.
SOURCE: Torpey and Terrell, 2015. Adapted from U.S. Census Bureau, American Community Survey.
- Institutions should integrate professional development opportunities, including relevant course offerings and internships, into curriculum design.
- Master’s students should seek information about potential career paths, talk to employers and mentors in areas of interest, and choose a master’s program optimal for gaining the knowledge and competencies needed to pursue their career interests.
- Industry, nonprofit, government, and other employers should provide guidance and financial support for relevant course offerings at institutions and provide internships and other forms of professional experiences to students and recent graduates.
- Professional societies should collaborate with other sectors to create programs that help master’s students make the transition into a variety of careers.
FLEXIBLE AND INNOVATIVE PROGRAMS: CERTIFICATES AND MICROCREDENTIALS
Beyond the growth of traditional master’s degrees and PSMs, institutions have increased offerings in certificate or “microcredential” programs to allow
| Percentage of Workforce with Master’s Degree | Median Annual Wage for Bachelor’s Degree | Median Annual Wage for Master’s Degree | Wage Premium Amounta | Wage Premium Percent |
|---|---|---|---|---|
| 38 | $60,000 | $80,000 | $20,000 | 33 |
| 38 | 62,000 | 80,000 | 18,000 | 29 |
| 11 | 70,000 | 88,000 | 18,000 | 26 |
| 16 | 61,000 | 75,000 | 14,000 | 23 |
| 34 | 50,000 | 60,000 | 10,000 | 20 |
| 22 | 60,000 | 71,000 | 11,000 | 18 |
| 17 | 85,000 | 100,000 | 15,000 | 18 |
students to gain skills with a focus on career advancement. A graduate certificate program is a prescribed set of regular graduate-level academic courses, and these credits may fulfill degree requirements. Graduate certificate programs are a means for currently enrolled master’s and doctoral students, as well as post-baccalaureate students, to augment or supplement their degree, to explore new career options, and to develop expertise in a content area or skill. For employers, a certificate can signal a prospective employee’s competency in a desired specialization. Online graduate certificate programs provide students the flexibility to manage a full-time job or to navigate other personal demands.
The CGS Graduate Enrollment and Degrees: 2006-2016 (Okahana and Zhou, 2017) recorded 42,886 graduate certificates awarded in 2015-2016 across all fields, an 11.8 percent increase from 2014 to 2015. The predominant fields were education at 30.9 percent, business at 14.7 percent, and health sciences at 14.4 percent. These fields, which tend to have more women than other STEM disciplines, may contribute to the gender difference in graduate certificates awarded, with 63.1 percent going to women and 36.9 going to men. STEM fields comprise relatively smaller fractions of the total graduate certificates earned; however, some of the fields showed robust growth between 2006 and 2016, such as 38.6
SOURCE: Adapted from NSB, 2018c, Fig. 3-20.
percent growth in engineering and 26.1 percent growth in the biological and agricultural sciences, compared to the 11.8 percent average across all fields.
In 2016, edX,7 an online learning provider founded by Harvard University and MIT, launched 19 MicroMasters programs at 14 institutions, including MIT, the University of Pennsylvania, Georgia Tech, and the University of Michigan. The MicroMasters programs included a corporate advisory board to help develop the programs with industry employers in mind. These programs allow students the flexibility to advance through the program while maintaining their day jobs, and students can transfer their MicroMasters into academic credit if accepted by the master’s degree program at associated institutions. While the MicroMasters programs address a broad range of disciplines, several of the programs focus on developing skills needed in emerging issues in STEM such as data science, artificial intelligence, bioinformatics, and cloud computing.
To date, only one of the edX MicroMasters programs has been completed, the Supply Chain Management program from MIT. For this program, of the 200,000 people enrolled, nearly 19,000 or 9.5 percent were awarded certificates; learners can take the course for free and do not need to pursue the certification.
___________________
7 See https://www.edx.org/ (accessed March 17, 2018).
Boston University released information regarding its course in Digital Transformation Strategy: 12,153 total enrollments, 587 completed (4.6 percent), and 284 (2.3 percent) completed and verified with a certificate (Smith, 2017). The total enrollment figure might be an outlier attributed to first-run novelty, because the second round of the course enrolled 4,463 students, and low completion rates for online courses remain a concern. In a report released by HarvardX and MITx on their open online courses, these institutions report that 5.5 percent of participants earned certificates from 2012 to 2016; however, the report contends that given that the dearth of data on student intention and motivation for enrolling in the program, certification completion rates may not provide a useful metric for evaluation (Chuang and Ho, 2016). The limited understanding about graduate certificate programs represents an issue for additional research and inquiry.
In addition to online microcredential programs, such as the ones mentioned above, some institutions also offer students the opportunity to earn full master’s degrees either through fully online programs or through blended learning, which includes face-to-face and online components. One high-profile example of a recently launched online master’s program is the computer science program offered by Georgia Tech. Announced in 2013 in partnership with Udacity and with funding from AT&T, the 3-year program features a lower cost to students at less than $7,000 ($134 per credit in comparison to $472 for in-state students and $1,139 for out-of-state students) (Young, 2013). As of fall 2017, the program had enrolled approximately 5,900 students and graduated nearly 600 students; however, there is a notable difference in enrollment between genders with 85.6 percent male and 14.4 percent female (Georgia Tech, 2017). Although it is an imperfect comparison, for reference, in 2013 male students earned 73 percent of all master’s computer science degrees (NSB, 2016a). The program states that 15 percent of the students are from historically underrepresented groups compared to 11.5 percent of master’s computer science degrees earned by students who identified as black or African American, Hispanic, or American Indian or Alaska Native in 2013 (Georgia Tech, 2017; NSB, 2018a).8 Citing a positive response, Georgia Tech announced in 2017 that it was offering a fully online master’s degree in analytics, again featuring low cost and broader access as key features of the program: “[In 2017] Georgia Tech expects to receive more than 1,000 applications for the residential program [in analytics], which can only fit about 70 students. That means the institute must turn away about 800 qualified applicants” (Straumsheim, 2017). The hope is that some of those 700-plus students will enroll in the online master’s program.
According to the website OnlineU, at least 80 accredited institutions offer online master’s programs, ranging from chemistry and engineering to clinical
___________________
8 These three groups were selected to align with the groups featured in the underrepresented groups in science and engineering according to the Women, Minorities, and Persons with Disabilities in Science and Engineering report (NCSES, 2017).
psychology and physics.9 While this is not a comprehensive census of available online STEM master’s programs, it demonstrates the significant institutional and public interest in distance learning options for these credentials. Despite the range of options, from microcredential to full degree and fully online or blended, there are little data or published research on these programs. The limited amount of research in this area means that the ability to draw broader conclusions from these examples is constrained. As online platforms for education delivery at the degree or microcredential level continue to expand, research on student motivation and intention, enrollment, persistence, and completion could help inform future program design.
As this report discusses in Chapter 3, there is a lack of data collected on the outcomes of STEM graduate programs, and this is certainly true in the case of master’s degrees. Indeed, there is a general dearth of data and research on factors such as motivation for seeking a master’s degree, the characteristics of programs and institutions that help or hinder completion, and why enrollment among underrepresented minorities continues to lag, though less so than with doctoral programs. In a rapidly evolving environment, it is always important to monitor outcomes and quality of programs and educational and career outcomes of students. Universities and the students they serve would be well served if they monitored these programs, used the resulting information to build a culture that better appreciates master’s students, and made the data available to current and prospective students. (See Chapter 3, Recommendation 3.2, for additional information on data transparency.)
CGS reported on the results of a pilot study of STEM master’s programs that aimed to identify factors contributing to the successful completion of the degree (CGS, 2013). Students surveyed as part of this study cited the desire to support professional aspirations by increasing knowledge and skills as the most common reason for enrolling in a master’s degree program. Other less frequently cited reasons included a desire to increase opportunities for promotion, advancement, or higher pay, and to learn about a new area of interest. This study found that two-thirds of students who enrolled in STEM master’s degree programs had completed their degrees within 4 years. Some 10 percent of students left their programs within 6 months, and nearly a quarter had dropped out after 2 years (CGS, 2013). The study found that the two most crucial factors contributing to the successful completion of a master’s program were motivation and nonfinancial family support, while conflicts with existing work responsibilities was the main reason students were unable to complete their master’s degree programs.
The foregoing discussion emphasizes both that there is a growing demand for STEM master’s degree programs from students and employers, and that a growing number of institutions are offering them to meet that demand. It is essential that highly competent faculty are engaged in teaching in those programs.
___________________
9 See https://www.onlineu.org/college-list?pid=&lvl=8 (accessed March 26, 2018).
For those reasons, covered in detail in Chapter 3, the committee made Recommendation 3.1, Rewarding Effective Teaching and Mentoring, which included specific provisions for supporting and rewarding faculty contributions to master’s students and education.10
REFERENCES
AFL-CIO. 2016. The STEM Workforce: An Occupational Overview. Available: http://dpeaflcio.org/programs-publications/issue-fact-sheets/the-stem-workforce-an-occupational-overview/ (accessed May 10, 2018).
Allum, J. R. 2013. Outcomes for PSM alumni: 2012/13. Washington, DC: Council of Graduate Schools.
Augustine, R. 2017. The alignment framework for the master’s degree. GradEdge 6(1). Available: http://cgsnet.org/january-2017-gradedge (accessed May 9, 2018).
BLS (U.S. Bureau of Labor Statistics). 2013. Occupational employment projections to 2022. Monthly Labor Review. Available: https://www.bls.gov/opub/mlr/2013/article/occupational-employment-projections-to-2022.htm (accessed March 26, 2018).
Chuang, I., and A. Ho. 2016. HarvardX and MITx: Four years of open online courses—fall 2012-sum-mer 2016. Available at SSRN: https://dx.doi.org/10.2139/ssrn.2889436.
CGS (Council of Graduate Schools). 2005. Master’s education: A guide for faculty and administrators, a policy statement. Washington, DC: CGS.
CGS. 2010. Ph.D. Completion project: Policies and practices to promote student success. Washington, DC: CGS.
CGS. 2013. Completion and attrition in STEM master’s programs. Washington, DC: CGS.
Dishman, L. 2016. Best and worst graduate degrees for jobs in 2016. Fortune, March 21. Available: http://fortune.com/2016/03/21/best-worst-graduate-degrees-jobs-2016/ (accessed March 17, 2018).
Gallagher, S. R. 2014. Major employers’ hiring practices and the evolving function of the professional master’s degree. M.S. thesis, Northeastern University, Boston, MA. Available: http://hdl.handle.net/2047/d20004969.
Georgia Tech. 2017. Online master of science in computer science: 2017 program updates. Available: https://www.omscs.gatech.edu/sites/default/files/images/omscsreport2017.pdf.
Komura, K. 2015. Enrollment and degrees in professional science master’s (PSM) programs, Part I, 2014. Claremont, CA: Keck Graduate Institute.
___________________
10Chapter 3 RECOMMENDATION 3.1—REWARDING EFFECTIVE TEACHING AND MENTORING: Advancement procedures for faculty, including promotion and tenure policies and practices, should be restructured to strengthen recognition of contributions to graduate mentoring and education.
- Federal and state funding agencies should align their policies and award criteria to ensure that students in the programs they support experience the kind of graduate education outlined in this report and achieve the scientific and professional competencies articulated here, whether they are on training or research grant mechanisms.
- Institutions should require faculty and postdoctoral researchers who have extensive contact with graduate students to learn and demonstrate evidence-based and inclusive teaching and mentoring practices.
- Institutions should include teaching and mentoring performance as important considerations for reappointment, promotion, and tenure decisions. Institutions should also nominate faculty for external awards (such as those from technical societies) that reward teaching excellence.
NCSES (National Center for Science and Engineering Statistics). 2017. Women, minorities, and persons with disabilities in science and engineering: 2017. Special Report NSF 17-310. Arlington, VA: National Science Foundation.
NRC (National Research Council). 2008. Science professionals: Master’s education for a competitive world. Washington, DC: The National Academies Press.
NSB (National Science Board). 2016a. Appendix Table 2-28, Earned master’s degrees, by sex and field: 2000-13. Science and engineering indicators 2016. NSB-2018-1. Alexandria, VA: National Science Foundation. Available: https://nsf.gov/statistics/2016/nsb20161/uploads/1/12/at02-28.pdf (accessed January 23, 2018).
NSB. 2016b. Science and engineering indicators 2016. Arlington, VA: National Science Foundation.
NSB. 2018a. Appendix Table 2-28, Earned master’s degrees, by citizenship, field, race, and ethnicity: 2000–15. Science and engineering indicators 2018. NSB-2018-1. Alexandria, VA: National Science Foundation. Available: https://www.nsf.gov/statistics/2018/nsb20181/assets/561/tables/at02-28.pdf (accessed March 16, 2018).
NSB. 2018b. Appendix Table 3-5: Employment sector of S&E highest degree holders, by level and field of highest degree: 2015. Science and engineering indicators 2018. NSB-2018-1. Alexandria, VA: National Science Foundation. Available: https://nsf.gov/statistics/2018/nsb20181/assets/901/tables/at03-05.pdf (accessed March 22, 2018).
NSB. 2018c. Science and engineering indicators 2018. NSB-2018-1. Alexandria, VA: National Science Foundation.
Okahana, H., and E. Zhou. 2017. Graduate enrollment and degrees: 2006 to 2016. Council of Graduate Schools. Available: http://cgsnet.org/ckfinder/userfiles/files/Intl_Survey_Report_Fall2017.pdf (accessed March 17, 2018).
Smith, J. 2017. BU’s first MicroMasters programs off to a great start. Available: https://digital.bu.edu/bus-first-micromasters-programs-off-to-a-great-start/ (accessed March 26, 2018).
Straumsheim, C. 2017. Georgia Tech’s model expands. Inside Higher Ed, January 12. Available: https://www.insidehighered.com/news/2017/01/12/georgia-tech-launches-second-low-cost-online-masters-degree-program (accessed March 17, 2018).
Torpey, E., and D. Terrell. 2015. Should I get a master’s degree? Career Outlook. Available: https://www.bls.gov/careeroutlook/2015/article/should-i-get-a-masters-degree.htm#STEM (accessed January 23, 2018).
Wingfield, N. 2017. The disappearing American grad student. The New York Times, November 3. Available: https://www.nytimes.com/2017/11/03/education/edlife/american-graduate-student-stem.html (accessed March 17, 2018).
Young, J. R. 2013. Georgia Tech to offer a MOOC-like online master’s degree, at low cost. Chronicle of Higher Education, May 14. Available: https://www.chronicle.com/article/Ga-Tech-to-Offer-a-MOOC-Like/139245 (accessed March 17, 2018).


