
D
Methods for Chapter 4
PART 1: MODELING
Contents
Unsafe and Harmful Medical Care
Falsified and Substandard Medications
HIV/AIDS Morbidity and Mortality
Tuberculosis (TB) Morbidity and Mortality
Pneumonia (PN) Inpatient Mortality (under 5 years old)
Diarrhea Mortality (under 5 years old)
Acute Myocardial Infarction (AMI) Inpatient Mortality
Congestive Heart Failure (CHF) Inpatient Mortality
Ischemic and Hemorrhagic Stroke Inpatient Mortality
Chronic Obstructive Pulmonary Disease (COPD) Inpatient Mortality
Excess Maternal Mortality Among Attended Births
Excess Neonatal Mortality Among Attended Births
Rotavirus Mortality (under 5 years old)
6 Patient Centeredness and Timeliness
SAFETY
Unsafe and Harmful Medical Care
Assumption
- Disability weights, duration, and mortality from Jha and colleagues (2013) are still applicable.
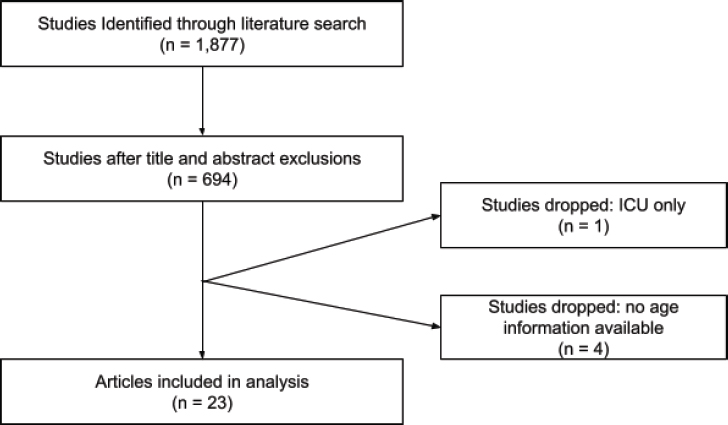
We estimated the burden of unsafe and harmful medical care as a continuation of the published work from Jha and colleagues (2013). We combined studies from Jha et al. (2013) with an updated literature search, and excluded studies that were missing population information and those that focused only on intensive care unit (ICU) patients. For each safety indicator, we calculated a weighted average incidence rate and age from this new sample of studies. We used the same mortality rates, disability weights, distribution of short-/long-term disability, and duration of disability as those used by Jha et al. We calculated disability-adjusted life years (DALYs) for six safety events: adverse drug events, thromboembolism from medical care, falls in hospital, pressure sore and decubitus ulcers, ventilator-associated pneumonia, and urinary tract infections. We updated the formula used by Jha et al. by removing social weights and age discounting. We obtained an updated estimate of total hospitalizations in low- and middle-income countries (LMICs) (estimated to be 531 million) from a forthcoming Institute for Health Metrics and Evaluation (IHME) publication.
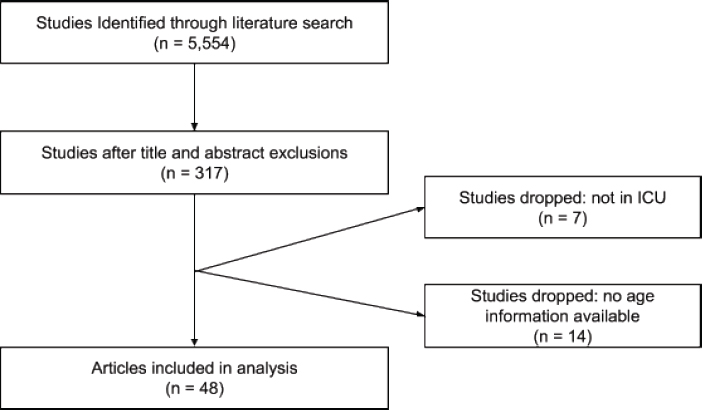
When calculating the burden of ventilator-associated pneumonia we focused exclusively on ventilated patients in the ICU, which necessitated the use of a separate denominator. To calculate the appropriate denominator, we assumed that ICU beds in LMICs were 1.5 percent of total hospital
beds, based on literature. We obtained the total number of hospital beds (13.4 million) using data from the World Bank from 2000 up to the most recent year available, and multiplied this by 1.5 percent to obtain the number of ICU beds (0.2 million). The estimate of 531 million hospitalizations implies a use rate of 11 percent given our estimate of hospital beds. We assumed that this use rate was the same for ICU beds, thus calculating an estimated 8 million number of ICU hospitalizations in LMICs. Data from the International Nosocomial Infection Control Consortium (INICC) suggests that the ratio of ventilator to ICU days is 0.38, which we applied to ICU hospitalizations to obtain the total number of ventilated ICU hospitalizations (3.1 million). This number was used as the denominator for ventilator-associated pneumonia while total hospitalizations were used for all other safety indicators.
In addition, we did not update the literature search for urinary tract infections but used the studies that were included in Jha et al., excluding those that were exclusively in the ICU.
Falsified and Substandard Medications
Assumption
- Those receiving counterfeit or substandard drugs are considered untreated.
The main approach to estimating the burden of falsified medications was informed by estimates of falsified medication from a 2017 World Health Organization (WHO) report, A Study on the Public Health and Socioeconomic Impact of Substandard and Falsified Medical Products (WHO, 2017). These data provide a lower, middle, and upper-end approximation that we use to provide a range of uncertainty for our estimates.
We applied the burden of falsified medications to the HIV/AIDS and tuberculosis (TB) indicators. Estimating the burden of falsified medications varied somewhat for each indicator. In every case, we assumed that the rate of falsified medications identified in the WHO report was equivalent to that share of patients receiving falsified medications, which most likely overestimates the number of patients affected. However, this bias is counter to that attributable to the conservative definition of substandard drugs used by WHO. To simplify the analysis, we assumed that patients receiving falsified medication had the same outcomes as the untreated population.
Detailed methods for applying falsified estimates can be found below in the HIV/AIDS and TB methods.
COMMUNICABLE DISEASES
HIV/AIDS Morbidity and Mortality
Assumptions
- People dying from HIV/AIDS were not retained in treatment, and those who were retained in treatment do not die from HIV.
- Mean age of death from untreated HIV/AIDS was assumed to be the same regardless of whether status was known.
- Mortality rate among the untreated is the same regardless of known status.
- Adherence and counterfeit rates are the same between low-, middle-, and high-income countries.
- Outcomes for the nonadherence and those on counterfeit medications are equivalent to those who were untreated.
- Those on substandard or falsified medications are untreated.
Variable Definitions
| Variable | Definition | Source |
|---|---|---|
| Prevalence | Number of diagnosed and undiagnosed HIV/AIDS cases | IHME |
| Known status | Of all HIV/AIDS patients, share that know their status | UNAIDS, AIDSInfo |
| Treated | Of all HIV/AIDS patients, share that are on antiretroviral therapy (ART) | UNAIDS, AIDSInfo |
| Deaths | Deaths from untreated HIV/AIDS | IHME |
| Age of death | Mean age of death from untreated HIV/AIDS | IHME |
| Disability weights | Disability attributable to HIV/AIDS | Global Burden of Disease (GBD) Study, 2016 |
The percent of people with known HIV/AIDS status and the share receiving ART (both as a share of all HIV/AIDS patients) in LMICs was identified using the UNAIDS AIDSInfo 2016 database. A total of 71 LMICs (52 percent) reported data on known HIV status, and 114 (83 percent) reported data on treatment status. Where treatment status was available
and known status was not, we used the share on treatment as a proxy for known status, with the understanding that this is an underestimate. We used the sample of countries for which data were available (83 percent) to extrapolate to the population of all LMICs. Notably, extrapolation has a minor effect on our results, since the countries within our sample account for 99.9 percent of the population in LMICs.
Prevalence of HIV, deaths attributed to HIV, and mean age of death were obtained from IHME’s 2014 GBD database. We assumed that people dying from HIV/AIDS were all untreated and those who are treated do not die from HIV. Mean age of death from untreated HIV/AIDS was assumed to be the same regardless of whether status was known. The midpoints for age bins were used as single-year age estimates. The average age of death was weighted for the number of HIV deaths by country. A half-cycle correction was applied by adding 0.5 years to the mean age of death (equivalently, we can subtract 0.5 years from the remaining life expectancy) to account for double counting between years lived with disability (YLD) and years of life lost (YLL).
Disability weights for HIV/AIDS were obtained from GBD, 2016. We used a weighted average of the weights provided for HIV (0.33) and AIDS (0.66) based on the natural history of disease progression in which 94 percent of time is spent with HIV and 6 percent with AIDS.
Additionally, we sought to include estimates of the effect of substandard and falsified medications, as well as adherence, on HIV/AIDS mortality and morbidity. To obtain estimates of adherence, we conducted a literature search, and estimate that 73 percent of patients adhere to HIV medications. To obtain estimates of falsified medication, we rely on the Study on the Public Health and Socioeconomic Impact of Substandard and Falsified Products (WHO, 2017). The review includes 1,018 HIV samples. We used a falsified range of 3.1 percent, 4.2 percent, and 5.7 percent. Our primary estimates use the midpoint of this range. We apply these percentages to the number of patients on treatment to obtain the number of patients who are on falsified medication. To incorporate these estimates, we assume that those on falsified medications and those who are nonadherent are effectively untreated.
Our baseline calculation uses the following formulas:
YLL Components
Deaths Among Diagnosed Untreated = (%known status – %treated) / ((1 – %known status) + (%known status – %treated)) * deaths
Remaining Life Expectancy = 83.5 – (age of death + 0.5)
YLL = deaths * remaining life expectancy
YLD Components
Prevalence Among Untreated Diagnosed = (%known status – %treated) * prevalence
YLD = prevalence among untreated diagnosed * disability weights
To incorporate falsified drugs we adjust our treatment variable by subtracting the share of falsified drugs from the treatment rate to come up with a falsified-adjusted treatment rate. To incorporate nonadherence into this estimate, we multiply the adherence rate (conditional on treatment) by the baseline treatment rate and subtract the share of falsified drugs. We then recalculate YLL and YLD as above with the new adherence- and falsified-adjusted treatment rate.
To calculate excess we hold adherence and counterfeit medicine rates constant and adjust for differences in population as follows, where outcome is defined as either YLD, YLL, or deaths:
Tuberculosis (TB) Morbidity and Mortality
Assumptions
- Average age of death for those treated and untreated for TB is the same.
- Incidence-based case detection rate is applicable to prevalence.
- All those on falsified medications are effectively untreated.
Variable Definitions
| Variable | Definition | Source |
|---|---|---|
| Prevalence | Number of diagnosed and undiagnosed TB cases, excluding latent TB infection | IHME |
| Untreated | Patients lost to follow-up as a proxy for nontreatment, conditional on diagnosis | WHO Global Tuberculosis Report Database |
| Variable | Definition | Source |
|---|---|---|
| Case detection rate | The number of new and relapsed TB cases notified to WHO in a given year, divided by WHO’s estimate of the number of incident tuberculosis cases for the same year, expressed as a percentage | WHO Global Tuberculosis Report Database |
| Mortality rate | Mortality from TB, varying by smear positive versus smear negative and HIV status | Literature search |
| Age of death | Mean age of death from untreated TB | IHME |
| Disability weights | Disability attributable to TB | GBD, 2016 |
Data on case detection rate, treatment, and the percentage of TB patients co-infected with HIV were obtained from the WHO Global Tuberculosis Report Database. We used patients lost to follow-up as a proxy for nontreatment (4.7 percent). Given that the WHO report only provides incidence data, we obtained prevalence of drug-susceptible, drug-resistant, and extensively drug-resistant TB from the IHME GBD 2014 database. We multiplied the case detection rate from WHO by the IHME prevalence to obtain the number of diagnosed TB cases.
We calculated the number of untreated TB patients co-infected with HIV as a share of total untreated patients (7.6 percent) to account for differences in disability weights between those infected (0.43825) and not infected with HIV (0.33). We calculated a weighted disability weight of 0.338.
Average remaining life expectancy was calculated by obtaining YLL from the IHME database and dividing by deaths in the IHME database. The key assumption made here is that the average age of death for the treated and untreated is the same.
We obtained a range of estimates of mortality rates by smear positive and HIV status from the literature and from a WHO publication. The absence of data on the untreated in the WHO database is why we look to alternative sources for an untreated mortality rate. We allowed average age of death to vary between types (drug susceptible 31.05 years, multidrugresistant [MDR] 30.74 years, and extensively drug resistant [XDR] 30.13 years) of TB, based on data in the IHME database. While we do not allow mortality rates to vary by TB type, we note that MDR TB only accounts
for 3.4 percent of global TB cases, and XDR accounts for 0.17 percent of global TB cases. Thus, even allowing mortality rates to vary would have little effect on our estimates.
Additionally, we sought to include estimates of the effect of substandard and falsified medications on TB mortality and morbidity. To obtain estimates of substandard and falsified medication, we rely on the Study on the Public Health and Socioeconomic Impact of Substandard and Falsified Products (WHO, 2017). The review includes 4,920 TB samples. We used a falsified range of 6 percent, 6.7 percent, and 7.4 percent. Our primary estimates use the midpoint of this range. We apply these percentages to the number of patients on treatment to obtain the number of patients who are on falsified medication. To incorporate these estimates, we assume that those on falsified medications are effectively untreated.
For the main calculation, we calculated total extrapolated prevalence across each TB category, then multiplied by the case detection rate (62 percent) and untreated rate (4.7 percent) to calculate a total diagnosed-untreated prevalence in LMICs. We developed a set of two mortality rates using different estimates of smear-positive and smear-negative TB distribution, and different estimates of mortality among the HIV+ population.
The first mortality rate (46.6 percent) is a weighted average of four mortality rates, that are in turn weighted for the distribution of smear-positive (SM +) and smear-negative (SM –) TB, based on the 2013 WHO TB report (WHO, 2013) and Tiemersma and colleagues’ (2011) work.
- HIV negative, smear positive = 70 percent
- HIV negative, smear negative = 20 percent
- HIV positive, smear positive = 83 percent
- HIV positive, smear negative = 74 percent
The second mortality rate (36.7 percent) is also made up of four mortality rates; however, these mortality rates rely on data from (Dowdy and Chaisson, 2009), which has different estimates of the distribution of smear negative and smear positive, and different mortality rates for HIV positive/negative status:
- HIV negative, smear positive = 50 percent
- HIV negative, smear negative = 16.5 percent
- HIV positive, smear positive = 100 percent
- HIV positive, smear negative = 100 percent
We calculate the weighted average mortality rate using the following formula:
(((MortalityHIV–,SM+ * (SM+%)) + (MortalityHIV–,SM+ * (SM–%))) * HIV–%) + (((MortalityHIV+,SM+ * (SM+%)) + (MortalityHIV+,SM+ * (SM–%))) * HIV+%)
The final two mortality rates (46.7 percent and 36.7 percent) were used to develop a range of DALY estimates. We used a half cycle correction to adjust for double counting between YLD and YLL. The population accounted for in the data represented 99 percent of the LMIC population, meaning that extrapolation had little effect on our estimates.
Between HIV status, we calculated a weighted average disability weights using the HIV infected-patient share of untreated patients.
The final calculations were as follows:
YLL = prevalence * case detection rate * %untreated * mortality rate * (83.5 – (age of death + 0.5))
YLD = prevalence * case detection rate * %untreated * disability weights
To incorporate falsified drugs we subtract diagnosed untreated prevalence (calculated by multiplying the untreated rate by diagnosed prevalence) from diagnosed prevalence (this gives us diagnosed treated prevalence) and multiply by the falsified drug rate, which gives us an estimate of counterfeit-treated prevalence. All other calculations are carried on as above.
Pneumonia (PN) Inpatient Mortality (under 5 years old)
Assumptions
- Average age of death for children less than 5 is 2.5 years old.
- Care seeking for PN among children is a proxy for PN hospitalization rates in LMICs.
- Sampling distribution of mortality rates follows a beta distribution.
Variable Definitions
| Variable | Definition | Source |
|---|---|---|
| Prevalence (of lower respiratory illness) | Total diagnosed and undiagnosed PN cases, under 5 years old | IHME |
| Variable | Definition | Source |
|---|---|---|
| Care seeking | Children under 5 with symptoms of pneumonia taken to a health care provider; used as proxy for hospitalizations | UNICEF aggregation of Demographic and Health Surveys (DHS), Multiple Indicator Cluster Surveys (MICS), National Universities Commission Surveys (NUCS), and other data sources |
| Mortality rate, LMIC | Inpatient PN mortality rate in LMICs | Literature search |
| Mortality rate, HIC | Inpatient PN mortality rate in HICs | National Inpatient Sample |
| Hospitalizations | Proxied by care-seeking variable | UNICEF aggregation of DHS, MICS, NUCS, and other data sources |
| Age of death | Mean age of death from inpatient PN among children under 5 assumed to be 2.5 years | N/A |
For this indicator, we are not focused on treatment status but rather quality of treatment. That is, we assumed deaths attributable to PN among those who sought care are in excess of the high-income country (HIC) rate and thus preventable.
The percent of children under 5 with pneumonia symptoms taken to a health care facility was identified using data on care seeking for pneumonia symptoms from a UNICEF aggregation of survey data. We used care seeking as a proxy for hospitalization. A total of 119 LMICs (87 percent) reported data on pneumonia care-seeking status. When multiple years of data were available for a country, we used the most recent year. We used the sample of countries for which data were available to extrapolate to the population of all LMICs. The population in our sample countries includes 74 percent of the population in LMICs. Prevalence of pneumonia was obtained from IHME’s 2014 GBD database by using lower-respiratory illness as a proxy.
We multiplied the care-seeking percentage by prevalence estimates to determine the number of care-seeking cases (862,324). We extrapolated this to the overall LMIC population, giving us 1,158,896 care-seeking cases.
A literature search was conducted for pneumonia mortality rates among child under 5 years in LMICs. After applying exclusion criteria, a total of 16 study-country observations were included. We assumed mean age of death to be 2.5 years old.
To account for uncertainty in our estimates, we used a Monte Carlo model to simulate variation in mortality rates.
For mortality, we used the study population weighted average mortality rate (6.01 percent) and standard deviation (2.01) to come up with beta distribution parameters (8.302, 129.910) using the -betaprior- user-written program for Stata. We then ran 2,000 draws with 1,500 observations each with randomly generated mortality rates that follow this parameterization. For each draw we calculated a mean mortality rate. The range of mean mortality rates defines the range of Monte Carlo–based YLL estimates we report. Thus, we end up with 6,000 values of YLL.
Our final calculation uses the following formula:
YLL = prevalenceLMIC * %care seekingLMIC * mortality rateLMIC * (83.5 – 2.5)
Assuming that YLL in HICs is the expected burden conditional on provision of high-quality medical care, we calculate YLL from PN under 5 years old in HICs to estimate the excess burden in LMICs. We do so by first obtaining PN mortality rates (for the under 5) and PN hospitalizations from the National Inpatient Sample, 2014. The final calculation is performed as above for low-income countries.
Excess Deaths = (mortalityLMIC – mortalityHIC) * care seeking prevalenceLMIC
Excess YLL – (mortalityLMIC – mortalityHIC) * care seeking prevalenceLMIC * (83.5 – 2.5)
Diarrhea Mortality (under 5 years old)
Assumptions
- Average age of death for children less than 5 is 2.5 years old.
- All deaths from diarrhea among the care-seeking population are preventable.
Variable Definitions
| Variable | Definition | Source |
|---|---|---|
| Care seeking | Child was taken to a medical facility for treatment of the diarrhea; this usually includes being taken to all public-sector facilities and all medical private sector facilities except for pharmacy | UNICEF |
| Untreated | Not prescribed oral rehydration salts (ORSs), oral rehydration therapy (ORT), zinc, or ORS + zinc among those care seeking | DHS |
| Age of death | Mean age of death from diarrhea among children under 5 assumed to be 2.5 years | N/A |
The percent of children under 5 with diarrhea taken to a health care facility was identified using data on care seeking for diarrhea from a UNICEF aggregation of survey data. A total of 103 LMICs (74 percent) reported data on diarrhea care-seeking status. When multiple years of data were available for a country, we used the most recent year. We used the sample of countries for which data were available to extrapolate to the population of all LMICs. The population in our sample countries includes 64 percent of the population in LMICs. Because the countries in our sample were higher-mortality countries than the full LMIC sample, we adjusted our estimate as follows: We first extrapolated total diarrhea-related deaths within our sample. We then calculated a ratio of our estimated total quality-related deaths to total deaths from diarrhea, and multiplied this ratio by total deaths attributable to diarrhea in the IHME sample of LMICs.
Prevalence of diarrhea and deaths from diarrhea was obtained from IHME’s 2014 GBD database. For each country in our sample, we then multiplied the care-seeking percentage by the number of deaths and the percentage untreated to determine the number of care-seeking untreated deaths (79,862). We extrapolated this to the overall LMIC population with the adjustment noted above, giving us 88,402 care-seeking untreated deaths.
We assumed that all deaths among the care-seeking population are preventable, implying that treatment prevents death. That in turn implies that all deaths from diarrhea are among the untreated. We assumed mean age of death to be 2.5 years old. Our final calculation uses the following formulas:
Untreated Deaths = deaths * %care seeking – %untreated
YLL = untreated deaths * (83.5 – age of death)
NONCOMMUNICABLE DISEASES
Lung Cancer Mortality
Assumption
- Excess mortality attributable to quality of care is a function of LMIC status after controlling for prevalence, pollution, and smoking rates.
Variable Definitions
| Variable | Definition | Source |
|---|---|---|
| Fine particulate matter (PM 2.5) air pollution | Mean annual exposure to fine particulate matter pollution | World Bank |
| Male smoking rate | Prevalence of smoking any tobacco product among males aged ≥15 years | WHO |
| Lung cancer deaths per 100,000 | Number of lung cancer deaths per 100,000 population | WHO GLOBOCAN |
| Lung cancer incidence per 100,000 | Incidence of lung cancer per 100,000 population | WHO GLOBOCAN |
| Lung cancer prevalence per 100,000 | Prevalence of lung cancer per 100,000 population | IHME |
Our measure of excess mortality for lung cancer uses high-income countries as a benchmark. In particular, our approach examines the extent to which lung cancer deaths are greater in LMICs controlling for air pollution, smoking rates, incidence of lung cancer, and geographic region. Our analytic dataset accounts for 91 percent of the LMIC population. Our method relies on the following linear specification:
Lung Cancer Deaths per 100,000 = β0+ Πcontrols + γregion+ αincome + ɛ
Where controls is a vector that includes air pollution, smoking rates, and lung cancer incidence; region is an indicator for geographic region;
income is a dummy variable taking on 0 for high income and 1 for low and middle income, and ɛ is a stochastic error term. This specification is weighted for prevalence of lung cancer (per 100,000).
To obtain the excess deaths in LMICs, we take the coefficient α, divide it by 100,000 and multiply by population in each country. This gives us the estimated number of deaths attributable to low- and middle-income status, controlling for the variables noted above. This approach extrapolates to the full sample of LMICs.
Acute Myocardial Infarction (AMI) Inpatient Mortality
Assumptions
- Sampling distribution of mortality rates follows a beta distribution.
- Sampling distribution of age follows a normal distribution.
Variable Definitions
| Variable | Definition | Source |
|---|---|---|
| Mortality rate, LMIC | Inpatient AMI mortality in LMICs | Literature search |
| Mortality rate, HIC | Inpatient AMI mortality in HICs | OECD Stat, National Inpatient Sample |
| Hospitalizations | Hospitalization rates per 100,000 people for AMI in LMICs | OECD Stat, literature search |
| Age of death | Mean age of death from inpatient AMI | Literature search |
A literature search was conducted for mortality rates and average age of death in LMICs. After applying exclusion criteria, a total of 28 study-country observations, which contained both mortality rates and either average or median ages, were included. Only two studies included an average age of death. To approximate an age of death for other studies, we calculated a weighted average ratio of average age of death to average/median age and used this ratio to extrapolate an age of death for the remaining studies.
To account for uncertainty in our estimates, we used a Monte Carlo model to simulate variation in mortality rates and ages of death.
For mortality, we used the study population weighted average mortality rate (8.493812 percent) and standard deviation (3.369868) to come up with beta distribution parameters (5.728, 61.714) using the -betaprior-
user-written program for Stata. Similarly, for age, we used the study population weighted average age of death (61.31981) and the standard deviation (2.812404). Instead of a beta distribution, we used a normal distribution to calculate a range of uncertainty for age. We then ran 2,000 draws with 1,500 observations each with randomly generated mortality rates and ages of death that follow these parameterizations. For each draw we calculated a mean mortality rate and a mean age of death. The range of mean mortality rates and ages of death defines the range of Monte Carlo–based YLL estimates we report.
The remaining variable required is the number of AMI hospitalizations in LMICs. We obtained four estimates, from databases and literature, to generate a range and a country population weighted average hospitalization rate. We extrapolated this rate to the LMICs population (6,093,361,757) to calculate a minimum, average, and maximum number of hospitalizations.
Our final calculation uses the following formula for each value of hospitalizations:
YLL = mortalityLMIC * hospitalizationsLMIC * (83.5 – age of deathLMIC)
Thus, we end up with 6,000 values of YLL (2,000 for each estimate of hospitalizations). We report the minimum, average, and maximum for each estimate of hospitalizations.
Assuming that YLL in HICs is the expected burden conditional on provision of high-quality medical care, we use the difference in mortality rates between HICs and LMICs to calculate excess burden. We do so by first obtaining AMI mortality rates (for the 45+ population) from the Organisation for Economic Co-operation and Development (OECD) Stat (data for the United States was obtained from the National Inpatient Sample). We then use the difference in OECD and LMIC mortality rates to calculate excess deaths and YLL. The final calculation is as follows:
Excess Deaths = (mortalityLMIC – mortalityHIC) * hospitalizationsHIC
Excess YLL = (mortalityLMIC – mortalityHIC) * hospitalizationsHIC * (83.5 – age of deathLMIC)
Congestive Heart Failure (CHF) Inpatient Mortality
Assumptions
- Sampling distribution of mortality rates follows a beta distribution.
- Sampling distribution of age follows a normal distribution.
Variable Definitions
| Variable | Definition | Source |
|---|---|---|
| Mortality rate, LMIC | Inpatient congestive heart failure mortality in LMICs | Literature search |
| Mortality rate, HIC | Inpatient congestive heart failure mortality in HICs | National Inpatient Sample, literature search |
| Hospitalizations | Hospitalization rates per 100,000 people for congestive heart failure in LMICs | OECD Stat, literature search |
| Age of death | Mean age of death from inpatient congestive heart failure | Literature search |
A literature search was conducted for mortality rates and average age of death in LMICs. After applying exclusion criteria, a total of 42 study countries that included both mortality rates and either average or median ages were included. Only eight studies included an average age of death. To approximate an age of death for other studies, we calculated a weighted average ratio of average age of death to average/median age and used this ratio to extrapolate an age of death for the remaining studies.
To account for uncertainty in our estimates, we used a Monte Carlo model to simulate variation in mortality rates and ages of death.
For mortality, we used the study population weighted average mortality rate (14.353804 percent) and standard deviation (3.14044) to come up with beta distribution parameters (18.170, 106.813) using the -betaprior-user-written program for Stata. We then ran 2,000 draws with 1,500 observations each with randomly generated mortality rates that follow this parameterization. For each draw we calculated a mean mortality rate. The range of mean mortality rates defines the range of Monte Carlo–based YLL estimates we report.
Similarly, for age, we used the study-population-weighted average age of death (68.63382) and the standard deviation (2.579883). Instead of a beta distribution, we used a normal distribution to calculate a range of uncertainty for age.
The final analytic dataset was created by combining values with equal rank (from 1 to 2,000) for each variable (e.g., the smallest value of age was combined with the smallest value of mortality).
The remaining variable required is the number of CHF hospitalizations in LMICs. We obtained three estimates, from databases and literature, to generate a range and a country population weighted average hospitalization
rate. We extrapolated this rate to the LMICs’ population (6,093,361,757) to calculate a minimum, average, and maximum number of hospitalizations.
Our final calculation uses the following formula for each value of hospitalizations:
YLL = mortalityLMIC * hospitalizationsLMIC * (83.5 – age of deathLMIC)
Thus, we end up with 6,000 values of YLL (2,000 for each estimate of hospitalizations). We report the minimum, average, and maximum for each estimate of hospitalizations.
Assuming that YLL in HICs is the expected burden conditional on provision of high-quality medical care, we use the difference in mortality rates between HICs and LMICs to calculate the excess burden. We do so by first obtaining CHF mortality rates from the U.S. National Inpatient Sample and other HICs and from the literature. We then use the difference in HIC and LMIC mortality rates to calculate excess deaths and YLL. The final calculation is as follows:
Excess Deaths = (mortalityLMIC – mortalityHIC) * hospitalizationsLMIC
Excess YLL = (mortalityLMIC – mortalityHIC) * hospitalizationsLMIC * (83.5 – age of deathLMIC)
Ischemic and Hemorrhagic Stroke Inpatient Mortality
Assumptions
- Sampling distribution of mortality rates follows a beta distribution.
- Sampling distribution of age follows a normal distribution.
Variable Definitions
| Variable | Definition | Source |
|---|---|---|
| Mortality rate, LMIC | Inpatient stroke mortality rate in LMICs | Literature search |
| Mortality rate, HIC | Inpatient stroke mortality rate in HICs | OECD Stat, National Inpatient Sample |
| Hospitalizations | Hospitalization rates per 100,000 people for stroke in LMICs | Literature search |
| Variable | Definition | Source |
|---|---|---|
| Ischemic stroke share of observations | Share of ischemic stroke observations | Literature search |
| Age of death | Mean age of death from inpatient stroke | Literature search |
A literature search was conducted for mortality rates and average age of death in LMICs. After applying exclusion criteria, a total of 48 study-country observations, which included both mortality rates and population ages for ischemic stroke (IS) and/or hemorrhagic stroke (HS), were included. Below, we discuss methods for IS and HS separately. Age of death was obtained from eight study-country observations, and the same age of death was used for both IS and HS. To approximate an age of death for other studies, we created a ratio of the age of death to the age of the overall study population. We multiplied a study population weighted ratio by the overall population age in each study.
Ischemic Stroke
Fifty-eight study-country observations had mortality and age data for IS. To account for uncertainty in our estimates, we used a Monte Carlo model to simulate variation in mortality rates and ages of death. For mortality, we used the study population weighted mortality rate (10.72 percent) and standard deviation (6.66) to calculated beta distribution parameters (2.207, 18.374) using the -betaprior- user-written program for Stata. For age, we similarly used the study population weighted average of death (68.92) and standard deviation (3.90). Instead of a beta distribution, we used a normal distribution to calculate a range of uncertainty for age. We then ran 2,000 draws with 1,500 observations each, pulling randomly generated mortality rates and ages of death simultaneously. For each draw we calculated a mean mortality rate and a mean age of death.
The remaining variable required is the number of IS hospitalizations in LMICs. We obtained 12 estimates, from databases and literature, to generate a range and a country population weighted average hospitalization rate (103.32 per 100,000). Seven studies of hospitalization included the share of IS hospitalizations. We used the range of identified hospitalization rates (extrapolated this rate to the LMICs population [6,093,361,757]), multiplied by the country population weighted share of IS hospitalizations (84.6 percent) to calculate a minimum, average, and maximum number of hospitalizations.
Our final calculation uses the following formula for each value of hospitalizations:
YLL = mortalityLMIC * hospitalizationsLMIC * (83.5 – age of deathLMIC)
Thus, we end up with 6,000 values of YLL (2,000 for each estimate of hospitalizations). We report the minimum, average, and maximum for each estimate of hospitalizations.
To calculate excess burden, we took the following approach. Assuming that YLL in high-income countries is the expected burden conditional on provision of high-quality medical care, we calculate YLL from IS in HICs to estimate the excess burden in LMICs. We do so by first obtaining stroke mortality rates for IS (for the 45+ population) from OECD Stat (data for the United States was obtained from the National Inpatient Sample). Excess YLL for IS is thus calculated as follows:
Excess Deaths = (mortalityLMIC – mortalityHIC) * hospitalizationsLMIC
Excess YLL = (mortalityLMIC – mortalityHIC) * hospitalizationsLMIC * (83.5 – age of deathLMIC)
Hemorrhagic Stroke
Thirty-eight studies had data on HS. We used the same study-reported age of death for IS and HS because the vast majority of studies did not report them independently.
To account for uncertainty in our estimates, we used a Monte Carlo model to simulate variation in mortality rates and ages of death. For mortality, we used the study population weighted mortality rate (23.63 percent) and standard deviation (14.37) to calculate beta distribution parameters (2.207, 18.374) using the -betaprior- user-written program for Stata. For age, we similarly used the study population weighted average of death (64.37) and standard deviation (4.94). Instead of a beta distribution, we used a normal distribution to calculate a range of uncertainty for age. We then ran 2,000 draws with 1,500 observations each, pulling randomly generated mortality rates and ages of death simultaneously. For each draw we calculated a mean mortality rate and a mean age of death.
The remaining variable required is the number of HS hospitalizations in LMICs. Using the same estimated hospitalization rates for all stroke as above, we assumed that the remaining hospitalizations were all HS (15.4 percent of all stroke hospitalizations).
Our final calculation uses the following formula for each value of hospitalizations:
YLL = mortalityLMIC * hospitalizationsLMIC * (83.5 – age of deathLMIC)
Thus, we end up with 6,000 values of YLL (2,000 for each estimate of hospitalizations). We report the minimum, average, and maximum for each estimate of hospitalizations.
As for IS, we used data from OECD and NIS (for the United States) to obtain HS mortality rates. The calculation for excess YLL thus becomes:
Excess Deaths = (mortalityLMIC – mortalityHIC) * hospitalizationsLMIC
Excess YLL = (mortalityLMIC – mortalityHIC) * hospitalizationsLMIC * (83.5 – age of deathLMIC)
Chronic Obstructive Pulmonary Disease (COPD) Inpatient Mortality
Assumptions
- Sampling distribution of mortality rates follows a beta distribution.
- Sampling distribution of age follows a normal distribution.
Variable Definitions
| Variable | Definition | Source |
|---|---|---|
| Mortality rate, LMIC | Inpatient COPD mortality in LMICs | Literature search |
| Mortality rate, HIC | Inpatient COPD mortality in HICs | National Inpatient Sample, literature search |
| Hospitalizations | Hospitalization rates per 100,000 people for COPD in LMICs | OECD Stat, literature search |
| Age of death | Mean age of death from inpatient COPD in LMICs | Literature search |
A literature search was conducted for mortality rates and average age of death in LMICs. After applying exclusion criteria, a total of 15 study-country observations, which contained both mortality rates and either average or median ages, were included. Only six studies included an average age of death. To approximate an age of death for other studies, we calculated a weighted average ratio of average age of death to average/median age and used this ratio to extrapolate an age of death for the remaining studies.
To account for uncertainty in our estimates, we used a Monte Carlo model to simulate variation in mortality rates and ages of death.
For mortality, we used the study population weighted average mortal-
ity rate (10.97603 percent) and standard deviation (5.73249) to come up with beta distribution parameters (3.154, 25.581) using the -betaprior-user-written program for Stata. We then ran 2,000 draws with 1,500 observations each with randomly generated mortality rates that follow this parameterization. For each draw we calculated a mean mortality rate. The range of mean mortality rates defines the range of Monte Carlo–based YLL estimates we report.
Similarly, for age, we used the study population weighted average age of death (75.18683) and the standard deviation (6.120001). Instead of a beta distribution, we used a normal distribution to calculate a range of uncertainty for age.
The final analytic dataset was created by combining values with equal rank (from 1 to 2,000) for each variable (e.g., the smallest value of age was combined with the smallest value of mortality).
The remaining variable required is the number of COPD hospitalizations in LMICs. We obtained five estimates, from databases and literature, to generate a range and a country population weighted average hospitalization rate. We extrapolated this rate to the LMICs population (6,093,361,757) to calculate a minimum, average, and maximum number of hospitalizations.
Our final calculation uses the following formula for each value of hospitalizations:
YLL = mortalityLMIC * hospitalizationsLMIC * (83.5 – age of deathLMIC)
Thus, we end up with 6,000 values of YLL (2,000 for each estimate of hospitalizations). We report the minimum, average, and maximum for each estimate of hospitalizations.
Assuming that YLL in HICs is the expected burden conditional on provision of high-quality medical care, we use the difference in mortality rates between HICs and LMICs to calculate the excess burden. We do so by first obtaining COPD mortality rates from the U.S. National Inpatient Sample and other HICs and from the literature. We then use the difference in OECD and LMIC mortality rates to calculate excess deaths and YLL. The final calculation is as follows:
Excess Deaths = (mortalityLMIC – mortalityHIC) * hospitalizationsLMIC
Excess YLL = (mortalityLMIC – mortalityHIC) * hospitalizationsLMIC * (83.5 – age of deathLMIC)
Diabetes Morbidity
Assumption
- Averaging disability weights adequately captures the distribution of disability.
Variable Definitions
| Variable | Definition | Source |
|---|---|---|
| Prevalence of diabetes | The number of adults 18+ years old with diagnosed diabetes mellitus | International Diabetes Federation |
| Untreated | The percent of diagnosed persons with diabetes who are on not on any medication (oral or insulin) | WHO STEPS |
| Average disability weights | Disability attributable to diabetes | GBD, 2016 |
The number of adults 18+ years old with diagnosed diabetes mellitus was identified using data from the International Diabetes Federation, 2017. A total of 136 LMICS (98 percent) had data on diabetes diagnoses. The population in our sample countries includes 99 percent of the population in LMICs. The percent of diagnosed persons with diabetes who are on not on any medication (oral or insulin) was identified using WHO STEPS published reports. We included LMICs that had reports in English, French, or Spanish. When multiple years of data were available for a country, we used the most recent year. A total of 55 LMICS (40 percent) had data on treatment status, accounting for 44 percent of the LMIC population. We used the sample of countries for which data were available to extrapolate to the population of all LMICs for both diagnosis and treatment status.
We developed a disability weight by taking the average of all disability weights for diabetes listed in GBD (2016). Disability weights included neuropathy, varying severity of retinopathy, and varying severity of nephropathy.
Our final calculation uses the following formula:
YLD = prevalence diabetes * %untreated * average disability weights
Excess Trauma-Related Mortality
Assumption
- Difference in mortality rates between LMICs and HICs is attributable to quality of care.
Variable Definitions
| Variable | Definition | Source |
|---|---|---|
| Deaths attributable to injury | Number of deaths attributable to injuries | IHME |
| Prevalence of injuries | Prevalence of injuries | IHME |
| Years of life lost attributable to injuries | IHME | |
| Remaining life expectancy | Remaining life expectancy among those dying from trauma; calculated as YLL divided by number of deaths | IHME/calculated |
| Mortality rate | Deaths attributable to injuries divided by prevalence of injuries | Calculated |
To calculate excess deaths attributable to injuries, we obtained data on deaths, incidence, and prevalence of injuries, excluding those attributable to adverse effects of medical care, war, natural disasters, and terrorism. We calculated a mortality rate for LMICs as well as high-income countries by dividing the number of deaths by prevalence. We use the difference between these two mortality rates multiplied by total LMIC prevalence to obtain an estimate of excess deaths. To calculate excess YLL, we obtained remaining life expectancy by dividing the YLL from IHME by the number of deaths from IHME. We then used this remaining life expectancy multiplied by excess deaths to obtain excess YLL.
Mental Health (adult)
Variable Definitions
| Variable | Definition | Source |
|---|---|---|
| 12-month prevalence | For 12-month prevalence we use both: Low estimate (IHME): Prevalence (annual) for all adults, defined as 19 years or older by condition as reported in the IHME database High estimate (WMHS): 12-month prevalence reported for DSM-IV/CIDI disorders in the 2009 publication of data in the WMH surveys; an (unweighted) average of the LMIC 12-month prevalences reported by the WMH Survey as published by Kessler et al. (2005) (Brazil, Bulgaria, Colombia, India, Lebanon, Mexico, Romania, and Shenzhen, China) The rate for schizophrenia (0.33 percent) was taken from a literature review and is a global estimate, not limited to LMICs, owing to limited data |
IHME, WMHS, published data and literature |
| Care seeking | Care seeking is currently taken from the WHO (2004) publication The Treatment Gap in Mental Health Care, where service use was defined as seeking assistance from any medical or professional service provider, specialized or not, public or private | Literature search |
| Variable | Definition | Source |
|---|---|---|
| Percentage not in treatment | Percentage not in treatment is 1 - “proportion in treatment” (of those with a mental health disorder) as a composite measure for all DSM-IV categories from 2004 publication of data in the World Mental Health (WMH) surveys Request for data disaggregated by condition pending |
WMHS, published data |
Our goal is to quantify the YLD attributable to poor quality mental health care of common and serious mental health conditions. To do so, we use the following equation:
YLD = prevalence * care seeking * share of severity * %untreated * average disability weights
Using data from the World Mental Health Survey (WMHS), the estimated range of the share of adults 18+ years in LMICs with major depressive disorders is 1.89–12 percent; 2.66–9 percent with anxiety; 0.45–0.46 percent with bipolar disorder; and 1.27–4.1 percent with alcohol disorder. The 12-month prevalence is an average of the LMIC 12-month prevalences reported by the WMH Survey as published by Kessler et al. (2005) (Brazil, Bulgaria, Colombia, India, Lebanon, Mexico, Romania, and Shenzhen, China). The range for schizophrenia (0.27–0.33 percent) was taken from Ferrari and colleagues’ (2012) literature review and is a global estimate, not limited to LMICs. We use the midpoints of each of these ranges for our calculations.
Distribution of severity is taken from individual studies published using WMHS data. We use population-weighted averages of Lebanon and South Africa where data were available to calculate the distribution of severity for anxiety, depression, and alcohol use disorder. Where this was not possible, as for bipolar disorder, we use data from the United States. For schizophrenia, we use data from a review that included estimates on the distribution of severity from five countries, as noted in Table D-2.
We use the indicator “those retained in treatment” from the WMHS, and take the midpoint of the ranges provided.
We calculate disability weights (DWs) by taking a weighted average of
the DWs provided for each of the relevant mental health subconditions, as published by Solomon and colleagues (2015). We calculate DWs for each severity category individually. We exclude moderate severity for anxiety, depression, and alcohol use disorder because of variance in the recommended standard of care.
All estimates are applied to the adult LMIC population.
TABLE D-1 Rates for Mental Health YLD Calculations
| Prevalence (for LMIC population) | Distribution of Severity (for 12-month prevalence) | Care Seeking (of those with condition) | Percentage Not in Treatment (of those diagnosed, by severity) | Disability Weights | ||
|---|---|---|---|---|---|---|
| Common mental health | Major depressive disorder | 1.89–12.0% | Moderate: 48.7% | 46.1% | 90.3–81.4% | Moderate: .396 |
| Severe: 28.4% | 85.4–76.3% | Severe: .658 | ||||
| Anxiety | 2.66–9.0% | Moderate: 34.6% | 42.5% | 90.3–81.4% | Moderate: .133 | |
| Severe: 29.5% | 85.4–76.3% | Severe: .523 | ||||
| Serious mental health | Bipolar disorder | 0.45–0.46% | Moderate: 17.1% | 49.8% | 90.3–81.4% | Residual: .032 |
| Severe: 82.9% | 85.4–76.3% | Manic: .492 | ||||
| Schizophrenia (and nonaffective psychoses) | 0.27–0.33% | Residual: 63% | 68.9% | 90.3–81.4% | Residual: .588 | |
| Acute: 37% | 85.4–76.3% | Acute: .778 | ||||
| Addictive disorders | Alcohol use disorder | 1.27–4.1% | Moderate: 10.9% | 21.9% | 90.3–81.4% | Moderate: .373 |
| Severe: 27.5% | 85.4–76.3% | Severe: .570 |
NOTE: See “variable definitions” table above for sources.
TABLE D-2 Distribution of Severity as a Percent of Total National Prevalence
| United States | Lebanon | South Africa | Japan | Metropolitan China | |
|---|---|---|---|---|---|
| Anxiety | Mild: 43.5 | Mild: 43.6 | Mild: 35.1 | Mild: 35.3 | Mild: 41.3 |
| Mod: 33.7 | Mod: 36.7 | Mod: 34.4 | Mod: 46.4 | Mod: 44.6 | |
| Sev: 22.8 | Sev: 19.7 | Sev: 30.5 | Sev: 18.3 | Sev: 14.1 | |
| Depression | Mild: 19.5 | Mild: 8.2 | Mild: 20.3 | Mild: 26.6 | Mild: 32.4 |
| Mod: 50.1 | Mod: 49.3 | Mod: 45.4 | Mod: 53.4 | Mod: 51.1 | |
| Sev: 30.4 | Sev: 42.5 | Sev: 34.3 | Sev: 20.0 | Sev: 16.5 | |
| Bipolar disorder | Mild: 0.00 | Mild: 0.00 | Mild: no data | Mild: 57.4 | Mild: 0.00 |
| Mod: 17.1 | Mod: 0.00 | Mod: no data | Mod: 30.9 | Mod: 0.00 | |
| Sev: 82.9 | Sev: 100 | Sev: no data | Sev: 11.7 | Sev: 100 | |
| Alcohol use disorder | Mild: 31.5 | Mild: 63.3 | Mild: 61.5 | Mild: 63.5 | Mild: 59.9 |
| Mod: 39.7 | Mod: 4.2 | Mod: 11.6 | Mod: 8.0 | Mod: 18.1 | |
| Sev: 28.9 | Sev: 32.6 | Sev: 26.9 | Sev: 28.5 | Sev: 22 | |
| Source | Kessler et al., 2005 | Karam et al., 2006 | Herman et al., 2009 | Ishikawa et al., 2016 | Shen et al., 2006 |
SOURCE: Kessler et al., 2005.
TABLE D-3 Distribution of Severity for Schizophrenia as a Percent of Total National Prevalence
| United States | Tanzania | China | Russia | Germany | Pooled | |
|---|---|---|---|---|---|---|
| Schizophrenia | Residual: 38 | Residual: 40 | Residual: 49 | Residual: 50 | Residual: 25 | Residual: 37 |
| Acute: 62 | Acute: 60 | Acute: 51 | Acute: 50 | Acute: 75 | Acute: 63 | |
| Residual: 31 | ||||||
| Acute: 69 |
NOTE: Source for schizophrenia is not limited to LMICs, but uses a pooled estimate from Ferrari et al., 2012.
MATERNAL AND CHILD HEALTH
Excess Maternal Mortality Among Attended Births
Assumption
- High-income maternal mortality rates are the same among attended and unattended births.
Variable Definitions
| Variable | Definition | Source |
|---|---|---|
| Maternal mortality ratio (MMR) | Maternal deaths per live birth | WHO Bayesian Maternal Mortality Estimation model |
| Maternal deaths | Maternal deaths | Calculated |
| Live births | Number of live births | UN World Population Prospects (WPP) |
| Share of attended births (SAB) | Share of births that are attended by a skilled professional | WHO Global Health Observatory (GHO) |
Our approach to estimating excess maternal mortality among attended births relies primarily on data from WHO’s recent modeling efforts. WHO uses a multilevel model with region and country random effects to estimate a maternal mortality ratio as a function of the share of attended skilled births, gross domestic product (GDP) per capita, and the general fertility rate. These estimates are then entered into a Markov chain Monte Carlo model to generate uncertainty intervals.
We use the range of output from this model (at the 10th, 50th, and 90th percentiles), maternal mortality rates per live birth, as the outcome in our approach. We sought to measure the excess mortality in LMICs of attended births. A key assumption is that the maternal mortality rate among unattended births in high-income countries is the same as it is for attended births.
After using the Markov chain model to generate maternal mortality rates, we multiply these estimates to the total number of live births by country to generate an estimate of total maternal deaths:
Maternal Deaths = MMR * Live Births
We also multiply the share of attended births by the number of live births to generate a total number of attended births.
Attended Births = SAB * Live Births
We then run a bivariate linear regression model with the following specification, restricted to LMICs:
MMR = β0+ β1SAB + ɛ
The results of this model are then used to generate predicted values of MMR (referred to as MMR) assuming that SAB is set to 100 percent for all countries. This SAB-adjusted MMR represents our estimate of MMR if all births were attended. This removes the effect of SAB on MMR, with the remaining differences between countries attributable to other quality-related factors. We then take the difference between the mean SAB-adjusted MMR for LMICs and the standard MMR for HICs, and multiply by the number of attended births to generate the excess maternal mortality caused by non-SAB-related quality differences. The final calculation takes the following form:
Excess Maternal Deaths = attended births * (MMR – MMRHIC)
Excess Neonatal Mortality Among Attended Births
Assumption
- The difference in mortality rates between HICs and LMICs after controlling for relevant factors and attended births is attributable to quality of care.
Variable Definitions
| Variable | Definition | Source |
|---|---|---|
| Share of attended births | Share of live births attended by a health care professional | WHO GHO |
| Neonatal mortality rate | Neonatal mortality rate per 1,000 live births | World Bank Development Indicators (modeled) |
| Live births | Total number of live births | UN WPP |
We first calculated the total number of attended births by multiplying the share of attended births by the number of live births. Then, we ran a linear regression with the following specification weighted for country-level
population, restricted to the LMICs, where SAB is the share of attended births:
Neonatal Mortality Rate = β0+ β1SAB + ɛ
We then generated a prediction for low- and middle-income neonatal mortality rate conditional on SAB being 100 percent. This provides us with a neonatal mortality rate for attended births. We took the difference between this and the neonatal mortality rate among high-income countries and multiplied it by the number of estimated attended births in each LMIC to obtain an estimate of excess neonatal mortality.
VACCINATIONS
Vaccine-Preventable Mortality
Assumption
- All deaths that occur due to diseases that are vaccine preventable are preventable deaths.
Variable Definitions
| Variable | Definition | Source |
|---|---|---|
| Deaths | Number of deaths from vaccine-preventable disease | IHME |
| Age of death | Mean age of death from vaccine-preventable disease | IHME |
We developed a set of vaccine-preventable causes of death (those with vaccine efficacy of more than 90 percent): liver cancer attributable to hepatitis B, cirrhosis and other chronic liver diseases attributable to hepatitis B, other hepatitis B-related deaths, cervical cancer, diphtheria, H influenza type B meningitis, measles, whooping cough, and tetanus. We obtained deaths and YLL estimates from the IHME GBD 2014 database. We estimated an average age of death by dividing YLL by the number of deaths, and recalculated YLL using this age of death, top-coded at 83.5. Ninety-nine percent of LMICs were represented in the data, which means that extrapolation had little effect on our estimates.
The final calculation was as follows:
YLL = deaths * (83.5 – age of death)
Rotavirus Mortality (under 5 years old)
Assumption
- All rotavirus deaths are preventable.
Variables Definitions
| Variable | Definition | Source |
|---|---|---|
| Deaths | Number of deaths from rotavirus | WHO |
| Age of death | Mean age of death from rotavirus among children under 5 assumed to be 2.5 years | N/A |
We obtained the number of rotavirus-attributable deaths for the under 5 population in 2013 (the last year of data available) from the WHO surveillance database. Data on 137 (99 percent) of LMIC countries were available. The countries included in our sample represented 99 percent of the LMIC population, which means that extrapolation had relatively little effect on our estimates. We assumed that all rotavirus deaths were preventable. We used 2.5 as the mean age of death.
Our final calculation uses the following formula:
YLL = deaths * (83.5 – age of death)
PATIENT CENTEREDNESS AND TIMELINESS
To address patient centeredness we look at both how it is currently measured and what the state of patient-centered care is, posing the following questions:
- Where is the data, and who does it represent?
- What is the quality of that data?
- What is the actual level of patient-centered care?
We first reviewed existing national and international databases with a focus on three areas of patient experience: overall rating (primary focus), communication, and respect (or disrespect). Where possible, we pulled this data to come up with point estimates for each country, using the most recent data available. We then conducted a systematic review of the literature on patient experience in all LMICs over the past 10 years.
To assess where data were collected and who the data represents, we created binary variables to categorize the studies pulled through the systematic review. For example, we looked at the following: was any care in the study provided by a private facility or provider, did the study assess care quality in a hospital setting, and were rural populations represented? We also organized studies by disease or patient population focus (e.g., HIV, TB, emergency care).
To determine the quality of the data in the literature on patient centeredness, we focused specifically on survey tools. Where available, we pulled the following information on methods regarding both survey administration and analysis: was the survey based on a previous tool, what research was done to inform the survey prior to administration, what was the sampling strategy, where were patients interviewed/how was the survey administered, were tests of internal consistency conducted (e.g., Cronbach α coefficient), and was content or construct validity assessed?
In quantifying the actual level of satisfaction, we pulled data on overall rating and other questions that were used to assess patients’ experience with care. We calculated a weighted “experience” average for each country based on the population represented in each study for a given country. If a factor analysis was conducted, we pulled the results from each of the subquestions to see which factors influenced overall experience in a given context and how those factors might differ by context.
Variable Definitions
| Variable | Definition | Source |
|---|---|---|
| Overall rating (primary) | “Overall experience,” or “overall rating” is a global rating of the patient’s (or in cases of pediatric care, a caregiver’s) assessment of their care interaction For high-income countries, this is taken from Commonwealth Fund, and is taken from the following question: “Opinion of regular doctor in past 12 months,” taking a composite negative score from the answers “fair” or “poor” |
LMICs: Literature; HICs: Commonwealth Fund (CWF) International Health Policy Survey |
| Variable | Definition | Source |
|---|---|---|
| Overall rating (primary) (continued) | The responses across all items were summed and converted into a percentage of the maximum possible score to yield an overall experience score, with a potential range of 0–100, where 100 represents the best possible experience. The scores obtained from positive expressions were added to the score in the reverse direction (1 − x) | |
| Communication | Examples: Patients reporting having received easy-to-understand explanations by their regular doctor (OECD); did not have a problem with the amount of explanation received during this visit (Service Provision Assessment [SPA]) | Surveys: International Development Bank (IDB), CWF, OECD, SPA (DHS) Literature |
| Respect | Examples: Patients reporting having been “treated with respect during consultation” or “respect was shown by my provider” | Literature |
| Timeliness | Data on ratings of wait time was collected throughout the literature review, a summary of which can be found in Table 4-9; additional data on time with physician was collected through existing survey tools Examples: Did not have a problem with the wait time at this visit (SPA); patients reporting having spent enough time with any doctor during the consultation (OECD) |
Surveys: IDB, CWF, OECD, SPA (DHS) Literature |
| Variable | Definition | Source |
|---|---|---|
| Other | Examples: Privacy, abuse, decision making, continuity of care, etc. | Literature |
ACCESSIBILITY: HIV/AIDS
To calculate the burden of access to HIV/AIDS, we relied on data from the HIV/AIDS calculations above. Issues attributable to access were measured by examining the portion of the population with HIV/AIDS who do not know their status and proceeding with calculations as above. Our final calculation was as follows:
YLD = (1 – %knownstatus) * prevalence * average disability weights
YLL = total deaths – untreated, undiagnosed deaths
COSTING
For the low and high estimates of the cost attributable to poor quality care, the average gross national income (GNI) per capita for all LMICs was taken from the World Bank. This average GNI ($4,667) was multiplied to each individual death, YLL, and YLD for each condition where the burden of poor care was calculated. The calculations used to estimate cost are as follows:
Cost of Excess Deaths = deaths * avg. GNI
Cost of Excess YLL = excess YLL * avg. GNI
Cost of Excess YLD = excess YLD * avg. GNI
Variance, or high and low estimates, of cost were informed by variation in incidence, mortality, and age of the underlying indicators. In addition, for certain indicators (such as TB), variation was informed by estimates from different sources of mortality (e.g., owing to comorbidity with HIV status).
PART 2: LITERATURE REVIEW METHODS
Contents
1 Literature Review Methods Summary
Venous Thromboembolisms (VTEs)
Ventilator-Associated Pneumonia (VAP)
Human Immunodeficiency Virus (HIV) (adherence focus)
Acute Myocardial Infarctions (AMIs)
Chronic Obstructive Pulmonary Disease (COPD)
LITERATURE REVIEW METHODS SUMMARY
As noted in the chapter text, two main sources of data were used to estimate the burden of poor quality for each domain: where available, data were obtained from national or international databases including, but not limited to, data from the Global Burden of Disease (GBD), the Demographic and Health Surveys (DHS), and the World Health Organization STEPS data.
Where there were no available data for indicators of interest, the team obtained estimates by carrying out systematic reviews of the peer-reviewed, published, English language literature primarily over the past decade (2006–2016). Detailed data sources for all variables used are outlined below, including details on literature review results and methods. The process was as follows:
- Indicator definition: Case definitions for indicators were primarily based on how each was defined in the literature, accounting for modest variations among these definitions based on availability of literature.
- Exclusion criteria: Cross-cutting inclusion and exclusion criteria were set for the studies. This included study type, study size, and relevant clinical populations for exclusion, among other considerations.
- Search terms: Targeted search terms were created for each indicator and, using automated machine learning, abstracts and descriptive information on each article were pulled through PubMed. For each indicator, a unique search was conducted for every country of interest (196).
- Search: The search was performed on PubMed to extract all relevant articles.
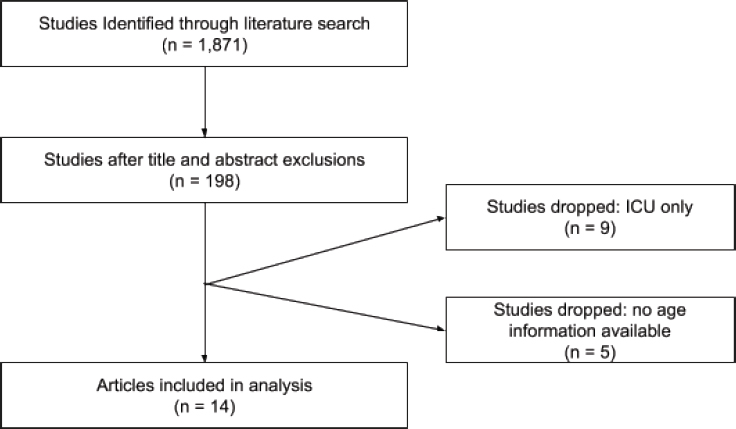
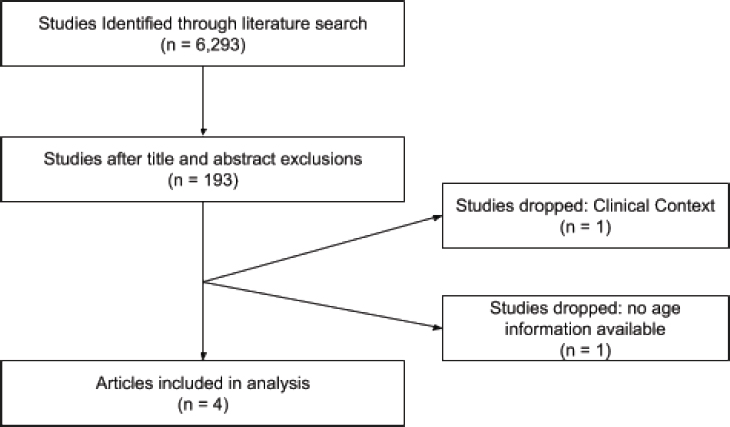
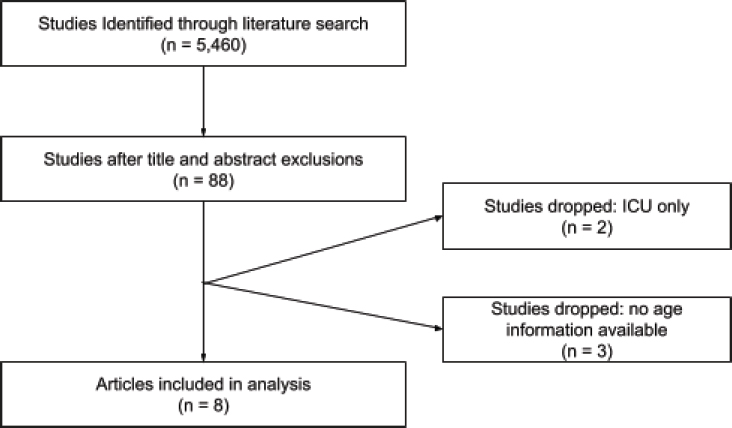
- Screening: Articles were then manually screened (titles and then abstracts) for relevance using the predetermined inclusion and exclusion criteria to assess fit. Results of this process, for each indicator, are shown in a PRISMA diagram.
- Abstraction: With the final set of articles, key data were abstracted including a point estimate of the indicator of interest, the population to which this number applied, and descriptive characteristics of the studies within which they were collected.
SAFETY
Summary Methods
We conducted reviews on key safety indicators as a continuation of the published work from Jha et al. (2013), The Global Burden of Unsafe Medical Care: Analytic Modeling of Observational Studies. We conducted new systematic reviews for five safety events: adverse drug events, thromboembolism from medical care, falls in hospital, pressure sores and decubitus ulcers, and ventilator-associated pneumonia; we used the earlier Jha and colleagues (2013) analysis for catheter-associated urinary tract infections. Additional information on our approach to safety can be found in Part 1 of this appendix.
Exclusion Criteria
| Content | Inclusion | Exclusion |
|---|---|---|
| Timing |
|
|
| Country |
|
|
| Database |
|
|
| Language |
|
|
| Condition |
|
|
| Study population |
|
|
| Clinical population of interest |
|
|
| Study type |
|
|
| Clinical setting |
|
|
| Mortality rate |
|
|
| Content | Inclusion | Exclusion |
|---|---|---|
| Age of death |
|
|
Pressure Ulcers
Indicator Definition
Decubitus ulcers, also called pressure ulcers, are defects in the skin that often occur when skin is pressed against a firm surface. These ulcers can result from combinations of external factors such as pressure, force, moisture, and friction, as well as internal factors such as fever, anemia, and malnutrition. Pressure ulcers can often occur in surgery patients during the procedure (Jha et al., 2013).
Exclusion Criteria
| Content | Inclusion | Exclusion |
|---|---|---|
| Indicator |
Numerator: Patients diagnosed with a decubitus (pressure) ulcer |
|
| Exceptions |
Search Terms
| Title/Abstract | MESH |
|---|---|
| Decubitus Ulcer* | Pressure Ulcer |
| Pressure Ulcer* | Pressure Ulcer |
| Pressure AND Ulcer | Pressure Ulcer |
| hospital* AND pressure ulcer | Pressure Ulcer |
| hospital* AND ulcer | Pressure Ulcer |
| Decubitus Ulcer* | Pressure Ulcer OR Ulcer |
| Pressure Ulcer* | Pressure Ulcer OR Ulcer |
| Decubitus Ulcer* | Iatrogenic Disease AND Pressure Ulcer |
| Pressure Ulcer* | Iatrogenic Disease AND Pressure Ulcer |
| Title/Abstract | MESH |
|---|---|
| Decubitus Ulcer* | Ulcer AND Iatrogenic Disease |
| Pressure Ulcer* | Ulcer AND Iatrogenic Disease |
| HAC AND Ulcer* | Ulcer AND Iatrogenic Disease |
| hospital acquired condition AND ulcer* | Ulcer AND Iatrogenic Disease |
| hospital AND acquired AND ulcer* | Ulcer AND Iatrogenic Disease |
| HAC AND ulcer* | Pressure Ulcer |
| hospital acquired condition AND ulcer* | pressure Ulcer |
| hospital AND acquired AND ulcer* | Pressure Ulcer |
PRISMA Diagram
Falls
Indicator Definition
Inpatient falls are defined when a patient unintentionally falls to the ground or floor while conscious and in the care facility (Jha et al., 2013).
Exclusion Criteria
| Content | Inclusion | Exclusion |
|---|---|---|
| Indicator |
Numerator: Patients who experience a fall in hospital (inpatient falls) |
|
| Exceptions |
Search Terms
| Title/Abstract | MESH |
|---|---|
| Accident* AND fall* | Accidental Falls |
| Fall* AND hospital* | Accidental Falls |
| Fall* AND in AND hospital* | Accidental Falls |
| accident* | Accidental Falls |
| Fall* | Accidents OR Accidental Falls |
PRISMA Diagram
Adverse Drug Events
Indicator Definition
Adverse drug events (ADEs) are unintended and undesired events that result from errors that relate to the administering, ordering, transcribing, or dispensing of medications. These errors can result in serious harm or death, with other costs related to extended stays and treatment (Jha et al., 2013).
Exclusion Criteria
| Content | Inclusion | Exclusion |
|---|---|---|
| Indicator |
Numerator: Inpatients experiencing an adverse drug event |
|
| Exceptions |
Search Terms
| Title/Abstract | MESH |
|---|---|
| Adverse Drug Event* | Drug-Related Side Effects and Adverse Reactions |
| Adverse AND drug* | Drug-Related Side Effects and Adverse Reactions |
| medic* AND error* | Drug-Related Side Effects and Adverse Reactions |
| Adverse AND event* AND drug* | Drug-Related Side Effects and Adverse Reactions |
| medic* AND react* AND adverse | Drug-Related Side Effects and Adverse Reactions |
| drug AND react* AND adverse | Drug-Related Side Effects and Adverse Reactions |
| ADE* | Drug-Related Side Effects and Adverse Reactions |
| Title/Abstract | MESH |
|---|---|
| drug AND error* | Drug-Related Side Effects and Adverse Reactions |
| prescri* AND error* | Drug-Related Side Effects and Adverse Reactions |
PRISMA Diagram
Venous Thromboembolisms (VTEs)
Indicator Definition
Venous thromboembolisms (VTEs) includes both deep vein thrombosis (DVT) and pulmonary embolisms (PEs). These incidents occur from combinations of hereditary and acquired risk factors, and presents with pain, tenderness, swelling, and erythema of the affected limb. VTEs can result in complications such as thromboembolic pulmonary hypertension and post-thrombotic syndrome (Jha et al., 2013).
Exclusion Criteria
| Content | Inclusion | Exclusion |
|---|---|---|
| Indicator |
Numerator: Patients contracting a VTE during their admission to a health care facility |
|
| Exceptions |
Search Terms
| Title/Abstract | MESH |
|---|---|
| Venous Thromboembolism | Venous thromboembolism |
| VTE | Venous thromboembolism |
| Hospital acquired AND venous thromboembolism | Venous thromboembolism |
| Hospital AND venous thromboembolism | Venous thromboembolism |
| Venous Thromboembolism | Venous thromboembolism AND Iatrogenic Disease |
| VTE | Venous thromboembolism AND Iatrogenic Disease |
| Hospital acquired AND venous thromboembolism | Venous thromboembolism AND Iatrogenic Disease |
| Hospital AND venous thromboembolism | Venous thromboembolism AND Iatrogenic Disease |
| VTE AND hospital | Venous thromboembolism |
| Venous Thromboembolism | Iatrogenic Disease |
| VTE | Iatrogenic Disease |
| Hospital acquired AND venous thromboembolism | Iatrogenic Disease |
| Hospital AND venous thromboembolism | Iatrogenic Disease |
PRISMA Diagram
Ventilator-Associated Pneumonia (VAP)
Indicator Definition
Ventilator-associated pneumonia (VAP) is an infection in the lungs that occurs in people who are on ventilators. Ventilators are machines that help critically ill patients breath by providing oxygen through a tube directly into the patient’s mouth, nose, or neck. Infections can occur as germs move through the tube and enter the patient’s lungs (CDC, 2012).
Exclusion Criteria
| Content | Inclusion | Exclusion |
|---|---|---|
| Indicator |
Numerator: Ventilated patients in the ICU diagnosed with ventilator-associated pneumonia |
|
| Exceptions |
Search Terms
| Title/Abstract | MESH |
|---|---|
| Nosocomial pneumonia | Pneumococcal Infections |
| Nosocomial PN | Pneumococcal Infections |
| Nosocomial pneumonia | Iatrogenic Disease |
| Nosocomial PN | Iatrogenic Disease |
| Nosocomial pneumonia | pneumonia AND Iatrogenic Disease |
| Nosocomial PN | pneumonia AND Iatrogenic Disease |
| Hospital acquired AND pneumonia | pneumonia AND Iatrogenic Disease |
| Hospital acquired AND nosocomial pneumonia | pneumonia AND Iatrogenic Disease |
| Hospital acquired AND nosocomial pneumonia | Pneumococcal Infections |
| Hospital acquired AND nosocomial pneumonia | pneumonia |
| Hospital acquired pneumonia | pneumonia |
| Hospital acquired AND pneumonia | pneumonia |
| Hospital acquired AND PN | pneumonia |
| Hospital Acquired AND PN | pneumonia AND Iatrogenic Disease |
| in hospital AND pneumonia | pneumonia |
| hospital AND pneumonia | Pneumonia |
| in-hospital AND pneumonia | Pneumonia |
| Ventilator associated pneumonia | Pneumonia, Ventilator-Associated |
| ventilator-associated pneumonia | Pneumonia, Ventilator-Associated |
| ventilator-associated AND pneumonia | iatrogenic Disease |
| ventilator associated AND pneumonia | iatrogenic Disease |
| Ventilator associated pneumonia | pneumonia AND iatrogenic Disease |
| ventilator-associated pneumonia | pneumonia AND iatrogenic Disease |
| ventilator-associated AND pneumonia | Pneumonia, Ventilator-Associated |
| ventilator associated AND pneumonia | Pneumonia, Ventilator-Associated |
| Hospital acquired AND ventilator-associated | pneumonia AND iatrogenic Disease |
| Hospital acquired AND Ventilator associated pneumonia | pneumonia AND iatrogenic Disease |
| Hospital acquired AND ventilator-associated pneumonia | Pneumococcal Infections |
| Title/Abstract | MESH |
|---|---|
| Hospital acquired AND Ventilator associated pneumonia | Pneumonia |
| Hospital-acquired AND ventilator-associated | pneumonia AND iatrogenic Disease |
| Hospital-acquired AND Ventilator associated pneumonia | pneumonia AND iatrogenic Disease |
| Hospital-acquired AND ventilator-associated pneumonia | Pneumococcal Infections |
| Hospital acquired AND Ventilator associated pneumonia | Pneumonia |
| in-hospital AND pneumonia | Pneumonia, Ventilator-Associated |
| hospital AND pneumonia | Pneumonia, Ventilator-Associated |
| in-hospital AND pneumonia | Pneumonia, Ventilator-Associated |
| VAP | Pneumonia, Ventilator-Associated |
PRISMA Diagram
COMMUNICABLE DISEASES
Overview
First we have selected a range of inpatient and outpatient conditions that represent a high burden of illness across the globe, and where quality of care can be captured by well-defined outcome or process measures. Next, in consultation with clinicians and global health researchers we have been refining a set of these metrics that can be used to assess the quality of health care globally. We focus on indicators that are able to examine the quality of services received by people who have access to care. While access is a performance domain that is critically important in its own right, we have focused this review on quality of care within the system, and thus do not examine issues of access to the health system or issues of distribution of services within the health system. We also focus the search in countries defined as low or middle income by the World Bank.
Exclusion Criteria
| Content | Inclusion | Exclusion |
|---|---|---|
| Timing |
|
|
| Country |
|
|
| Database |
|
|
| Language |
|
|
| Condition |
|
|
| Study population |
|
|
Human Immunodeficiency Virus (HIV) (adherence focus)
Indicator Definition
Treatment adherence is an important factor for patients with HIV to both control the virus as well as prevent drug resistance. Adherence is defined as sticking closely to the regimen as given by a health care provider. Poor adherence can be caused by a number of external factors and be greatly affected by environmental factors, patient–physician relationships, and treatment complexity (NIH, 2018).
Exclusion Criteria
| Content | Inclusion | Exclusion |
|---|---|---|
| Timing |
|
|
| Country |
|
|
| Database |
|
|
| Language |
|
|
| Condition |
|
|
| Study population |
|
|
| Indicator |
Numerator: HIV patients who adhere to treatment (as defined in the study) |
|
| Study population or population of interest |
|
|
| Content | Inclusion | Exclusion |
|---|---|---|
| Study type |
|
|
| Clinical setting |
|
|
Search Terms
| Title/Abstract | MESH | Full Text |
|---|---|---|
| Quality of Care | HIV | |
| Quality of Care AND HIV | ||
| Quality of Care AND human immunodeficiency virus | ||
| HIV | HIV AND Viral load | viral load |
| Human immunodeficiency virus | HIV AND Viral load | viral load |
| HIV AND Viral load | HIV | |
| HIV AND Viral load | HIV AND Viral load | |
| HIV | virologic failure | |
| HIV | late diagnos* | |
| HIV | stage 3 | |
| HIV | stage three | |
| HIV | ART* | |
| HIV AND antiretroviral agents | antiretroviral* | |
| HIV AND antiretroviral therapy, highly active | ART* and prescri* | |
| HIV AND antiretroviral therapy, highly active | antiretroviral* and prescri* | |
| HIV AND antiretroviral agents | ART* and prescri* |
| Title/Abstract | MESH | Full Text |
|---|---|---|
| HIV AND antiretroviral | antiretroviral* and prescri* | |
| agents | ||
| antiretroviral therapy, highly | ART* and prescri* | |
| active | ||
| HIV AND antiretroviral | ART* and prescri* | |
| agents | ||
| HIV AND antiretroviral | ||
| therapy, highly active | ||
| HIV | ART AND prescri* | |
| HIV | antiretroviral AND prescri* | |
| HIV | PCP Prophylaxis | |
| HIV | pneumonia, pneumocystis | pneumocystis pneumonia |
| HIV | pneumonia, pneumocystis | pneumocystis AND |
| pneumonia | ||
| HIV AND pneumonia, | pneumocystis AND | |
| pneumocystis | pneumonia | |
| HIV AND pneumonia, | pneumocystis pneumonia | |
| pneumocystis | ||
| HIV AND pneumonia, | pneumocystis pneumonia | |
| pneumocystis | AND prophylaxis | |
| HIV | pneumonia, pneumocystis | pneumocystis pneumonia |
| AND prophylaxis | ||
| HIV | prevention & control | antiretroviral* AND |
| prescri* | ||
| HIV | HIV AND prevention & | antiretroviral* AND |
| control | prescri* | |
| HIV | HIV AND prevention & | antiretroviral* |
| control | ||
| HIV | prevention & control | antiretroviral* |
| prevention & control AND | PCP Prophylaxis | |
| HIV | ||
| prevention & control AND | PCP Prophylaxis AND | |
| HIV | prescri* | |
| drug resistance AND HIV | drug resistance AND testing | |
| HIV AND drug resistance | drug resistance AND test* | |
| HIV | drug resistance | |
| HIV | HIV AND antiretroviral | pregnant AND |
| therapy, highly active | antiretroviral* |
| Title/Abstract | MESH | Full Text |
|---|---|---|
| HIV AND antiretroviral | pregnant AND | |
| agents | antiretroviral* | |
| HIV | HIV AND antiretroviral | pregnant AND ART* |
| therapy, highly active | ||
| HIV AND antiretroviral | pregnant | |
| agents | ||
| x-dign-CD4 protein, human | ||
| AND HIV | ||
| HIV AND x-dign-CD4 | CD4 test* | |
| protein, human | ||
| HIV | lipid panel AND ART* | |
| HIV AND antiretroviral | lipid panel | |
| agents | ||
| HIV AND antiretroviral | lipid panel | |
| therapy, highly active | ||
| HIV | lipid panel AND | |
| antiretroviral* | ||
| HIV | lipid panel AND | |
| antiretroviral* | ||
| HIV | HIV AND Tuberculosis | tuberculosis screen |
| HIV | TB screen* | |
| HIV | tuberculosis screen* |
PRISMA Diagram
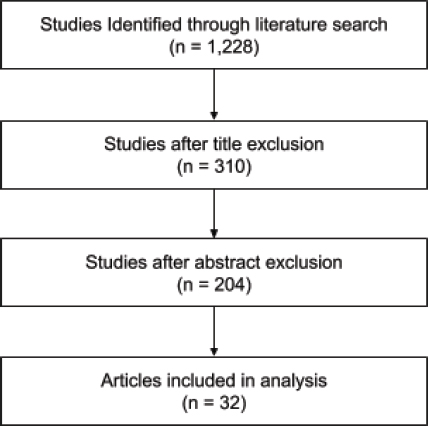
Community-Acquired Pneumonia
Indicator Definition
Pneumonia is an infection that occurs in a patient’s lungs. Air sacs in the lungs can fill with fluid or pus (purulent material), which affects one’s ability to breathe and often results in severe coughing and fever. Pneumonia ranges in severity and can result in death if left untreated. It most often results in more serious complications in vulnerable populations, including the elderly and children. Our review focuses on pneumonia acquired in the community rather than in a hospital, and specifically looks at the burden among the under 5 population (Mayo Clinic, 2018d).
Exclusion Criteria
| Content | Inclusion | Exclusion |
|---|---|---|
| Indicator |
Numerator: CAP patients who died |
|
| Study population or population of interest |
|
|
| Study type |
|
|
| Clinical setting |
|
|
| Age of death of those who died from CAP |
|
NONCOMMUNICABLE DISEASES
Acute Myocardial Infarctions (AMIs)
Indicator Definition
Acute myocardial infarctions (AMIs), or heart attacks, occur when blood flow to the heart is blocked, often by fat, cholesterol, or other substance buildup. These substances form plaque that can break away and clot, which prevents blood flow. AMI can destroy or damage muscles in the heart if treatment is not administered in a timely manner (Mayo Clinic, 2018b).
Exclusion Criteria
| Content | Inclusion | Exclusion |
|---|---|---|
| Timing |
|
|
| Country |
|
|
| Database |
|
|
| Language |
|
|
| Condition |
|
|
| Study population |
|
|
| Indicator |
Numerator: Patients with AMI or acute coronary syndrome (ACS) admitted to the health facility who die |
|
| Content | Inclusion | Exclusion |
|---|---|---|
| Study population or population of interest |
|
|
| Study type |
|
|
| Clinical setting |
|
|
| Age of death of those who died from AMI |
|
|
| Hospitalization rate |
|
|
Stroke
Indicator Definition
Strokes occur when blood flow to the brain is stopped or reduced and prevents transmission of oxygen. There are multiple kinds of strokes that can occur, including ischemic strokes and hemorrhagic strokes. Ischemic strokes occur when arteries in the brain become interrupted. Hemorrhagic stroke occurs when blood vessels rupture and leak blood into the brain (Mayo Clinic, 2018e).
Exclusion Criteria
| Content | Inclusion | Exclusion |
|---|---|---|
| Timing |
|
|
| Country |
|
|
| Database |
|
|
| Language |
|
|
| Condition |
|
|
| Study population |
|
|
| Indicator |
Numerator: Stroke patients admitted to the health facility who die |
|
| Study population or population of interest |
|
|
| Study type |
|
|
| Content | Inclusion | Exclusion |
|---|---|---|
| Clinical setting |
|
|
| Age of death of those who died from stroke |
|
|
Search Terms: CAP, AMI, and Stroke
| Title/Abstract | MESH | Full Text |
|---|---|---|
| Quality of Care | Myocardial Infarction | mortality |
| Quality of Care | Stroke | mortality |
| Quality of Care | Pneumonia | mortality |
| Quality of Care AND ami | mortality | |
| Quality of Care AND stroke | mortality | |
| Quality of Care AND pneumonia | mortality | |
| Quality of Care AND acs | mortality | |
| Quality of Care AND acute myocardial infarction | mortality | |
| Quality of Care AND acute coronary syndrome | mortality | |
| inpatient mortality | Myocardial Infarction | |
| inpatient mortality | Stroke | |
| inpatient mortality | Pneumonia | |
| in-hospital mortality | Myocardial Infarction | |
| in-hospital mortality | Stroke | |
| in-hospital mortality | Pneumonia | |
| hospital mortality | Myocardial Infarction | |
| hospital mortality | Stroke | |
| hospital mortality | Pneumonia | |
| mortality | Myocardial Infarction |
| Title/Abstract | MESH | Full Text |
|---|---|---|
| mortality | Stroke | |
| mortality | Pneumonia | |
| inpatient mortality AND ami | ||
| inpatient mortality AND acs | ||
| inpatient mortality AND acute myocardial infarction | ||
| inpatient mortality AND acute coronary syndrome | ||
| inpatient mortality AND stroke | ||
| inpatient mortality AND pneumonia | ||
| in-hospital mortality AND ami | ||
| in-hospital mortality AND acs | ||
| in-hospital mortality AND acute myocardial infarction | ||
| in-hospital mortality AND acute coronary syndrome | ||
| in-hospital mortality AND stroke | ||
| in-hospital mortality AND pneumonia | ||
| hospital mortality AND ami | ||
| hospital mortality AND acs | ||
| hospital mortality AND acute myocardial infarction | ||
| hospital mortality AND acute coronary syndrome | ||
| hospital mortality AND stroke | ||
| hospital mortality AND pneumonia | ||
| mortality AND ami | ||
| mortality AND acs | ||
| mortality AND acute myocardial infarction | ||
| mortality AND acute coronary syndrome | ||
| mortality AND stroke | ||
| mortality AND pneumonia |
PRISMA Diagram for CAP, AMI, and Stroke
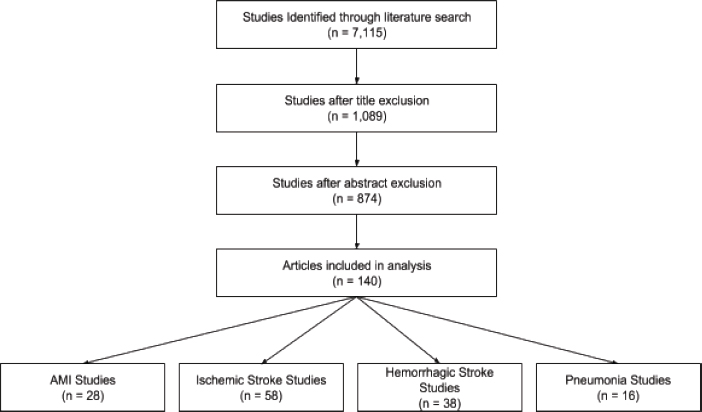
Congestive Heart Failure
Indicator Definition
Congestive heart failure (CHF) occurs when a person’s heart muscle is unable to pump enough blood through the body. Various conditions can cause CHF including narrowed arteries in the heart or high blood pressure. CHF is not always life threatening, but can cause death in severe circumstances when not properly managed (Mayo Clinic, 2018c).
Exclusion Criteria
| Content | Inclusion | Exclusion |
|---|---|---|
| Indicator |
Numerator: CHF patients who died |
|
| Content | Inclusion | Exclusion |
|---|---|---|
| Study population or population of interest |
|
|
| Study type |
|
|
| Clinical setting |
|
|
| Age of death of those who died from CHF |
|
|
Chronic Obstructive Pulmonary Disease (COPD)
Indicator Definition
Chronic obstructive pulmonary disease (COPD) is a chronic lung disease that results from inflammation in the lungs that reduces airflow. This inflammation can lead to difficulty breathing, coughing, and wheezing. Environmental factors often cause COPD, which leads to high rates of other comorbidities such as lung cancer and heart disease amongst COPD patients (Mayo Clinic, 2018a).
Exclusion Criteria
| Content | Inclusion | Exclusion |
|---|---|---|
| Timing |
|
|
| Content | Inclusion | Exclusion |
|---|---|---|
| Country |
|
|
| Database |
|
|
| Language |
|
|
| Condition |
|
|
| Study population |
|
|
| Indicator |
Numerator: COPD patients who died |
|
| Study population or population of interest |
|
|
| Study type |
|
|
| Clinical setting |
|
|
| Content | Inclusion | Exclusion |
|---|---|---|
| Age of death of those who died from COPD |
|
|
PATIENT CENTEREDNESS
Overall Rating
Indicator Definition
“Overall experience,” or “overall rating” is a global rating of the patient’s (or in cases of pediatric care, a caregiver’s) assessment of their care interaction. For high-income countries, this is taken from the Commonwealth Fund (CWF), and is taken from the following question: “Opinion of regular doctor in past 12 months,” taking a composite negative score from the answers “fair” or “poor.” The responses across all items were summed and converted into a percentage of the maximum possible score to yield an overall experience score, with a potential range of 0–100, where 100 represents the best possible experience. The scores obtained from positive expressions were added to the score in the reverse direction (1 − x).
Exclusion Criteria
| Content | Inclusion | Exclusion |
|---|---|---|
| Timing |
|
|
| Country |
|
|
| Database |
|
|
| Language |
|
|
| Focus |
|
|
| Study population |
|
|
| Content | Inclusion | Exclusion |
|---|---|---|
| Study population or population of interest |
|
|
| Study type |
|
|
| Clinical setting |
|
|
Search Terms
| Title/Abstract | MESH | Full Text |
|---|---|---|
| patient experience* | Patient-Centered Care OR patient satisfaction | recommend* OR rate OR rating OR communicat* OR underst* OR explanation* OR explain* OR respons* OR dignity OR respect* OR disrespect* OR abus* |
| patient satisfaction | Patient-Centered Care OR patient satisfaction | recommend* OR rate OR rating OR communicat* OR underst* OR explanation* OR explain* OR respons* OR dignity OR respect* OR disrespect* OR abus* |
| patient responsive* | Patient-Centered Care OR patient satisfaction | recommend* OR rate OR rating OR communicat* OR underst* OR explanation* OR explain* OR respons* OR dignity OR respect* OR disrespect* OR abus* |
| Title/Abstract | MESH | Full Text |
|---|---|---|
| responsiveness to patient* | Patient-Centered Care OR patient satisfaction | recommend* OR rate OR rating OR communicat* OR underst* OR explanation* OR explain* OR respons* OR dignity OR respect* OR disrespect* OR abus* |
| patient engagement | Patient-Centered Care OR patient satisfaction | recommend* OR rate OR rating OR communicat* OR underst* OR explanation* OR explain* OR respons* OR dignity OR respect* OR disrespect* OR abus* |
| patient reported | Patient-Centered Care OR patient satisfaction | recommend* OR rate OR rating OR communicat* OR underst* OR explanation* OR explain* OR respons* OR dignity OR respect* OR disrespect* OR abus* |
PRISMA Diagram
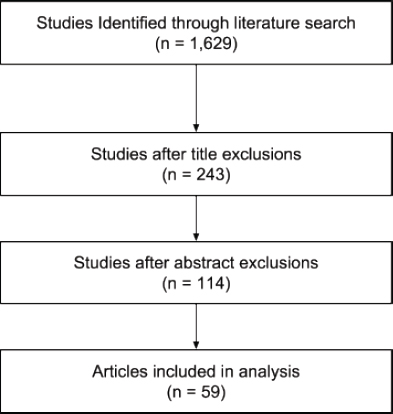
REFERENCES
CDC (U.S. Centers for Disease Control and Prevention). 2012. Ventilator-associated pneumonia (VAP). https://www.cdc.gov/hai/vap/vap.html (accessed June 10, 2018).
Dowdy, D. W., and R. E. Chaisson. 2009. The persistence of tuberculosis in the age of DOTS: Reassessing the effect of case detection. Bulletin of the World Health Organization 87(4):296–304.
Ferrari, A. J., S. Saha, J. J. McGrath, R. Norman, A. J. Baxter, T. Vos, and H. A. Whiteford. 2012. Health states for schizophrenia and bipolar disorder within the Global Burden of Disease 2010 study. Population Health Metrics 10(1):16.
Herman, A. A., D. J. Stein, S. Seedat, S. G. Heeringa, H. Moomal, and D. R. Williams. 2009. The South African Stress and Health (SASH) study: 12-month and lifetime prevalence of common mental disorders. South African Medical Journal 99(5 Pt 2):339–344.
Ishikawa, H., N. Kawakami, R. C. Kessler, and the World Mental Health Japan Collaborators Survey. 2016. Lifetime and 12-month prevalence, severity and unmet need for treatment of common mental disorders in Japan: Results from the final dataset of World Mental Health Japan Survey. Epidemiology and Psychiatric Sciences 25(3):217–229.
Jha, A. K., I. Larizgoitia, C. Audera-Lopez, N. Prasopa-Plaizier, H. Waters, and D. W. Bates. 2013. The global burden of unsafe medical care: Analytic modelling of observational studies. BMJ Quality & Safety 22(10):809.
Karam, E. G., Z. N. Mneimneh, A. N. Karam, J. A. Fayyad, S. C. Nasser, S. Chatterji, and R. C. Kessler. 2006. 12-month prevalence and treatment of mental disorders in Lebanon: A national epidemiologic survey. Lancet 367(9515):1000–1006.
Kessler, R. C., W. T. Chiu, O. Demler, and E. E. Walters. 2005. Prevalence, severity, and comorbidity of twelve-month DSM-IV disorders in the National Comorbidity Survey Replication (NCS-R). Archives of General Psychiatry 62(6):617–627.
Mayo Clinic. 2018a. COPD. https://www.mayoclinic.org/diseases-conditions/copd/symptomscauses/syc-20353679 (accessed July 15, 2018).
Mayo Clinic. 2018b. Heart attack. https://www.mayoclinic.org/diseases-conditions/heartattack/symptoms-causes/syc-20373106 (accessed June 15, 2018).
Mayo Clinic. 2018c. Heart failure. https://www.mayoclinic.org/diseases-conditions/heartfailure/symptoms-causes/syc-20373142 (accessed June 15, 2018).
Mayo Clinic. 2018d. Pneumonia. https://www.mayoclinic.org/diseases-conditions/pneumonia/symptoms-causes/syc-20354204 (accessed June 10, 2018).
Mayo Clinic. 2018e. Stroke. https://www.mayoclinic.org/diseases-conditions/stroke/symptoms-causes/syc-20350113 (accessed June 15, 2018).
NIH (National Institutes of Health). 2018. HIV medication adherence. https://aidsinfo.nih.gov/understanding-hiv-aids/fact-sheets/21/54/hiv-medication-adherence (accessed June 15, 2018).
Salomon, J. A., J. A. Haagsma, A. Davis, C. M. de Noordhout, S. Polinder, A. H. Havelaar, A. Cassini, B. Devleesschauwar, M. Kretzschmar, et al. 2015. Disability weights for the Global Burden of Disease Study 2015. The Lancet Global Health 3(11):e712–e723.
Shen, Y. C., M. Y. Zhang, Y. Q. Huang, Y. L. He, Z. R. Liu, H. Cheng, A. Tsang, S. Lee, and R. C. Kessler. 2006. Twelve-month prevalence, safety, and unmet need for treatment for mental disorders in metropolitan China. Psychological Medicine 32(2):257–267.
Tiemersma, E. W., M. J. van der Werf, M. W. Borgdorff, B. G. Williams, and N. J. Nagelkerke. 2011. Natural history of tuberculosis: Duration and fatality of untreated pulmonary tuberculosis in HIV negative patients: A systematic review. PLoS ONE 6(4):e17601.
WHO (World Health Organization). 2004. The treatment gap in mental health care. Geneva, Switzerland: WHO.
WHO. 2013. Global tuberculosis report. Geneva, Switzerland: WHO.
WHO. 2017. A study on the public health and socioeconomic impact of substandard and falsified medical products. Geneva, Switzerland: WHO.


