
4
Monitoring and Assessment
Monitoring is an essential aspect of ecological restoration efforts. Even though the need for monitoring is widely recognized, the National Academies of Sciences, Engineering, and Medicine (NASEM, 2017) noted that “most restoration projects in the U.S. and elsewhere often have lacked monitoring or the monitoring efforts have been insufficient to generate rigorous, decision-relevant, or publically accessible information.” Large-scale analyses of restoration projects nationwide have found that many efforts lack measurable objectives and quantitative data suitable to evaluate restoration progress. Evaluations are also frequently hampered by inadequate monitoring designs, a disconnect between the collection of monitoring data and their synthesis to inform a subsequent decision-making process, funding challenges, and data management issues. Given the importance of monitoring to understand Everglades restoration progress, which is a key element of the committee’s charge, this chapter examines Comprehensive Everglades Restoration Plan (CERP) monitoring at both the project and systemwide scales and offers recommendations to CERP agency staff as they work to improve those programs, ensuring that monitoring investments lead to useful information.
USEFUL MONITORING FOR RESTORATION
NASEM (2017) outlined three main purposes of restoration monitoring:
- to assure projects are built or implemented and are initially functioning as designed (construction monitoring);
- to assess whether restoration goals and objectives have been or are being met (performance monitoring); and
- o inform restoration management, to improve design of future restoration efforts, and to increase ecosystem understanding (monitoring for adaptive management).”
These types of monitoring typically occur in sequence; initial construction monitoring gives way to performance monitoring, which in turn is necessary for adaptive management. These types may use some of the same metrics and even the same samples, but the monitoring plans are designed for different purposes. Although many projects also require monitoring for regulatory compliance (such as monitoring water quality for compliance with regulatory criteria), this chapter emphasizes performance monitoring and monitoring for adaptive management. These types of monitoring can be structured at either the project level or systemwide scale.
Performance monitoring provides the data needed to evaluate how well a project (or set of projects) is meeting its objectives, which may include specific hydrologic objectives as well as the expected ecological outcomes. Performance monitoring and subsequent evaluation ensures accountability to the funders of restoration, including taxpayers and funding agencies, by communicating the outcomes of restoration investments and providing input to decision making through adaptive management. NASEM (2017) judged that performance monitoring is “essential for all restoration projects.” The CERP requires performance monitoring for all its projects.
Monitoring to support adaptive management is designed to address specific management questions or to fill restoration-related knowledge gaps, so that future Everglades restoration decision making or implementation can be improved by the knowledge gained (Nilsson et al., 2016). Adaptive management also fosters learning as new knowledge is gained on the ecosystem response to restoration efforts and the effect of changing conditions (e.g., climate change, sea-level rise) on restoration outcomes. Since 2011, all CERP projects have been required to develop a project-level adaptive management plan during the project planning process with specific monitoring requirements linked to decision-relevant uncertainties (USACE and SFWMD, 2011a). In 2015, RECOVER released a Program-level Adaptive Management Plan (RECOVER, 2015), but it did not include an associated monitoring plan or implementation framework.
Developing an effective restoration monitoring plan is challenging. The Monitoring and Assessment Plan (MAP) Assessment Strategy (RECOVER, 2006) outlines an approach to developing a monitoring program that is similar to that advocated by others (Convertino et al., 2013; Conyngham, 2010; NASEM, 2017; Pastorok et al., 1997; Thom and Wellman, 1996). The purpose of the MAP Assessment Strategy (RECOVER, 2006) is to “provide guidance to help ensure that the sampling designs and data analyses for the MAP monitoring components are adequate to detect measurable changes in hydrologic (including water supply and flood protection), water quality, and ecosystem indicators.” The guidance provides a roadmap for the development of effective project-level monitoring.
Figure 4-1 outlines key elements of the development of a monitoring plan, as outlined in NASEM (2017) and consistent with RECOVER (2006).
Central to the existing guidance on monitoring (Conyngham, 2010; NASEM, 2017; NPS, 2012; RECOVER, 2006) is the idea that a strong monitoring plan will connect restoration goals, objectives, management questions, models, and the monitoring design. Restoration monitoring requires clear definition of restoration goals and numeric success criteria (measurable objectives) so that performance can be evaluated. A conceptual model of the system, perhaps supplemented by numerical models, is used to identify factors that are likely to yield useful information if they are monitored. Finally, determining the most important management questions that monitoring should address is necessary to define the role of adaptive management monitoring and the acceptable levels of uncertainty in judging project performance.
Once the monitoring purposes are established (i.e., in terms of informing decisions on construction, performance, and adaptive management), then numerous project considerations must be understood and factored into the restoration monitoring plan (Figure 4-1):
- Specific indicators and metrics should be identified that provide ecologically reliable information to address the fundamental questions and are often derived from the conceptual ecological models (e.g., Ogden et al., 2005). To be useful to policy makers and managers, indicators must be understandable, quantifiable, and readily interpreted (Box 4-1). The CERP staff already know much of this material (see RECOVER, 2006), but it is much easier to describe the best practice than to put it into practice.
- Temporal and spatial scales of monitoring also need to be considered (i.e., Where should samples be taken? How many? For how long? How frequently?). These decisions, which are part of the statistical sampling design, ultimately impact the rigor of conclusions that can be drawn from the data. A related element of the monitoring plan is the statistical model that will be used to evaluate hypotheses that are related to numerical criteria and hence objectives. Common statistical approaches for evaluation of restoration include design-based inference, generalized linear mixed models, multivariate methods, and Bayesian hierarchical models. Examples include estimation of a species’ abundance, before-after control-impact (BACI) models, and nonmetric multidimensional scaling (see RECOVER, 2006). Power analysis and sample size calculations can be used to develop clear numerical objectives for the monitoring plan, prioritize metrics, and evaluate the likelihood of the plan’s success. As described in NPS (2012), “sampling (or statistical) objectives specify information such as target levels of precision, power, acceptable Type I and II error rates, and magnitude of
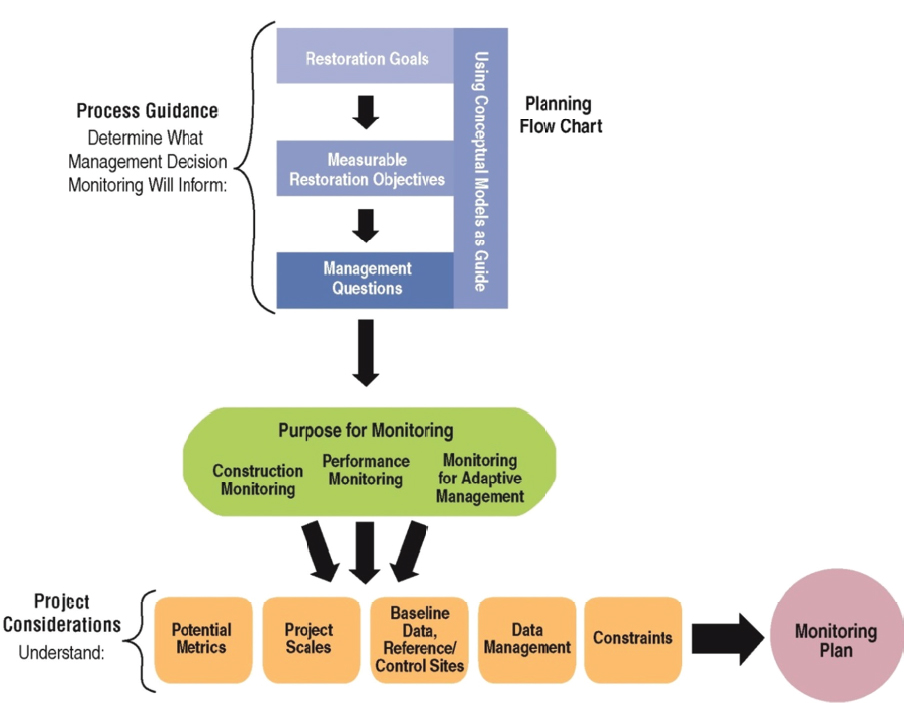
SOURCE: NASEM, 2017.
- Baseline data and/or reference or control sites will determine what responses can be attributed to restoration efforts amidst natural variability and ecosystem change. Assessment of existing baseline or reference data that may be appropriate for evaluating project objectives will inform plans to collect new baseline or reference data. Related projects may also benefit by jointly collecting
change you are hoping to detect” (see Box 4-2). For example, a monitoring plan can be developed with a sampling regime that can detect an increase in roseate spoonbill nesting success of 20 percent with 80 percent certainty of detecting this change if it occurs and a 10 percent chance of false detection of an increase when it does not occur. Sampling can be adjusted if a higher level of certainty is required.
-
baseline data or sharing a network of reference sites (NASEM, 2017), which will save monitoring costs.
- Data-management procedures and protocols should be established to ensure the accuracy and precision of the indicators. Data management procedures should be maintained throughout the restoration to standardize measurements and cross-calibrate instruments, especially when measurement technology changes. All methods should be documented so that people not associated with the original data collection can understand and reproduce the methods. All data used as input for indicators should be archived in as unprocessed, or raw, a form as possible so that the data will be available for computing a variety of indicators, many of which may be unanticipated. These procedures are especially important for long-term indicators. Data management should also address good practices such as quality assurance and quality control, careful construction of metadata, data publishing, and a means of data sharing (NASEM, 2017).
- Finally, constraints, such as long-term funding and accessibility of sampling sites, should be considered. Design decisions for the monitoring plan may depend on the availability of suitable reference sites or control sites. Other constraints related to social, political, or organizational factors must be considered (NASEM, 2017).
Because natural systems are complex over space and time, designing a truly useful monitoring program is much more difficult than is generally understood. For example, failure to recognize the difficulty of designing a good system of indicators typically results in a proliferation of indicators, many of which are of limited value, leading to a costly and unsustainable monitoring plan. Perhaps one of the greatest challenges in any monitoring program is identifying the aspects of the system’s structure and performance that should be monitored.
CERP PROJECT-LEVEL MONITORING
Three CERP projects—C-111 Spreader Canal Western, Picayune Strand, and Biscayne Bay Coastal Wetlands—have made sufficient implementation progress, with some expectations for system response. In this section, the committee examines the ability of their monitoring programs to sufficiently document performance and identifies lessons learned for project-level monitoring across all projects. Within the CERP approach to development of a monitoring program, while generally solid, some differences in implementation may lead to mixed support for decision making about project success. This uncertainty is reducible.
Examination of Monitoring for Three Projects
A comparison of three CERP projects highlights some of the differences within and among the approaches to monitoring design. All three CERP projects involve performance monitoring, which is defined by the U.S. Army Corps of Engineers’ (USACE, 2009) implementation guidance for monitoring ecosystem restoration as the “systematic collection and analysis of data that provides information useful for assessing project performance, determining whether ecological success has been achieved, or whether adaptive management may be needed to attain project benefits.” A variety of publications describe the attributes of successful monitoring and assessment plans (Conyngham, 2010; Johnson, 2012; NASEM, 2017; Olsen and Robertson, 2003; Reynolds et al., 2016). Selected attributes for the three projects are summarized in Table 4-1, and the project-level monitoring plans are discussed in more detail below.
TABLE 4-1 Comparison of Key Features of Three CERP Project-Level Monitoring Plans
| Criteria | Biscayne Bay | C-111SC | Picayune Strand | |
|---|---|---|---|---|
| Performance Monitoring | Establishment of conceptual ecosystem model | Yes | Yes | Yes |
| Development of numerical project objectives: drivers (e.g., hydrology, fire regime) | Yes (hydrologic objectives) | No | Yes (hydroperiod) | |
| Development of numerical project objectives: ecological response | For some indicators | Noa | Nob | |
| Basis of assessment of project performance | Comparison with numerical objectives and trend assessment from baseline | Comparison with baseline | Comparison to reference | |
| Suitability of sampling design to determine statistically significant performance to date | Yes | No | No | |
| Adaptive Management Monitoring | Includes evaluation of critical uncertainties and a process to assess monitoring results for adaptive management | Yes | No | No |
a Numerical targets exist for some ecological indicators, but the contribution of the project to attainment of these indicator goals amidst several regional projects is not clear.
b The Picayune Strand Project uses reference conditions in neighboring Fakahatchee Strand as an objective, but numerical criteria for similarity to reference conditions that are viewed as success have not been defined.
Biscayne Bay Coastal Wetlands (Phase 1) Project
The Biscayne Bay Coastal Wetlands (Phase 1) monitoring and adaptive management plan is comprehensive, providing details on nearly all of the key elements shown in Table 4-1. Of the three projects reviewed here, this project is the only one with an adaptive management plan. The project encompasses three broad objectives: (1) restore the quantity, quality, timing, and distribution of freshwater to Biscayne Bay and Biscayne National Park, (2) improve salinity distribution and reestablish productive nursery habitat in the nearshore areas, and (3) preserve and restore natural coastal wetlands habitat (USACE and SFWMD, 2011b; see also Chapter 3). Monitoring is spatially stratified into three distinct ecological zones characteristic of Biscayne Bay: the near-shore bay, tidal saltwater wetlands, and freshwater wetlands. Within each of these zones, performance measures, monitoring parameters, and a range of possible adaptive management options are considered.
A conceptual ecological model was developed for the Biscayne Bay to provide insight into ecosystem functioning, advance the understanding of relationships between ecosystem components and external drivers and stressors, and show the hypothesized pathways of impacts (Browder et al., 2005). Some of these relationships have been investigated directly, for example, upstream water management and rainfall and freshwater flow into Biscayne Bay. Other hypotheses were developed in conjunction with the CERP conceptual model and its hypothesis clusters, for example to predict the response of submerged aquatic vegetation (SAV) to restoration of freshwater flows and establishment of mesohaline conditions.
The Biscayne Bay Coastal Wetlands (Phase 1) Project uses a mix of objectives. Targets for water delivery and quality (including salinity) are quantitative, while objectives for biota (e.g., shrimp, invertebrates, juvenile crocodiles) are qualitative or narrative (Table 4-2). Many of the biotic targets are linked to water flows and salinity stressor metrics: for example, one objective is for the nesting density for juvenile crocodiles in the bay to be similar to that in natural areas such as Crocodiles Lakes National Wildlife Refuge near Key Largo, with a corresponding salinity target of 0-20 psu (USACE and SFWMD, 2011b). However, no quantitative targets have been developed. Regarding SAV, there is an expectation that freshwater inflows to the bay will increase the cover of Ruppia maritima in the near-shore and coastal embayments and that the range of Halodule wrightii will increase along the shoreline (RECOVER, 2014), but, again, no quantitative targets for cover or distribution have been specified. In some cases, understanding of the system is not sufficient enough to make statements about the expected response: for example, the response of dwarf and transitional mangrove communities to increases in freshwater flows may be offset by sea-level
TABLE 4-2 Examples of Biscayne Bay Coastal Wetlands Objectives
| Restoration Objectives | Indicators to Monitor Objectives | Time Period to Achieve Objectives |
|---|---|---|
| Hydrology: restore the quantity, timing, and distribution of freshwater to Biscayne Bay | Stage monitoring, hydroperiod, groundwater levels | Short |
| Salinity: 0 psu west of L-31E, 0-20 psu east of L-31, and a 10-25 psu near shore | Salinity | Short |
| Improve productive nursery habitat along the shoreline: e.g., oyster spat recruitment | Oysters (with salinity as habitat indicator) | Medium |
| Greater growth and abundance of submerged aquatic vegetation | SAV cover and species composition; salinity as habitat indicators | Medium |
| Increased cover and species composition of emergent wetland vegetation | Cover and species composition of macrophyte communities, wetland algae community composition | Medium |
| Increased crocodile nesting density similar to natural areas | Juvenile nesting density, salinity | Long |
NOTE: Some of the indicators used to assess project success are shown, as is the relative amount of time necessary to achieve each objective. Short is 5-10 years, Medium is 10-20 years, and Long is >20 years.
SOURCE: USACE and SFWMD, 2011b.
rise. Coupling a model to quantify the hydrologic effects on salinity gradients could facilitate quantitative predictions that could then feed into the adaptive management framework. In the absence of explicit statements of the expected response, performance cannot be evaluated and rigorous testing of the project’s efficacy is limited, thereby preventing implementation of the adaptive management plan. Although the project is in the early stages, it is not clear whether other monitoring questions are being actively investigated with monitoring data (e.g., how are juvenile crocodiles affected by water management?), nor is it clear whether the conceptual ecological model has been modified based on a refined understanding of the system.
A major objective of the Biscayne Bay Coastal Wetlands (Phase 1) Project is to improve productive nursery habitat along the bay’s shoreline. One indicator of improvement is the reestablishment of relic oyster bars in the mouths of restored freshwater creeks. Oyster monitoring is planned for eight sites where significant increases in freshwater delivery to the bay are anticipated and includes measurement of oyster spat recruitment, oyster reef development, juvenile growth and mortality, and adult health and reproductive status. This effort requires sampling of an ambitious list of parameters, so the project team strategically identified
which measures will receive priority for adaptive management actions (starting with salinity and oyster spat recruitment). The overall plan for oysters is robust, with the caveat that it cannot be fully implemented without setting quantitative targets for the indicators. This limitation may be linked to the lack of historical or baseline data upon which to build quantitative expectations (USACE and SFWMD, 2011b) and lack of data on the response of South Florida oyster populations to restoration efforts.
The monitoring plan includes some sample size analyses. For example, in the case of oysters, the sampling intensity for oyster density was selected to identify a shift in mean oyster density of 1.5 times the standard deviation with 95 percent confidence and nondetection rate of 20 percent (Type II error rate; see Box 4-2). As part of the adaptive monitoring plan for this metric, sample size can be adjusted based on first-year monitoring results. Although statistical models for analyzing the water quality data are not described in the monitoring plan, subsequent reports (e.g., Charkhian et al., 2018) describe the statistical methodology used for evaluating trends in water quality parameters.
For many of the Biscayne Bay Coastal Wetlands indicators, baseline (i.e., pre-construction) data are used to assess project-level performance (post-construction). For example, 2 years of baseline data have been used to compare the response of some aquatic species, such as fish, macroinvertebrates, shrimp, and crabs, to restoration efforts. This is a relatively short time period to gain an understanding of the annual variability in the system. In addition, water quality indicators, including salinity and temperature, have been monitored to establish baseline conditions and to quantify the relationship between freshwater flows and salinity patterns in the near-shore bay. Where possible, water quality sampling stations are located at the site of historical records to expand the time frame of baseline monitoring data. Vegetation monitoring operates at two scales: (1) detection of large-scale changes in vegetation based on aerial photo interpretation and (2) small-scale changes in vegetation by sampling plots located on transects along hydrologic gradients. To assess the large-scale changes in vegetation, a minimum of 20 years of aerial photos and mapping will be analyzed. Near the L-31E Project culverts, sawgrass was mapped in 2013 in a 370-acre area in the vicinity of culverts S-23A and S-23B to create a baseline map of sawgrass abundance. The decisions about baseline data collection were strategic, and, although variable, the temporal scope of the baseline data should enable assessment of whether restoration efforts are having the desired effect.
For each ecological zone in the adaptive management plan, a decision framework will link performance measures to monitoring, targets, and potential management options. However, despite the extensive effort devoted to developing the monitoring and adaptive management plan, reporting on restoration
progress has largely been limited to hydrologic indicators (water levels and flows), water quality indicators (salinity, nutrients), and vegetation. Data on, or the assessment of, faunal indicators is lacking.
Multiagency analysis of project-level results that would support project-level adaptive management and public understanding of incremental benefits is also lacking. For example, the L-31E culverts have not consistently produced flows that meet regulatory targets, with particular deficits in dry seasons (see Figure 3-11) and limited biological responses (see Chapter 3), but a publicly available analysis of the causal factors has not been published. A delay in pump construction is likely a major factor; a temporary pump installed in October 2014 improved flows, although an interim pump operating since August 2017 has been less successful over the limited period for which data are available. Many factors may be affecting performance of this component to date, including interim pump capacity compared to the full project design capacity, availability of water, regional water management, and sea-level rise, which will necessitate greater head gradients to produce the intended flow. Because the interim pumps were installed recently, the data do not appear in the latest South Florida Environmental Report. However, analysis of the various factors affecting project performance since implementation, and of their likely impact on project goals, has been limited. Although the project is not complete, much could be learned from the existing monitoring to inform future actions, and these opportunities for learning are being missed.
Similar challenges are apparent at the Deering Estate component, which is complete and has been operating since 2012. Monitoring data for 2012-2016 showed that wetland water levels declined very quickly each day after nighttime pumping was stopped because of the highly permeable landscape. This large fluctuation in water levels was inconsistent with the original project design. Yet, nighttime pumping continued until 2016 when the SFWMD conducted an experiment comparing pulse versus continuous pumping to analyze pumping alternatives. Only in September 2018 did the SFWMD adjust operations to provide continuous pumping (M. Jacoby, SFWMD, personal communication, 2018). An analysis of the new lower but continuous pumping rates on the intended project outcomes for near-shore salinity has not been articulated.
Of the three projects reviewed in this section, the Biscayne Bay Coastal Wetlands most closely follows the guidance in RECOVER (2006), Conyngham (2010), and other monitoring documents cited above. In general, the monitoring plan addresses the necessary elements and serves as a model for the other CERP projects. However, the disconnect between the detailed plans for monitoring and adaptive management and the limited plans for analysis and reporting of project performance could limit what is being learned from the project and
how it can inform future management actions. There is also a need to establish numerical targets for all project objectives and to provide a multiagency analysis of project performance relative to those objectives to ensure realization of the plan’s full potential.
C-111 Spreader Canal Western Project
The monitoring plan for the C-111 Spreader Canal Western Project centers on three main project goals: (1) improve the quantity, timing, and distribution of water delivered to Florida Bay via Taylor Slough; (2) improve hydroperiods and hydropatterns in the Southern Glades and Model Lands; and (3) reduce ecologically damaging flows to Florida Bay and other receiving waters (USACE, 2016c). In a report evaluating project success, Kline et al. (2017) describe a broader set of objectives (Table 4-3). They note that long-term achievement of objectives will require additional freshwater input, which is partially controlled
TABLE 4-3 C-111 Spreader Canal Project Objectives, Related Indicators, and the Time Necessary to Achieve Each Objective
| Restoration Objectives | Indicators to Monitor Objectives | Time Period to Achieve Objectives |
|---|---|---|
| Increased hydroperiod and freshwater conditions across the southern mangrove transition zone |
|
Short |
| Increased coverage of brackish and freshwater submerged and emergent vegetation | Cover, biomass, and identification of vegetation | Short |
| Lower salinities in the southern lakes region | Salinity levels | Short |
| Increased abundance of the freshwater prey-based fish communities in the southern mangrove zone | Freshwater prey abundance and biomass | Medium |
| Increased productivity of the southern mangrove transition zone and northeastern Florida Bay |
|
Medium |
| Increased nesting success of roseate spoonbills in northeast Florida Bay | Nesting success | Long |
| Increased crocodiles |
|
Long |
NOTE: Short is 5-10 years, Medium is 10-20 years, and Long is >20 years.
SOURCE: Adapted from Kline et al., 2017.
by other projects (Mod Waters, C-111 Spreader Canal [Phase 2], and the Central Everglades Planning Project).
To assess progress toward these three goals, the project will monitor salinity, vegetation, fish prey densities, stage, discharge, and water quality (Table 4-3). Historical pre-project data are available for hydrology, salinity, rainfall, fish abundance, and roseate spoonbill nesting metrics. National Science Foundation–sponsored Long-term Ecological Research (LTER) also provides baseline and continuing monitoring at five sites along a transect in Taylor Slough and at three sites in Florida Bay. Hydrologic, meteorological, and water quality indicators are monitored in and around the C-111 Spreader Canal Project area, and ecological and salinity monitoring is conducted in the southern coastal wetlands and Florida Bay (see Table 4-3).
Numerical restoration criteria are available for certain indicators1 based on the ecological response to salinity in Florida Bay (Davis et al., 2005; Wingard and Lorenz, 2014), but it is not clear how these criteria quantitatively connect to the C-111 Spreader Canal Project. The current lack of quantitative objectives in the C-111 Spreader Canal project for flows in Taylor Slough or for salinity changes in Florida Bay makes it impossible to evaluate the project’s restoration performance. Measurement of the project’s effect on salinity in Florida Bay will require that project-related increased flows into Florida Bay are estimated and used to evaluate the reduction in salinity with and without the flow. The project’s effect could be quantified in terms of projected reductions in violations of minimum flow targets that have been specified for the region affected by the project (NPS, 2012).
The performance of the C-111 Spreader Canal Project will be best evaluated using indicators that are clearly linked to the quantitative restoration objectives of the project and not to objectives for Florida Bay salinity more generally. Computer models, combined with the understanding of the ecosystem, could be used to develop quantitative objectives for flow in Taylor Slough and Florida Bay salinity at specific locations (perhaps near shore) based on the project benefits, and adjusted as necessary to account for the implementation of nearby projects that also provide benefits. Ecological models combined with restoration science knowledge could be used to develop quantitative ecological objectives in these regions. Monitoring data could then be compared against these objectives, using computer simulations and statistical models to help interpret the results amidst interannual hydrologic variability. Modeling and statistical analysis would likely reveal that project-related changes in salinity and SAV in areas of open water in Florida Bay will be difficult to detect through monitoring of the C-111 Spreader
___________________
1 Mangrove community structure and spatial extent, water birds, prey-base fish and macroinvertebrates, crocodilians, and periphyton.
Canal Project alone. SAV and salinity are more appropriate indicators of a system-level response to the aggregate effects in the Florida Bay of all the CERP and non-CERP projects. Monitoring flows into upper Taylor Slough and eastern seepage back to the C-111 Canal and then comparing the resulting data to baseline data and quantitative objectives would provide more useful information about the project’s performance. Although the project aims to reduce seepage and thereby increase flows in Taylor Slough to Florida Bay, no monitoring design document describes an approach to estimating the reduction in seepage or the increase in flows associated with the project and their uncertainty.
A quantitative analysis plan is needed to evaluate project performance, and long-term monitoring may be required to observe effects on ecological indicators in Florida Bay. It may be difficult to separate the effects of the C-111 Spreader Canal Project from those of non-CERP projects to the north that will also increase the deliveries of freshwater (e.g., ModWaters, C-111 South Dade, Florida Bay Project [see Chapter 3]). Coupling a hydrologic model that can quantify the effects of the C-111 Spreader Canal Project and other projects with a salinity model of Florida Bay could help to estimate the contribution of the individual projects toward the restoration targets. Although already in use in project planning, many of the necessary modeling tools are not being used with monitoring data to evaluate project performance.
In summary, the C-111 Spreader Canal Project, which began operations in 2011, has collected years of monitoring data. However, to date, monitoring and assessment are insufficient to understand the project’s performance. Qui et al. (2018) summarized rainfall, stage, flow, and hydrology using graphical and descriptive methods, comparing the current year with pre-project years 2002-2012, but concluded that project success cannot be evaluated until all related projects in the area are completed and operational. However, in the interim, more could be done to assess the project’s progress, such as developing numerical criteria, monitoring short-term indicators of project success, and implementing a quantitative analysis plan. Such improvements would also better support adaptive management efforts.
Picayune Strand Restoration Project
The monitoring plan for the Picayune Strand Restoration Project is comprehensive in its intent to determine whether the anticipated hydrologic, vegetative, wildlife, and estuarine benefits are being achieved. The project was developed to rehydrate a large drained wetland in southwestern Florida (see Chapter 3 for a description of the project and implementation to date). The monitoring plan was designed to address the nine project objectives listed in Table 4-4 (USACE and SFWMD, 2004a). There is no formal adaptive management plan, because
TABLE 4-4 Picayune Strand Objectives, Related Indicators, and the Time Necessary to Achieve Each Objective
| Restoration Objectives | Indicators to Monitor Objectives | Time Period to Achieve Objectives |
|---|---|---|
| Reestablish natural flows to estuary | Not listed | Short |
| Increase surface aquifer recharge | Not listed | Short |
| Restore historic hydropatterns, sheet flow, and flow-ways | Water levels, hydroperiod | Short |
| Maintain sufficient water quality | Surface water quality, estuarine water quality, sediment, and tissue analysis | Short |
| Restore Everglades ecosystem to 1940s condition | Vegetation, nuisance and exotic vegetation, aquatic macroinvertebrates, fish, amphibians, oysters, SAV, oyster reef crab, nekton, wading birds, listed species (wood stork, panther, manatee) | Short/Medium to long |
| Restore ecological connectivity | Not listed | Short to Long |
| Provide resource-based recreational opportunities | Not listed | Short to Long |
| Restore natural fire regime | Not listed | Medium |
NOTE: For purposes of this analysis, the time period to infer objectives was inferred from monitoring duration as presented in the Picayune Strand monitoring plan (USACE and SFWMD, 2009) and the judgment of the committee. Short is 5-10 years, Medium is 10-20 years, and Long is >20 years.
the project implementation report was developed before project-level adaptive management plans were required.
The project’s objectives vary in whether they are articulated in qualitative or quantitative terms. For example, the target for oyster reef crabs is unusually detailed, while the target for vegetation is quantitatively vague (i.e., “comparable to the composition and structure of hydrologically similar reference sites”), with no indication of what degree of similarity between the restoration and reference sites is considered successful. Even when numerical criteria are established, as with hydroperiod and water levels by vegetation category (Table 4-5; USACE and SFWMD, 2009), they do not seem to be utilized to assess monitoring data (Barry et al., 2017; Chuirazzi et al., 2018; Worley et al., 2017).
The phased construction of the project, including the backfilling of several canals and construction of three pump stations (see Table 3-2 and Figure 3-4), led to development of a complicated monitoring schedule, with much of the post-construction ecological monitoring yet to occur. For the purpose of performance assessment, extensive hydrologic monitoring is available from 23 wells in Picayune Strand north of Tamiami Trail (since October 2003), three additional wells in brackish marshes south of Tamiami Trail (since November 2006), and
TABLE 4-5 Numerical Hydrologic Objectives for Plant Communities in Picayune Strand
| PSRP Plant Communities | Hydroperiod (months) | Water Level (in) Wet | Water Level (in) Dry (1,10) |
|---|---|---|---|
| Mesic Flatwood, Mesic Hammock | ≤1 | ≤2 | -46, -76 |
| Hydric Flatwood, Hydric Hammock | 1 – 2 | 2 – 6 | -30, -60 |
| Wet Prairie, Dwarf Cypress | 2 – 6 | 6 – 12 | -24, -54 |
| Marsh | 6 – 10 | 12 – 24 | -6, -46 |
| Cypress | 6 – 8 | 12 – 18 | -16, -46 |
| Swamp Forest | 8 – 10 | 18 – 24 | -6, -36 |
| Open Water | >10 | ≥24 | <24, -6 |
| Tidal Marsh, Mangrove, Beach | Tidal | Tidal | Tidal |
SOURCE: USACE and SFWMD, 2009.
24 wells along two transects across Fakahatchee Strand (since 1987). Vegetation and aquatic macroinvertebrate monitoring was completed in 2016 following the plugging of the Merritt Canal.
The existing analyses of hydrologic data involve comparison to reference site hydrology or inference of trends and are only qualitative in nature (see Figures 3-6 and 3-7). Quantitative comparisons of observed hydroperiods to the target conditions for different vegetation types would provide a clear and concise early indicator of the degree of hydrologic responses and whether the appropriate pre-conditions for vegetative community shifts had occurred. If specific hydrologic metrics are not considered in performance assessment and only comparisons to reference are made, then a statistical pattern-matching technique should be applied to a comparison of restored sites to reference sites with the desired vegetative communities. Trend methods (Skalski et al., 2001) that evaluate parallelism between reference and restored sites have been used effectively to evaluate restoration success; recovery is considered complete when the restored site begins to track or parallel the reference site. Bayesian methods (Conner et al., 2015; Prato, 2005) may also be useful for evaluation of restoration.
For the biotic components of vegetation and aquatic macroinvertebrates, the Picayune Strand monitoring plan uses comparison to reference sites to demonstrate restoration success, with an ultimate target of matching the distribution, composition, and extent of 1940s vegetation. Baseline vegetation sampling occurred from 1996 to 2005 at approximately 90 transects located in reference areas (in Fakahatchee Strand Preserve State Park and Florida Panther National
Wildlife Refuge) and across the entire project area. Subsets of transects in the project area are sampled to assess the impacts of various phases of the restoration. For example, vegetation was sampled in 2005, 2008, 2009, 2011, and 2012 at transects to the east of the Merritt Canal to assess the effects of various stages of the Prairie Canal restoration, and the 2016-2017 sampling was the first event for Merritt Phase transects post-restoration (see Figure 3-5). Baseline sampling for treefrogs, aquatic macroinvertebrates, and fish occurred in 2005-2007. In 2016 a subset of these transects were sampled to assess changes in vegetation and aquatic fauna (16 project transects [8 pairs] that were classified as having either full or partial hydrologic restoration and 11 reference transects). The 8 pairs of restored transects represented six vegetation habitat types: cypress, wet prairie, pine flatwoods/hydric, pine flatwoods/mesic, hammock/hydric, and freshwater marsh. The 11 reference transects were chosen to represent three types of pre-drainage habitat: cypress, wet prairie, and pine flatwoods/hydric.2
A basic two-sample t-test is used to compare a range of vegetation parameters in reference and restored sites in different vegetation habitats (Barry et al., 2017). While valuable, two issues with this approach should be addressed to reduce uncertainty in evaluating project success. First, the approach to infer similarity with reference sites is based on an individual sampling event and does not account for the natural variability in reference conditions over time and space. This variability in reference sites could be evaluated and used to determine when the restoration at restored sites can be considered successful. Second, statistical inference for Picayune Stand is hampered by small sample sizes for both the restoration and reference sites. The number of sample sites within a habitat group is currently small (1-4) in the areas with full or partial hydrologic restoration (Barry et al., 2017), which makes it difficult to reject the hypothesis of no difference (because of a lack of power in the testing process). However, as additional project components are implemented and a larger area becomes affected, more transects should become available for sampling. Larger samples sizes can help to identify small but significant differences, as can longer monitoring periods. In general, the same issues of natural variability in reference sites and small sample size apply to sampling of frogs, fish, and macroinvertebrates. For example, an overall increase in Cuban treefrog populations (an invasive species) at reference sites makes any distinction between restored and reference sites difficult to ascertain, and the relatively short time period under restored conditions makes changes difficult to detect (Worley et al., 2017).
While the Picayune Stand sampling scheme is generally robust in its spatial and temporal extent, temporal expectations for restoration performance are gener-
___________________
2 The reference transects included three transects of cypress only, plus one transect of cypress with graminoid understory, four transects of wet prairie, and three Pine flatwoods/hydric transects.
ally left unstated. The lack of specific temporal expectations combined with the lack of numerical objectives make it difficult to effectively evaluate restoration success, which, in turn, limits the capacity for adaptive management (coupled with the lack of a formal adaptive management plan). For example, while groundcover wetland affinity indices in restored sites show a response in cypress and prairie communities, but not in pineland communities. Is this to be expected? How should vegetative expectations be adjusted in light of hydrologic responses to date? Significant learning has already occurred through hydrologic monitoring, including the recognition of the zone of influence of unplugged canals on hydrologic response. However, numerical targets for hydroperiod or more specific hydropattern matching analysis between restored and reference locations, combined with stated expectations for vegetation response under restored hydrologic conditions, would better support a formal process of evaluating why/why not expectations for ecological response have been met. Currently, significant learning opportunities are being missed.
In summary, the Picayune Strand Restoration Project approach to monitoring is comprehensive for a phased restoration effort, but the lack of numerical targets, rigorous statistical approaches, and articulation of temporal expectations and envelopes of variability limits the ability to assess performance and take advantage of learning opportunities.
Key Lessons Learned from Project-Level Monitoring
The comparison of the monitoring programs for three early CERP restoration projects reveals several findings. A strength of Everglades monitoring has been the collaboration and consistency in goals and methods. This consistency reduces uncertainty in how data are collected by various agencies and should reduce uncertainty in information used in management decisions. The comparison of monitoring also reaffirms several lessons that are consistent with RECOVER (2006) that could improve future project-level monitoring programs, including
- Use of quantitative objectives and envelopes of expectations,
- Careful selection of indicators and appropriate scales of project monitoring,
- Rigorous statistical and computational analysis, and
- Missed opportunities for learning through adaptive management plans.
Quantitative Objectives and Envelopes of Expectations
Clear, quantitative objectives or expectations of system response are essential components of project-level performance monitoring. In the three projects
examined, quantitative objectives are clear (Biscayne Bay Coastal Wetlands), varied and sometimes unclear (Picayune Strand), and lacking (C-111 Spreader Canal).
Performance targets may be specific (e.g., water depths at or above 1 foot for 30 consecutive days) or indicate an envelope or range of acceptable performance (water depths between 1 and 2 feet for 60 percent of the growing season). Defining restoration targets as a range of values under which an ecosystem may vary, instead of as a fixed target, results from an increasingly sophisticated understanding of how ecological processes vary over time and space. Early in the development of the science of ecological restoration, ecosystems were thought to be deterministic, returning to pre-disturbance conditions when stressors were removed, and therefore success could be measured against static targets. More recently, the awareness that ecosystems show thresholds and nonequilibrium dynamics has led to the definition of envelopes of anticipated response (Falk et al., 2006). For example, prior to the disruption of Everglades hydrology, salinity levels in Florida Bay would have fluctuated according to the natural variation in annual rainfall patterns and temperatures. Goals that acknowledge this variability in the natural system reflect the reality of ecosystem dynamics and allow learning to take place, resulting in a more effective approach to restoration. When an indicator falls outside of the expected behavior range, the project team should evaluate why the outcome is not responding according to the conceptual model used to select the indicator.
The Biscayne Bay Coastal Wetlands Project’s approach considers variability and therefore defines an acceptable envelope of monitoring results. In this case, salinity monitoring is used to determine whether the appropriate salinity envelope is being achieved for eastern oysters at or near the mouths of major tidal creeks. The target envelope has been set at 10-25 psu, which ensures adequate flows during the dry season to maintain salinity at or below 25 psu. Because eastern oysters cannot tolerate low salinity beyond short periods, the target is designed to limit freshwater flows so that salinity does not fall below 5 psu for more than 5 consecutive days (USACE and SFWMD, 2011b). By using a range of expectation for restoration end points, the “precision problem” in restoration monitoring can be avoided (Hiers et al., 2016).
In Picayune Strand, assessment of project performance would be strengthened by explicitly stated, quantitative expectations of the restoration response, including the time expected for restored sites to reach reference conditions. For example, this project seeks to reestablish or expand three major plant community types (pine flatwoods, wet prairie, and cypress), which are expected to have differential responses over time. Currently, the expectation is only that the trajectory of ecosystem response will trend toward reference conditions, with no
time frames for response. Quantitative objectives for hydroperiod (or a numerical target for hydropattern matching) would enable statistically rigorous early performance assessment. In the C-111 Spreader Canal Project, some quantitative indicators for the broad restoration efforts in the region exist, but project-specific measurable objectives are lacking. Clear quantitative project objectives, with estimated timescales for achieving them, are essential to the success of project-level adaptive management.
Monitoring programs may not have established quantitative objectives at the project planning stage, and substantial uncertainty about quantitative objectives may persist through project design. This uncertainty should be clearly described, and as the project evolves and knowledge is gained about ecosystem response, the quantitative objectives can be refined. For example, as the Kissimmee River Restoration Project evolved, it moved from early, narrative objectives (“restore ecological integrity to the Kissimmee River and its floodplain”) to quantitative, measurable indicators to track progress toward that goal (“percent of water years that the mean depth at broadleaf marsh sites is greater than 1 ft for 210 days consecutively in a water year”) (Koebel et al., 2017). It is only with specific targets that progress can be measured and goals operationalized.
Careful Selection of Indicators and Appropriate Scales of Monitoring
The ability to assess a project’s success depends on the appropriate selection of indicators and their associated metrics. Considerations include measurement uncertainty, timescales of response, natural variability, and the influence of non-restoration-related factors (such as disease). For example, vegetation cover will respond to increased water from a project but also to rainfall magnitude, duration, frequency, and timing. Episodic events, such as hurricanes and exotic species invasions, may also have a strong influence. Monitoring plans must consider the likelihood that a metric can detect success given potential confounding factors.
Identifying appropriate indicators to quantify objectives is challenging when system changes occur over large areas and long time periods. The scale of the monitoring plan should align with the scale of the anticipated effects of that project and not be conflated with measures of systemwide or regional response. For the C-111 Spreader Canal Project, existing indicators in Florida Bay and the southern mangrove transition zone may be unable to detect project-related changes in the face of natural variability and may be better indicators of long-term regional restoration improvements. Indicators of flow and seepage near the project features are needed to assess project performance and inform adaptive management.
In some cases, indicators must be able to detect slow change that occurs over the long term. For both Biscayne Bay Coastal Wetlands and Picayune Strand, vegetation with a long life cycle, such as cypress, pine flatwood communities, and mangroves, are being monitored, which may require 10 or more years before solid indications of restoration progress emerge. For example, tree basal area, which has a long response time, is being measured in the five Biscayne Bay long-term vegetation monitoring plots. If these slowly changing indicators are judged to be important to performance assessment, larger samples sizes can help identify small but significant differences. Otherwise, longer monitoring periods may be necessary to see a significant effect, and less frequent monitoring of these indicators will reduce costs. Thus, the selection of indicators should recognize the spatial and temporal complexity of the responses they are intended to measure.
The costs of monitoring and the complexity of data management and interpretation increase exponentially as the number of indicators increases. The parsimonious selection of indicators can increase the effectiveness of a monitoring program; that is, fewer indicators can be better. The key question is how to reduce the number of indicators without losing useful information. Recognizing that not all aspects of the system can be tracked, the Biscayne Bay Coastal Wetlands Project used the conceptual ecological model to select a species (e.g., oysters) to monitor whose abundance is directly linked to system stressors (Browder et al., 2005). In this way oysters act as a surrogate for other parameters. The monitoring schemes of the three projects reviewed here are ambitious with many, sometime overlapping indicators. This can lead to the problem of being data rich and information poor; that is, project managers have a surplus of data that is difficult to translate into useful and actionable information (Doren et al., 2009).
Rigorous Statistical and Computational Analysis
The project-level monitoring programs lack rigorous computational analysis, either in the design of the monitoring plan or in the analysis of the data, or both. For example, the Picayune Strand and the C-111 Spreader Canal monitoring plans do not address how collected data will be analyzed. As a result, it is unclear whether the monitoring data can lead to meaningful conclusions about project performance. Future projects should return to monitoring fundamentals that were described in RECOVER (2006) and USACE planning (Conyngham, 2010) and include initial determination of the statistical or other type of model(s) that will be used to evaluate project performance. Then, the modeling approach should be evaluated using simulated or historical data to determine whether the monitoring and sampling, especially the spatial and temporal extent of sampling
and number of samples, will result in sufficient data to render conclusions about project performance with known certainty.
Kline et al. (2017), for example, developed an analysis process to assess the performance of the C-111 Spreader Canal Western Project after the monitoring was completed. Although the results of the analyses are not incorrect, such a process might be viewed as subjective because the decisions about the analysis were not part of the monitoring plan (i.e., see Conyngham, 2010). Similarly, Robinson et al. (2016) used rainfall pattern matching to identify a year from a pre-project historical dataset that is comparable to the current year. They then compared the data for the current and selected historical year for hydrology, submerged aquatic vegetation, and fish metrics. They made decisions about the spatial extent of the rainfall (which gauges to use), how rainfall data were summarized (monthly mean), and the time period for evaluation (water year), as well as the methodology for determining which year in the prior monitoring period was most similar to a current year. The approach involves choice of a measure of similarity, method for summarization (multidimensional scaling), and number of dimensions to use. Again, this approach may be appropriate, but different researchers might use a different approach a posteriori and come to different conclusions. For example, Kline et al. (2017) used the same approach but could not find an adequate match because of the unique rainfall pattern in water year 2016. Defining the approach to statistical analysis in the monitoring plan reduces uncertainties and allows for an a priori estimate of the strength of the inference that is made about project success.
Evaluation of individual project performance with multiple, neighboring projects may require the use of more complex statistical models or hydrologic and ecological simulation models as part of the data analysis. Even with these tools, some ecological indicators may be difficult to evaluate given natural variability in the system and will require a long-term commitment to monitoring. In addition, it may be impossible to separate project-level effects from the effects of other neighboring projects, and therefore the performance of multiple projects may need to be judged collectively. Upfront statistical analysis could identify these metrics and scale issues, so that planners are aware of the long-term investments needed to assess project performance.
Factors such as climate variability, saltwater intrusion, and long-term changes in rainfall frequency, intensity, timing, and duration are likely to influence the assessment of project performance. It may be unrealistic to assess hydrologic and ecological objectives under different climate scenarios without a strong modeling approach that enables evaluation of ecological responses given multiple stressors and changing baselines. Simple statistical modeling may not be able to provide strong inference, making more-complex modeling necessary, for
example, by combining statistical and ecosystem simulation. Further development of predictive models may be needed to evaluate restoration success under scenarios of change.
Missed Opportunities for Learning
Without adaptive management plans, the opportunities for learning about the restoration process are limited. Of the three CERP projects reviewed here, only Biscayne Bay Coastal Wetlands has an established adaptive management plan; Picayune Strand was initiated before adaptive management plans were required, and the C-111 Spreader Canal Project team has not developed one. The absence of an adaptive management plan makes it difficult to structure monitoring and evaluation so that new knowledge can be applied in a flexible decision-making process. Performance monitoring may show that project objectives are not being met, but it cannot provide the reasons for failure or suggest corrective actions, nor can it resolve uncertainties in the understanding of the system (NASEM, 2017; RECOVER, 2015). The opportunity for learning through monitoring is also limited by the lack of integration of modeling with monitoring, which can aid in setting quantitative objectives and predicting reference conditions.
Learning is also restricted by the fragmented nature of reporting for specific projects and the absence of multiagency assessment of project-level monitoring, as RECOVER performs for systemwide monitoring. The assessment of hydrologic conditions is reported in at least three separate reports for Picayune Strand that use different analysis methods.
SYSTEMWIDE MONITORING
The CERP Monitoring and Assessment Plan (MAP) was originally developed in 2001 and has been developed and revised several times, with the latest version in 2009 (RECOVER, 2009). It was intended to establish a “robust and scientifically defensible monitoring program.” According to RECOVER (2009):
“[i]nitially, the MAP had three broad objectives: (1) establish a pre-CERP reference condition (e.g., the condition prior to implementation of restoration activities and significant anthropogenic changes associated with CERP) including variability for each of the performance measures; (2) provide an assessment of the system-wide responses of CERP implementation; and (3) detect unexpected responses of the ecosystem to changes in stressors resulting from CERP activities.”
The systemwide monitoring plan also provides data that are used communicate the state of the system to the public. RECOVER uses the System Status Reports (SSRs; RECOVER, 2010, 2014) to provide information related to these three broad objectives, and the South Florida Ecosystem Task Force uses the data to show the status of its systemwide indicators (Box 4-3). Although the monitoring plan is designed for these systemwide objectives, some projects use the data to supplement project-level performance monitoring. All three projects reviewed in this chapter use some RECOVER systemwide data to evaluate project performance.
RECOVER (2009) and earlier documents provide details about the plan’s development. In brief, RECOVER started with conceptual ecological models and hypothesis clusters to identify uncertainties and frameworks for understanding how aspects of the ecosystem might respond to environmental changes and restoration activities. MAP 2009 reemphasized the importance of being able to detect change in status and trends and to understand why those changes are
occurring. MAP 2009 stated that “addressing the why questions are essential” to successful implementation of adaptive management.
Several publications describe the desirable features of systemwide monitoring, including two by the National Research Council (NRC, 2000, 2003a). The development of the MAP was a large effort in which consideration was given to identify the characteristics of effective indicators and metrics (NRC, 2003a). From the beginning, CERP partners and prior National Academies committees (NRC, 2003a, 2007, 2010, 2012) have recognized the importance of comprehensive monitoring and assessment to the success of Everglades restoration. Beginning with a dedicated workshop in November 2001, National Academies committees have reviewed the development of MAP and the selection of appropriate and practical performance measures by RECOVER (NRC, 2003a, 2007, 2008, 2010). NRC (2008) concluded that “[t]he number of performance measures is not inherently problematic” but noted that “the set of performance measures should be reviewed regularly to determine whether . . . adequate data collection for each could be sustained over the course of the restoration.” NRC (2010, 2012) called for a comprehensive review process to update the systemwide monitoring program based on new information and lessons learned from the monitoring program to date; changing ecosystem conditions, including climate change; and changing budget conditions for RECOVER and other agencies that supply systemwide monitoring in support of the CERP.
RECOVER’s 5-Year Plan includes an update of the Systemwide Monitoring Plan. Although a full review of the current MAP was not feasible during this study cycle, the committee received several briefings on the systemwide monitoring program (see Figure 4-2) and discussed the challenges to developing a cost-effective systemwide monitoring program with staff from other large ecosystem restoration programs. Key lessons are offered here to inform RECOVER’s upcoming review.
Value of Adaptive Monitoring
For the Everglades, a large systemwide monitoring data set now exists that is available to inform the future path of restoration, but to derive the most value from monitoring investments, it is important to ask whether the systemwide monitoring plan addresses the most critical program needs going forward. Several environmental restoration projects have moved toward monitoring approaches that emphasize adaptation as new knowledge emerges about how the ecosystem operates and how new challenges impact the restoration effort—known as adaptive monitoring (Lindenmayer and Likens, 2009). Adaptive monitoring approaches can incorporate new technologies (e.g., drones, sensors, or satellite
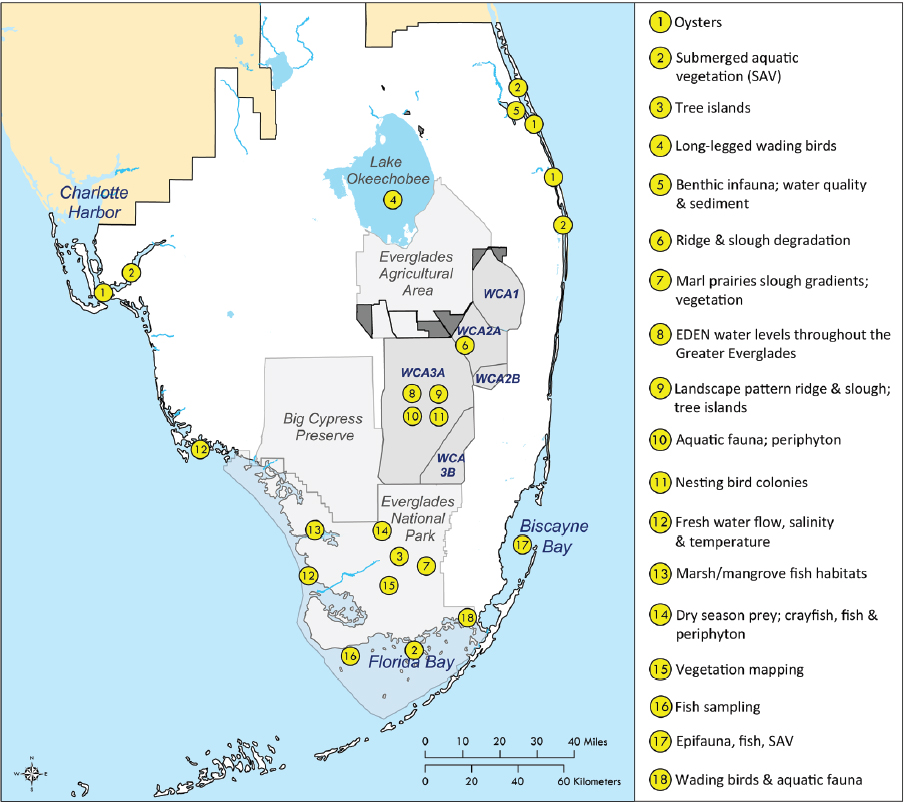
SOURCE: Adapted from A. Patterson, USACE, personal communication, 2017.
imaging technology) and analysis strategies to improve efficiencies, but more importantly, to maintain the relevancy of the monitoring program to management. Periodically revisiting a monitoring program provides the ability to incorporate emerging stressors that may severely impact the probability of restoration success, such as changing precipitation patterns, regional invasive species, or sea-level rise, which may not have been apparent when the monitoring pro-
gram was initially developed. Adaptive monitoring strategies can also be used to update the statistical designs of monitoring plans to provide information that meets the desired certainty for decision makers. The value of the data produced to date and the expected value of future data to address program needs moving forward are periodically reviewed to ensure that they continue to provide maximum value, in terms of information, to the decision-making process.
Process Considerations for a Monitoring Review
Given the considerable investment in monitoring that typically occurs at the beginning of a restoration effort, it can be difficult to accommodate change and flexibility as the restoration program matures. Fortunately, several programs have tried different approaches to adapting their monitoring programs to evolving needs and can offer lessons learned as the CERP looks to the near future (2019) when a review of its systemwide monitoring programs is scheduled to begin.
Because of current funding realities in some programs, which include delayed budget processes and frequent last-minute appropriations, a ranked priorities map for monitoring elements based on collective scientific and decision-making input has proven to be extremely valuable. For example, a comprehensive review of Chesapeake Bay’s monitoring was initiated in 2009, which was the first in more than 20 years. The review revealed a significant disconnect between the program objectives and the monitoring investments. Although monitoring of Bay conditions had intensified over time, critical information on the effectiveness of management actions in the watershed had not been compiled. Because the monitoring budget was kept stable, monitoring had to be realigned between Bay and watershed efforts to respond to the decision-making needs. To do this, a specific ranking of priorities for funding/de-funding had to be agreed upon; the strength of the process used to do so is reflected in the fact that the funding/de-funding map has remained in use for 9 years and is only now being revisited (Chesapeake Bay Program, 2009).
The committee sought input from three environmental restoration monitoring programs (Chesapeake Bay, San Francisco-Bay-Delta, and Albemarle-Pamlico Sound) about their experiences with adaptive monitoring. Their processes included three important common elements:
- A formalized commitment to periodically review the effectiveness of the monitoring program and make adjustments,
- The presence of independent experts in some capacity, and
- Inclusion of both key stakeholders (e.g. decision makers, managers, modelers) and monitoring experts at the table.
The programs addressed these elements in various ways. The commitment to periodic reviews ranged from formal presence in regulatory orders to internally motivated requests. The use of independent experts ranged from external monitoring review by an independent science advisory board to provide broad guidance for monitoring revisions to inclusion of outside experts in the monitoring review process. The stakeholders involved also varied by program. Because modeling is a critical tool in the Chesapeake Bay restoration and monitoring supports model refinement, modelers were important participants in the process. In addition, because states are responsible for restoration implementation, state resource managers were critical partners. The inclusion of stakeholders in the monitoring review also assisted identification of potential monitoring partners; the Chesapeake Bay review identified more than 200 monitoring efforts that could be integrated into the program to eliminate redundant efforts, resulting in significant cost reductions.
Ultimately, the conversation that must take place is between decision makers and monitoring experts, and it may be iterative in nature. Stakeholders will need to identify the monitoring information that will best address their immediate decision-making needs and articulate their risk tolerance. Monitoring experts will need to respond with a range of options (both data types and statistical designs) for meeting those needs, along with the uncertainty that each poses. Stakeholders will then have to determine the appropriate balance between the cost and value of monitoring information given the available options.
Overall, representatives from each of these large restoration programs judged the process of reviewing the monitoring programs to be of significant value. The benefits included ensuring that monitoring can address emerging uncertainties, eliminating redundancies, and offering an informed funding map for future monitoring. Commitment to such a process avoids the unintended drift in large monitoring programs that results in a growing deficiency of information for relevant decision making.
CONCLUSIONS AND RECOMMENDATIONS
Monitoring is essential to assess the effectiveness of ecosystem restoration efforts (i.e., what was the response?) and support adaptive management (i.e., if the expected outcomes did not occur, why not?). The collection and assessment of monitoring data are necessary to communicate the outcomes of restoration efforts to decision makers and the public, support learning from the restoration outcomes, and guide decisions about future changes that may be needed. The committee’s conclusions and recommendations for monitoring were informed by a review of project-level monitoring for three early CERP
projects (Picayune Strand, Biscayne Bay Coastal Wetlands [Phase 1], and C-111 Spreader Canal Western) and of the CERP systemwide monitoring program. Although this and previous National Academies committees have recommended improvements in CERP-associated monitoring programs, this does not necessarily mean that additional funding for monitoring is required. There are many ways to improve both the efficiency and the effectiveness of the CERP monitoring program within the existing monitoring budget.
The three CERP projects analyzed vary in the extent to which they have implemented effective monitoring plans. The RECOVER 2006 Assessment Strategy for the Monitoring and Assessment Plan provides valuable guidance on how to establish monitoring plans to detect change and evaluate progress toward goals. However, the three projects have not implemented this guidance systematically. For example, there is variation in whether quantitative restoration objectives are articulated. Not all projects have established a clear sampling design and data analysis plan as part of the monitoring plan, which could limit the usefulness of the results.
Quantitative restoration objectives, with accompanying expectations of how and when they will be achieved by management actions, should be developed for each project during the project development process. Quantitative objectives are needed to effectively measure restoration progress and operationalize goals. In addition, an acceptable level of variability of monitoring data around these objectives should be established so that management actions can be adjusted and adapted if the desired outcome is not being achieved. In the early stages of project development (i.e., before the monitoring plan is designed), project teams may be more comfortable with narrative objectives. However, it is essential to establish quantitative objectives as part of the monitoring plan with uncertainty described as appropriate. As programs evolve, more is learned about project functioning, and as knowledge and modeling tools improve, the quantitative objectives can be refined.
Monitoring plans should include an evaluation of the ability to detect restoration success given natural variability and sampling constraints. Models and historic monitoring data can be used to select metrics and design sampling plans to determine restoration success with a high degree of certainty, considering natural variability, expected changes from factors such as sea-level rise, and constraints such as site accessibility, funding, and personnel. These analyses should help to direct monitoring investments to where they will be most effective.
Modeling and statistical tools should be used in combination with monitoring data to assess restoration performance. External factors, such as precipitation and temperature variability, impact hydrologic and ecological responses, making it difficult to determine ecosystem response to restoration projects when
compared to baseline data. Where feasible, reference and control sites can be used to quantify project-related effects, but for most Everglades projects, well-characterized reference and control sites are not available. Additional tools, such as modeling and statistical analyses, are essential to help quantify the effects of the projects and to separate them from ongoing system variability and trends. Modeling tools can be used to separate the effects of other long-term changes, such as sea-level rise or invasive species, on project performance as well as to understand the effects of an individual project within a region that is affected by multiple, interacting projects. Although the CERP has a strong modeling program for project planning, models are rarely used to interpret monitoring data, greatly reducing the potential value of existing data. When numerical or statistical models are to be used in performance assessment, the data analysis plan should be identified before the data are collected to reduce bias in the assessment.
Project-level monitoring should be revisited periodically to ensure that sampling designs and data-analysis plans are effective and efficient and that monitoring investments yield useful information. Periodic reviews would include assessing the usefulness of the monitoring data to meet decision-making needs and the relevance of the selected indicators to the questions being asked. Other considerations include the validity of the conceptual model, the timing and rate of ecosystem response relative to sampling intervals, the adequacy of the spatial scale of monitoring considering the scale of anticipated response, and the use of rigorous computational or statistical tools for data analysis. Such reevaluation should lead to more effective and efficient performance monitoring and will strengthen the capacity to learn through adaptive management.
The full implementation of adaptive management plans will substantially increase learning about the restoration process. Adaptive management allows learning to take place as new knowledge is gained about ecosystem response to restoration and how changing future conditions (e.g., climate change, sea-level rise) might affect restoration outcomes. Only one of the three CERP projects analyzed (Biscayne Bay Coastal Wetlands) has an established adaptive management plan. Without an adaptive management plan, it is difficult to structure monitoring and evaluation so that new knowledge can be applied in a flexible decision-making process. Performance monitoring may show that project objectives are not being met, but performance monitoring alone cannot explain the reasons for failure or inform restoration decisions. Learning through monitoring is also limited by the lack of integration of modeling with monitoring, which can aid in setting quantitative objectives and projecting reference conditions. Monitoring plans for adaptive management should evaluate whether the restoration project is expected to result in measurable change with high certainty for adaptive management indicators and over what time frame.
The CERP program currently lacks a mechanism for multiagency assessment and reporting of project-level monitoring results. The RECOVER System Status Reports (SSRs) provide comprehensive multiagency analysis and synthesis of systemwide monitoring and assessment of trends, but they do not provide analysis and assessments of individual project performance. Currently, most reporting of project-level monitoring data occurs via the South Florida Environmental Reports (SFERs), which annually compile the data associated with permit monitoring. However, these reports contain limited analysis of long-term trends, project performance relative to expected objectives, and potential adaptive management needs. Additionally, the SFERs do not provide the opportunity for multiagency perspectives or RECOVER input. A variety of other reports, many by contractors, also provide sometimes fragmented summaries of data from monitoring but information on overall project performance relative to objectives remains lacking. A better-organized, multiagency analysis and assessment of project performance based on monitoring results should be developed to provide transparency to decision makers, funders, and stakeholders. This effort will also help support project-level adaptive management efforts.
The upcoming RECOVER review of its systemwide monitoring plan should be embraced as an opportunity to improve its effectiveness and efficiency. Many of the same issues addressed in project-level monitoring, such as the ability of the sampling plan to address the key questions and the availability of data to allow adaptation of management actions if the desired outcomes are not being achieved, are evident in current approaches to systemwide monitoring. The monitoring review, scheduled to begin in 2019, should also consider the relevance and usefulness of indicators, statistical rigor of the assessment, use of modeling for data analysis, and the appropriateness of the spatial and temporal sampling design to ensure that the investments in monitoring are being made toward data that can inform assessments and decision making. Scientists should understand and incorporate the needs of decision makers into the monitoring program. Similarly, decision makers should understand what information scientists can and cannot provide. This will require an iterative two-way dialogue between managers and scientists covering such issues as risk tolerance or aversion, what amount of confidence in data summaries is acceptable and possible, which indicators are most important and feasible to monitor, what decisions the information will be used for, and what information is of most scientific value for specific decisions. The process by which monitoring reviews are performed requires a thoughtful and intentional approach, such as the inclusion of stakeholders, modelers, and independent monitoring experts in the review process. Periodic systemwide reviews of monitoring should be incorporated into the work plan of RECOVER so that the monitoring program remains effective and appropriate in the years ahead.


