
3
Metrics for the Catskill Turbidity Control Program
As part of its statement of task, the Committee was asked to evaluate the performance measures the City uses to assess the efficacy of the Catskill Turbidity Control Program and to make recommendations for additional performance measures, if necessary. The Catskill Turbidity Control Program is a collection of activities that has evolved over the years subsequent to the completion of the Catskill Turbidity Control Study (see Box 1-1). These activities fall generally into one of three categories: (1) turbidity source control measures within the Schoharie and Ashokan reservoirs’ watersheds; (2) improvements to infrastructure, most notably along the Catskill Aqueduct; and (3) operational changes, some of which are facilitated by the Operations Support Tool (OST), the development of which was a major product of the Catskill Turbidity Control Study.
The Committee’s interpretation of this task is that stakeholders want to know how to determine whether the collection of activities undertaken to reduce turbidity loading to Kensico Reservoir are working. This chapter suggests how the New York City Department of Environmental Protection (NYC DEP) can provide evidence that this is indeed the case. It begins with a very brief overview of the Catskill Turbidity Control Study, describing the major conclusions of that study and the subsequent changes to operations and infrastructure that the study recommended. This is followed by a discussion of how the sources of turbidity in the Catskill system are currently managed by both infrastructure and operational strategies that make up the Catskill Turbidity Control Program as it exists today. The chapter ends with discussion of how to demonstrate, in a cumulative fashion, whether
the many activities of the program are reducing the turbidity loading to Kensico Reservoir.
BACKGROUND
Turbidity is a measure of the amount of incident visible light scattered by particles in water and is expressed in nephelometric turbidity units (NTU) when measured using standard methods. The acceptable level of turbidity in drinking water supplied to consumers is specified by federal and state regulations; as mentioned in Chapter 1, the maximum allowed level for unfiltered surface water supplies is 5 NTU, which, in the case of the Catskill/Delaware portion of the New York City supply, is measured at the outflow from Kensico Reservoir. Because drinking water regulations consider turbidity to be an effective surrogate for the presence of harmful particulate contaminants such as pathogenic microorganisms like Cryptosporidium, providing low-turbidity drinking water is an important component of public health protection.
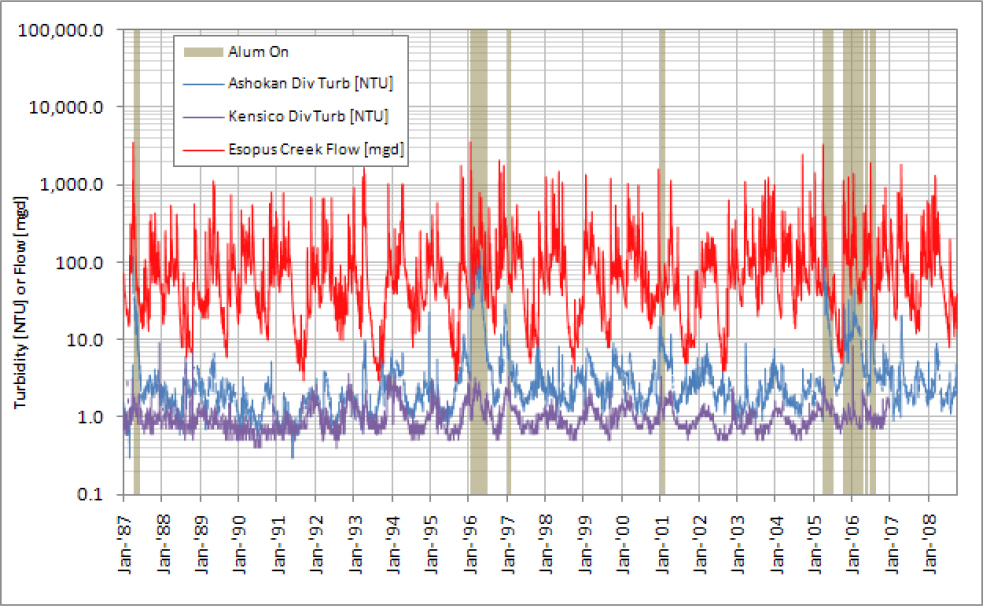
Turbidity has always been a significant issue in the Catskill portion of the New York City water supply because of the glacial lake clays that are pervasive throughout the eastern Catskills. Storms result in periodic high flows that can cause in-stream turbidity to spike. To control this turbidity, the Catskill system was designed to allow for settling within Schoharie Reservoir, both sides of Ashokan Reservoir, and the upper reaches of Kensico Reservoir. Historically, this large settling capacity has generally been adequate to manage turbidity loadings (see Figure 3-1). However, following extreme storm events the capacities of the reservoirs can be overwhelmed, such that the City needs to use chemical treatment with alum to control high turbidity levels. Alum can be added to the Catskill Aqueduct just prior to Kensico Reservoir, where precipitated aluminum hydroxide and aggregated clay particles then settle. This was the state of affairs prior to and during the course of the Catskill Turbidity Control Study.
The NYC DEP has installed and supports an extensive turbidity monitoring program that includes grab samples and automatic monitors located throughout the Catskill and Delaware systems and within and upstream of Kensico Reservoir. Much of these data are available in near real-time for operational purposes aimed at turbidity control, whereas other data sets are collected on various set schedules and intended to support a higher level of understanding and analysis of the turbidity response to hydrologic events. Examples of the former include real-time turbidity monitors at the Kensico Reservoir inflows and outflow (the major compliance point for the Surface Water Treatment Rule) and within the Catskill aqueduct where alum addition occurs. Examples of the latter include routine monthly turbidity profiles within reservoirs along longitudinal tracks between inlet and outlet.
For potential use as inputs to turbidity performance metrics, telemetered “real-time” data are of greater interest than periodic manual samples because the latter are lower frequency and thus unlikely to provide good resolution of the turbidity response to hydrologic forcing events. Table 3-1 lists the locations of real-time turbidity monitors within the Catskill system, and at Kensico Reservoir, that could be leveraged for development of turbidity performance metrics. (Significant additional monitoring is performed within the Delaware system, which is not shown.) The monitors are either fixed depth or have an automated depth profiling capability. Profiling monitors collect a complete vertical profile at 1-ft resolution every three to six hours, while fixed-depth monitors record data at a higher frequency, from one to 15 minutes. For Ashokan and Kensico reservoirs, the existing monitoring infrastructure allows complete input–output monitoring of turbidity
TABLE 3-1 Real-Time Turbidity Monitors Within the Catskill System
| Monitor Location | Type |
|---|---|
| Schoharie | |
| Schoharie Reservoir at Shandaken Tunnel intake | Profiler |
| Shandaken Tunnel diversion | Fixed |
| Shandaken Tunnel diversion at discharge to Esopus | Fixed |
| Ashokan | |
| Esopus Creek at Allaben above the Shandaken Tunnel discharge | Fixed |
| Esopus Creek at Coldbrook below the Shandaken Tunnel discharge | Fixed |
| West Ashokan Reservoir significantly upstream of Catskill Aqueduct headworks | Profiler |
| West Ashokan Reservoir near Catskill Aqueduct headworks | Profiler |
| East Ashokan Reservoir near Catskill Aqueduct headworks | Profiler |
| Catskill Aqueduct diversion | Fixed |
| Kensico | |
| Catskill Aqueduct diversion at Catalum | Fixed |
| Delaware Aqueduct diversion at Shaft 17 | Fixed |
| Above West Branch Reservoir at Shaft 9 | Fixed |
| Between outlet works and Catskill Aqueduct inflow | Profiler |
| Between outlet works and Delaware Aqueduct inflow | Profiler |
| Near outlet works (5-m depth) | Fixed |
| Near outlet works (10-m depth) | Fixed |
| Near outlet works (15-m depth) | Fixed |
| Outlet | Fixed |
loads, in near real-time, along with monitoring at various depths within the reservoirs. The real-time turbidity monitor of Schoharie Creek at Prattville was irreparably damaged during Hurricane Irene, but NYC DEP intends to replace that turbidity monitor, which measures a key input to Schoharie Reservoir.
Data from the monitoring program are compared to a variety of metrics that are motivated by regulatory compliance with turbidity limits at permitted locations. For example, NYC DEP measures daily turbidity loading to Kensico Reservoir from the Catskill Aqueduct, with statistics on the frequency (e.g., number of days each year) of excursions beyond a threshold determined to represent a risk for elevated Kensico outlet turbidity. Time series of alum addition expressed as a mass rate or loading (concentration × discharge) and yearly loading totals are other common metrics. Adherence to the Ashokan Interim Release Protocol (IRP) requires such measures as reservoir levels (to determine available storage capacity), Ashokan release turbidity and discharge, and Esopus Creek turbidity flowing into Ashokan West Basin. Compliance with the limits of the Shandaken Tunnel discharge State Pollutant Discharge Elimination System (SPDES) permit can be demonstrated by analyzing data on (1) daily average and maximum Esopus Creek turbidity upstream of the tunnel discharge (at Allaben), (2) daily average and maximum Shandaken Tunnel turbidity, and (3) Esopus Creek daily average flow downstream of the tunnel discharge (at Coldbrook). While the Committee supports the continued use of all these metrics, they are not the subject of this chapter and hence are not discussed further.
CATSKILL TURBIDITY CONTROL STUDY
As mentioned in Chapter 1, several sequential filtration avoidance determinations (particularly in 2002 and 2007) identified turbidity in the Catskill system as a water quality concern and required NYC DEP to develop a plan to reduce turbidity in Schoharie and Ashokan Reservoirs. NYC DEP’s response to this requirement became known as the Catskill Turbidity Control Study. The primary goal of the Catskill Turbidity Control Study was to identify feasible, effective, and cost-effective interim and long-term measures for reducing peak turbidity levels entering Kensico Reservoir from the Catskill Aqueduct, thereby reducing the need for treatment of the Catskill Aqueduct water with alum. The study was conducted in three major phases from 2002 to 2009, with Phase I providing a screening-level evaluation of potential turbidity control options and Phase II and Phase III focusing on engineering alternatives, preliminary design, and modeling of Schoharie and Ashokan alternatives, respectively.
Phase I, completed in December 2004, reviewed historical water quality and physical data for Schoharie Reservoir and the Shandaken Tunnel
diversions, reviewed state and federal regulatory programs affecting these facilities, and provided a screening-level evaluation of the feasibility of six alternatives for potentially improving water quality in the Catskill system (NYC DEP, 2004). The alternatives were: (1) construction of a multilevel intake in Schoharie Reservoir to allow selective withdrawal of water from strata with preferred temperature and turbidity levels; (2) placement of an in-reservoir turbidity curtain to reduce short-circuiting of Schoharie Creek inflows, increase travel time, and improve settling; (3) placement of an in-reservoir baffle; (4) modifications to Schoharie Reservoir’s operating policy; (5) construction of engineered treatment (coagulation, flocculation, and settling) facilities; and (6) turbidity removal options downstream at Ashokan Reservoir. Options 1, 2, 4, and 6 were selected for further study, with 3 and 5 eliminated due to low feasibility and effectiveness.
Phase II of the Catskill Turbidity Control Study, completed in September 2006, involved the development of conceptual designs and performance evaluation for three alternatives: (1) a multilevel intake in Schoharie Reservoir, (2) an impermeable baffle curtain in Schoharie Reservoir, and (3) modification of Schoharie Reservoir operations (NYC DEP, 2006a). A critical part of alternative 3 was the development of a systemwide Operations Support Tool (OST) that would probabilistically simulate conditions in the water supply system and provide output to inform operators as they make decisions on reservoir releases and diversions to balance water supply, water quality, and environmental objectives. The Implementation Plan subsequent to the Phase II study (NYC DEP, 2006b) recommended implementation of modified operating rules at Schoharie Reservoir supported by the development of OST (alternative 3).
Phase III, completed in December 2007, proposed six engineering and structural alternatives at Ashokan Reservoir to reduce turbidity levels entering the Catskill Aqueduct: (1) construction of a new West Basin outlet structure; (2) installation of dividing weir crest gates; (3) improvement to the East Basin diversion wall; (4) upper gate chamber modifications; (5) construction of a new East Basin multilevel intake; and (6) improvements to the Catskill Aqueduct in combination with modified operations (NYC DEP, 2007). The implementation plan submitted subsequent to the study recommended (1) modifications to the operating rules at Ashokan Reservoir (supported by OST development) by (a) drawing down the West Basin during low-turbidity periods and (b) operating the Ashokan Release Channel to redirect turbid water; and (2) improvements to the Catskill Aqueduct, including its interconnection to the Delaware Aqueduct at Shaft 4 and stop shutters (NYC DEP, 2008).
Subsequent studies followed on the heels of the Catskill Turbidity Control Study, including a Turbidity Control Alternatives Analysis (NYC DEP, 2011). This modeling analysis using OST examined (1) operation of
the Ashokan Release Channel, (2) routine deployment of Catskill Aqueduct stop shutters, and (3) operation of the Shaft 4 interconnection, and evaluated their performance based on simulated daily turbidity levels in diversions from Ashokan and Kensico reservoirs, the frequency and duration of alum treatment, and the mass of alum used during treatment events. The modeling results indicated that these alternatives could significantly reduce the expected frequency and duration of alum treatment. NYC DEP (2014) reviewed the prior results from Phases I, II, and III and presented OST simulations of how the various alternatives from the Catskill Turbidity Control Study would affect daily turbidity, solids loading, and temperature at various locations in the Catskill system. The final alternatives that were implemented as a result of the Catskill Turbidity Control Study were (1) stop-shutter improvements along the Catskill Aqueduct; (2) the Shaft 4 interconnection; (3) modified operations, including using the existing Ashokan release capacity for snowpack management and during turbidity events and increasing diversions from the West Basin to develop a larger void and retain turbid inflows; and (4) development of OST.
CATSKILL TURBIDITY CONTROL PROGRAM
Since completion of the Catskill Turbidity Control Study, the NYC DEP has continued its emphasis on controlling turbidity in the Catskill System through a variety of actions collectively called the Catskill Turbidity Control Program. As turbidity moves from the upland reaches of the watershed to the reservoirs and into the water supply, it is affected by a complex set of hydrologic, meteorologic, and geomorphologic conditions, in combination with operational decisions about releases and diversions from the Schoharie, Ashokan, and Kensico reservoirs. Starting at the top of the system, turbidity inputs into Schoharie Reservoir are derived entirely from its 316-square-mile watershed. Some settling occurs in the reservoir, helping to reduce turbidity levels in the Schoharie diversion. The Catskill Turbidity Control Study considered the usefulness of a multilevel intake at Schoharie to be able to choose the depth at which water is diverted to the Shandaken Tunnel. However, because the reservoir is small compared to the size of the drainage basin, during large storms high-turbidity inflows co-mingle with water at all depths in the reservoir, such that there are no good depths from which to divert water. As a result, the activity was abandoned. The intake structure at Schoharie is the original 80-year-old equipment, although a major rehabilitation is planned.
Turbidity inputs to the West Basin of Ashokan Reservoir are derived from the Schoharie diversion (via the Shandaken Tunnel and subsequently the Upper Esopus Creek) and from runoff within the Upper Esopus drainage basin. The latter has been shown to be the dominant Ashokan turbidity
input (Warne, 2004, pp. 9–11), partly because the SPDES permit governing the Schoharie diversion limits the amount of turbidity that can be diverted. That is, turbidity in the diversion cannot exceed that in the Esopus Creek just upstream of the diversion by more than 15 NTU and it cannot be more than 100 NTU (except in extreme situations). When the Schoharie diversion is reduced or eliminated, the turbidity loading to Ashokan mimics that which would have resulted from the natural hydrology of the Esopus Basin. It should be noted that the NYC DEP runs a Stream Management Program to help reduce turbidity loadings to the tributaries of the Esopus Creek and hence to Ashokan Reservoir. However, because this program is going to be evaluated during a subsequent National Academies review of the entire Watershed Protection Program, this report does not discuss evaluation of this aspect of the Catskill Turbidity Control Program.
Once turbidity reaches the Ashokan West Basin, there are a number of options to prevent that turbidity from reaching Kensico Reservoir, some of which emerged from the Catskill Turbidity Control Study and are now part of the Catskill Turbidity Control Program. For example, modified operations can create increased capacity within the West Basin, which can be used to store highly turbid inputs from Esopus Creek and allow those particles to settle. Additional capacity in either basin can be gained by releasing water prior to the inputs of high-turbidity water from the West or East basins to the Lower Esopus Creek through the Ashokan Release Channel, which is now regulated by the Interim Release Protocol (see Chapter 4).
Another operational strategy evaluated during the Catskill Turbidity Control Study that is now an integral part of the Catskill Turbidity Control Program is to lower the magnitude of the Ashokan diversion and temporarily satisfy potable water demand with Kensico storage or water from the Delaware or Croton systems. In the past, this approach was difficult to implement because downstream withdrawals from the Catskill Aqueduct placed a minimum requirement on flow in that aqueduct of approximately 275 MGD; flows below that target would run the risk of denying withdrawals to 15 utilities that supply dozens of small communities along the Catskill Aqueduct, which is considered to be a hard constraint on operations. However, the installation of new stop shutters within the Catskill Aqueduct at six locations will now allow a further reduction in the Catskill Aqueduct flow to 25 MGD without affecting the ability of the small communities to withdraw water. Further flexibility will be afforded by the Shaft 4 interconnection between the Catskill and Delaware aqueducts, which will allow flow from the Delaware system to reach Kensico via the Catskill Aqueduct. This interconnection will occur west of the Hudson River upstream of most of the stop shutters and many of the community connections. It is hoped that the Catskill Aqueduct improvements along with modified operations will minimize or even eliminate the need to use
alum to control turbidity in the Catskill Aqueduct. A turbidity loading of 5,000 NTU-MGD1 is the operational threshold above which alum addition will be used in order to maintain turbidity in the Kensico diversion at less than 5 NTU.
For the purposes of this report, and with the concurrence of the NYC DEP, the Committee considered the following activities to be part of the Catskill Turbidity Control Program: (1) infrastructure improvements such as the Shaft 4 interconnection, the rehabilitation of the Schoharie intake, and the Catskill Aqueduct stop shutters; and (2) operational changes, enabled by the development and use of OST. The overall goal of the program is to reduce the turbidity loading to Kensico Reservoir, with related goals of reducing alum use and meeting the Interim Release Protocol at the Ashokan Release Channel.
PERFORMANCE MEASURES
This section considers two complementary approaches for ongoing assessment of the Catskill Turbidity Control Program. The first approach, proposed by the NYC DEP, uses OST to simulate the hydrologic and water quality state that would have existed within the Catskill system had key program features not been implemented. By comparing this no-action result—what “may have been”—with measured water quality after completion of the Catskill Turbidity Control Program, this approach attempts to directly quantify the impact of program implementation. The second approach relies on data visualization and statistical analysis to expose trends in turbidity measurements that can be attributed to implementation of Catskill Turbidity Control Program features or operational protocols. Specific examples of this data analysis approach are provided in the following section, with the more general goal being ongoing exploration and analysis of the substantial data resources of the NYC DEP.
NYC DEP’s Scenario Approach
In late 2010, after the completion of the Catskill Turbidity Control Study, the New York State Department of Health, which oversees the City’s filtration avoidance determination, requested that NYC DEP provide “performance measures/criteria that can be used to evaluate the efficacy of the
___________________
1 The concept of a turbidity loading is meant to reflect the amount of turbidity-generating particles being added over an interval of time, reflecting the volumetric rate of flow (MGD) and the turbidity (NTU). So, a turbidity loading of 5,000 NTU-MGD over one day could be achieved by a turbidity of 5 NTU and flow rate of 1,000 MGD, or by a turbidity of 100 NTU and flow rate of 50 MGD.
Catskill Turbidity Control Program once fully implemented.” In response, in March 2011 NYC DEP stated that it would begin a process-based approach to performance measures. This process-based approach would be developed to “compare actual operations and water quality over specified periods of time to a ‘no-action’ scenario for the corresponding period” (Warne, 2011). The letter went on to note:
The no-action scenario will be a model projection of water quality if none of the implementation measures were available and water supply decisions followed historic operational procedures. A comparison of the two scenarios will provide a comprehensive look at the efficacy of the Catskill Turbidity Control Program under a variety of real-life conditions. The difference in the annual turbidity load to Kensico Reservoir between the two scenarios could also be a useful metric in addition to the time series scenarios.
OST would be used to produce modeled turbidity values under the no-action scenario. In other words, NYC DEP proposed that actual turbidity following implementation of the various components of the Catskill Turbidity Control Program could be compared to OST-modeled turbidity levels projected to occur if the program had not been implemented. If post-implementation turbidity values were lower than pre-implementation values, then the Catskill Turbidity Control Program would be deemed successful. The Committee is not aware of any plans to implement such a comparison.
The use of OST to simulate performance of no-action baseline operations is a logical step, and a natural leveraging of the resources put toward development and calibration of hydrologic and water quality models. OST has the capability to simulate this baseline, as all elements of the Catskill Turbidity Control Program are encoded within OST and can be flexibly configured using existing capabilities of the OASIS model. It is important to differentiate this approach from what was done during the Catskill Turbidity Control Study, in which OST was run with and without infrastructure improvements and certain system operations in order to evaluate the effectiveness of those measures (e.g., Weiss et al., 2013). For the approach here, only the no-action scenario is simulated by OST; the action scenario would use real water quality data and real operations.
The degree to which operators, managers, and outside stakeholders would believe the results of this analysis depends on whether OST has been adequately validated. The validation of OST, in the context of the Catskill Turbidity Control Program performance assessment, should test the ability of OST to accurately simulate observed hydrological and water quality states under a wide variety of actual operational and boundary condi-
tions. For this type of validation, the model would be driven by measured inflows and measured turbidity. Similarly, the substantial OST machinery that suggests reservoir operational decisions would be replaced by the actual series of daily operational decisions implemented by NYC DEP operators and managers. Comparison of the actual decisions made with the OST-simulated decisions could allow assessment of the relative alignment of the internal OASIS weighting algorithms with the judgments of the human experts that OST is intended to emulate. If OST were run with such severely truncated capabilities (actual inflows, diversions, releases, and inflow turbidity), it would act as a system simulation model of hydrologic and water quality behavior, intended to predict reservoir inflows, releases, diversions, and turbidity throughout the Catskills system. If OST used in this manner proves to accurately simulate, say, Kensico influent and diversion turbidity under a wide variety of inflows and operational actions, then that would lend confidence to its ability to simulate turbidity if different operational decisions had been made (specifically, those attributed to a no-action scenario).
It is important that NYC DEP not view model validation as a one-off project, but instead consider the need for a well-defined, continuous, and automated model validation process, so that operators, managers, and stakeholders build an understanding over time about OST’s strengths and weaknesses. Doing so would allow the model validation process to support not only the no-action scenario but also the ongoing evolution of OST and its embedded process models.
Data-Based Approaches
Beyond the performance measure suggested in the 2011 NYC DEP letter, one can glean additional possible performance measures from the Phase I, II, and III Catskill Turbidity Control Study reports and associated analyses. These include measured changes in turbidity levels in diversions from the reservoirs, the frequency and/or duration of alum treatment events, and mass of alum applied during treatment events. These metrics, especially the first one, are obviously very useful to the current program; if alum use is eventually eliminated, then the latter two metrics become obsolete. In general, the difficulties associated with any of these types of metrics is that they may be strongly influenced by the particular history of weather and hydrologic conditions that have taken place over the years being analyzed. It is likely that most of the variability in such metrics would be a function of these sources of natural variability. The engineered changes emanating from the Catskill Turbidity Control Program, even if highly effective, might only constitute a small fraction of the overall variability in these metrics, and thus conclusive evidence of the effectiveness of the engineered changes would be
difficult to develop. In statistical terms, we might conclude that the power of simple statistical tests for changes in turbidity below Kensico would be very limited. However, development of appropriate statistical analyses, which attempt to remove a large portion of the turbidity variability based on variations in input conditions, may be an effective way to evaluate the effectiveness of the program. Thoughtful data analysis that attempts to increase the signal-to-noise ratio can best be done through the use of statistics, whereby the analyst makes every effort to control for the sizeable natural variability of the system.
Some additional metrics that NYC DEP might consider to better understand how certain components of the program are working might include:
- Evaluation of the time series of turbidity measurements at various monitoring sites (various locations and depths) in Kensico Reservoir. These evaluations could include use of linear regression models (e.g., daily turbidity as a function of time or as a function of time and season) or nonparametric equivalents (e.g., Mann-Kendall, or Seasonal-Kendall, tests for trend).
- Statistical tests for the frequency of Kensico diversion turbidity exceeding various turbidity thresholds (e.g., levels such as 3 or 4 NTU). This can be done using a logistic regression model. Such models are similar to linear regression models except that in logistic regressions the dependent variable is not turbidity, but rather the logarithm of the annual frequency of exceeding the threshold divided by the frequency of not exceeding the threshold.
- Statistical analyses that are likely to be more powerful than these are ones that assess changes in the relationship between turbidity inputs (or surrogates for turbidity inputs) and turbidity outputs from any node in the system (particularly Ashokan Reservoir or Kensico Reservoir).
One way that an evaluation of the third type could be done is as an analysis of covariance (ANCOVA) (see Helsel and Hirsch, 2002, pp. 316–320). What might such an analysis look like? First, one would need a clear basis for defining two periods of time—before the Catskill Turbidity Control Program and after its implementation. In practice, this is not a simple matter because the program is the combination of many actions that may have gone into effect at different times. But, reasonable judgments can be made for defining these two periods, and there could be a period that is viewed as a transition and, as a consequence, data from that period would not be used in the analysis. Next, there needs to be an objective measure of a “turbidity event.” This might be a period, measured in days, during which the product of daily mean turbidity at the inflow point and daily
mean discharge exceeded some threshold value. This threshold should be set such that there might be two or three events (of duration of a day or more), on average, per year. There must also be a defined lag time; this would be the time in days between the center of mass of the turbidity input, and the day of maximum turbidity at the output point. Finally, there needs to be a time series of the maximum turbidity level (perhaps derived from an hourly record) at the compliance point associated with each turbidity event defined at the inflow point.
The model to be estimated might take the following form (or something similar):
log(Ti) = β0 + β1 · log(Xi) + β2 · Ci + εi
where:
The statistical test is conducted by fitting this model using linear regression, including checks for all the appropriate conditions for linear regression (such as linearity of relationship, homoscedastic residuals, and approximate normality of residuals). Graphically, this situation might look like Figure 3-2.
In Figure 3-2, the cross symbols are for events prior to the start of the Catskill Turbidity Control Program, and the solid circles are for events after the completion of the program. The horizontal axis is a measure of the mass of input to the reservoir system (measured as incoming water turbidity multiplied by discharge for each day in each turbidity event period) prior to the Catskill Turbidity Control Program. The vertical axis is the dependent variable, the resulting maximum turbidity at the compliance location. The
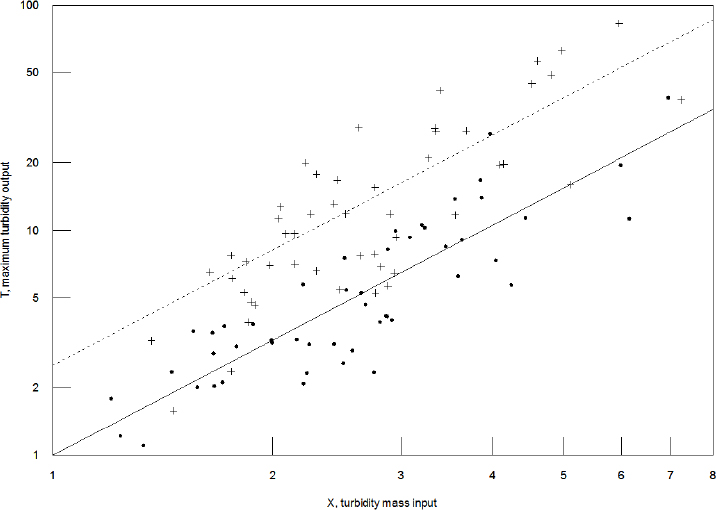
dashed line is the regression line for the relationship before the control program and the solid line is the relationship after the control program. The difference between the two lines is a measure of the successes of the control program.
There are many variations on this basic idea that can be tried. For example, one might formulate the appropriate dependent variable differently, such as using the alum addition for an event. This would be a very direct way to evaluate the benefits of the control program.
The primary point of this discussion is that it is an important aspect of program management and evaluation for the NYC DEP to be engaged on a regular basis in these types of assessments of the efficacy of their control measures. It is impossible to say, without actually doing such analysis, how likely it is that a statistically and practically significant result can be quantified. It is very much a function of the inherent variability of the system and uncertainty of the measurements and the right selection and calculation of the explanatory variables from the raw data. An example of when such techniques were applied to these issues in the New York City watersheds is found in Bishop et al. (2005).
In addition to the kind of formal statistical inference analyses discussed here, the Committee urges NYC DEP to consider using exploratory data analysis (EDA) techniques to describe the progress that the Catskill Turbidity Control Program is having at reducing turbidity loads in the system. EDA is an approach to statistical analysis originally developed by John Tukey and William Cleveland (see Cleveland, 1993). The goal of EDA is to simplify and summarize large and complex sets of data in order to identify important relationships and trends that may be taking place. One of the most common EDA techniques is the use of boxplots to describe one or more groups of samples from some larger population. Another EDA approach is to summarize time-series data using locally weighted scatterplot smoothing (LOWESS or sometimes called LOESS, see Cleveland, 1979; Cleveland and Devlin, 1988). Such depictions of the data provide an ability to capture gradual and sometimes subtle changes in the behavior of the system that will not typically be identified by linear regression. These EDA techniques are not restricted by assumptions that relationships between variables or trends necessarily follow a linear pattern. They provide a data-driven representation of relationships that can be very useful in describing change.
CONCLUSIONS AND RECOMMENDATIONS
The Catskill Turbidity Control Study, and now the Catskill Turbidity Control Program, have been crucial to the improvement of the New York City water supply to handle high turbidity events in the Catskill Systems. The Study led to the creation of OST and the Program has led to the building of critical infrastructure that has greatly increased the flexibility of the NYC DEP to operate the system under a wider range of conditions than in the past. The following suggestions are intended to help make the Catskill Turbidity Control Program more relevant and accountable into the future.
NYC DEP should be putting substantially more effort into ongoing assessment of the overall effectiveness of the Catskill Turbidity Control Program by conducting more data analyses. Metrics that should be evaluated on a continuing basis include (1) turbidity levels in diversions from the reservoirs and in aqueducts, (2) the frequency and/or duration of alum treatment events, and (3) mass of alum used during treatment events. The NYC DEP’s excellent network of data collection systems provides a strong basis for such evaluations. NYC DEP needs to take the next step of analyzing the data to improve understanding of the dynamics of the system, which may be helpful in improving existing control strategies, optimizing the data collection systems (learning what sensors give them the most important information), and demonstrating the effectiveness of the program.
Data analysis should start with exploratory data analysis to help the analyst understand the sources of variability in the data and then move beyond that with formal statistical modeling that attempts to characterize the deterministic and random components of the variability. The aim is ultimately to describe the nature of trends that may be happening due to the Catskill Turbidity Control Program. In particular, analysis of covariance is a useful statistical tool that can help quantify and test for differences between the period prior to the Catskill Turbidity Control Program and the period after the program was put in place. Such techniques are ideal for detecting step changes when the variable of interest (turbidity) is strongly driven by a random variable such as precipitation or discharge.
NYC DEP should move forward with its plan to “compare actual operations and water quality over specified periods of time to a no-action scenario for the corresponding period.” The no-action scenario would be generated by a configuration of OST that simulates system behavior in the absence of the infrastructure and OST improvements. Prior to this exercise, it will be important to establish the ability of OST to represent system performance by comparing its predictions of performance to what has actually occurred (see Chapter 2).
REFERENCES
Bishop, P. L., W. D. Hively, J. R. Stedinger, M. R. Rafferty, J. L. Lojpersberger, and J. A. Bloomfield. 2005. Multivariate Analysis of Paired Watershed Data to Evaluate Agricultural Best Management Effects on Stream Water Phosphorus. Journal of Environmental Quality 34: 1087–1101.
Cleveland, W. S. 1979. Robust Locally Weighted Regression and Smoothing Scatterplots. Journal of the American Statistical Association 74(368):829–836.
Cleveland, W. S. 1993. Visualizing Data. Summit, NJ: Hobart Press.
Cleveland, W. S., and S. J. Devlin. 1988. Locally-Weighted Regression: An Approach to Regression Analysis by Local Fitting. Journal of the American Statistical Association 83(403):596–610.
Helsel, D. R., and R. M. Hirsch. 2002. Statistical Methods in Water Resources. Chapter 3 in Techniques of Water Resources Investigations of the United States Geological Survey: Book 4, Hydrologic Analysis and Interpretation. Reston, VA: U.S. Geological Survey. https://pubs.usgs.gov/twri/twri4a3/pdf/twri4a3-new.pdf.
NYC DEP (New York City Department of Environmental Protection). 2004. CTCS Phase I Final Report. December 30.
NYC DEP. 2006a. CTCS Phase II Final Report. September 30.
NYC DEP. 2006b. Phase II Implementation Plan. Catskill Turbidity Control Studies. December 31.
NYC DEP. 2007. Phase III Final Report. Catskill Turbidity Control Study. December 31.
NYC DEP. 2008. Phase III Implementation Plan. Catskill Turbidity Control Study. July 31.
NYC DEP. 2011. Final Report: Turbidity Control Alternatives Analysis. February 28. Prepared by Hazen and Sawyer, New York, NY.
NYC DEP. 2014. Catskill Turbidity Control Alternatives Summary Report. July 15.
Warne, D. 2004. Phase 1 Final Report on the Catskill Turbidity Control Program. December 30. New York City Department of Environmental Protection
Warne, D. 2011. Letter to Roger Sokol, New York State Department of Health. March 1.
Weiss, W. J., G. W. Pyke, W. C. Becker, D. P. Sheer, R. K. Gelda, P. V. Rush, and T. L. Johnstone. 2013. Integrated water quality–water supply modeling to support long-term planning. Journal American Water Works Association 105(4):E217–E228.
This page intentionally left blank.


