
1
Introduction
1.1. WHY MEASURE THE ACTIVITIES OF FARMS AND FARMING?
Agriculture Is a Large and Important Sector of the Economy
America’s farms and farmers are integral to the U.S. economy and, more broadly, to the nation’s social and cultural fabric. A healthy agricultural sector helps ensure a safe and reliable food supply and improves energy security. It contributes to employment and economic development, traditionally in small towns and rural areas where farming serves as a nexus for related sectors from farm machinery manufacturing to food processing. And it contributes to the nation’s economic growth overall, providing crucial raw inputs for the production of a wide range of goods and services, including many that generate substantial export value.1
In 2015, farms directly contributed $136.7 billion to the U.S. economy, representing about 1 percent of gross domestic product (GDP).2 When one includes related sectors, such as forestry, fishing, tobacco products, textiles and apparel, and food service—which add value to raw farm outputs by using them as inputs in downstream production—the overall contribution
___________________
1 Agricultural exports for the United States reached an all-time record high of $152.3 billion in 2014. Due to a number of factors including lower commodity prices, that level has fallen in subsequent years (USDA, Economic Research Service, Outlook for Agricultural Trade, May 2016). See https://www.ers.usda.gov/webdocs/publications/35804/59487_us-trade-outlook-aes92.pdf?v=0.
2 See https://www.ers.usda.gov/data-products/ag-and-food-statistics-charting-the-essentials/ag-and-food-sectors-and-the-economy.aspx.
of the agriculture sector to the economy is considerably larger.3 The U.S. Department of Agriculture’s (USDA’s) Economic Research Service (ERS) estimated that, in 2015, “agriculture, food, and related industries” generated goods and services valued at $992 billion, a 5.5 percent share of the nation’s GDP. In terms of its contribution to employment, ERS estimated that, in 2015, 21.0 million full- and part-time jobs were related to the agriculture and food sectors—11.1 percent of total U.S. employment. Direct on-farm employment accounted for approximately 2.6 million of these jobs—1.4 percent of the total for the country.4
Agricultural Activities Have a Large Impact on the Nation’s Natural Resources
Farming and ranching activities occupy just over one-half of the 2.3 billion acres of land coverage in the United States (Nickerson and Borchers, 2012). The size of this footprint varies significantly by state and region, as illustrated by Figure 1.1. In some states, such as Iowa, Kansas, and Nebraska, natural lands have undergone a nearly complete conversion to agriculture, so that farmland makes up roughly 90 percent of all acreage in the state. In others, such as Alaska, Massachusetts, and Nevada, there has been much less conversion (farmland making up less than 10 percent in these three states). These alterations in land use have come with dramatic changes to wildlife habitats, water use, hydrology, water quality, and biodiversity. In addition to agriculture’s direct effect on these natural assets through land conversion, agricultural activities use more than 25 percent of all the surface water and 85 percent of all the groundwater withdrawn for human use in the United States.5 Agricultural activities also contribute about 25 percent of total greenhouse gas emissions in the country.6
Finally, agricultural activities are significant sources of water pollution. For example, agriculture is responsible for more than 90 percent of the loads in nearly 70 percent of nitrogen-impaired watersheds in the country, contributing to drinking water concerns, lost recreational opportunities, and aesthetic losses. For these reasons, it is essential to capture the contribution of farming when measuring the economic impacts of alternative conservation programs, the efficacy of policies designed to protect the
___________________
3 Defining the “farm” sector and the “agriculture” sector in unambiguous terms, and then factoring in how value-added processes link the two, is far from a trivial task. This task is undertaken in this report, most directly in Chapters 2 and 4.
4 See https://www.ers.usda.gov/data-products/ag-and-food-statistics-charting-the-essentials/ag-and-food-sectors-and-the-economy.aspx.
5 See https://water.usgs.gov/edu/wateruse-diagrams.html.
6 See https://www.epa.gov/ghgemissions/global-greenhouse-gas-emissions-data.
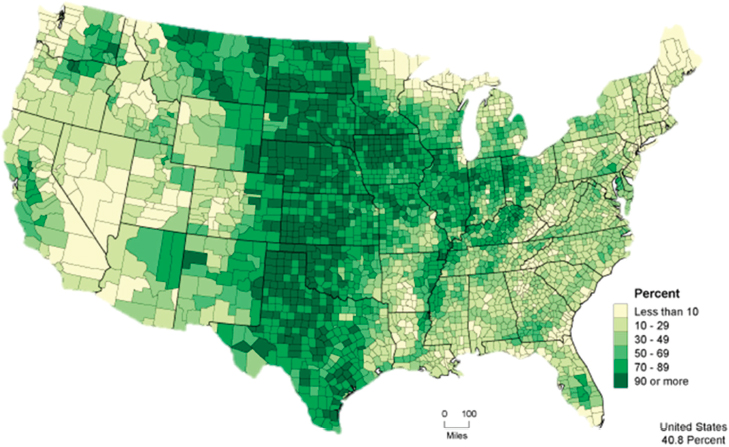
SOURCE: U.S. Department of Agriculture, National Agricultural Statistics Service. See https://www.agcensus.usda.gov/Publications/2007/Online_Highlights/Ag_Atlas_Maps/Farms/Land_in_Farms_and_Land_Use/07-M079.php.
environment, challenges related to climate change and water scarcity, and enhancements to agricultural competitiveness through technology.
The U.S. Government Allocates Substantial Financial Resources to the Sector
The U.S. government has provided income and conservation support to agricultural enterprises since the Great Depression, which motivated the Agricultural Act of 1933. A major objective of federal farm policy then was to increase and stabilize farm household incomes through price and income supports for selected program-covered crops and dairy. In farm bill programs enacted during the 1990s, annual land set-asides and government stockholding to raise farm prices were largely abandoned in favor of payments tied to historical production. A large portion of these payments flows to the largest 2.1 million farms in the United States (U.S. Department of Agriculture, 2014). Government subsidies are highest for grains, oilseeds, cotton, sugar, and dairy products. Most other farms—including those producing beef, pork, poultry, hay, fruits, tree nuts, and
vegetables, which together account for about one-half of the total value of production—receive only minimal government support.
Overall for the 2008–2012 period, the U.S. government spent $114 billion on 60 programs providing financial assistance to farmers. The largest farm payment programs administered by the USDA’s Farm Service Agency (FSA) are those providing subsidies for crop insurance and direct commodity payments. For the same period (2008–2012), the USDA reported spending about $28 billion on crop insurance subsidies to help farmers manage risks associated with losses in yield or revenue. The Congressional Budget Office (CBO) has projected that crop insurance subsidy program costs will rise to about $8.8 billion annually over the 2015–2024 period. The CBO further projects that farm commodity program costs will rise to about $4.2 billion annually for the same period.7
In addition to farm support payments, the federal government provides substantial financial resources to support conservation and environmental programs on farmland. The largest program is the Conservation Reserve Program, which has retired more than 37 million acres from cropland production at its peak. That program and others, including the Environmental Quality Incentive Program and the Conservation Stewardship Program, have provided more than $60 billion in recent years to enhance conservation.8
Data and Statistics about Agriculture Are Widely Used by the Public, by Researchers, and by Policy Makers
Economists have long argued that agricultural statistics are largely a public good. Bonnen (1977) points out how improving the quality of agricultural statistics can improve public policy through a better understanding of policies’ effects on society. Key users of the information produced by the National Agricultural Statistics Service (NASS) and ERS include the USDA and other government policy makers, Congress and the White House, program administrators and managers, federal statistical agencies (including for international reporting), state and local government officials, farm and industry groups interested in public policy issues (including nature conservation), and researchers. Publicly available data also contribute to the efficient operation of markets and are used by farmers, ranchers, and other businesses for planning and forecasting.
___________________
7 Congressional Research Service, Overview of Farm Safety Net Programs, CRS Report IF00025, In Focus, May 13, 2014; costs from CBO. The commodities covered under the FSA program are wheat, feed grains, rice, peanuts, soybeans, other oilseeds, dry peas, lentils, and chickpeas. For details, see https://www.gao.gov/assets/670/664671.pdf.
8 See https://ageconsearch.umn.edu/bitstream/174075/2/cmsarticle_374.pdf.
A wide range of research and policy questions drives the need for government-collected data on farms and farming. Beyond the value of agriculture statistics in creating a complete economic profile of the country, such as for the National Income and Product Accounts, their role is crucial in informing policy across a broad range of knowledge and activity. This includes policy on the environment, climate change, biodiversity, food security and safety, population health, land use planning, and natural resource management. As a nation, we care deeply about the safety and quality of our food supply and the health and environmental impacts of our production processes. These are the most important policy areas that agriculture data and statistics help inform. To maximize the value from investment in the nation’s statistical system, government has a responsibility to make publicly funded data collections as accessible and useful as possible to researchers, policy makers, and the public.
Some data programs are driven by legislative and regulatory requirements. U.S. farm policy typically follows a five-year legislative cycle that produces an omnibus “Farm Bill.” The Farm Bill—the most recent being the Agricultural Act of 2014—governs
programs related to farming, food and nutrition, and rural communities, as well as aspects of bioenergy and forestry [and] authorizes policies in the areas of commodity programs and crop insurance, conservation on agricultural lands, agricultural trade (including foreign food assistance), nutrition (primarily domestic food assistance), farm credit, rural economic development, agricultural research, State and private forestry, bioenergy, and horticulture and organic agriculture.9
Publicly available agricultural statistics are an essential element of good governance and are also essential to enhance competitiveness. Sound administration of government agricultural programs requires information on the uptake of support provided to farmers to guide the development and monitoring of farm business and farm household assistance packages.
Agricultural statistics also support market efficiency, providing information used in management, in research and development, and in the investment decisions made by farmers and other business owners. Data on agricultural production, yield, and prices affect commodity markets and support trading and distribution systems for agricultural products. There is a robust literature (e.g., Myers, Sexton, and Tomek, 2010; Adjemian, 2012; Karali, 2012; Mattos and Silviera, 2016; Sanginabadi, 2018) indicating that USDA reports can have a significant impact on commodity futures markets. Research by Isengildina-Massa, Karali, and Cao (2018) indicates that alter-
___________________
9 See https://www.ers.usda.gov/topics/farm-economy/farm-commodity-policy.
native data sources have a limited impact on the dependence of markets on USDA-published information. They find, for example, that “the largest impact [was] on the Crop Production reports released later in the growing season, when production was more directly measurable using satellite and precision agriculture tools such as combine yield monitors” (p. 21). Statistics on market prices and commodity stocks are also used by industry organizations to monitor demand and supply at local and national levels.
There are also reporting requirements that must be submitted to international regulatory bodies charged with monitoring global food stocks, chemical residues in food and feed commodities, and other food quality controls in order to maintain access to international markets. Statistics on export values and volumes may be used by governments to prioritize products and market access activities.
Much is known about productivity and productivity growth in the manufacturing and retail sectors that allows capital resources to be reallocated from low- to high-productivity activities. Similarly, in agriculture, market characteristics and trends must be measured to answer questions such as: Are the farms that are disappearing the least productive ones? Are farmers with superior methods and processes the ones surviving? How do production processes differ across operations? How is the health of rural economies affected by globalization and by more services being provided by far-away firms? How has the changing value chain of agricultural products affected the lives of farm families? The answers to these questions are not all well understood, but they can be improved upon by tapping into a rich vein of data linking together households, businesses, and land use so that successful businesses, and the characteristics of the individuals who run them, can be examined.
Farming Is a Rapidly Changing Enterprise
If the agricultural sector is to be accurately understood, and the policies that affect its functioning are to remain well informed, the statistical system’s data collection programs must be periodically revisited to ensure that they are keeping up with current realities. Perhaps the most obvious change in U.S. agriculture in recent decades has been large farms’ growth in number and in economic influence. As illustrated in Figure 1.2, in 2014, about 76,000 farms had sales of $1 million or more. These farms accounted for 57 percent of production, while another 128,000 midsize farms10 accounted
___________________
10 Midsize family farms are defined by ERS as those with a gross cash income of between $350,000 and $999,999.
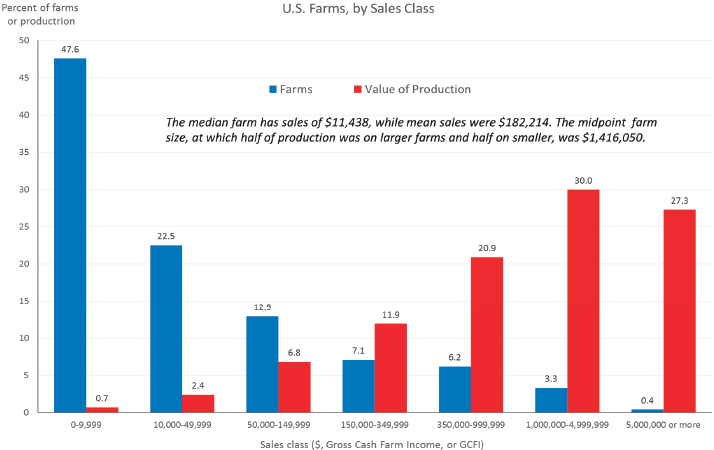
SOURCE: Presentation by James MacDonald and Kathleen Ott; using data from the U.S. Department of Agriculture’s Agricultural Resource Management Survey, 2014. Reprinted with permission.
for 21 percent of production and the remaining 1.87 million small farms11 accounted for only 22 percent of production. Indeed, many of these small farms are run by part-time producers who have off-farm jobs to supplement their income (or serve as their primary income) or to provide a source for health insurance.
These figures portray a markedly different picture than existed in the United States even 20 years ago. Figure 1.3 indicates the extent to which production has shifted from small farms to large farms over this period. The share of total production from small farms fell from 40 percent in 1996 to 22 percent in 2014, while the share from large farms rose from
___________________
11 USDA defines a farm as “any place from which $1,000 or more of agricultural products were produced and sold, or normally would have been sold, during the year.” Places without at least $1,000 in sales receive points based on their potential for sales. Places with at least $1,000 in sales and/or points are considered farms. (A farm with less than $1,000 of actual sales but with enough points to qualify is referred to as a point farm.) A “family farm” is a farm in which “the majority of the business is owned by the operator and individuals related to the operator by blood, marriage, or adoption, including relatives that do not live in the operator household.” Chapter 3 explores alternative definitions, some of which are adopted by statistical agencies outside of the United States.
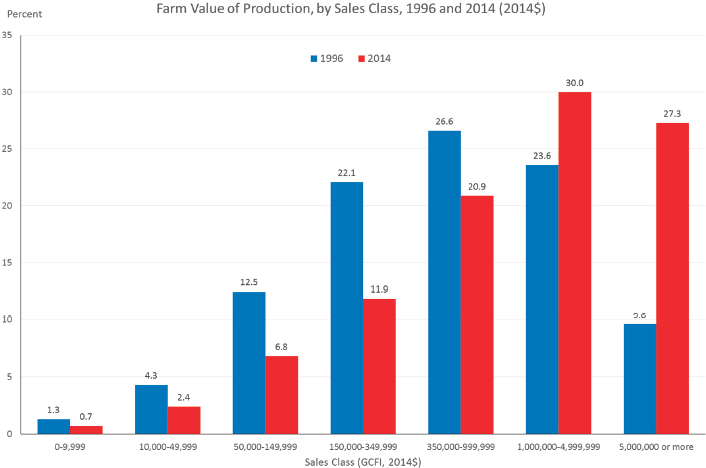
NOTE: Sales for 1996 adjusted to 2014 prices using Bureau of Labor Statistics Producer Price Index for Farm Products.
SOURCE: Presentation by James MacDonald and Kathleen Ott; using data from the U.S. Department of Agriculture’s Agricultural Resource Management Survey, 1996 and 2014.
33 to 57 percent. As production has become increasingly concentrated in a small number of large farms, farm operations have also become more complex.12 This report’s extensive focus on large vertically (and horizontally) integrated farms is motivated by the growing share of economic activity in the sector accounted for by such operations.
Because of the skewness in production, simple means and medians focused on average farm size present only a superficial and in some ways misleading portrait of American agriculture. This becomes evident, for example, in statistics on cropland acres: The number of midsize crop farms has declined sharply, while the number of farms at the large and small extremes has grown. As shown in Figure 1.4, the size of the average farm (in acres) has changed little over the past four decades or so, but large farms have gotten considerably larger. Simple means and medians focus on
___________________
12 At the other end of the size spectrum, increasingly specialized farms have emerged that are smaller, more dispersed, and more transient than traditional farms. Some specialized farms emphasize a single product in traditional rural locations; others are emerging in less traditional locations, such as high-tech, vertical operations (often indoor) in urban areas.
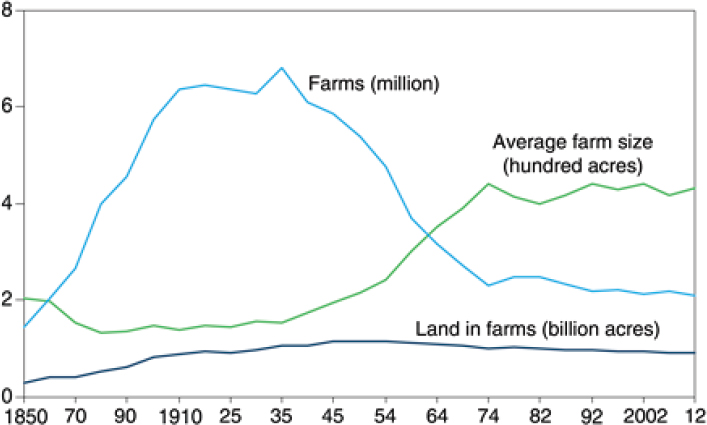
SOURCE: U.S. Department of Agriculture’s Economic Research Service, using data from National Agricultural Statistics Service’s Census of Agriculture. See https://www.ers.usda.gov/data-products/ag-and-food-statistics-charting-the-essentials/farming-and-farm-income.
the average farm, but relatively few cropland acres reside on average-size farms.13 Likewise, given the wide array of statistical measures of mean and standard deviation, some measures are more appropriate than others for reporting farm household income and wealth and communicating trends effectively.
The historical change in farm size can also be represented by the distribution of farmland. Figure 1.5 tracks the “midpoint acreage,” which shows the land-size point at which half of all cropland acres are on farms with more cropland and half are on farms with less cropland (MacDonald, Korb, and Hoppe, 2013). By this measure, the midpoint amount of cropland acreage on U.S. farms has nearly doubled since 1982. Meanwhile, the size of the average (mean) farm has changed little.
It is important to note that a large farm is not necessarily a complex farm, while a small farm may have organizational and production complexities. However, as discussed in detail in Chapter 3, large farm businesses are more likely than others to display dimensions of operational complexity, such as the presence of multiple owners, operations, and legal
___________________
13 See https://www.ers.usda.gov/data-products/chart-gallery/gallery/chart-detail/?chartId=76862.
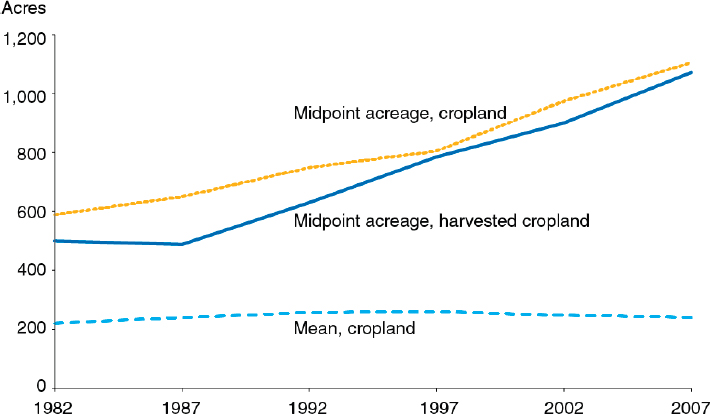
SOURCE: Mean cropland from MacDonald et al. (2013), using data from the U.S. Department of Agriculture’s National Agricultural Statistics Service’s Census of Agriculture. Midpoint acreages from Economic Research Service calculations, based on unpublished Census of Agriculture data.
entities; more complicated management and decision-making structures; greater geographic dispersion of operations; and more extensive contractual relationships. Farming is also a rapidly evolving sector of the economy, influenced by changing technology, increased automation, and modernizing business structures, and large-scale farms are leading the automation charge in the United States. Examples abound: Driscoll’s Berries in California is reconfiguring its operations to allow for the introduction of robot harvest crews to its fields and to bring industrial automation to its supply chain.14 Companies like PrecisionHawk offer farmers real-time crop monitoring through use of drones in the field that communicate via a tablet or smart-phone. In Kansas and elsewhere, farms use automation to monitor water application and operate irrigation activities from the office. In California’s Salinas Valley, Taylor Farms uses water knives operated by artificial intelligence and, at Hahn Family Wines, a sophisticated water monitoring system is in place. Almond farms are using moisture sensors to monitor soil conditions, with the resulting data passed back as inputs into the automated
___________________
14 See https://www.forbes.com/sites/currentaccounts/2017/03/02/with-farm-labor-gettingscarcer-big-u-s-farms-are-preparing-to-turn-to-robots/#64571b9c7bb6.
irrigation systems.15 And of course tractors are now equipped with GPS sensors, which improves their efficiency in covering ground in the fields and, in turn, reduces fuel bills and improves the uniformity of fertilizer, herbicide, and pesticide spraying.
These complexities pose challenges to the statistical agencies (NASS and ERS) whose program missions involve collecting data used to measure and report on the activities of farms and farmers, and in some cases on agriculture more broadly, while seeking to limit the respondent burden of those supplying the information. For example, the operational complexity of a farm could create uncertainty about who should be contacted to respond to surveys, what entities within the business the respondent represents and has accurate information about, and even (in the presence of value-added activities and multioperations) what to report on. These questions were less pressing when conventional single-family farm and principal operator concepts—of the kind that much of the data collection and methodology is still based on—dominated production. The composition of farm households’ income, a key indicator of U.S. farms’ well-being, has also changed in ways that add complexity to measurement. Specifically, off-farm income has been rising sharply as a portion of total household income, which naturally means that on-farm income has declined.16 Data collection and statistical programs must account for these changes in farm businesses and households if agricultural statistics are to remain accurate and useful for the broad range of purposes to which they are put.
Sorting out the measurement complexities created by modern agriculture is important even for generating the most basic summary statistics for the sector. Table 1.1 provides a different cut on the distribution of farms by size (in this case by the amount of acres harvested). It is difficult to assign a level of confidence, for example, to the estimate that there were 496 farms with between 10,000 and 25,000 harvested acres each in 2012, because it depends on how farmers define their “operations” when interpreting a census or survey question, and likewise on how the statistical agency processes the information. One large farm may divide operations in such a way that it does not reach the acreage threshold, while a similar sized farm may divide things in a way that does. As farm structures have changed, reporting to NASS and ERS surveys has become more difficult for respondents because more of them have to track entities with multiple operations and operators, with value-added activities, or with geographically dispersed operations and ownership structures.
___________________
15 See http://www.economist.com/technology-quarterly/2016-06-09/factory-fresh.
16 ERS, 2017 Farm Income Forecast, February 7, 2017. All values are adjusted for inflation using the chain-type GDP deflator, 2009 = 100 (Office of Management and Budget, Historical Tables, Table 10.1).
TABLE 1.1 Distribution of Farms, by Amount of Harvested Acreage, 1987, 1997, and 2012
| Farm Size (in harvested acres) | Number of Farms | Harvested Acres (000,000) | ||||
|---|---|---|---|---|---|---|
| 1987 | 1997 | 2012 | 1987 | 1997 | 2012 | |
| 2,000–4,999 | 6,570 | 16,692 | 26,404 | 17.7 | 46.4 | 75.3 |
| 5,000–9,999 | 513 | 1,267 | 3,323 | 3.3 | 8.0 | 20.8 |
| 10,000–24,999 | 99 | 173 | 496 | 1.3 | 2.3 | 6.8 |
| 25,000 or more | 11 | 18 | 26 | 0.6 | 0.8 | 1.1 |
| All | 7,193 | 18,420 | 30,249 | 22.9 | 57.5 | 104.0 |
SOURCE: Presentation by James MacDonald and Kathleen Ott; using data from Economic Research Service summaries of farm-level records in the National Agricultural Statistics Service’s Census of Agriculture.
1.2. STUDY OBJECTIVES AND STATEMENT OF TASK
The goal of this study is to review and assess current methods for collecting data and reporting information about American agriculture, to help identify those that are most effective, and to make recommendations on the same to USDA’s NASS and ERS. This has become increasingly important to undertake given the rising complexity of, and other changes in, farm business structure in recent decades. Guidance on how to coordinate and prioritize data collection is part of an overall strategy to continue building toward a data system that is well suited to measure modern farming and agriculture.
The agencies (NASS and ERS) are seeking a structure for reporting on complex farms while not ignoring smaller farms, particularly in emerging enterprises, such as indoor and urban farming. The emphasis in this report is on understanding farm structures at a conceptual level, with guidance reflecting the diversity of agriculture, the need to reduce the burden for respondents, the urgency of addressing root causes of declining response rates, and the need to create operational efficiencies and better processes within the agencies. The report should prove timely, as the sponsors are aiming to have a revised system of data and statistical programs by 2022.
Guidance is also provided in a context of rapidly changing data collection opportunities. While a survey-centric approach is still very much emphasized within the U.S. statistical system, the recommendations made here echo those made in recent reports—such as those released by the Commission on Evidence-Based Policymaking17 and the Panel on Improv-
___________________
17 See https://www.cep.gov/content/dam/cep/report/cep-final-report.pdf.
ing Federal Statistics for Policy and Social Science Research Using Multiple Data Sources and State-of-the-Art Estimation Methods (National Academies of Sciences, Engineering, and Medicine, 2017a)—which envision a much more substantial role for administrative, commercial, and other non-survey sources.
1.3. KEY THEMES AND REPORT STRUCTURE
This report addresses key challenges facing the statistical agencies of USDA, whose missions are to provide timely, accurate, and useful statistics in service to U.S. agriculture18 and to
anticipate trends and emerging issues in agriculture, food, the environment, and rural America and to conduct high-quality, objective economic research to inform and enhance public and private decision making.19
Among the challenges faced by NASS and ERS in their quest to modernize their statistical programs are: (i) accounting for the increasing complexity of farm organization through data collection and reporting; (ii) accounting for the increased concentration of farming firms and production; and (iii) addressing the implications of more complex farming operations for estimating farm household financial indicators. In all three areas, maintaining coverage and statistical reliability of farm financial and production statistics are key considerations.
This report is organized into three parts to address these measurement issues: first, the current data infrastructure maintained by NASS and ERS—which includes among its key components the Census of Agriculture and the Agricultural Resource Management Survey (ARMS)—is described. Next, constructs that underlie the definitions of key production units are explored. This provides a basis for identifying the operational complexities of modern farm businesses, as well as the resulting measurement challenges. In the final chapters of the report, guidance is offered for addressing the measurement of complex operations in a way that would help modernize data collection by USDA statistical agencies.
In addressing the charge to the panel (see Box 1.1), Chapter 2 takes on the preliminary task of reviewing existing information collected and published by NASS and ERS about the structure of U.S. farms and how information is collected, reported, and used. The centerpiece data collection programs for these statistical agencies are the Census of Agriculture and the ARMS. This chapter also identifies the missions and mandates of
___________________
18 From the mission statement of NASS, see https://www.nass.usda.gov.
19 From the mission statement of ERS, see https://www.ers.usda.gov.
the statistical agencies along with other user needs that dictate the scope of data collection.
Chapter 3 explores the factors that contribute to a farm operation’s complexity, which include the following:
- farm size;
- geographic dispersion of operations;
- multifarm, multibusiness operations;
- arm-connected nonfarm output;
- employment/labor structure;
- ownership/legal structure; and
- management and decision-making structure.
Here, the factors that make farms more or less complex as businesses (in an operational and management sense) are identified, and how such complexity affects data collection is also discussed.
The purpose of Chapter 4 is to clarify definitions and concepts used in the measurement of the farm economy, particularly for complex operations within the sector. The key units underlying production—the farm, the farmer, the farm household, and the farm business—are disentangled, and currently used definitions, which are summarized in Chapter 2, are compared with alternatives that could help sharpen the measurement of farming and broader agricultural production within the statistical system. The fact that the scope of modern agriculture is considerably more far-reaching than what takes place on the farm is a driver of complexity in data collection, and this is a theme that arises at several points throughout the report. The discussion in Chapter 4 provides a foundation for understanding proposed changes in measurement concepts and practices discussed later in the report.
Chapter 5 examines the implications for data collection of the increasing complexity of farm business structures. Shaped by the question, what information is needed to estimate farm (or, more broadly, agricultural) activity in the U.S. economy?, consideration is given to identifying the appropriate statistical units for measuring complex farm operations. Here, there are three productive inputs that can come into play: the farm operation (the business), the people (individuals and households), and the land. Ideally, these measurement units would be defined in a way that is as consistent as possible with the broader system of business statistics, including the definitions developed by the Census Bureau and the Bureau of Labor Statistics. Identifying best practices for measuring the activities of complex farm businesses—such as multi-unit operations and operations that are vertically integrated—and their associated households requires appropriately specifying the Farm Register, due to its central role in collecting data to ensure sufficient population coverage.
Chapter 5 further addresses a series of methodological questions: (i) Is the universe of “principal farm operator” households,20 which is the one currently used, the most appropriate one for representing complex farm operator arrangements? (ii) Which alternative concepts and measures can feasibly be incorporated into existing statistical programs? and (iii) Would farm classifications of sales and operator types different from those used by ERS better characterize the heterogeneity of the farm population, and
___________________
20 For definitions of this and other terms used by NASS and ERS, as well as terms used in this report, see Annex 2.1.
would other classifications for reporting farm household income and wealth provide a richer or more accurate picture of this population?
Alternative approaches to accounting for farm production and finances are explored, and recommendations are offered for sharpening the conceptual bases of agricultural statistics, particularly for complex farm operations. Practical guidance is provided for improving key data collection instruments such as the ARMS and the Census of Agriculture. One important consideration is how changes in data collection or statistical methodology might affect estimates, such as of the number of farms. In some cases, it may make sense to maintain more than one estimate for a period, so that a bridge can be constructed to transition from an old to a new statistical series. And any changes will have to be justified by their contribution to increased accuracy, reduced cost or burden, or both.
In Chapter 6, data collection options for measuring complex farm operations are discussed, and the potential roles of alternative survey approaches, as well as nonsurvey data sources, are considered. Expanded use of administrative data sources and effective linking across data sources (including nonsurvey data sources) are key elements of the strategy to modernize the data infrastructure within the statistical system. The essential perspective of data providers is considered in recommendations addressing respondent burden, response rate, and data accuracy concerns.
In some states, a relatively small number of large, often organizationally complex farms now account for substantial shares of the production of some commodities and some vegetable crops. These large farms often bear a substantial respondent burden from being contacted regularly to participate in surveys, and partly as a result their overall response rates have fallen. New survey approaches are explored with the hope not only of reversing the decline in response rates but also of collecting data that is more accurate from those farms that do participate in NASS/ERS surveys. The recommended strategies for increasing the accuracy of information and reducing the respondent burden are made with a cognizance of both USDA’s mandates and users’ needs. For example, any survey methodology reform that delinks household information from farm information would preclude much current reporting and analysis by ERS, such as the reporting on the distribution of farm payments, which bases household income information on farm operations commodity payments.


