
Appendix E
Advancing Our Understanding of Engineering Education Pathways, Employment Dynamics, and Economic Impact Through the Innovative Use of Administrative Data1
Debbie Hughes, Jason Owen-Smith, Treva Stack, David Stevens, Isabel Cárdenas-Navia
ABSTRACT
The innovative use of administrative data sets offer a unique approach to examining educational and workforce pathways, particularly in the field of engineering. Unlocking the tremendous potential of administrative data requires combining data by linking together individual records from multiple sources, as well as having the tools and capabilities to perform and visualize the analytics applied to the dataset. Developing a comprehensive nuanced understanding surrounding the factors influencing engineering students’ education and workforce engagement and success cannot be accomplished without the use of administrative data. With a growing body of evidence showing the power of administrative data, future data collection on engineering pathways should make such data sets easier to access, link, and report on, while facilitating the programmatic responses needed to support this new increased and personalized understanding of an individual’s education to workforce pathway.
ADMINISTRATIVE DATA ARE UBIQUITOUS
Records are constantly being created which capture both the significant and insignificant proceedings in an individual’s educational pathway. Enrollment in an elementary school, trying out for the middle school basketball team, registering to take an SAT test, and applying to a college or graduate school requires an agency or other organization to gather an individual’s name, address, date of birth, and other pieces of information as a part of their regular role. Entry into the workforce, accepting an employment offer, registering for direct deposit of a paycheck, and/or paying local, state, and federal taxes also requires an agency or other organization to gather an individual’s name, address, date of birth, and other more activity-specific pieces of information as a part of their regular process. Each completed record created by an organization will include some similar elements – name, date of birth, address – and some unique elements – SAT scores, school transcripts, employer name and earnings. Much like in the medical field, all of this information has historically been captured through paper forms. Today, the majority of information is collected online or is translated into digital form.
___________________
1 This paper was not subject to NAE editing.
Enormous amounts of information are already being collected by educational institutions, government agencies, non-profits, and organizations of all kinds for administrative reasons. Collectively, this information is called administrative data. Administrative data is collected as a part of daily life by a variety of sources for disparate reasons. For the organizations which collect this data, the cost of collecting and storing the data is already built into their operating expenses, and, for those organizations which regularly update this information as part of their system, so is that process.
These administrative data sets offer a rich set of information covering a very large sample of the population. For example, elementary school educational enrollment records provide data on the vast majority of children in the United States, regardless of geographic region, ethnicity, or socio-economic status. This large sample size allows for the identification of interests to specific subgroups, such as women, underrepresented minorities, or different geographic regions.
Like many administrative data sets, the sample size and timespan of these elementary enrollment records is not one which would be financially or logistically achievable by traditional survey methods. Furthermore, it includes data on individuals who would not typically respond to surveys, offering a truly comprehensive data set. Additionally, these enrollment records are collected on an annual basis for individual students, even as they move from one school to another; gathering similar data on an annual basis using an alternative method is not truly feasible.
CHALLENGES OF ADMINISTRATIVE DATA
The innovative use of administrative data sets offers a uniquely comprehensive approach to examining educational and workforce pathways, however, they also offer challenges in their use. The data sets were not initially developed to be used in analysis, nor have most of them been structured in a manner which allows them to be integrated with other datasets. Furthermore, federal regulations have been set up to protect the privacy of individuals at multiple levels. Aggregating these datasets for research purposes is achievable, but requires a considered approach.
Protecting the data against unauthorized access or disclosure is the most significant challenge in the use of administrative data to examine educational and workforce pathways. While this concern is not limited to administrative data sets, it is still one which must be addressed at multiple levels when working with administrative data sets. Before administrative datasets are made available to researchers, guidelines must be in place to address, among other items: inclusion of identifiable information; elimination of identifiable information when no longer needed; access to the data by only those individuals who have a need for the data in the performance of their duties; transparency in the use and purpose of administrative data; maintaining confidentiality in final products of analysis. These privacy concerns regarding administrative data sets are being very carefully considered by both governmental and non-governmental organizations: while many datasets are publicly available to researchers as de-identified data, many more are not publicly available. Even publicly available de-identified datasets are usually stored on secure servers, and are limited to researchers from reputable institutions. These protections play an important role in ensuring that administrative data is used in an appropriate and responsible manner.
Administrative data are also largely limited to data which is required for individual institution’s administrative purposes, significantly constraining the ability to influence what data is collected, the tools used to collect the data, the format of the data, and the quality of that data. This means that individual datasets are not always well-suited to answer a desired specific question on education or workforce pathways, and require additional information. Often this means that multiple data sets must be combined to address specific questions. When combining data sets, even from within or across one institution, significant effort must go into ensuring that data is properly matched and cleaned.
The use of administrative data in educational and workforce pathways also requires a careful evaluation of the quality of the dataset(s) being used. Data analysts must have a strong understanding of the purpose, collection methods, timeliness, periodicity, completeness, and other aspects of data quality of the administrative data and match this information with the type of analysis being conducted. This requires an investment by the analyst about why and how data quality challenges emerge, as well as information about how changes in quality may occur over time. Additionally, when multiple sources are being drawn upon, the lowest quality source will determine the overall precision of resulting findings.
Finally, in order to realize the high potential value that resides in administrative data sources, an analyst has to invest in an up-front understanding of how to access the data and how its use is authorized. This investment can be quite significant, and is dependent on the eagerness of the “owner” of each data source to allow researchers to access their data. The owner must have an understanding of the benefits of authorizing their data to support the outcome of the research project, such as customized reports back to the owner. Additionally, the owner must support the researchers in accessing their data, which may require an investment of resources (staff time, financial resources, etc.) from the “owner” to assist the researcher in accessing the data.
Analysts must be prepared to anticipate and allay the potential concerns of the owners of data sources in order to gain access, protect the privacy of all involved, and ensure quality of the accessed administrative datasets.
LINKAGE OF ADMINISTRATIVE DATA IS IMPERATIVE TO REALIZING ITS VALUE
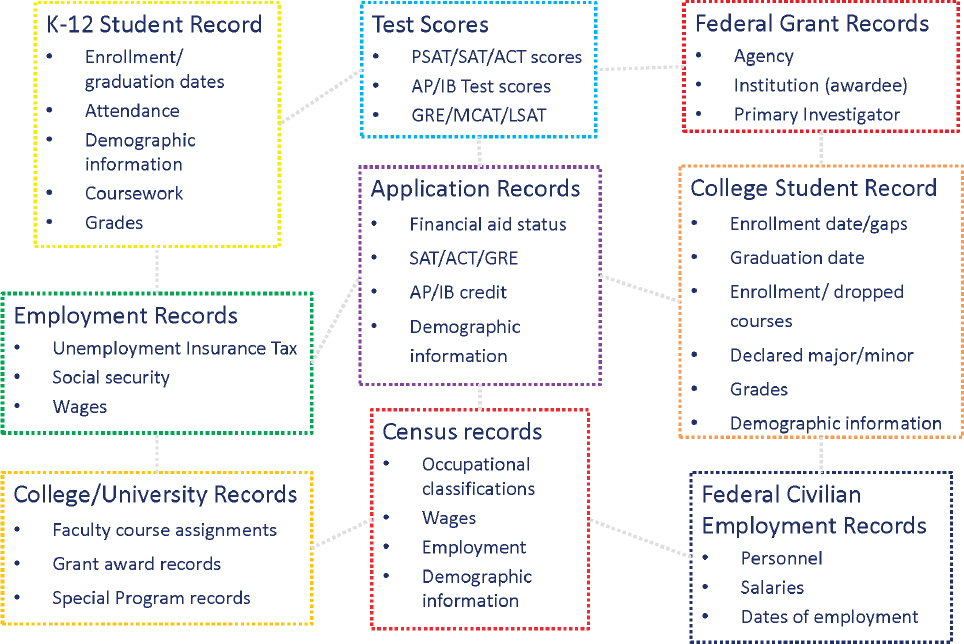
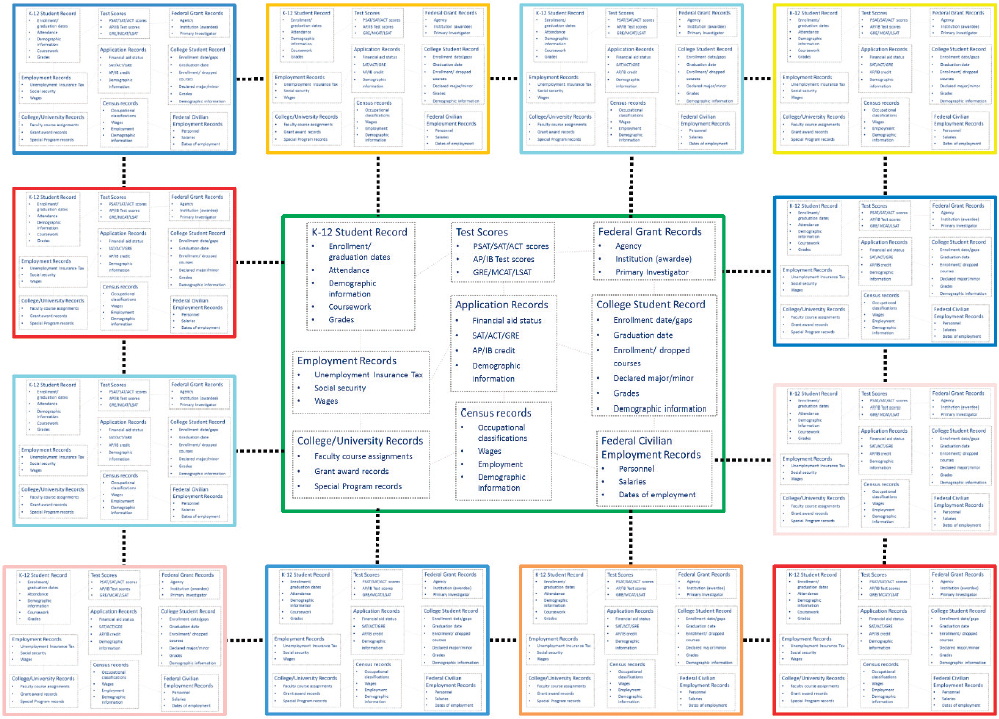
Unlocking the tremendous potential of administrative data to understand educational and workforce pathways requires combining data by linking together individual records from multiple sources, as well as having the tools and capabilities to perform and visualize the analytics applied to the dataset. Using this approach, researchers could trace the pathways of each individual student throughout their elementary, middle school, and high school years, bringing together demographic elements with transcript data such as grades, activities, and test scores. Researchers could then follow students into higher education and into the workforce, or into the workforce and then higher education, or any number of combinations. Linkage of administrative data could connect a student record to college administrative records, Census records, and employment records (Figure E-1). Combined, these pathways allow researchers to concretely map the choices that students are taking, offer insight into the individual impediments and incentives students are facing, as well as the overall student migration patterns in education, employment choices and employment dynamics. Through this information educators, policy-makers, and con-
stituents could use the aggregate reports to customize education supports and focus on identified leverage points where students are most vulnerable.
The linkage of survey data to administrative data further enhances the value of both datasets in understanding educational and workforce pathways. These two types of data are highly complementary, with administrative data providing significant demographic context to survey data, and survey data providing more detailed background information and self-reports to administrative data. Surveys can provide the much needed societal context, as well as the ‘voice’ behind the data. This linkage is not explicitly explored in this paper, but would add significant understanding if surveys were designed and developed for the possibility of linking with administrative data. For instance, developing common codes for de-identifying a student’s personal identifiable information which could be attached to their future records but could not be traced back to the individual would enable this type of linkage.
While the individual pathways are traced with the use of personal identity codes across datasets, the final results of linked administrative data analysis are used in aggregate. Therefore the confidentially of each individual is protected, while still allowing the researchers to view the variety of educational and workforce pathways being taken by students.
Many research organizations in the United States are successfully linking administrative data sets to gain insight into their field or area of interest. One of the most successful has been Science and Technology for America’s Reinvestment Measuring the EffecTs of Research on Innovation, Competitiveness and Science (STAR METRICS). STAR METRICS is a collaboration between federal and research institutions to develop tools to assess the impacts of federal R&D investments. Since it began in 2009, over 100 research institutions have participated in STAR METRICS.
STAR METRICS brings together administrative data from federal agency awards to research institutions, research institutions’ financial and human resources systems, academic researchers’ citations and patents, and the Longitudinal Employer Household Dynamics program at the Census Bureau; this information is used to provide data on the number of jobs and positions supported by federal R&D funding, as well as data on the estimated jobs generated by sub-awardee funds, vendor purchases, and overhead expenditures. The final analysis for an individual research institution includes both recent and historical information, and offers geographical information on the broad impact of the federal award money, information that had never been gathered previously.
Prior to STAR METRICS, reports from institutions provided only principal investigator (PI) and co-PI contact information, and could not connect individual grant awards to employment or any other broader impact metrics. Further, STAR METRICS was developed during the America Reinvestment and Recovery Act (ARRA) to answer a question that no other entity had the ability to address: the impact of federal grant dollars on job creation, although its results have informed many other policies in higher education and federal agencies.
Building on the success of STAR METRICS, the Committee on Institutional Cooperation (CIC) developed a pilot project, Universities: Measuring the EffecTs of Research on Innovation, Competitiveness and Science (UMETRICS), demonstrating that when universities share their administrative data under appropriate privacy and confidentiality protections the resulting reports and research can offer uniquely valuable insights into the process, products, social and economic value of public investments in academic research. In 2015, support from the Ewing Marion Kauffman and Alfred P. Sloan Foundations enabled the founding of the Institute for Research on Innovation and Science (IRIS). Headquartered in the Institute for Social Research (ISR) at the University of Michigan, IRIS is an IRB-approved data repository that provides a platform to make the CIC UMETRICS program a permanent, national research center for universities and researchers seeking to explain and improve the impact of research.
IRIS is structured to bring together universities, federal agencies, and other stakeholders to develop a national resource of data and analytical tools for both scientists and policy-makers. Since its launch in January 2015, 24 research universities have committed to participating by sharing data and making financial contributions to sustain the necessary infrastructure. The U.S. Census Bureau is also a key partner in IRIS, which enables university administrative data to be integrated with restricted Census data products such as the Longitudinal Employer Household Dynamics (LEHD) dataset and the Integrated Longitudinal Business Database (ILBD). These datasets contain data essentially representing the population of establishments that pay taxable wages in the U.S. (ILBD) and of wage payments from those establishments to individuals (LEHD). IRIS is also working with the United States Patent and Trademark Office, in a partnership that will allow the integration of patent and trademark data as
a marker for innovation and product development. The combined resource creates new and exciting possibilities for examining the workforce and career issues.
IRIS data will be made available for research use through a virtual data enclave being constructed at the University of Michigan. Integrated IRIS/Census data will be accessible through the Census Research Data Center system.
A paper in Science (Goldshlag et al 2015) demonstrates the value of administrative data in examining career outcomes and trajectories. Entitled “Wrapping it up in a person: Tracing flows from funded research into the economy using linked administrative data,” the authors report findings based on UMETRICS/Census data for 8 universities, focusing their analysis on the first jobs of 56,000 research employees, who are also doctoral recipients, hold after leaving their university. By combining information from ProQuest Dissertation Abstracts to identify doctoral recipients with Census Bureau data, Goldshlag et al 2015 are able to offer insight into the sector, size, age, and geographic location of employers, as well as the distribution of earnings of new graduates in each sector. The authors use simple regression analyses to explore associations between: field of research and employment in industry, academia or government; field of research and earnings; and field of research and features of the employing organization, such as size, age, and rate of growth. This analysis of the UMETRICS/IRIS data demonstrates the value of cleaned administrative datasets that connect across multiple sources of information to understand career outcomes and trajectories.
EXAMPLES OF ADMINISTRATIVE DATA LINKAGES IN ENGINEERING EDUCATION AND WORKFORCE
UMETRICS/IRIS is a remarkable example of the unexpected insights that administrative data can offer when a motivated group of actors works together to link multiple sources of data. There are many such efforts using linked longitudinal administrative data, but little of this research concentrates on engineering. Two examples highlighting the power of administrative data in better understanding engineering education and workforce pathways are presented below.
Understanding the Impact Undergraduate Research Engagement on Educational Outcomes
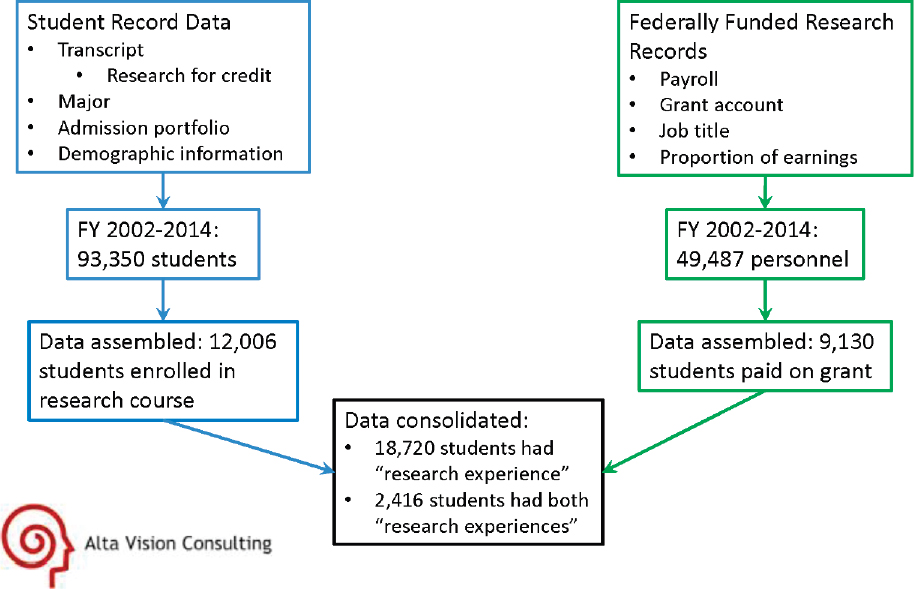
A pilot project at a large public university has successfully linked record level student transcript data with research expenditures on federal grants to examine the role, if any, undergraduate research plays on student graduation rates and academic performance. This pilot combined student enrollment and transcript data with paid employment on a federal research grant (Figure E-2).
From these datasets, a student was considered to have engaged in undergraduate research if s/he had either enrolled in an undergraduate research course for credit or was paid on a federal research grant. Other approaches through which students might have gained access to an undergraduate research experience (e.g., volunteer work, independent study) were not included in this analysis.
Although the gender balance of students engaged in federally paid undergraduate research largely reflected the undergraduate gender balance of the university (53.9% vs. 50.1% female, respectively), Pell grant recipients were disproportionately represented in the student population engaged federally funded research (27.0% vs. 19.3%). Additional demographic information is available on ethnicity, parental education, features of high school graduation, and other factors, which could be included in future analyses.
Of the 2,416 students who participated in both types of undergraduate research experiences, the overwhelming majority, 87.2% participated in the class first, and then found paid research opportunities. Overall, of the 12,006 undergraduates who enrolled in the research course, nearly 20% independently sought out paid research opportunities supported by federal grants. This progression suggests that undergraduate research courses maybe be an important catalyst in developing future researchers, and this topic should be studied more closely.
The majority of job titles of the students paid on the federal grants strongly suggested they were involved in research activities, with 71.2% of these titles listed as Assistant in Research, Laboratory Assistant, or Research Assistant I Social Sciences. 21.1% of this group was enrolled in the engineering degree program; this translates to 18.1% of all engineering graduates having been a paid employee on a research grants at some point in their
undergraduate experience. This sizeable percentage highlights the unexpected ways in which federal research dollars enrich the educational experience of the higher education community.
The largest number of students paid on federal grants were employed on National Institutes of Health grants (38.2%), followed by National Science Foundation grants (19.7%), Department of Defense grants (4.4%), and Department of Energy grants (3.5%).
Finally, the impact of undergraduate research experiences on graduation rates and grade point average was examined. As shown in Table E-1, students who participated in undergraduate research had both a higher grade point average and higher 5 year graduation rate when compared to the general student population, although the differences were not stark.
This analysis is evidence that student outcome data can be correlated with a student record or transcript data. Similar analyses could be conducted examining the impact of particular courses, capstone projects, or other activities on education outcomes. To date, participation in extracurricular or co-curricular activities, such as undergraduate research, co-ops, or work-study programs have not been linked to transcript data, offering only student surveys or program implementation evaluations as impact metrics.
TABLE E-1 Educational outcomes for students participating in undergraduate research experiences.
| All Students (n=) | Paid on Federal Research Grant (n=) | Completed Research Course (n=12000) | Paid on Federal Research Grant and Completed Research Course (n=) | |
|---|---|---|---|---|
| 5 Year Graduation Rate | 86.7% | 94.3% | 92.7% | 95.9% |
| Grade Point Average | 3.26 | 3.36 | 3.34 | 3.35 |
Chronicling the Engineering Education-Workforce Continuum at the University System of Maryland
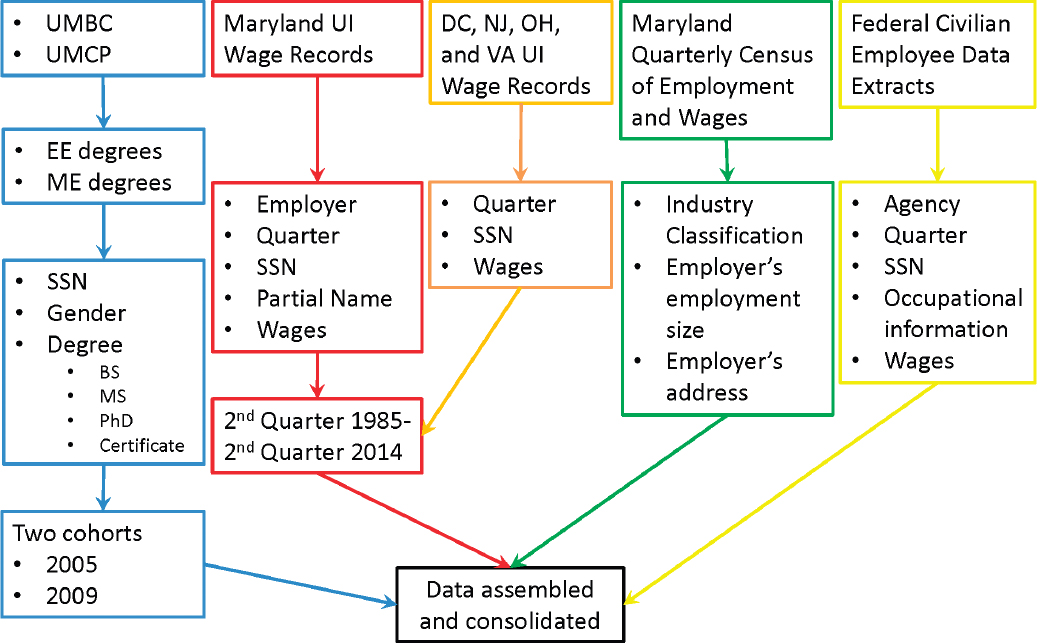
The University of Baltimore’s Jacob France Institute has successfully used administrative data sources to examine the longitudinal impact of engineering sub-specialty on wages. Through a collaboration with the University System of Maryland (USM), which included data from the U.S. Office of Personnel Management and the Maryland Department of Labor, Licensing and Regulation the Jacob France Institute was able to develop a longitudinal dataset on University System of Maryland institution electrical and mechanical engineering student earnings for the graduating class of 2005 (Figure E-3; for more detailed methodology of analysis see end of paper).
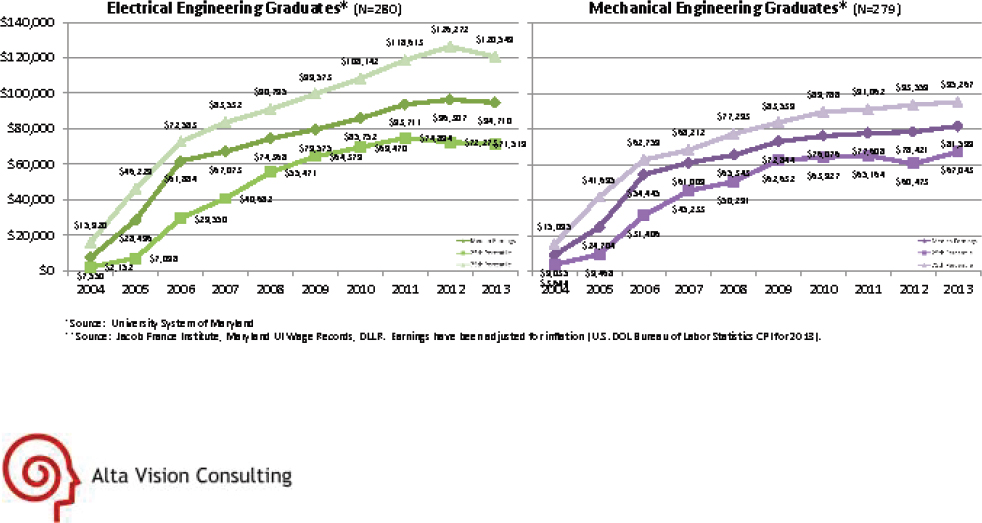
Figure E-4 shows the reported earnings profiles based on Maryland Unemployment Insurance Wage Records for the 2005 electrical engineering graduates (upper panel) and the 2005 mechanical engineering graduates (lower panel). Within one year (2006), the median annual earnings level reported for electrical and mechanical engineering graduates was $61,884 and $54,445, respectively. With few exceptions, annual earnings increased year after year. Mechanical engineers saw an initial steep increase in annual earnings for the first four years, after which the rate of increase was more gradual. In contrast, electrical engineers maintained a steady rate of increase throughout the timespan examined. This is most easily seen by comparing the median annual earnings for electrical vs. mechanical engineers in 2013 (eight years after graduation): $94,710 vs. $81,599.
This example clearly demonstrates how different administrative data sources can be integrated to address a specific question. Although not shown here, additional data fields that are also integrated in the pilot analysis undertaken. These fields allow stratification of the data by institution and degree-level, allowing researchers to study the impact of a M.S. compared to a B.S., or one campus within the University System of Maryland to another. Furthermore, although not included in this analysis, using the same methodology, researchers could examine the impact of course enrollment on degree completion and earnings.
The additional linkage of Quarterly Census of Employment and Wages data offers significant insight into engineering employment dynamics of these graduates. Examples include understanding of entry into and movement among different employment size-class businesses; understanding of entry into and movement among industries; understanding of industry-related differences in earnings progression patterns; degree- and major-specific understanding of entry into and movement among industries; and improved understanding of career trajectories for different subpopulations.
INNOVATIVE USE OF ADMINISTRATIVE DATA WILL DIRECTLY INFORM ENGINEERING EDUCATION AND WORKFORCE PRACTICES
The examples shown above demonstrate the power of administrative data to address some outstanding questions in the engineering education-workforce continuum. While these particular studies include relatively small sample sizes, they concretely establish the ability of researchers to link student data from a college/university system to other databases while respecting individuals’ privacy and federal regulations.
Given the vast amount of administrative data available along the engineering education-workforce continuum (Figure E-1), the potential exists to address a number of topics which are of significant interest and concern for the engineering, higher education, business and policy-maker communities.
Engineering Education Migration Patterns and Student Retention
Administrative data will allow colleges/universities to gain a new, real-time understanding of student migration and retention in engineering. As demonstrated in the examples, within an institution student transcript data can easily be linked with other college/university records and educational records to understand the pathways engineering students are navigating in higher education. Students which transfer into or out of engineering can be tracked through graduation, transcripts can be examined to understand the impact of courses, such as ‘gateway’
courses (those courses known to weed out students) on student retention, and the weight of demographics on student migration patterns can be studied.
Thoroughly tracing student migration patterns offers significant insight into persistent questions in engineering education. Students can be traced from their high school experience, using their application records, into their declared major, and changes within that major. Engineering students can be traced as they transfer in, out and between engineering sub-specialties and other scientific, technical, or liberal arts majors. Historical data on student migration patterns offers academic institutions the ability to understand the impact of past efforts to alter student migration patterns into engineering, as well as visualize trends in student migration. For example, retention strategies such as undergraduate research can be examined to understand their impacts on migration patterns beyond simple metrics such as grade point average and graduate rates.
Student transcript analysis combined with migration analysis also offers higher education institutions a wealth of information on their own engineering education practices. Gateway courses can be more easily identified; transcript information combined with departmental teaching assignments can then aid in identifying gateway professors, who could be offered additional teaching support, professional development or other mechanisms to aid in directly addressing the identified trends. In the alternative, professors with particular success in guiding students through gateway courses can mentor other faculty and share teaching tips.
Standardized test scores and high school transcript data combined with undergraduate transcript data can offer insight into student success or failure in particular core engineering, math, or science courses, allowing institutions to alter their curriculum and/or provide more directed support measures such as evidence-based high-impact practices to promote success in these subjects. High impact practices could include summer bridge programs creating learning communities, undergraduate research or internships, all specifically designed to address the needs of the students identified through the data. Similarly, course sequences within a major can be examined for correlation with student retention and persistence.
Administrative data also offers the opportunity to broadly identify whether demographic factors, such as gender, ethnicity, financial-aid status, and age, correlate with engineering enrollment and persistence. Clearly understanding which demographic factors most strongly correlate with which institutional success factors will allow institutions to begin to conduct targeted inquiries to fully understand their strengths and shortcomings with different demographics. The impact of demographics on student migration patterns could also be examined to understand if/when different subpopulation make different educational choices. Again, this initial analysis would allow for academic institutions to alter their policies or curriculum to encourage all subpopulations to continue in their engineering studies.
Institutions can individually apply administrative data analysis to gain insight into engineering education pathways and practices within their own borders; however, there is additional insight to be gained by linking together the administrative data of multiple institutions (Figure E-5).
Linking together multiple institutions through common data elements pulled through administrative records would allow individual institutions to gage their success in retention and graduation relative to sister institutions. In areas of comparative strength, a college/university could capture the core elements of their success, sharing it with other institutions for replication. In areas of comparative weakness, institutions could pilot new initiatives to improve themselves. While the data would be aggregated for analysis, the individual results would remain confidential to an institution, allowing them to make adjustments and share results at their own discretion.
More broadly, the aggregated results would allow faculty and administrators to understand how institutional environment might impact student success in engineering. Data identified only by institutional demographics, such as small suburban liberal arts college, large urban public university, or medium-size rural private university, could be studied for trends in student retention, particularly among underrepresented groups such as women and underrepresented minorities. Institutional demographics could also be examined to gain insight into potential elements of success in sub-populations such as veterans, first generation college students, or working adults.
For institutions serving small numbers of underrepresented populations, aggregated data of student migration patterns by student demographics could offer an understanding of the general impacts of demographics on student retention and success; for example, a strong positive correlation between early internships and retention in engineering for Latinos could be the impetus to develop a similar experience at their institution.
For employers and policy-makers, the aggregated results offer an easy-to-understand tool to advocate for increased investment in engineering education. Employer partnerships with colleges/universities have traditionally been transactional, whereby employers provide funding to the school and receive a service (often research studies) in exchange. Strategic, long-term, and well-aligned relationships between business and higher education are possible, but require data to inform their structure and outcomes.
With aggregated data, offered in a report or visualized through dashboard, employers can begin to make much more targeted and strategic investments, based on their individualized workforce needs and priorities. Without such reports, employers often use proxy metrics such as overall student retention or graduation rates. These metrics are too broad to allow employers to match them with their strategic hiring goals. For example, companies which prioritize hiring female engineers could partner with feeder colleges/universities to invest in new programs. These programs would be crafted based on the specific migration patterns of women at an individual university, allowing companies to target their investment to impact their workforce needs.
Engineering Employment Choices
Administrative data will also allow colleges/universities to track their engineering graduates, transfer students, and non-graduates, into the workforce. Student transcript data can then be combined with state and federal government datasets to track students out of colleges/university and into the workforce.
There are multiple reasons academic institutions will benefit from having this information. First, they will have clear data on the number of graduates who are employed, as engineers or otherwise, within six months of
graduation and be able to track their wages over time. Successful institutions could use this information to boost their support within their community and alumni, while less successful institutions could use this data as a starting point to improve career services for their students. Additionally, institutions could use the results of this analysis to deepen their engagement with companies which hire a large number of their graduates, or develop more robust relationships with employers in their region to whom they feel would benefit from hiring graduates from their institution.
Similarly, an analysis of the transcripts or migration patterns of employed engineering graduates vs. non-employed engineering graduates could probe if undergraduate coursework or experiences correlates with postgraduate employment. Beyond the undergraduate degree, institutions could explore whether credentials, such as certificates, minors, or concentrations, impact either employment or wages after graduation. If these credentials are shown to be valued by employers, this could offer higher education institutions a significant boost when recruiting students.
Engineering Employment Dynamics
The flow of engineering graduates within the workforce and the career pathways can also be examined using administrative data sources. Again using student transcript data combined with state and federal government datasets, employment and wages can be longitudinally traced for engineering graduates and for individuals employed in engineering positions. This administrative data will allow researchers to track the wages, employer, employer size, employer industry sector, and length of employment (among other data) for an individual.
These employment migration patterns will offer tremendous insight into the short- and long-term impacts of undergraduate engineering education on employment and wages, the role of continuing education in career trajectories in engineering, and the short- and long-term weight of demographics on engineering employment and wages.
Of particular interest to higher education institutions will be the number of engineering graduates working in traditional engineering sectors such as aerospace, automotive, energy, and oil and gas compared with nontraditional sectors such as finance, health care, or retail. An interesting analysis could examine the correlation between undergraduate coursework to inter-sector mobility and wages to elucidate the role of an individual’s academic background, such as coursework or internships.
At the aggregated level, demographic factors of engineering graduates could be examined for their correlation with employment and wages, both immediately after graduate and long-term. This could offer insight into whether any subpopulations are disproportionately employed at lower wages, struggle with short- or long-term unemployment, or opt-out of participating in the workforce altogether. It could also highlight differences by sector on the impact of demographics on employment and wages.
Historical data from multiple graduating classes would allow institutions to track trends in employment dynamics of their engineering graduates; gathering this data from multiple institutions would allow an individual institution to compare its graduates’ short- and long-term employment and wages to peer institutions. While direct comparisons of employment and wages between institutions are not reflective of the quality of the institutions or their programs, it offers previously unknown information for colleges/universities to understand the opportunities that their graduates are encountering in the workforce. Additionally, the aggregate data from multiple institutions could offer insight into the impact of individual (gender, ethnicity, age) and institutional demographics (public vs. private, urban vs. rural) on the employment and wages of engineering graduates.
The geographical footprint of graduates is also of strong interest to academic institutions, particularly public institutions. Having a significant number of its graduates remain employed within the state, particularly over a long-term time frame, emphasizes the major role that a higher education institution plays in shaping its region. Similarly, using administrative data to understand the interplay between continuing education and wages and/or continuing education as professional development in engineers would further underscore the critical role that colleges/universities play in the career trajectories of employed engineers.
Engineering workforce dynamics is also of strong interest to employers across all sectors. Understanding employee pathways into and out of their companies and industry would allow them to more effectively recruit and retain employees. Additionally, a more direct linkage between the role of engineering education in the career
pathways of engineers empowers employers to make a clear connection between a private investment in a higher education institution and a direct benefit to their organization.
Economic Impacts of Engineering Workforce
The same group of administrative data sources which enables researchers to study engineering employment dynamics also enables researchers to examine the economic impact of engineering graduates. In addition to the administrative data sources mentioned in the previous section, data on income taxes, property taxes, home sales, and patent applications can be linked to examine the economic impact of engineering graduates.
Using this data, a concrete comparison of the economic footprint of engineering graduates could be made with non-engineering graduates. This could be examined at both the regional and national scale, adding a geographic element to the results. This analysis would include an examination of the number of patents granted to engineering graduates and the number employers in new and small businesses.
Similarly, the economic impact of continued education and professional development of employed engineers could be examined. If the economic impact is significant relative to the financial investment of those experiences, employers and policy-makers could re-examine the private and public benefits in investing in continued professional development for engineers.
More broadly, regional economic data such as per capita income, unemployment rate, number of new businesses, and other business patterns captured by administrative data can be examined in geographic areas with high numbers of engineering graduates and compared with geographic areas with low numbers of engineering graduates. This type of analysis would expose the unique role, if any, engineers play in regional economies. If these engineering graduates are linked to regional institutions of higher education, it would also expose the unique role that these institutions play in regional economies, a role which would be much greater than the direct footprint of its own economic expenditures. Furthermore, this type of result would offer policy-makers the information necessary to advocate for increased investments in engineering education, on both a regional and national scale.
FUTURE RECOMMENDATIONS
Administrative data has proven potential and tremendous promise to offer insight along the entire engineering education and workforce continuum. To move toward fulfilling this promise we recommend two actions by the stakeholder community: 1) provide the necessary resources and funding to implement widespread use of administrative data; and 2) provide incentives for academic institutions and other key partners to use and responsibly share their administrative data.
Providing the Resources
Delivering on the promise of administrative data for engineering education and workforce will require not only excellent research by independent researcher teams, such as the projects highlighted in this paper, but will also require an investment at the university and/or university system level, at the state or regional level, and at the national level. At each of these levels, a commitment will be needed from the leadership and faculty/staff level of stakeholder organizations to come together to invest the resources to develop and sustain a collaboration to implement the widespread use of administrative data.
At the institutional level, there is a cost to colleges and universities accessing their own data. This cost can vary significantly from institution to institution, largely depending on the platforms used to store data. The cost can also be impacted by the timespan for which the data is desired: costs may escalate if historical datasets are included.
Once the institution has accessed their data, the cost of updating or expanding it declines substantially. For instance, universities that participated in STAR METRICS have leveraged that investment for faster and less costly participation in UMETRICS/IRIS. This strongly suggests that administrative data education and workforce clearinghouses should coordinate their activities in order to maximize the benefits and minimize the costs to participating institutions.
At a collaborative level, there are costs associated with initially developing and implementing a clearinghouse, such as IRIS, to host and protect administrative data, as well as longer-term maintenance or sustainability costs. Included in these costs are those associated with developing policies and standards for the clearinghouse, IT development, and faculty/staff time. The development of a set of protocols for data generation that will facilitate the linkage of education and workforce datasets is a critical element of the clearinghouse, as it will reduce the long-term costs of clearinghouse participation for all stakeholders.
While the costs associated with implementing and supporting the widespread use of administrative data are not minor, they are also not insurmountable. As an example of the cost associated with initially developing and implementing a clearinghouse, three federal agencies provided nearly $10 million to research and develop the techniques, processes, and policies necessary to initiate IRIS. An additional $2.5 million was provided by the Ewing Marion Kauffman and Alfred P. Sloan foundations for IRIS. This seed funding supports the development of a sustainable infrastructure capable of integrating data from multiple universities into national datasets.
This level of funding is consistent with some of the larger grants given out by federal agencies such as NIH, NSF, and DoD, as well as grants given out by private foundations. In addition to foundations which support science and technology research, this type of project is also a compelling one for private foundations associated with employers, particularly ones with a significant engineering workforce.
At the national level, the Statewide Longitudinal Data Systems (SLDS) Grant Program has given out hundreds of millions of dollars in grants since 2005 to support the design, development, implementation, and expansion of longitudinal data systems, including student records, from early childhood through workforce (P-20W). This program aims to enhance the ability of education stakeholders to improve decision making at all levels through the use of accurate and timely P-20W data.
This investment in the SLDS program offers an example of the resources needed if administrative data were to be implemented at nearly every college and university in the United States, and were to be inclusive of all fields. The level of investment would require a significant and sustained investment by the federal government over several years.
Providing the Incentives
The inclusion of as many, and as wide a variety of, academic institutions and other relevant organizations to join an administrative data clearinghouse will benefit all stakeholders in engineering education and workforce. To work toward this goal, the organization and governance of any sustainable clearinghouse should provide clear benefits to key stakeholders with particular focus on the colleges and universities that submit data, the partners who “own” key datasets for integration, the larger research community, and industry.
The most obvious benefit is that the clearinghouse will provide data on their students engineering education and employment pathways, which is increasingly demanded by regional and national policy-makers. Joining a clearinghouse offers a transparent and externally-validated process to capture this data, and may provide access and linkages to public datasets not otherwise easily available.
Colleges and universities will be able to utilize the data reports to seek additional funding and partnerships from foundations, state and federal agencies, and employers. In addition, they will receive a nuanced understanding of the strengths of their individual engineering programs, which can facilitate both the implementation and assessment of direct changes to measures to impact student outcomes.
Additionally, as mentioned above, the clearinghouse will develop and support an interface and educational tools for academic institutions, as well as other stakeholders, to access, interpret, and understand the data. This interface should be structured to allow participating academic institutions confidential, individualized reports on their data, which will not be shared with other stakeholders. The interpretation of these results and usage of the tools will also be supported by the expertise of the faculty/staff directly supporting the clearinghouse, as well as the expertise of the broader community of stakeholders participating in the clearinghouse. These elements will help academic institutions ensure that the data collected and analyses done on the administrative data sets are used responsibly and interpreted accurately.
The analytical tools themselves can offer tremendous value for colleges and universities. Outlined in more detail within the paper, administrative data offers higher education institutions unbiased insight into the strengths of
the engineering education they offer relative to other institutions, the strengths of different engineering departments within their institution, and a measure of the economic impact of their engineering graduates on their community. By joining the clearinghouse early, colleges and universities can ensure that the development of tools which are more important to them are prioritized in the early stages of its launch.
These analytical tools can also offer employers a method to understand the critical experiential components in the undergraduate experience that strengthen their workforce. For example, Gallup recently published a paper, “Many College Graduates Not Equipped for Workplace Success,” in which they showed that college graduates were more likely to be engaged employees if they had experienced one or more out of six college experiences. At least one of these experiences, working on a project which took a semester or more to complete, could be determined using administrative data, suggesting that administrative data can be used to understand and improve recruitment of engineering graduates.
The multiple benefits to engineering education and workforce stakeholders to use and share their administrative data should be widely communicated throughout the engineering community by researchers and other current users. Engineering faculty, college and university administrators, policy-makers, foundations, government agencies, and employers need to understand the benefits of administrative data to bring together the field or sector on a national level.
METHODOLOGY FOR ENGINEERING EDUCATION EXAMPLES
Understanding the Impact Undergraduate Research Engagement on Educational Outcomes
The initial findings we report here are derived from a pilot project that links record level transcript data collected under a campus-wide learning analytics initiative with record level data on direct cost research expenditures from federal grants on the same campus. Linking these two sources of data improve both in significant ways, while also providing valuable new insights into the process and outcomes of STEM education on a research intensive campus.
The case study of administrative data integration at a large public university was undertaken with three goals in mind. The research team sought to:
- demonstrate the value and identify the challenges of combining learning and research analytic data;
- describe the important phenomena of undergraduate research engagement;
- determine the implications of different types of research experience for educational outcomes, including persistence to graduation in STEM and non-STEM fields.
We conclude that there is real value to these and other data integration efforts. Where reliable linking assets exist (in this case a public and harmonized employee/student ID that prevented the need to make use of Personally Identifiable Information) the technical challenges are limited. Concerns with privacy and confidentiality can largely be addressed by using common statistical techniques for disclosure proofing.
Combining learning and research analytics data from administrative sources improved both data sets by expanding transcript data with rich information on co-curricular research experiences that have the potential to be a high-impact feature of education in a research-intensive environment. By the same token research analytic data was improved by the addition of nuanced and valuable information about the types of employees that occupy different job categories on campus. This information has high potential value for efforts to characterize the academic research workforce using job codes and other occupational data.
Finally, the combined data offers potentially important new insights into the character and educational implications of undergraduate research experiences. More detailed, inferential analyses are in progress, but for the moment combining learning and research analytic data yields novel descriptive information about who the students that have research experiences are; what topics the work on, jobs the occupy and degrees they pursue; and whether experience as a paid employee on a federally funded research grant is associated with differences in an important educational outcome, graduation within five years of matriculation.
Engineering Education-Workforce Continuum at the University System of Maryland
The University System of Maryland provided student record data fields for 2005 electrical and mechanical engineering graduates. The Jacob France Institute linked these records with Maryland Unemployment Insurance Wage Records covering the time span 2004-2013. The Institute also linked the graduate records with 2012-2013 federal civilian employment records.
The education data source is the Degree Information System designed and maintained by the Maryland Higher Education Commission. Each higher education institution that is required to submit reports to the Commission uses this Degree Information System. The University System of Maryland, in turn, receives this Degree Information System data from each of its member institutions. Figure E-5 does not include institution-specific or degree-level information, but these data fields are included in the Degree Information System. There is an Enrollment Information System complement to the Degree Information System. So, much more in-depth research about enrollment and persistence in ‘engineering’ courses, completion of one or more engineering degrees, and completion of related and/or unrelated courses/majors/degrees is possible and practical.
The University System of Maryland student record extracts were delivered to the Institute under a Memorandum of Understanding that complies with all applicable federal and state laws and regulations pertaining to permissible access to and transfer of public higher education administrative record information. The actual password protected transfer of encrypted records was through a secure electronic portal.
Maryland Unemployment Insurance Wage Records are maintained by the Jacob France Institute under an Interagency Agreement that has been renewed annually since 1991. The Agreement defines the permissible uses of the transferred administrative data. Authorized Institute staff members are identified. Each quarter the most recent records are transferred by password protected electronic transfer of encrypted records.
The federal employee extract information is received by Institute researchers through the Federal Employee Data Exchange System (FEDES) that is funded by the U.S. Department of Labor. Again, Interagency Agreements define authorized access rules, data security requirements, and permissible uses.
Once longitudinal education and employment/earnings records have been linked many research opportunities appear. Of particular importance is the longitudinal feature of both education and employment/earnings data. The Committee’s interest in the engineering education-workforce continuum is not a one-way progression from education into workforce. There are many combinations of prior, concurrent and subsequent engagements in engineering education and workforce participation and achievements. The so-called ‘leakage’ from engineering phenomena (multi-faceted) can, and does, occur at various life-cycle points.
The most important administrative record limitation, given the Committee’s charge, is that no occupation information is included in the Maryland Unemployment Insurance Wage Record database. The Quarterly Census of Employment and Wages data source, which was not used in the production of Figure E-1, contains an industry data field—North American Industry Classification System (NAICS) coding—that can be used to describe industry destinations and inter-industry mobility patterns of engineering graduates.
A second important administrative record limitation is that self-employed individuals and independent contractors are not included in the Maryland Unemployment Insurance Wage Record reporting system (although voluntary participation is permitted).
A third limitation, which applies to this one-time research initiative, is that only Maryland employment is included. Out-of-state employment covered by unemployment insurance laws in other states is available through the national Wage Record Interchange System (WRIS.2).
Our intention was to complement Figure E-5 annual earning profiles, which are based on Maryland Unemployment Insurance Wage Records only, with evidence of whether and how the median, 75th percentile and 25th percentile amounts change when federal employee records are added to the mix. This visual step was not taken for two reasons: (1) only five of the 2005 electrical engineering graduates, and fourteen of the 2005 mechanical engineering graduates, were found in the 2013 linkage with federal employment data; and (2) the federal employee earnings amounts are the annual full-time equivalent amount based on their grade level and assignment, not the actual amount received during the calendar year by the individual employee.
Jacob France Institute access to Quarterly Census of Employment and Wages information is a privilege, not a right. The data are received from the Maryland Department of Labor, Licensing and Regulation under the Interagency Agreement stipulations described above pertaining to Maryland Unemployment Insurance Wage Records. Different permissible use and disclosure requirements are applicable to the two data sources, because Bureau of Labor Statistics fund contribute to support of each state’s Quarterly Census of Employment and Wages program.


