
5
Selected Instruments for Assessment of Physical Functional Abilities Relevant to Work Requirements
This chapter reviews instruments available for measuring physical functional abilities relevant to work requirements. In terms of the conceptual framework described in Chapter 2 (see Figure 2-3), the instruments discussed assess function in terms of ability to perform physical activities (e.g., assessments of musculoskeletal function) as well as body functions (e.g., exercise testing for cardiac function, vision and hearing testing).
The inclusion criteria for instruments reviewed in this chapter were (1) sufficient representation in the scientific literature and/or widespread use; (2) evidence of sound psychometric properties, including (when applicable) construct validity, internal consistency, sensitivity to change, test-retest reliability, and intra- and interrater agreement (including subject/proxy and telephone/in-person administration) (see Chapter 3); (3) normative data; (4) applicability across a range of conditions and functional levels; (5) availability in the public domain; (6) ease of administration; (7) brevity; (8) availability in multiple languages; (9) validation in subpopulations; (10) multiple administration formats (telephone interview versus in-person administration; self-report versus proxy respondent); and (11) availability of alternative forms to minimize the risk of practice effects for performance measures. Some of the instruments reviewed here do not meet all of these criteria, but they are included because they illustrate potential assessment instruments.
The discussion of these instruments begins with an overview of physical functional abilities relevant to work requirements and the two broad types of instruments that can be used to assess them. The review of specific instruments that follows begins with those used for general assessment of physical function. The chapter then reviews in turn selected instruments
used to measure musculoskeletal function, pain, visual function, hearing function, and speech and language function. A series of annex tables at the end of this chapter provides information on selected functional assessment tools for physical abilities, including qualifications to administer, how to administer, time to administer, psychometric properties, proprietary considerations, and the populations to which the tools apply.
OVERVIEW
Physical Functional Abilities Relevant to Work Requirements
Physical functional abilities relevant to work requirements include 24 physical activities performed by workers in carrying out critical tasks, which are grouped into 10 categories (DOL, 2018, p. 88) (see Annex Table 5-1). For example, driving is a critical task that involves a number of physical demands, including far visual acuity, peripheral vision, and gross manipulation. In operating a passenger vehicle with automatic transmission and power brakes, driving also includes manipulation (foot/leg controls) (DOL, 2018, p. 123). In addition, several categories of worker abilities (physical, psychomotor, and sensory) (DOL, n.d.) are pertinent to the discussion of physical functions relevant to work requirements. Annex Table 5-2 shows how the functional domains identified by the committee, which correspond to the organization of this chapter, map to the physical demand data elements from the Occupational Requirements Survey (ORS) and to relevant physical, psychomotor, and sensory abilities identified in the Occupational Information Network (O*NET) (see Chapter 2), as well as to the equivalent functional abilities listed in different forms used by the U.S. Social Security Administration (SSA) in the collection and assessment of information relevant to an applicant’s capacity to perform work-related activities.
Instruments for Measuring Physical Function
Instruments for measuring physical function fall into two broad categories: self-report questionnaires and performance-based measures. Both are available for the assessment of work ability (or inability) in individuals with musculoskeletal disorders (Wind et al., 2005), as well as those with impaired cardiovascular and/or cardiopulmonary function, vision, and communication (hearing, speech-language).
Self-Report Questionnaires
Self-report questionnaires may be self-administered, administered by a medical provider, or completed by a proxy. Self-administered questionnaires
(self-report measures) are commonly used to have individuals assess their pain and function and have been used to measure or approximate individuals’ functional ability. Dedicated self-report functional measures exist for nearly all body regions and conditions. Many self-report instruments have been carefully evaluated for reliability, responsiveness, and validity, and much work has been dedicated to the development of these tools (Reiman and Manske, 2011). Proxies may be used to complete these questionnaires when individuals are unable to provide their own information because of their physical or mental condition. (See Chapter 3 for more information on the strengths and limitations of using a proxy or third-party respondents.)
There are four basic types of self-report instruments: (1) integrated, (2) impairment specific, (3) body-part or region specific, and (4) patient specific. Each type of instrument usually has a unique purpose, and each has advantages and disadvantages that have bearing on its potential utility. Impairment-specific instruments may not capture the additive or multiplicative effects of multiple impairments or comorbidities on an individual’s ability to function. Body-part– and region-specific instruments are generally used to address only the injury mechanisms and disease states affecting that body part or region. If a patient-specific instrument is used, generalization across patients may be misleading (Martin and Irrgang, 2007; Westaway et al., 1998). In contrast, an example of an integrated assessment instrument is the Medical Outcomes Study 36-Item Short Form Health Survey (SF-36) (Tarlov et al., 1989), which is a widely used and accepted self-report instrument with evidence to support its use for diverse pathological conditions. It is not a tool specifically for functional assessment of physical abilities, but combines assessment of physical and mental or emotional symptoms. As such, interpreting its results with respect to specific musculoskeletal or cardiovascular impairments may prove challenging. However, there is evidence that combining condition-specific outcome measures such as the Owestry Disability Index (ODI) or the Roland Morris Disability Questionnaire (RMDQ) with the SF-36 provides complementary information on the person’s status (Ko and Chae, 2017). Given that this chapter focuses on musculoskeletal, cardiovascular, vision, and communication impairments, the instruments discussed here focus primarily on specific body parts or organ systems.
Performance-Based Measures
Functional performance testing is defined as using a variety of physical skills and tests to determine an individual’s ability to participate at the desired level in an occupation or to return to work in a safe and timely manner without functional limitations (Reiman and Manske, 2011). Assessment at the functional level thus looks at the functioning of the person as a whole rather than function of a part of the person (Reiman and Manske, 2011).
A comprehensive functional assessment would make it possible to evaluate an individual’s ability to put together a series of movements (rather than perform isolated single-joint and planar movements) toward the safe and efficient completion of a task (Reiman and Manske, 2011). Currently, however, there is no single measure of an individual’s overall physical functional ability. The assessment tools summarized below and reviewed in detail in the sections that follow, used in combination, can provide only approximations of function. Yet, such a combination of reliable and valid measures of different constructs may improve the ability to predict work participation (Kuijer et al., 2012) and at present will provide the best determination of an individual’s current status in this regard (Reiman and Manske, 2011).
Performance-based assessments are “commonly used to determine the physical work abilities of individuals who have sustained musculoskeletal injury” (Gross and Battié, 2004) and/or cardiovascular impairment. A broad range of physical performance-based measures exist, such as trunk endurance testing; tests of movement patterns; excursion reach testing; jumping tests; hopping tests; strength testing; power testing; aerobic endurance testing in multiple planes of movement; lifting tests; balance/proprioceptive testing in multiple planes of movement; and speed, agility, and quickness testing (Reiman and Manske, 2011). Another example is the Purdue Pegboard Test, which is designed to measure uni- and bimanual finger and hand dexterity. It is a test of manipulative dexterity consisting of four subtests: right hand, left hand, both hands, and assembly (Mathiowetz et al., 1986; Tiffin and Asher, 1948). Other performance-based tests include the 3-minute step test, 15-minute stand test, floor-to-waist lift, 1-minute crouch, 2-minute kneel, 5-minute rotation, stepladder/stairs, waist-to-overhead lift, crawling, handgrip, hand coordination, stooping, and bending (Kuijer et al., 2012) and the Functional Gait Assessment. Finally, the Isernhagen Work System Functional Capacity Evaluation (Kuijer et al., 2012) is a performance-based measure that can be used to assess function at multiple parts of the body and is frequently used in the occupational setting. Physical performance-based measures must be administered by specialized personnel, typically a physical or occupational therapist, which increases their cost and limits their availability. Some performance-based measures have been found to be predictive of work participation for individuals with chronic musculoskeletal disorders, irrespective of whether the condition involves complaints of the upper extremities, lower extremities, or low back (Kuijer et al., 2012).
Performance-based measures provide relatively objective assessments of physical functioning. However, their results are subject to several confounders, including age, gender, education, pain duration, pain intensity, pain-related disability, employment status, physical work demand level, and work organizational policies and practices (Kuijer et al., 2012), although evidence suggests that even such potential confounders as pain intensity,
work-related recovery expectations, and organizational policies and practices do not diminish the predictive validity of performance-based measures with respect to work participation (Kuijer et al., 2012). Other factors to be considered include the individual’s psychological and social status at the time the test is administered (Reiman and Manske, 2011), which has been found to affect functional ability. Motivation may affect the results of these tests (Touré-Tillery and Fishbach, 2014) and age and level of depression also can predict work participation (Vowles et al., 2004). Assessment of an individual’s psychological status may therefore help in better determining his or her functional status and work readiness. Understanding the relationship among these different variables is a complex task, one that will most likely require interaction among multiple disciplines (Reiman and Manske, 2011).
Performance-based measures also are sensitive to change (Pepin et al., 2004) in that results may vary among testers and even with the same tester on different days. Nonetheless, some performance-based measures have been shown to be strong predictors of certain outcomes, such as mortality (Goldman et al., 2014), falls, institutionalization, and other causes of utilization of health services (Curb et al., 2006). In short, performance-based measures have been shown to be instructive, but application of their results to an individual’s work ability should be interpreted with caution.
Comparison of Self-Report and Performance-Based Measures
Self-report measures, frequently used to assess functional ability, may be less time-consuming to administer than performance-based assessments. More important, however, is that the two approaches differ considerably in the information they provide (Bean et al., 2011; Sager et al., 1992). Self-report measures provide an individual’s perspective on his or her change in function (Nielsen et al., 2016), which may help shed light on the person’s (perceived) ability to perform work beyond that which range-of-motion assessments might provide, for example. Performance measures involve quantification of output, such as the ability to lift a specific amount of weight, visual acuity, hearing capacity, and the like. In addition, self-report measures are dramatically influenced by an individuals’ perception of pain, which can in turn affect their perception of their functional ability (Reiman and Manske, 2011, pp. 101–107). In general, physical performance measures/tests can add important information to that obtained with self-report questionnaires, and it is best to use the two together in assessing an individual’s functional ability and gathering information relevant to determining his or her ability to sustain work on a regular and ongoing basis (Kuijer et al., 2012; Reiman and Manske, 2011).
Finally, as noted earlier, although self-report and performance-based physical measures of individual parts of the human body provide important
information, they do not serve to measure an individual’s overall physical functional ability. Thus, they may not, individually or collectively, measure function adequately to predict an individual’s ability to work. Indeed, given the complexity of measuring function and the multidimensional nature of work participation (WHO, 2001), one cannot expect a single instrument to allow for a complete assessment (Kuijer et al., 2012), and it is important to be aware of the range of physical assessment measures that are currently available, how to interpret them, and how much weight to assign them. Having said that, a self-report measure that appears to be a useful indicator of physical activity levels in people with chronic pain, arthritis, renal failure, and various neurological and cardiorespiratory conditions, as well as in healthy “older” people, is the Human Activity Profile (HAP) (Davidson and de Morton, 2007), which may serve as an example of an exception to this generalization. The HAP is a self-measure of energy expenditure or physical fitness (Davidson and de Morton, 2007) and has been found useful in estimating fitness level when standard exercise testing is not feasible (Bilek et al., 2008).
The following sections describe some of the most commonly used self-report and performance-based instruments for assessing physical function relevant to work participation. General assessments used to approximate function for the full body are described first, followed by those used to assess musculoskeletal function, pain, cardiovascular function, visual function, hearing function, and speech and language function. Data on the psychometric properties of these instruments are presented in Annex Table 5-3, along with information on respondent and administrative burden and any cultural and language adaptations. Note that the instruments discussed are those used frequently in clinical practice, and should not be regarded as an exhaustive list.
GENERAL ASSESSMENTS OF PHYSICAL FUNCTION
Instruments used for general assessment of physical function include functional capacity evaluations (FCEs) and the physical function scales of the Work Disability Functional Assessment Battery (WD-FAB). (See Annex Table 5-3 for a selected listing of these instruments.)
Functional Capacity Evaluations
An FCE, also termed a functional capacity assessment, physical capacity evaluation, or work capacity evaluation (Genovese and Galper, 2009), is a commonly used performance-based measure of physical function. FCEs have been described as systematic, comprehensive, and objective measures of an individual’s maximum physical ability to perform tasks involved in
activities of daily living and occupational activities (Jahn et al., 2004). They are often used to determine an individual’s ability to return to work or to identify appropriate work modifications that would make it possible to return to work at the level of full duty or modified/restricted duty, depending on the situation, and have demonstrated predictive value for this purpose (Kuijer et al., 2012; Soer et al., 2008). Other uses of FCEs include tailoring required occupational tasks to the functional deficits of an individual, screening for physically demanding occupations, and evaluating functional progress in a rehabilitation therapy program.
Unlike most other physical performance-based measures, FCEs can be used to assess more than one musculoskeletal impairment or muscle group; thus they can potentially provide more information than those performance-based measures that focus on specific body regions/parts or conditions. In addition, since FCEs are designed to evaluate an individual’s capacity to perform work activities related to his or her participation in employment (Soer et al., 2008), such factors as diagnosed impairments and functional difficulties, as well as job task requirements, are taken into account. Administered by a physical or occupational therapist, an FCE can help determine not only an individual’s maximum capacities and ability to perform work-related activities during a designated time period, but also, potentially, an individual’s level of effort. Ideally, the assessments are conducted in a standardized and reproducible manner (Genovese and Galper, 2009). As discussed later, FCEs are not without limitations, including with respect to both validity and reliability, as the results can be interrater dependent and affected by a myriad of confounders, including willingness to return to work (Ansuategui Echeita et al., 2018; Gross, 2006; Oesch et al., 2012).
An individual’s performance during an FCE may improve following a physical rehabilitation treatment program (Fore et al., 2015), as demonstrated by comparing pre- and postprogram performance. Thus, an FCE may be administered in an occupational medicine setting before and after an individual has undergone a period of “work hardening” or “work conditioning,” an expensive and time-consuming process carried out by physical or occupational therapists. During this process, job tasks the individual is expected to perform during a typical workday are simulated, and the intensity of the simulated work is increased in a stepwise manner until it approximates the job to which the individual will return. The individual is evaluated doing these tasks. Once individuals are able to perform the essential functions of their job tasks, they are released to return to work. This process is often carried out in the occupational setting if resources are available, especially if return to work appears likely.
There are approximately 10 commonly utilized FCE instruments (Chen, 2007): Blankenship, ERGOS Work Simulator, Ergo-Kit variation, WorkWell
Systems (formerly known as Isernhagen Work Systems), Hanoun Medical, Physical Work Performance Evaluation (Ergoscience), WEST-EPIC, Key, ERGOS, and ARCON. Evidence is limited as to the reliability and validity of the various FCE instruments. Gouttebarge and colleagues (2004) reviewed studies of the reliability and validity of four instruments. They found that the interrater reliability and predictive validity of Isernhagen Work Systems were good, while the procedures used to examine intrarater reliability (test-retest) were not sufficiently rigorous to allow any conclusions. The studies reviewed did not demonstrate the concurrent validity (i.e., the accuracy of the evaluation, whether the test measures what it intends to measure) of the ERGOS Work Simulator and Ergo-Kit, and the authors found no study on their reliability or on the reliability and validity of the Blankenship System.
Rustenburg and colleagues (2004) measured the concurrent validity of the ERGOS Work Simulator and the Ergo-Kit with respect to maximal lifting capacity. In this study, 25 male firefighters were subjected to tests designed to evaluate upper- and lower-extremity lifting capacities. The authors found the concurrent validity of the ERGOS Work Simulator and the Ergo-Kit to be poor for dynamic lifting.
De Baets and colleagues (2017) evaluated the evidence for the reliability and validity of multiple FCE instruments. The Baltimore Therapeutic Equipment work simulator showed moderate predictive validity, while Ergo-Kit showed high inter- and intrarater reliability and high convergent validity. However, the concurrent validity of Ergo-Kit and the ERGOS Work Simulator varied from low to moderate. Moderate to high test-retest and inter- and intrarater reliability was found for the Isernhagen Work Systems FCE, although the predictive validity of the instrument was low. The Physical Work Performance Evaluation showed moderate test-retest reliability and moderate to high interrater reliability, while its predictive validity was high (De Baets et al., 2017).
The WorkWell Systems FCE (formerly Isernhagen Work Systems) consists of 29 items related to five work performance categories (weight handling and strength, posture and mobility, locomotion, balance, and upper-extremity coordination). A systematic review of the reliability of this FCE showed an acceptable level of reliability for 96 percent of the test-retest reliability measures for weight handling and strength, 67 percent for posture and mobility, and 56 percent for locomotion (Bieniek and Bethge, 2014). The reliability of the extracted test-retest measure for balance was acceptable. In addition, 89 percent of the interrater reliability measures and all of the intrarater reliability measures showed acceptable levels of reliability (Bieniek and Bethge, 2014).
Gross and colleagues (2004) evaluated the prognostic value (predictive validity) of the Isernhagen Work Systems FCE in determining recovery
among workers’ compensation claimants with low back pain and their eventual return to work. Workers with low back pain underwent this FCE at least 6 weeks following the date of their accident. The workers evaluated were considered to have met or exceeded the expected healing time before undergoing the FCE. Additional medical treatment and rehabilitation were not expected to improve the individual workers’ clinical and functional ability. This study found that FCE performance was a poor predictor of time to claim closure (actual return to work). Only 4 percent of the workers met or exceeded the FCE criteria for return to work (Gross et al., 2004), whereas at 1-year follow-up, nearly 95 percent of the workers had returned to work. There was a weak association between better FCE performance and earlier return to work.
In the follow-up study, Gross and Battié (2004) determined that better FCE performance did not correlate with a decreased risk of injury recurrence. Workers’ compensation claimants with back pain were followed after undergoing an FCE. The number of failed tasks and performance on the floor-to-waist lift task were used as indicators of FCE performance. Sustained recovery was evaluated according to whether disability benefits had been restarted, a previous claim for back pain had been reopened, or a new claim had been initiated. Workers with the best FCE performance (lowest number of failed FCE tasks) consistently showed a higher risk of recurrent back injury (Gross and Battié, 2004).
Gross and Battié (2005) also found that FCE performance did not predict sustained return to work in workers with chronic back pain. In this study, better FCE performance was mildly associated with faster return to work. However, FCE performance was a poor predictor of recurrent back problems or self-reported disability. The Isernhagen Work Systems FCE protocol was utilized for this study. Higher weight on the floor-to-waist lift and a lower number of failed FCE tasks (i.e., better FCE performance) were weakly associated with faster suspension of benefits and claim closure (return to work). However, FCE performance was not significantly correlated with self-reported outcomes of work status, pain intensity, and disability. The authors conclude that FCE performance should not be relied on to forecast the ability of injured workers with back pain to return to work safely (Gross and Battié, 2005).
FCEs were initially envisioned as an objective measure of functional ability that could be used to assess an individual’s ability to perform the tasks of a particular occupation or used as a tool to identify specific occupational restrictions and/or limitations. Unfortunately, while potentially helpful in particular settings, FCEs have been shown to lack the reliability and validity necessary to fulfill these objectives.
Physical Function Scales of the Work Disability Functional Assessment Battery (WD-FAB)
WD-FAB is a self-report instrument that uses item response theory and computer adaptive testing (CAT) to assess physical and mental functioning. The WD-FAB physical function scales currently include four multi-item scales: Basic Mobility (56 items), Upper Body Function (34 items), Fine Motor Function (45 items), and Community Mobility (11 items) (Meterko et al., 2018). CAT algorithms customize the selection of items based on previous responses to avoid the need to administer all the items in the item banks (Meterko et al., 2018). The items are agreement based or ability based. Agreement-based items ask the respondent to “specify your level of agreement” on a 4-point Likert-type scale ranging from “strongly agree” to “strongly disagree.” Some items also include an option for the respondent to indicate “unable to do.” Ability-based items provide 5-point response options for the question “are you able to”; response options range from “yes, without difficulty” to “unable to do.” Both types of items include an opt-out response of “I don’t know” (Meterko et al., 2018). A study of three groups of working-age adults (aged 21 to 66 years)1 showed “substantial support” for the instrument’s reliability and construct validity (Meterko et al., 2018). The WD-FAB is also discussed in Chapter 4.
MUSCULOSKELETAL ASSESSMENTS
This review of musculoskeletal assessments is organized by body parts: upper extremities and hands and fingers, back and neck, and lower extremities and feet. Instruments used for musculoskeletal assessment are listed in Annex Table 5-4.
Upper Extremities and Hands and Fingers
Disabilities of the Arm, Shoulder and Hand Questionnaire (DASH)
The DASH is a self-report questionnaire that consists of 30 questions designed to measure physical function and symptoms in patients with any or several musculoskeletal disorders of the upper limbs. Questions ask about the individual’s symptoms, as well as his or her ability to perform certain activities. The questionnaire was designed both to help describe the disability experienced by people with upper-limb disorders and to monitor
___________________
1 The groups represented individuals who were “(1) unable to work because of a physical condition (n=375); (2) unable to work because of a mental health condition (n=296); [and] (3) general United States working age sample (n=335)” (Meterko et al., 2018).
changes in symptoms and function over time when administered during successive visits to a provider’s office (IWH, n.d.).
The DASH gives clinicians and researchers a single reliable instrument that can be used to assess any or all joints in the upper extremities (IWH, n.d.). It performs well in both these roles. It can detect and differentiate small and large changes in disability over time following surgery in patients with upper-extremity musculoskeletal disorders and show treatment effectiveness after surgery for subacromial impingement and carpal tunnel syndrome (Wong et al., 2007). Both the DASH and the QuickDASH (an 11-question abbreviated version) have been found to be effective in measuring functional status after traumatic hand injury (Wong et al., 2007). QuickDASH has been shown to provide the same information as the full DASH in less time, and is completed more often (Aasheim and Finsen, 2014).
The DASH is available in 27 languages and has been validated in French, Persian, and Japanese, as well as English. Many measurement properties of QuickDASH have been evaluated in multiple studies and across most measurement properties (Kennedy et al., 2013).
Patient-Reported Outcomes Measurement Information System (PROMIS) Upper-Extremity Questionnaire
As described in Chapter 4, PROMIS comprises a bank of questionnaires containing highly reliable, precise measures of self-reported health status developed under the auspices of the National Institutes of Health (HHS, 2018). The PROMIS Upper-Extremity Questionnaire is intended to evaluate the mobility of the upper extremities. It may be used as an upper-extremity disability measure and correlates with the QuickDASH questionnaire (Overbeek et al., 2015).
Patient-Rated Elbow Evaluation (PREE)
The 20-item PREE questionnaire is designed to measure elbow pain and disability in activities of daily living (Vincent et al., 2015). Patients rate their levels of elbow pain and disability from 0 to 10 on two subscales: the pain subscale, which consists of five items for which individuals rate pain from 0 to 10 (0 = no pain, 10 = worst ever); and the function subscale, which consists of 11 items for which individuals rate the level of difficulty, again from 0 to 10 (0 = no difficulty, 10 = unable to do) (MacDermid, 2010). Additionally, a total score can be computed that measures both pain and functional problems weighted equally, on a scale of 0 (no disability) to 100, and a higher score indicates more pain and functional disability (MacDermid, 2010).
Patient-Rated Wrist Evaluation (PRWE)
The PRWE is a 15-item questionnaire designed to assess pain, disability, and functional difficulties in activities of daily living resulting from injuries affecting the wrist joint area (MacDermid et al., 1998). It is used to evaluate pain in the affected wrist and activities affected by the wrist injury, as well as the frequency and intensity of pain and when it occurs—for example, at rest; upon repeated movements; or during lifting of heavy objects, household tasks, fine hand movements, self-care, and/or toileting. It also can be used to assess the individual’s ability to participate in household, occupation-related, and recreational activities. The PRWE has two subscales: the pain subscale consists of 5 items, with responses ranging from 0 (no pain) to 10 (worst pain ever); the function subscale consists of 10 items divided into specific (6 items) and usual (4 items) activities, with responses ranging from 0 (no difficulty) to 10 (unable to do). A composite score can also be obtained. The objectives of administering the PRWE include determining the degree of wrist-related musculoskeletal disability; predicting the prognosis for a patient with wrist injury considering his or her baseline score; and communicating the pain and degree of musculoskeletal disability associated with wrist injuries in a meaningful way to the patients, health care professionals, and insurance companies (PRWE, 2011).
Michigan Hand Outcomes Questionnaire (MHQ)
The MHQ is a self-report outcome assessment used to measure and compare outcomes across different hand conditions. It consists of 37 core questions, takes approximately 15 minutes to complete, and can be self-administered or administered by research personnel (University of Michigan, 2014a). It can be used to assess an individual’s general hand function or, if administered several times (e.g., pre- and postoperatively), to assess changes in hand function. It includes demographic information and contains six distinct scales: overall hand function, activities of daily living, pain, work performance, aesthetics, and patient satisfaction with hand function (University of Michigan, 2014a).
Back and Neck
Instruments for assessment of low back pain have been used to evaluate the correlation between individuals’ self-report scores and their actual work status (Sivan et al., 2009). In general, the correlation between chronic back pain and work status has been demonstrated to be modest at best. The instruments evaluated include the RMDQ, the ODI, and the Orebro Musculoskeletal Pain Questionnaire. Descriptions of these and
several other commonly used instruments for assessment of back and neck pain follow.
Roland-Morris Disability Questionnaire (RMDQ)
The RMDQ is a self-report measure consisting of 24 items. First published in 1983, it has become one of the most widely used outcome measures for assessing the level of disability experienced by a person suffering from low back pain (Chapman et al., 2011; Roland and Morris, 1983). The RMDQ has been shown to yield reliable measurements that are valid for and are sensitive to change over time for groups of patients with such pain (Roland and Morris, 1983). Its questions relate to an individual’s perceptions of his or her back pain and associated disability, including items on physical ability/activity (15), sleep/rest (3), psychosocial factors (2), household management (2), eating (1), and pain frequency (1). The questionnaire can be completed in about 5 minutes and without assistance (Stevens et al., 2016). The RMDQ is most sensitive for patients with mild to moderate disability (Davies and Nitz, 2013), with greater levels of disability being indicated by higher numbers on a 24-point scale (Stevens et al., 2016). Internal consistency and test-retest reliability are good (Smeets et al., 2011).
Results from the RMDQ have a moderate to large correlation with those from other self-report disability questionnaires, such as the Quebec Back Pain Disability Scale (Quebec Scale) and the ODI, and this instrument has demonstrated strong qualities with respect to content and construct validity, feasibility, linguistic adaptation, and international use (Calmels et al., 2005). The original 24-item questionnaire has been shortened to create 18- and 23-item versions and has been cross-culturally adapted or translated for use in other countries, although the original is still the most widely used and validated version. The RMDQ is highly regarded among questionnaires designed to evaluate disability caused by low back pain because of its psychometrics and feasibility (Rocchi et al., 2005).
Oswestry Disability Index (ODI)
The ODI, derived from the Oswestry Low Back Pain Questionnaire, is used to quantify disability due to low back pain. Developed in 1990, this 10-point self-report, self-administered outcome questionnaire is one of the outcome measures most commonly used to assess individuals with low back pain (Vianin, 2008). Its psychometric properties have been well established (Vianin, 2008), and it is the most effective questionnaire for assessing persistent severe disability (Davies and Nitz, 2013). It takes 5 minutes to complete and 1 minute to score. Scores reflect the severity of the individual’s back pain, ranging from minimal to bedbound. The ODI
is an extremely important tool for use by both researchers and disability evaluators to measure individuals’ permanent functional disability, and is considered the “gold standard” among low back functional outcome tools (Fairbank and Pynsent, 2000).
The ODI evaluates pain intensity based on 10 topics: intensity of pain, lifting, ability to care for oneself, ability to walk, ability to sit, sexual function, ability to stand, social life, sleep quality, and ability to travel (Fairbank and Pynsent, 2000; Fairbank et al., 1980; Yates and Shastri-Hurst, 2017). Each question is scored on a scale of 0 to 5, from least amount of disability to severe disability (a total score of 0 = no disability, 100 = maximum disability possible) (Fairbank and Pynsent, 2000). Self-report scores on the ODI were found to be correlated with those on the RMDQ and the Quebec Scale. The ODI may be considered more reliable than the RMDQ, but both are considered well validated (Grotle et al., 2005).
Quebec Back Pain Disability Scale (Quebec Scale)
The Quebec Scale is another commonly used self-report outcome measure designed to evaluate functional disability in patients with chronic back pain (Kopec et al., 1995). This 20-item questionnaire is used to assess symptoms and severity of low back pain and the degree to which the individual’s pain impacts functional activities. Rocchi and colleagues (2005) critically compared nine self-administered questionnaires designed to evaluate disability caused by low back pain with respect to their psychometric properties (reliability, validity, responsiveness) and practical and technical aspects (number of items, number and kind of domains, scaling of items, scoring, time to complete, validated transitions). The authors determined that the ODI, the Quebec Scale, and the RMDQ appeared to be fully validated from a psychometric standpoint. They found the RMDQ and the ODI to be preferable based on their psychometrics and feasibility (Rocchi et al., 2005). The reliability of the Quebec Scale has been found to compare favorably with that of the ODI (Davidson and Keating, 2002).
Neck Disability Index (NDI)
Published in 1991, the NDI was the first instrument designed to assess self-rated disability in patients with neck pain. This self-administered, self-report instrument consists of 10 questions asking individuals to provide information about how neck pain affects their everyday life activities. The NDI is the most widely used and strongly validated instrument for assessing self-rated disability in patients with neck pain and has been used effectively in both clinical and research settings in the treatment of such pain (Vernon, 2008).
Lower Extremities and Feet
Lower-Extremity Functional Scale (LEFS)
The LEFS comprises 20 questions designed to help determine how a person’s lower-limb function affects the ability to perform daily activities, with a focus on disorders of the hip, knee, leg, ankle, and foot (Martin and Irrgang, 2007). Questions address activities that range from walking between rooms to running on uneven ground (Dingemans et al., 2017). The questions are subdivided into four groups, which cover activities that impose increasing physical demands. The lower the score, the greater is the disability. In general, scores have been observed to decrease with age, and men tend to score slightly higher than women; no statistical correlation has been found between socioeconomic status and LEFS scores. People who are unfit for work have significantly lower LEFS scores (Dingemans et al., 2017). The scale has been found to be reliable and valid for assessing functional impairment in a wide array of patient groups with lower-extremity musculoskeletal conditions (Binkley et al., 1999) and for a broad range of disorders and treatments (Dingemans et al., 2017).
Functional Gait Assessment (FGA)
The FGA is an ambulation-based balance test used to assess postural stability during walking tasks, with a focus on 10 facets of gait and balance (Leddy et al., 2011). The performance-based measure consists of a timed walk with a 10-item clinical gait test that includes tasks requiring many postural adjustments (Wrisley et al., 2004). Participants are asked to perform gait activities such as “walk at normal speeds, at fast and slow speeds, with vertical and horizontal head turns, with eyes closed, over obstacles, in tandem, backward, and while ascending and descending stairs” (Wrisley and Kumar, 2010, p. 762). The FGA is scored on a four-level (0–3) ordinal scale. The scores range from 0 to 30 with lower scores indicating greater impairment (0 = severe impairment, 30 = normal ambulation). It takes 5–10 minutes to administer (AbilityLab, 2016). The FGA demonstrates acceptable reliability, internal consistency, and concurrent validity with other balance measures used for patients with vestibular disorders (Wrisley et al., 2004). It has shown reliability and validity for assessing balance in individuals with Parkinson’s disease and has been validated for use in individuals not only with vestibular disorders but also with such diagnoses as Parkinson’s disease, as well as in community-dwelling older adults (Leddy et al., 2011). It has been shown to have high interrater reliability across the patient populations studied and high concurrent validity in patients with Parkinson’s disease and stroke and community-dwelling older adults (Weber et al., 2016).
Foot and Ankle Ability Measure (FAAM)
The FAAM is a self-report measure used to assess the physical performance of individuals with musculoskeletal disorders affecting the lower leg, foot, and ankle (AbilityLab, 2015; Martin and Irrgang, 2007; Martin et al., 2005). It consists of 29 questions divided into two subscales, which are scored separately: an activities of daily living subscale (21 items) and a sports subscale (8 items). A higher score represents a higher level of ability (Martin and Irrgang, 2007; Martin et al., 2005). The 5-point Likert scale responses range from zero (unable to do) to 5 (no difficulty in performing).
Summary
Numerous performance-based measures are available for assessing physical function in specific areas (e.g., range of motion, strength, balance). While such measures provide quantitative information about the areas assessed, they are less useful for predicting whether or how well the individual will be able to perform everyday activities, including work, on a sustained basis. Self-report outcome measures complement the results of performance-based assessments to provide a more complete picture of an individual’s overall functional status. An important consideration in determining the utility of these assessment tools is that if an individual has a solitary injury such as a wrist injury, and pain is not a significant element of the presentation, then using PRWE alone may suffice. However, if more than one area of the upper extremity is involved, then a more global assessment of upper-extremity function, such as the DASH or the PROMIS Upper-Extremity Questionnaire, may be in order. In the event the entire body is involved, the WD-FAB physical function scales may be helpful. However, it would be operationally challenging to identify distinct constructs for use depending on the body location affected that would provide the answer as to whether an individual is disabled. Such use also would be counter to the premise of the importance of considering overlapping and synergistic conditions an individual may display in determining disability (see Chapter 4). Thus while this section reviews some of the tools commonly used to assess musculoskeletal function, it would be naïve to conclude that one tool can be used in isolation to determine the degree of an individual’s disability; this is the case particularly for tools that address a single joint and that may be validated only for certain diagnoses. It is beyond the scope of this report to provide a comprehensive approach to disability determination based on a combination of these and similar assessment tools while also taking into account pain and other factors that might be relevant.
PHYSICAL FUNCTION AND PAIN
As discussed, assessing an individual’s functional abilities is a complex undertaking. For example, a musculoskeletal impairment resulting from an upper-body injury may preclude performing a job that requires heavy lifting, but not a job that involves substantial walking without heavy lifting. However, it is important also to consider the presence of potential modulating factors, such as depression (discussed in Chapters 6 and 7) or pain, that can affect an individual’s performance and may preclude his or her ability to perform either job. Pain often impairs function and occurs in many forms, including monophasic events, chronic episodic conditions, and chronic persistent problems (Stewart et al., 2003). Multiple studies focus on the impact of pain as a predictor of work absenteeism and reduced work performance (Bergström et al., 2014; Félin-Germain et al., 2018; Kawai et al., 2017; Kresal et al., 2015; McDonald et al., 2011; Tsuji et al., 2018). Potential side effects of treatment for pain that can affect the ability to work include drowsiness, nausea, vomiting, diarrhea, impaired capacity for concentration, deficits in information processing and memory, and slower psychomotor speed and reaction time (Bet et al., 2013; Kendall et al., 2010; Porreca and Ossipov, 2009). To the extent that use of these medications interfered with an individual’s ability to work, they would be considered “interrupters” in the committee’s conceptual framework (see Chapter 2).
Although pain is a symptom, not a function, a few common pain assessment instruments are described here because its presence affects so many functional abilities. It is important to note that there are many valid approaches to measuring pain, and the tools presented are by no means exhaustive.
Visual Analog Scale (VAS) for Pain
The VAS for the measurement of pain is a horizontal (more common) or vertical scale depicted as a 10-centimeter line typically labeled “no pain” at one end and “worst imaginable pain” at the other (Hawker et al., 2011; Williamson and Hoggart, 2005).2 The individual is asked to place a mark along the line to indicate his or her level of pain, typically as experienced within the past 24 hours. The individual’s pain intensity is scored by measuring the distance in millimeters from zero (no pain) to the mark. The higher the number, the greater is the individual’s pain, up to a maximum of 100 (worst imaginable pain). The VAS for pain has been shown to be reliable and valid for the assessment of pain in an acute setting, such as a
___________________
2 Evidence suggests that the orientation of the line should reflect normal reading direction (horizontal or vertical) for the person being assessed to decrease error (Williamson and Hoggart, 2005).
hospital emergency department (Bijur et al., 2001). Individuals with cognitive limitations or those with fine motor deficits may have trouble completing the assessment (Hawker et al., 2011; Williamson and Hoggart, 2005).
Numeric Rating Scale (NRS) for Pain
The NRS for pain is another self-report measure of pain intensity in adults, typically within the past 24 hours. The most common version is an 11-point scale anchored by 0 (“no pain”) at one end and 10 (e.g., “worst pain imaginable”) at the other (Hawker et al., 2011; Williamson and Hoggart, 2005). The NRS for pain is valid and reliable. Unlike VAS for pain, it can be administered verbally as well as in writing, and it is simpler for respondents to comprehend and for examiners to score. As measures of pain intensity, the VAS and the NRS are not designed to capture the complexity of individuals’ experience of pain (Hawker et al., 2011).
PROMIS Pain Interference Instruments
The PROMIS Pain Interference instruments measure self-reported effects of pain on relevant aspects of one’s life, including the extent to which pain hinders engagement with social, cognitive, emotional, physical, and recreational activities (HealthMeasures, 2017). The instruments assess pain interference over the past 7 days. The PROMIS measure yields a single summary score, which is then converted to a T-score (mean of 50, standard deviation of 10). (Meterko et al., 2015). The instrument has been shown to be valid and reliable (Amtmann et al., 2010).
CARDIOVASCULAR ASSESSMENTS
Cardiovascular disease can limit work capacity in multiple ways. First, the heart can be too weak to pump an adequate amount of blood to provide oxygen to exercising muscle. Even when the contractility of the heart appears adequate at rest, such structural impairments as coronary artery or valve disease may limit the response to exercise. Some individuals who are physically capable of exercise may be restricted by their cardiologist because of the risk of a sudden life-threatening arrhythmia or other collapse during exertion, such as can occur with some inherited genetic heart diseases, advanced hypertrophic cardiomyopathy, or critical aortic stenosis, but this would be rare. SSA listing criteria for cardiovascular conditions, such as chronic heart failure or ischemic heart disease, generally include both (1) demonstration of objective abnormality of cardiac structure/cardiac function that could seriously limit patient function, and (2) demonstration of patient functional limitation by exercise testing, although the
functional criteria are occasionally met instead by three or more events requiring intervention during a 12-month period (IOM, 2010, pp. 86, 118; SSA, 2008, 4.02, 4.04).
Demonstration of functional cardiac limitation can be supported by patient questionnaire and a medical provider’s subjective designation of functional impairment based on integrated clinical assessment. As patient mood, recall, and incentives can influence both patient and provider assessment, these factors are best combined with exercise testing to provide objective functional measurement during an exercise tolerance test. This test is most reliable and least subject to assumptions when it can be performed with simultaneous gas exchange analysis. Annex Table 5-5 provides relevant information for selected cardiac and cardiovascular assessments described below.
Patient Questionnaires
Multiple validated patient questionnaires can be used to assess symptomatic limitation with cardiovascular disease. The two standard questionnaires for heart failure are the Minnesota Living with Heart Failure Questionnaire (MLHFQ) (Rector et al., 2006) and the Kansas City Cardiomyopathy Questionnaire (KCCQ) (Joseph et al., 2013). Both have been extensively validated and shown good reliability, responsiveness, performance across populations, feasibility, and interpretability (Kelkar et al., 2016). These instruments were not developed specifically to address physical function but to quantitate the overall impact of a decrease in heart function on the life of an individual. They encompass multiple domains, including physical, social, and emotional. Both questionnaires are approved by the U.S. Food and Drug Administration as valid for demonstrating the value of medical interventions, either medications or devices.
The MLHFQ contains 21 items for which the scores (maximum of 5 points each, with a higher score indicating more limitations) are summed. Conversely, a higher score indicates fewer limitations in the KCCQ, which includes 23 items and more specific description of limitation in specific activities, such as walking, climbing stairs, housework, and yardwork. Both questionnaires have been administered to many thousands of patients with impaired cardiac function and have been translated extensively into other languages. Both have been demonstrated to predict death or permanent disability with moderate accuracy for the minority of patients who deteriorate soon after testing, but they have not been used specifically to determine intermediate levels of function. General ranges of the aggregate scores correlate with mild, moderate, and severe limitation of activity in heart failure populations but do not correlate reliably with capacity for individuals.
The Seattle Angina Questionnaire was developed using a framework similar to that for the KCCQ for heart failure. Shorter versions of both of these instruments were recently developed and validated, consisting of 7 items for the angina form (Chan et al., 2014) and 12 items for the heart failure form (Spertus and Jones, 2015).
Recognizing the limitations of all patient questionnaires, the two major limitations of these heart failure and angina questionnaires for the assessment of ability to work are (1) the broad range of the questions, which include social and emotional domains as well as physical functioning; and (2) the definition of limitations as being specifically attributable to the diagnosis of heart failure or angina. Many patients with cardiac disease have general symptoms of fatigue and breathlessness regardless of their specific diagnosis. Two other patient questionnaires are keyed directly to the performance of work activities with any cardiac disease: the Specific Activity Scale (Goldman et al., 1981) and the Duke Activity Status Index (Hlatky et al., 1989). Both include questions on specific daily activities that elicit information directly translatable to a measure of work intensity (see discussion of metabolic equivalents [METS] below). However, these instruments have been validated only in small cohorts and have not been widely adopted.
Provider Classification of Cardiac Limitation
The New York Heart Association (NYHA) Functional Classification was proposed in 1902 as a convenient tool for medical providers seeking to describe the symptomatic severity of cardiac disease in their patients. Its wording has been modified for different diagnoses but in its broadest form specifies the nature of activity that is limited and not the limiting symptoms (see Table 5-1). It is used most commonly in populations of adults with heart failure or angina, but is often used as well to describe the degree of limitation with other cardiac disorders, such as adult congenital heart disease and acquired valve disease. The universality and simplicity of the NYHA classification have rendered it common vernacular in routine patient care, triage for major interventions, and eligibility for specific therapies. Because the classification explicitly describes limitation in relation to routine activity, it can serve as a useful initial screen for employability: Class I patients would be expected to have no cardiac limitation on work; Class II patients to have limitation on moderately strenuous work; some Class III patients to be able to do sitting work with occasional walking, and others to be unable to work in any job requiring physical activity; and Class IV patients, with symptoms at rest or with any movement, generally to be unable to perform regular work, except for occasional highly motivated individuals doing cognitive work.
TABLE 5-1
New York Heart Association Functional Classification
| Class I. No limitation of physical activity. Ordinary physical activity does not cause undue fatigue, palpitation, dyspnea, or anginal pain. |
| Class II. Comfortable at rest with only slight limitation of physical activity. Ordinary physical activity results in fatigue, palpitation, dyspnea, or anginal pain. |
| Class III. Comfortable at rest but marked limitation of physical activity. Less than ordinary activity causes fatigue, palpitation, dyspnea, or anginal pain. |
| Class IV. Inability to carry on any physical activity without discomfort. Symptoms often present even at rest. If any physical activity is undertaken, discomfort is increased. |
SOURCES: Adapted from Greenberg and Kahn, 2012, p. 507; NYHA, 1994, pp. 253–256.
The NYHA classification is notoriously subject to interobserver variability by one class, although very rarely by two classes (Raphael et al., 2007). Unless they question patients systematically about specific activities, physicians commonly underestimate the limitations on specific activities that patients report (Albert et al., 2010). There is a strong statistical correlation between scores on the patient heart failure questionnaires and the NYHA classes, such that more severe patient-described limitation tends to correlate with worse classification of limitation by the physician. However, the ranges for each class have wide overlap, and the correlation is not tight; for example, r values range from 0.55 to 0.62 in one large study (Joseph et al., 2013). Similarly, the NYHA classification has been aligned with performance on exercise tests, but again, although the correlation is strong, wide overlap in ranges limits the ability to classify an individual patient correctly.
Despite the serious limitations of the NYHA classification, it remains a surprisingly robust predictor of outcomes with heart failure, as measured by rates of hospitalization, heart transplant or mechanical circulatory support, or death. When it indicates severe limitation, as in Class III or IV, objective assessment is likely to confirm substantial limitation on work capacity. When a discrepancy exists between a provider’s designation of Class I or II and a patient’s description of more severe activity limitation, an exercise test is frequently helpful to provide more objective assessment of such limitation.
Exercise Testing for Measurement of Functional Capacity
A major advantage of exercise testing is the resulting estimates of work capacity that can be compared directly with the levels of work estimated for activities in many common occupations. The most frequently used means of objectively assessing cardiac exercise capacity is exercise testing on a treadmill (Ellestad et al., 1969). This method requires an exercise testing laboratory with exercise and cardiac monitoring equipment, a technician or physician/nurse practitioner/physician’s assistant trained in performance of exercise testing, and either the same or a different provider with experience in interpreting the results of the tests. Most hospitals can meet these requirements because this type of testing is commonly used to evaluate patients with chest pain that may be cardiac in origin. Outpatients may have this testing in a nearby hospital or in the outpatient office of a cardiology practice; in some cases, the testing may be carried out by experienced primary care providers in their offices. Although most exercise testing is performed on an upright treadmill, some facilities and some patients may have the option of using a bicycle for greater stability or in some cases for more consistent calibration with actual work performed. In general, peak exercise on a bicycle requires a slightly lower total energy expenditure relative to that on a treadmill.
In rare cases, patients may be deemed to be at excessive risk of a serious event during exercise testing, which would then be supported by written documentation. Ideally, a waiver of exercise testing should be completed by a board-certified cardiologist and include details of the cardiac diagnosis and the nature of the risk. The importance of the safety of exercise testing and exercise for rehabilitation is increasingly appreciated such that few patients should require a waiver of exercise testing because of cardiac risk.
Routine Exercise Testing
Standard exercise testing is generally performed with consistent encouragement to the level of patient exhaustion, unless early termination is required because of abnormal events—such as a drop in blood pressure, chest pain or electrocardiographic evidence of severe ischemia, or life-threatening arrhythmias—suggesting active disease. Such events generally are considered sufficient evidence of cardiac limitation even if the test was stopped early. Most tests otherwise continue to completion until limited by shortness of breath; fatigue; or noncardiac conditions, such as musculoskeletal pain or weakness. Shortness of breath or occasional oxygen desaturation due to pulmonary disease may limit exercise performance, but these symptoms can also be due to cardiac disease, so distinguishing limitations resulting from these conditions is not easy at the time of exercise testing.
The professional administering the test needs to be experienced in recognizing typical signs of disease and risks during the test, as well as in assessing the individual’s degree of effort. An individual’s intentional restraint of effort can be suspected from a lack of typical heart rate and blood pressure changes or of the appearance of vigorous effort during exercise. More difficult is distinguishing individuals with true cardiac limitations from those who are peripherally deconditioned as a result of prolonged inactivity.
Assessment of functional capacity is influenced by peak blood pressure and heart rate but generally summarized by the total exercise time and highest workload achieved before stopping. The latter is calculated from the speed and elevation of a treadmill (or resistance on a bicycle) and expressed in terms of METS. One metabolic equivalent is the energy required each minute to support normal existence at rest. For example, easy walking is estimated to require approximately 2.5–3 METS of energy expenditure. Inability to perform 5 METS generally is sufficient to meet the current SSA listing for cardiac disability (SSA, 2008). There are tables indicating the estimated level of METS for common activities involved in employment.
Estimation of the actual energy expenditure from the external workload performed during exercise requires several assumptions, however. The first is that the average watts expended to perform an activity per kilogram will be the same for individuals with different levels of muscular fitness and body composition. The second is that the individual is in a steady state where the energy used each minute is the energy required to meet the ongoing needs of the exercising muscle. The third assumption is that the individual will not exercise beyond the level of what would normally be tolerated. Extreme performance by athletes or by individuals trying to override their limitations can be endured for a few minutes during which the workload exceeds the physical capacity and is being performed in a state of energy deficit that is paid back slowly during prolonged fatigue. Individuals working with chronic cardiac disease can become physiologically and psychologically adapted to brief bouts of activity at levels that are beyond the capacity of their heart to sustain. For this reason, the estimation of METS for an individual’s workload during a routine exercise test commonly exceeds the individual’s capacity to sustain a given level of work.
Exercise Testing with Simultaneous Gas Exchange Analysis
The addition of gas exchange analysis during exercise testing allows work performance to be measured directly in terms of oxygen consumption per kilogram per minute rather than estimated. This approach is referred to as cardiopulmonary exercise testing, often abbreviated CPET or CPX. Measurement of peak oxygen consumption has consistently been shown
to be the most objective and reproducible means of assessing exercise capacity in cardiac disease (ATS/ACCP, 2003), and has long been known to relate closely to the peak cardiac output achieved during exercise (Metra et al., 1990). According to the statement of the American Thoracic Society/American College of Chest Physicians on cardiopulmonary exercise testing, such testing “complements other clinical and diagnostic modalities and by directly quantitating work capacity improves the diagnostic accuracy of impairment/disability evaluation … [and] may be particularly helpful when job-related or exertional complaints are disproportionate to the measured … impairments” (ATS/ACCP, 2003, p. 217).
The usual conversion from estimated to measured energy requirements is that 1 MET is equivalent to 3–4 ml/kg/min of oxygen consumption, such that walking would require about 10 ml/kg/min. The threshold of 5 METS for the current SSA listing for cardiac disability for both ischemic heart disease and chronic heart failure would then correspond to about 15–18 ml/kg/min (IOM, 2010, pp. 86, 118). For patients who exercise to exhaustion, this exact measurement often yields a lower estimate of work capacity than that derived from their last attempted level of the routine exercise test. Stoic patients or those accustomed to strenuous activity despite cardiac disease often achieve an exercise workload associated with a higher level of METS than what is actually measured by oxygen consumption. The result is overestimation of the work such an individual could actually perform on a regular basis. On the other hand, the simultaneous monitoring of carbon dioxide production and its comparison with oxygen consumption can be used to measure intensity of effort so that individuals can be urged to maximum effort, and their failure to give that level of effort can be recognized.
A unique advantage of cardiopulmonary exercise testing compared with most tests of functional capacity is that it provides ancillary information about the sustainability of exercise. While gas exchange analysis measures peak oxygen consumption that reflects the highest level of exertion possible, it also provides information on the individual’s anaerobic threshold, or the level of work he or she would likely be able to sustain for at least 50 minutes (if not limited by other conditions). This level is generally about 70 percent of the person’s peak oxygen consumption. Individuals who stop voluntarily before achieving their anaerobic threshold are considered to have undergone an incomplete and inadequate test of cardiovascular capacity (Wasserman, 1994, p. 122).
Extensive tables exist with which to compare the estimated METS or oxygen consumption required during specific work-related or recreational activities (Arizona State University, 2011; Erb, 1970, Table F-4; Wasserman, 1994, p. 469). For instance, the estimated oxygen consumption while sitting during computer use would be just slightly more than while sitting at rest, while pumping gas at a gas station would require three times
as much oxygen consumption as sitting at rest. It may appear simple to align these requirements with the METS or oxygen consumption measured at peak exercise, but such an interpretation would overestimate the capacity to sustain a given work activity for a prolonged period of time. Instead, the cardiac work level that could be sustained under ideal conditions for about 50 minutes is best estimated by the direct measurement of anaerobic threshold during the exercise test, or approximated by the calculation of 70 percent of the peak METS or peak oxygen consumption achieved during peak exercise.
The gas exchange apparatus requires the individual being tested to wear a noseclip and mask or mouthpiece similar to a snorkel, which most people can tolerate with adequate coaching. Gas exchange measurement equipment requires additional training to maintain and calibrate, and performance of the test requires technicians with specific expertise, often exercise physiologists or respiratory therapists. Exercise testing with gas exchange frequently is performed in pulmonary function laboratories in community hospitals and clinics. These facilities may be supervised by cardiologists in large cardiac centers, particularly those centers offering cardiac transplantation, where a peak oxygen consumption of less than 12–14 ml/kg/min (3.5–4.0 METS) is often used as a general indication of cardiac disease that is sufficiently severe to warrant consideration for transplantation.
The 6-minute hall walk has been used as a convenient way to assess exercise capacity without requiring an exercise laboratory. Originally developed to assess heart failure patients in trials of investigational therapies, this test involves encouraging a patient to cover as much floor as possible along a measured corridor during a 6-minute period. The results are most helpful when they are very high or very low, but do not correlate well with more objective exercise testing in the middle ranges, where ability to work would be assessed (Lucas et al., 1999). This method is also highly dependent on individuals’ level of effort, which may be reduced during evaluation for disability. The gait speed measured during a 6-meter walk is gaining popularity as an index of frailty in populations with chronic disease (Peel et al., 2012), but is also highly dependent on effort and has not been compared against work requirements.
Summary
Patient questionnaires and NYHA classification by providers offer useful information on limitation to routine daily activities, from dressing to climbing stairs and doing household chores. Current SSA listing criteria for disability require both the demonstration of cardiac structural abnormality on imaging and routine exercise treadmill testing to estimate peak work performance, unless patients have had at least three cardiac events requiring
intervention in the preceding year. The addition of metabolic gas exchange analysis to regular treadmill testing can provide more precise measurement of the energy expenditure that can be sustained, which can be compared with the energy requirements documented for specific work activities.
VISUAL ASSESSMENTS3
The number of individuals with visual impairment is increasing in the United States, with approximately 11 million estimated in 2015, and by 2050, that number is projected to double (Varma et al., 2016). This is particularly important because vision problems affect productivity, activities of daily living, and quality of life.
Visual functions relevant to work requirements include far and near visual acuity and peripheral vision (DOL, 2018, p. 130). In addition, O*NET lists depth perception, night vision, glare sensitivity, and color discrimination among its visual sensory abilities (DOL, n.d.). With regard to driving, visual acuity, peripheral visual field sensitivity and extent, and color vision appear to be important visual functions for achieving good performance. Good performance refers to vision impairments that do not increase a meaningful risk of failures in safe driving (e.g., collisions, accidents, pedestrian or bicycle collisions) that may affect the driver and/or those in other nearby vehicles. As discussed further below, while it is not necessary that drivers have normal color vision, there are certain situations in which persons with color vision deficiencies (moderate to advanced anomalous trichromats and dichromats) may experience confusion that may lead to increased risk of a driving problem (e.g., inability to distinguish between a flashing red or yellow light, recognizing hazard warnings).
Reductions in visual function can occur when environmental conditions, such as poor weather (rain, snow, fog, sleet), smoke, dim or nonexistent lighting, low contrast, or abrupt changes in lighting (bright to dark or vice versa), compromise or diminish visibility. Most visual functions are degraded under these conditions, although a few (flicker detection, motion sensitivity, object localization) are affected only minimally. Given the effect of environmental conditions on visual function, it is important to keep in mind that most vision tests are designed to evaluate abilities under optimum visibility conditions that may not reflect performance when those conditions are degraded. The use of eyeglasses or contact lenses to correct refractive errors also can be adversely affected by poor environmental conditions. Additionally, there are a number of ocular and neurological conditions that are subject to the greatest amount of impairment when visibility is
___________________
3 This section draws heavily on a paper commissioned by the committee for this study (Wilkinson et al., 2018).
degraded. Annex Table 5-6 lists selected instruments used to measure visual function.
Visual Acuity
Visual acuity, or the finest spatial detail that can be resolved, is the most commonly used index of visual capacity. Acuity predicts the ability to perform a number of important visual discrimination tasks, such as those involved in reading and the identification of critical details at near and far distances. If acuity is reduced, for example, it is not possible to discriminate objects at a distance or the fine differences that distinguish letters from each other.
Visual acuity is measured most commonly with the use of high-contrast letters (dark letters on a white background). The letters are constructed such that their thickness is one-fifth the size of their overall width and height. The minimum size of letters that can be accurately recognized determines the visual acuity measure. Visual acuity is normally specified according to the visual angle subtended by the fine detail (thickness) of the letters, known as the minimum angle of resolution. By convention, a minimum angle of resolution of 1 minute of arc corresponds to a visual acuity of 20/20 in Snellen notation. The Snellen acuity notation is reciprocally related to minimum angle of resolution; that is, 20/40 corresponds to 2 minutes of arc, 20/200 corresponds to 10 minutes of arc, and so forth. A number of physiological factors (e.g., refractive state, pupil size) and environmental factors (e.g., illumination level, contrast) can affect visual acuity measurements. Cognitive status is another important factor that can affect vision testing.
Two types of visual acuity charts are currently in use. The Snellen chart, developed in 1862, is a vertical chart of letters that decrease in size from top to bottom. It contains a different number of letters on each line, and the size changes from one line to the next are variable. This chart can be used to test distance visual acuity at a 10- or 20-foot viewing distance. The Bailey-Lovie chart and later the Early Treatment Diabetic Retinopathy Study visual acuity chart were developed to provide a more standardized method of measuring visual acuity (Kaiser, 2009). These newer charts have an equal number of letters on each line, and the size changes from one line to the next are equal steps on a logarithmic scale, that is, a geometric progression in size. A refined scoring system is also available for these charts. Moreover, the light levels are specified, improving test-retest reliability. These charts, and their projected and electronic equivalents, are thus preferable for accurate determination of visual acuity (Kaiser, 2009; NRC, 2002).
Near visual acuity typically is measured using handheld charts at a distance of 40 centimeters. “If the near vision test chart has the same or similar design features as the letter chart used for distance visual acuity, if other
test conditions (luminance, contrast, etc.) are the same, and if the subject is wearing appropriate refractive error correction, then the distance and near visual acuity scores should be equivalent to each other” (NRC, 2002, p. 66).
Peripheral Vision (Visual Fields)
Peripheral vision allows individuals to see objects around them without turning their head. It permits the detection of objects of interest, approaching threats, and the like that are critical for the safe and effective performance of daily activities. Detection of objects in the peripheral visual field is necessary for directing head and eye movements to fixate the objects and thereby inspect them in detail. Also, skills involving visually guided behavior (eye–hand coordination; driving; and other mobility tasks, such as ascending or descending stairs) are heavily dependent on peripheral vision. In addition to the importance of peripheral vision for driving, Marron and Bailey (1982) report that visual field status is one of the most important factors in predicting the mobility skills of individuals with vision loss.
The prevalence of significant loss of visual field due to ocular and/or neurological disorders has been reported by various investigators to be between 1 and 9 percent (Keltner and Johnson, 1980). In a study of 10,000 California drivers, Johnson and Keltner (1983) found that 3–3.5 percent of the population exhibited significant visual field abnormalities. However, the prevalence of visual field loss was much greater in the older population, increasing to 7 percent for individuals aged 60–65 and more than 13 percent for those over 65. Only one-third of individuals with visual field loss demonstrated binocular (both eyes) defects, which were found to be associated with an increased number of driving accidents and convictions relative to those with visual field loss in only one eye. Many subsequent investigations have examined the effect on driving performance of visual field loss produced by ocular and neurological impairment.
Although it is possible to perform visual field testing using manual procedures, such methods are susceptible to high rates of both false-positive and false-negative errors unless performed by specially trained personnel using appropriate equipment. Automated visual field testing is a preferred method of evaluation because it affords a greater degree of standardization and reliability. Automated rapid screening procedures are available for visual field testing, although the cost of such equipment remains rather high.
Depth Perception (Stereopsis)
Stereopsis refers to the process by which the slight differences in the location of images in the two eyes (retinal disparity) result in an impression of depth for objects located at different distances from an observer. It is one
of many cues for depth, and is most important for tasks at distances nearer than 4 feet (e.g., threading a needle) where other depth cues are absent. At long distances, stereopsis is only a minor cue for depth, with linear perspective, size, overlapping or relative movement of objects, shadows, and other cues being more important for depth perception. Stereo acuity or stereopsis is measured in terms of the differences in angle between the two eyes and is usually represented in seconds of arc. Under optimal conditions, skilled observers are able to produce thresholds of 3–5 seconds of arc (approximately 10 to 20 times better than for visual acuity). For this reason, stereo acuity is often regarded as a “hyperacuity” function of the visual system. A number of tests (both automated and manual) are available commercially for performing rapid-screening evaluations of stereo acuity.
As noted, stereopsis is just one of a number of cues or sources of depth information that are available to an observer. To the extent that other sources of this information are available, stereopsis probably is not required for performing depth discriminations. Additionally, stereopsis is often quite a slow response function, so it may not be useful for tasks that require rapid visual inspection. Because stereopsis involves the resolution of very fine spatial differences between the two eyes, it is easily disrupted by a wide variety of visual anomalies and is, therefore, an effective screening test for ocular pathology, such as amblyopia. With the exception of such specialized jobs as stereophotogrammetry (e.g., 3D mapping of aerial photographs), there is little information to suggest that stereopsis is a critical visual component of job-related tasks or an important component of activities of daily living and quality of life.
Dark Adaptation and Night Vision
Dark adaptation refers to the increase in sensitivity of the visual system under low illumination or darkness. For most portions of the visual field, the dark adaptation process is described by a two-part function. During the initial 5–10 minutes of dark adaptation, the cone photoreceptor system (used for daylight vision) achieves its maximum sensitivity. This is followed by an additional increase in sensitivity produced by recovery of the rod photoreceptor system used for nighttime vision (30–40 minutes for full dark adaptation). Dark adaptation is an important visual function that may have implications for visual performance in dimly illuminated environments. However, its measurement is difficult for large populations because it requires a large amount of time (about 45 minutes per person), careful control of preadapting test conditions, a completely “light-tight” test facility, precise calibration of equipment, and personnel with training in this type of vision testing. (A review of dark adaptation and all aspects of night vision is available in NRC [1987].)
Dark adaptation and night vision are known to be compromised in a number of eye diseases, in particular those preferentially affecting rod function, such as retinitis pigmentosa. These patients may be severely disabled in darkened surroundings that may be important for job-related activities. However, job accommodations may be possible, and in more advanced disease, these patients are more severely disabled by the loss of more primary visual functions, such as peripheral field extent and visual acuity. As noted above, moreover, adequate testing of night vision capabilities imposes a number of difficult requirements. In addition, there are significant degradations in night vision sensitivity with age, as well as large individual differences. As a consequence, a rapid, simple test of night vision is not available.
Glare Disability and Glare Recovery
Glare refers to the disruption of vision from the presence of a veiling light source in the visual field, such as the oncoming headlights of an approaching vehicle at night. Light from this source is scattered by the optical components of the eye and degrades contrast of the images of other objects. Problems with glare are typically greater under low-luminance viewing conditions. Glare disability is usually measured in terms of the decrement in visual function (e.g., visual acuity) that occurs in the presence of the glare source compared with visual function in its absence. Glare recovery refers to the amount of time needed to reach visual performance equivalent to the level prior to being exposed to the glare source. Both glare disability and glare recovery are important factors related to driving at night. Glare disability becomes greater in older age groups.
Several problems are associated with the use of glare as a screening test for visual performance. First, there are large individual differences in glare disability at all ages, but especially in older age groups. Second, some tests of glare disability focus on the transient adaptation problems associated with the presence of a glare source (glare recovery), whereas others focus primarily on the presence of a steady glare source. Third, no standard methodologies, stimulus conditions, measurement techniques, or test protocols have been established for glare disability. At least two dozen different devices and techniques are currently used for glare testing, each of which yields different results. This variation also makes it difficult to examine the prevalence of glare disability problems in the general population.
Color Discrimination
Color vision, or the ability to perform discriminations on the basis of wavelength differences among stimuli, is a primary means by which objects are discriminated in the environment. Some visual tasks, such as detection
and recognition of traffic lights, warning signs, and taillights and their increased brightness produced by braking, may rely on color vision.
Normal color vision is referred to as trichromacy. Color-deficient observers are described as anomalous trichromats, dichromats, or monochromats, depending on the severity of the impairment. Anomalous trichromats are the most similar to normal color observers, except they differ in various degrees with regard to how color mixtures appear. A number of studies related to color vision and job performance have revealed that, with the exception of certain specialized jobs (e.g., diamond grading, quality control of dyes or paints), individuals with mild to moderate anomalous trichromacies are able to perform job-related color discriminations with little or no problem. Vivid colors such as those used for traffic lights and warning signs can readily be distinguished by individuals with mild to moderate color vision deficiencies; such individuals confuse only very desaturated or pastel colors. Approximately 8 percent of the male population has color vision deficiencies of one form or another; women are much less likely to be affected by such deficiencies, which are most commonly due to genes on the X chromosome. In general, deficient color vision does not appear to be a factor that meaningfully impacts quality of life or activities of daily living, including job-related activities.
Summary
Vision problems affect productivity, activities of daily living, and quality of life. Visual acuity, the most commonly used index of visual capacity, is measured with the use of high-contrast letters. In addition, peripheral vision (visual field status) is one of the most important factors in predicting the mobility skills of individuals with vision loss.
HEARING ASSESSMENTS4
Approximately 30 million Americans of working age are estimated to have significant hearing loss in both ears, and an additional 18 million are estimated to have hearing loss in one ear (Lin et al., 2011). The proportion of Americans with hearing loss who are of working age and use hearing aids, cochlear implants, or other assistive technologies has not been definitively reported in the literature. Overall hearing aid market penetration data cited by the President’s Council of Advisors on Science and Technology in 2016 suggest that only about 15 to 30 percent of the 30 million adults who could benefit from amplification use a hearing aid (Abrams and Kihm,
___________________
4 This section draws heavily on a paper commissioned by the committee for this study (McCreery, 2018).
2015; Chien and Lin, 2012; Kochkin, 2009). This means that a majority of adults with hearing loss are likely to experience hearing-related difficulty in the workplace. Therefore, functional assessment of hearing is critical to ensure participation, safety, and efficiency in the workplace.
Occupations vary considerably in hearing-related performance requirements and environmental conditions that are likely to affect the assessment methods used to measure functional hearing. Occupational requirements for hearing encompass communication with others, including one-on-one and group conversations, as well as use of a telephone or radio; listening in high levels of background noise; and environmental awareness of sound related to changes in working conditions (Montgomery et al., 2011; Punch et al., 1996; Tufts et al., 2009). Many considerations involved in functional hearing assessment are context dependent. As a result, numerous assessment techniques have been developed to quantify functional hearing ability related to occupational requirements in adults. This section provides an overview of the methods used to assess functional hearing for occupational standards across a wide range of contexts. Annex Table 5-7 lists selected instruments used to measure hearing function.
Considerations for Functional Hearing Assessment
Hearing is a complex process involving multiple levels of sensory processing that are often organized hierarchically (Tye-Murray, 2014). Hearing assessments can be categorized by the level of auditory skills required to complete a given task. Erber (1982) describes four categories of auditory skills for assessment: sound awareness, sound discrimination, sound identification, and comprehension. Sound awareness, the most basic level of auditory function, refers to the ability to detect the presence or absence of sound. Sound discrimination is the ability to determine when a sound is different from another sound or changes over time. Sound identification occurs when a listener is able to label or categorize an auditory signal. Comprehension, the highest level of the auditory skills hierarchy, requires the listener to understand and interpret incoming auditory stimuli. Each level of the auditory skills hierarchy is dependent on the skills lower in the hierarchy. Functional assessment of hearing for purposes of occupational fitness draws on tests that assess each of these auditory skill levels.
Auditory–verbal communication with other people in occupational contexts requires that an individual be able to function at all four levels of the auditory skills hierarchy. This interdependence across levels of auditory skill has led to two distinct approaches to functional hearing assessment related to occupational listening environments. The first approach is foundational in that it measures the individual level of hearing acuity and attempts to estimate the impact of environmental factors (such as levels of
background noise or reverberation) on higher-order auditory skills using models that predict performance in realistic listening environments (e.g., Soli et al., 2018a). The second approach attempts to measure an individual’s auditory performance using tasks that directly involve higher-order auditory skills, such as identification or comprehension. Such approaches may also entail recreating elements of a real-world listening environment in order to measure functional hearing as it would be used for specific employment tasks (e.g., McGregor, 2003).
Foundational approaches to functional hearing assessment are useful at predicting functional hearing abilities at the group level (Soli et al., 2018a), but also may have difficulty predicting performance at the individual level or for highly specific work environments. Because such approaches do not measure higher-order auditory skills directly, they may not be sensitive to auditory problems that have isolated effects on higher-order auditory functions. Direct measurement of higher-order auditory skills, on the other hand, can also be limited by their specific characteristics. For example, a functional assessment of hearing on a radio or telephone may not generalize to other occupational activities, such as face-to-face communication or detection of alarms or auditory signals from equipment. For these reasons, functional hearing assessments related to employment often combine both types of approaches to reflect both hearing abilities that apply more generally to overall functioning in the workplace and those applicable to tasks that may be highly specific to an occupation.
Functional Hearing Assessments
The order in which functional hearing assessment methods are described here is based on the hierarchy of auditory skills discussed above (Erber, 1982), from awareness of sound to comprehension-level tasks.
Pure-Tone Audiometric Screening
Hearing screening with pure-tone stimuli at the frequency range most important for speech understanding is a common method for determining the presence or absence of hearing loss in adults (McBride et al., 1994; Yueh et al., 2003). Pure-tone screening generally involves presenting one or more pure-tone signals in the frequency range for speech (500–4000 Hz) at a single level in each ear. If the listener responds to the sound at that level, he or she passes the screening; if not, the listener is referred for further diagnostic assessment. Pure-tone hearing screening can be accomplished by physicians, nurses, or trained medical assistants in an office setting using handheld or portable devices. Its sensitivity ranges from 0.96 for detecting high-frequency hearing losses to 0.64 for detecting low-frequency hearing
losses (McBride et al., 1994). Sensitivity increases as the number of different frequencies in the screening test is increased. The specificity of pure-tone screening ranges from 0.77 to 0.89 across studies (Lichtenstein et al., 1988; Yueh et al., 2003).
The advantages of pure-tone hearing screening are that it requires minimal expertise to administer and interpret, can be conducted in a quiet office setting, and can be administered in just a few minutes. The screening also can be administered to listeners with any language background. The disadvantages of pure-tone hearing screening are that it does not provide information about the type, degree, or configuration of hearing loss and may be contaminated by ambient room noise, particularly at low frequencies.
Otoacoustic Emissions Screening
Otoacoustic emissions (OAEs) are an acoustic response that originates from the outer hair cells in the healthy cochlea within the inner ear. The OAE response is measured using a soft probe placed in the ear canal that presents auditory stimuli to the ear and uses a microphone to measure the OAEs that occur in response. Ears with measured OAEs are considered to have normal cochlear function, whereas absent OAE responses are associated with at least mild cochlear hearing loss. OAE screening has been widely used in hearing screening for newborns (e.g., Gorga et al., 1997) but has also been proposed as an objective hearing screening test for adults for occupational and medical screening purposes (Hotz et al., 1993; Wang et al., 2002). OAEs can be measured in a few minutes per ear by a physician, nurse, or trained medical assistant in a quiet office setting.
In adults, the sensitivity of OAE screening for hearing loss ranges from 0.91 to 0.98, with specificity ranging from 0.62 to 0.86 (Wang et al., 2002). The advantages of OAE screening for adults are that it is an objective measure that requires no response from the listener and can be administered by a trained medical assistant in a quiet office setting. The disadvantages are that the absence of OAE responses does not provide information about the type or severity of hearing loss, OAEs do not predict functional hearing ability in real-world environments, and the screening can be affected by middle-ear dysfunction or contaminated by ambient room noise.
Assessment of Localization
The ability to determine the location of sounds in a listening environment can be an important functional hearing ability for specific occupations. Additionally, protective equipment may reduce environmental awareness of sound, including the ability to determine its location. Localization tasks spatialize sound in a test environment using multiple sound sources or
speakers. Listeners must respond by indicating the direction of sounds, typically along the azimuthal plane (Abel et al., 2009; Przewozny, 2016). Localization tests must be administered by an audiologist or scientist with expertise in spatial hearing in a sound-treated audiometric test booth or anechoic chamber. Localization tasks can be administered using loudspeakers or under headphones using head-related transfer functions (Wenzel et al., 1993).
The test-retest reliability of localization tasks is reported to be 0.8 (Häusler et al., 1983), with localization differences ranging from 1 to 3 degrees. Localization tasks have advantages that include high ecological validity for spatialized sound in real-world conditions and assessment of the ability to locate sound in space. However, localization tasks have not been widely adopted because of technical challenges in their implementation, the requirement for specialized equipment and spaces, and the lack of commercially available tests or software with which to administer the tasks.
Diagnostic Pure-Tone Audiometry
Pure-tone audiometric threshold assessment is currently the gold standard for functional hearing assessment (ASHA, 2005). Pure-tone audiometry varies the level of pure-tone signals at multiple frequencies to determine the threshold of hearing for the frequency range of speech. Signals can be presented through air and bone conduction to help determine the specific site of lesion for hearing loss. Unlike pure-tone screening, which results only in a pass or refer result, diagnostic pure-tone audiometry makes it possible to determine the type (conductive, sensorineural, or mixed), degree (mild, moderate, severe, or profound), and configuration (flat or sloping) of hearing loss.
Diagnostic pure-tone audiometry is typically conducted by a licensed audiologist in a sound-treated audiometric test booth (ASHA, 2005). Its test-retest reliability is 0.92, with differences of 3–5 decibels (dB) between repeated tests (Roeser et al., 2000). Pure-tone audiometry has advantages that include the specification of hearing sensitivity at multiple frequencies important for communication. In addition, the degree of hearing loss determined from the audiogram has been shown to predict a range of outcomes in real-world listening environments (e.g., Woods et al., 2013). However, the disadvantages of this method are also notable, including the fact that audiometric thresholds do not measure auditory skills above the level of detection, and are unlikely to reflect listening performance in background noise or with reverberation without additional interpretation. Moreover, because pure-tone audiometry is most often conducted by an audiologist in a sound-treated booth, it may be impractical in some situations, limiting access for specific populations.
Extended Speech Intelligibility Index Methods
The speech intelligibility index (SII) (ANSI S3.5-1997) is a standardized method for predicting the proportion of acoustic information in a speech signal that is audible to a listener in a given situation. The standard approach to estimating SII speech audibility involves a talker who is facing the listener at 1 meter away, speaking with normal vocal effort and in a quiet listening environment. Although this standard approach has been useful for estimating the effects of hearing loss and noise on a listener’s access to speech information, recent research has focused on extending the SII estimates into real-world listening environments that workers may encounter on the job (Soli et al., 2018a,b). The extended SII (ESII) methods resulting from this work have been validated to predict speech recognition for adult listeners with normal hearing and those with hearing loss across a range of plausible acoustic environments derived from occupational studies of noise (Soli et al., 2018a). These methods extend the information gathered from the audiogram by incorporating information about ear canal acoustics, background noise and reverberation, and talker-level effects.
The test-retest reliability of ESII methods ranges from 0.78 to 0.97, depending on the listening situation being simulated. The 95 percent confidence interval of the speech recognition prediction obtained with these methods is approximately 7 to 14 percent (Soli et al., 2018a). Because these methods are based on the audiogram, their advantages and disadvantages are similar to those of pure-tone audiometry. An additional disadvantage is that the software for calculating the ESII was not available at the time this report was written.
Speech Recognition in Noise Testing
Speech recognition in noise is an important assessment for determining a listener’s ability to identify speech and communication in real-world environments with background noise. Listeners repeat back words or point to pictures that are presented in a background of noise (Giguère et al., 2008; Laroche et al., 2003). A wide range of different stimuli sets, including nonwords, monosyllabic words, and sentences, are available as recorded materials, including tests in multiple languages other than English. The background noise can consist of steady-state noise (designed to simulate noise from heating, ventilation, and air conditioning systems) or multitalker babble (designed to simulate noise from other people talking). The testing is most often completed under headphones or through speakers by an audiologist in a sound-treated audiometric test booth.
The test-retest reliability for recorded speech recognition materials in noise is above 0.85 (Laroche et al., 2003). The testing generally takes about
15 minutes or less in a clinical setting to provide enough trials for reliable results. The advantages of speech recognition in noise tests are that they have strong face validity because, unlike pure-tone audiometry, they require the listener to perform a task critical to real-world listening and use stimuli likely to be encountered in everyday life. Their disadvantages include that performance on the tests is dependent on the language proficiency of the listener and the tester. Additionally, because the testing is typically conducted by an audiologist in a sound-treated audiometric test booth, some individuals may lack access to this type of assessment.
Live-Voice Speech Testing
Because audiometric test equipment and facilities are not always available, physicians and other medical providers have used live-voice speech testing to screen for hearing loss in medical office settings. The person administering the test often stands behind or out of view of the listener and says words or phrases at an average or soft speech level. The listener must accurately repeat the words or phrases back to pass the screening. One study found sensitivity of 100 percent for detecting hearing loss and specificity of 84 percent for whispered speech in an office setting (MacPhee et al., 1988). Live-voice speech testing can be administered in only a few minutes in the native language of the listener. The advantages of live-voice speech testing are its ease of administration and the lack of requirements for expensive equipment or spaces. This method also has many disadvantages. Because the live voice cannot be calibrated, there is likely to be substantial variability among and within talkers across tests that threatens the method’s reliability. Live-voice speech testing is also influenced by the dialect of the talker and ambient room noise. There is no evidence at this time to suggest that this method can predict communication or hearing in occupational environments with background noise and reverberation.
Internet and Telephone Hearing Screening
Efforts to increase access to functional hearing assessments for individuals not in close geographic proximity to hearing health care providers has led to the development of Internet and telephone methods (Laplante-Lévesque et al., 2015; Smits et al., 2004, 2006; Watson et al., 2012). In most cases, such tests present speech to a listener either via Internet connection to a computer or over a terrestrial phone line. The listener registers a response either by typing a response into the computer or speaking. Results indicate a strong correlation with results of pure-tone diagnostic tests (0.73) and sensitivity for significant hearing loss of 0.80, with specificity of 0.83 (Watson et al., 2012). The advantage of Internet and telephone hearing
screening is in providing access to a hearing screening for anyone with an Internet connection or telephone. Telephone-based hearing tests have the disadvantage of not currently being validated for cellular telephones, although this weakness is mitigated by the fact that many cellular phones have data connections that allow for an Internet-based application of the test. Additionally, as with other screening methods, the results of Internet and telephone hearing screening do not provide direct information about occupational function in real-world listening environments, only whether hearing is normal or abnormal. Results may also be affected by the quality of the transducers if the listener is using a computer.
Hearing Questionnaires
Questionnaires have been developed for assessing functional hearing in occupational settings. Published data are available for two questionnaires for adults in the workplace: the Hearing Handicap Inventory for Adults (HHIA) (Newman et al., 1990) and the Speech, Spatial, and Qualities of Hearing Questionnaire (SSQ) (Gatehouse and Noble, 2004). The HHIA has 25 items and can be self-administered. It has been shown to be related to both pure-tone audiometric data and speech recognition abilities (Newman et al., 1990). Its internal reliability based on Cronbach’s alpha is 0.93, and its test-rest reliability is reported as 0.97 (Newman et al., 1991). The SSQ has multiple versions. One of these, the SSQ5, is a five-item version that has been used to assess hearing loss in individuals of employment age (Demeester et al., 2012). The SSQ has reported test-retest reliability of 0.83 for interview-based administration and 0.73 for self-administration (Singh and Pichora-Fuller, 2010). The advantages of both the HHIA and SSQ questionnaires are that they can be used to assess a person’s self-perceived hearing difficulty in ecologically relevant employment contexts. Their disadvantages are that they may not always be available in the language of the listener and may not assess a wide range of work-related hearing challenges that are relevant to specific occupations.
Effects of Environmental Conditions on Hearing
The environmental conditions of the work environment have significant effects on individuals’ hearing for the purposes of communication. Of these conditions, the presence of noise or reverberation has the most significant negative effects. Noise is ubiquitous in most work environments, but the range and type of background noise vary considerably. Proximity to moving mechanical parts and heavy vibration affect verbal communication primarily because both are associated with an increased noise intensity level in the workplace. The presence of noise has negative effects not only on the
ability to communicate but also on the ability to store and process auditory information that is heard.
The ideal listening environment for verbal communication at work is a quiet one with minimal background noise. Noise intensity levels of 45 decibels (acoustic) (dBA) or less provide optimal signal-to-noise ratios for face-to-face and small-group communication. Moderate noise levels in the work environment (45–70 dBA) are likely to have a negative impact on one-on-one and group communication, particularly as the level of the background noise increases. Loud working environments (70–85 dBA) are likely to have a significant negative impact on communication, including one-on-one communication, group meetings, and communication by radio or telephone (see Soli et al., 2018b, for examples). Communication in very loud environments (>85 dBA) is difficult across all verbal communication contexts. The level of the noise in such environments is likely to require hearing protection devices, preventing any verbal communication or awareness of alarms or auditory signals. In addition to the effects of noise on verbal communication, limited environmental awareness of noise is a significant safety risk. Picard and colleagues (2008) report that up to 12 percent of workplace injuries in a large study of more than 40,000 claims could be accounted for by the interaction of hearing-related factors and background noise.
Effects of Hearing Loss on Work-Related Hearing Function
The presence of hearing loss can present particular challenges for communication in the workplace (Jennings and Shaw, 2008). Even with workplace accommodations, hearing loss can reduce participation in employment by 10 to 15 percent (Hogan et al., 2009).
The degree of hearing loss identified from a pure-tone audiogram can serve as a reasonable predictor of difficulty with workplace communication. Although individual performance varies considerably based on the degree of hearing loss, use of hearing technology, and occupational hearing requirements, problems with communication in both quiet and noisy environments increase as the degree of hearing loss increases (Kramer et al., 2006). A mild degree of hearing loss (25–45 decibels hearing level [dB HL]) is likely to have a minimal effect on one-on-one communication or communication by radio or telephone for adults, with performance near 100 percent accuracy. Such individuals will not have difficulty communicating in meetings or even in the presence of background noise. A moderate degree of hearing loss (50–65 dB HL) is often associated with a decrease in the accuracy of speech recognition of 20–30 percent (Dubno et al., 1984; Humes, 2002) and increased effort for one-on-one communication and communication by radio or telephone, along with significant difficulty communicating in the
presence of background noise. A severe degree of hearing loss (70–90 dB HL) is associated with a limited ability to understand words or sentences for communication purposes. Even in quiet environments or with visual cues, recognition is often less than 50 percent for such individuals (Dubno et al., 1984; Grant et al., 1998). A profound degree of hearing loss (greater than 90 dB HL) is associated with limited ability for verbal communication in either quiet environments or those with background noise. People with mild to severe hearing loss can improve communication by using hearing aids, while those with severe or profound hearing loss can improve their auditory access through cochlear implants.
Predictions of workplace performance can be enhanced by using estimates from the ESII (Soli et al., 2018a,b) to predict speech recognition in specific work environments. Other functional hearing assessments may serve as indicators for occupational challenges related to hearing. Poor understanding of speech, even with the use of hearing aids or cochlear implants, may be an indication that an individual listener will have difficulty performing hearing-related occupational functions. Clinical assessments of speech recognition are conducted under controlled conditions, which means that these scores represent an optimistic estimate of real-world communication performance (Giguère et al., 2008). High scores on questionnaires, such as the HHIA (Newman et al., 1990), can indicate that an individual is likely to experience communication difficulty in real-world environments, including the workplace. While the presence of hearing loss increases challenges related to occupational function, the use of hearing aids, cochlear implants, or hearing assistance technology should lower HHIA scores over time and can help increase workforce participation for people with hearing loss.
Summary
Functional hearing assessments related to employment often combine two approaches to reflect both hearing abilities that apply more generally to overall functioning in the workplace and those applicable to tasks that may be highly specific to an occupation. Currently, pure-tone audiometric threshold assessment is the gold standard for functional hearing assessment. The assessment can serve as a reasonable predictor of difficulty with workplace communication, because it makes it possible to determine the type (conductive, sensorineural, or mixed), degree (mild, moderate, severe, or profound), and configuration (flat or sloping) of hearing loss. Speech recognition in noise testing is an important assessment for determining a listener’s ability to identify speech and communication in real-world environments with background noise. Hearing questionnaires such as the HHIA and the SSQ can be used to assess a person’s self-perceived hearing
difficulty in ecologically relevant employment contexts; however, they may not assess a wide range of work-related hearing challenges that are relevant to specific occupations.
SPEECH AND LANGUAGE ASSESSMENTS5
Communication disabilities can profoundly influence a person’s life, impacting his or her ability to work, interact, and engage with others. The American Speech-Language-Hearing Association (ASHA) describes a communication disorder as “impairment in the ability to receive, send, process, and comprehend concepts or verbal, nonverbal and graphic symbol systems” (ASHA, 1993). In the context of functional abilities relevant to work requirements, an individual’s comprehension of language produced by the communication partner, processing of that language, expression of his or her own ideas, and pragmatic interactions in dialogue appropriate to the work context are all relevant to assessing such disorders for purposes of disability determination. The ORS Collection Manual definition of speaking encompasses skills necessary for “expressing or exchanging ideas by means of the spoken word to impart oral information to clients or the public and to convey detailed verbal instructions to other workers accurately, loudly, or quickly” (DOL, 2018, p. 125). Based on this definition, specific aspects most relevant to assessing a person’s functional communication in an occupational setting include receptive-expressive language (i.e., to impart information or exchange ideas) and speech production (i.e., accuracy, loudness, and speed). A person’s ability to participate in certain work settings may include other aspects of functional communication (e.g., alternative expressive modalities, nonverbal interactions, written language, social communication). This section focuses on speech and language assessment for the purposes of determining and describing functional communication skills, with particular attention to employment-related interactions. Selected instruments for assessing speech and language function are listed in Annex Tables 5-8 and 5-9, respectively. This section provides an overview of functional communication, followed by a review of assessment instruments for the physical and mental components of such communication.
Understanding Functional Communication
Functional communication comprises both speech (i.e., verbal speech production) and language (i.e., comprehension and/or production of phonology, morphology, syntax, semantics, pragmatics) mechanisms (ASHA,
___________________
5 This section draws heavily on a paper commissioned by the committee for this study (Ball, 2018).
n.d.). Given the physical planning and execution of oral-facial movements to produce speech, speech is considered a physical process for purposes of this discussion; similarly, language involves cognitive processing and formulation and therefore is considered a mental process.
There are many different definitions for functional communication. One definition of functional communication as the “ability to communicate basic physical needs and emotional states” has been used by funding agencies attempting to limit resource outlays (Elman and Bernstein-Ellis, 1995). In some cases, this practice has resulted in discontinuing treatment when an individual simply achieves the ability to express very basic needs, but has not yet advanced to be capable of more complex occupation-specific communication (Elman and Bernstein-Ellis, 1995). In such cases, much of the information available in assessment and treatment records does not directly address the individual’s functional abilities for work, yet clearly these individuals are likely to have a restricted employment outlook.
The ORS Collection Manual (DOL, 2018) implies that functional communication involves effective communication skills in natural environments (e.g., with respect to setting [indoors, outside, noise, light]) with typical communication partners (e.g., one-on-one, groups). Effective communication yields the intended result or response and, particularly in many employment settings, is efficient in getting the message across (Hustad, 1999). Components of functional communication in an employment situation include (1) the physical and cognitive characteristics of the people interacting; (2) the content of messages and how they are represented and conveyed (e.g., face-to-face, by phone); (3) conditions in which messages are transmitted and understood (e.g., immediate or delayed timing, noise or quiet, bright or dim light, office or warehouse); (4) societal relationship (e.g., familiar or unfamiliar, boss or employee, educator or student); and (5) interaction purposes (e.g., distributing information, expressing attitudes, social relations) (Blackstone et al., 2007; Light, 1988).
Myriad factors contribute to functional communication, including personal (individual) skills, environmental conditions, and the skills of communication partners. At the level of the individual, physical factors specific to communication (articulation accuracy, speaking rate, voice quality, loudness, fluency, effort, and fatigue) affect the intelligibility and comprehensibility of speech production. Mental factors specific to communication at the individual level (receptive, expressive, pragmatic language skills) affect message comprehension. And because communication is a dynamic, transactional process that involves at least two people, characteristics of communication partners (e.g., personal factors, sensory skills, motivation) and other external factors (e.g., environmental conditions, adaptations) also play a critical role in functional communication. These factors, along with the anticipated course and severity of the communication impairment,
whether physical or mental in nature, will impact assessment results and need to be considered in determining current and longitudinal employment expectations.
At present, insufficient research is available regarding assessment of functional communication; therefore, limited standardized measures exist for this purpose. The descriptions of assessment instruments that follow were derived from the few such instruments that have been published and the literature. These instruments, which reflect standard clinical practices in the field of speech-language pathology, are often supported by only a few studies. Speech-language assessments are performed by speech-language pathologists (SLPs), who have expertise in assessment, differential diagnosis, and treatment of communication disorders. These assessments may be completed for many purposes (e.g., detect and describe a problem, establish diagnostic options, establish a diagnosis, specify severity, determine implications and functional impacts) (Duffy, 2013). They may include observation of interactions, standardized and/or criterion-referenced tools, instrumentation (e.g., endoscopy, aerodynamics, ultrasound), prior test results, and history (ASHA, 2016). A key consideration in assessment is to examine the individual’s ability to successfully access test items. Attempts to adapt various testing materials for persons with physical disabilities may introduce errors in measurement, thus decreasing validity and reliability. Although Ratcliff (1994) and White and colleagues (2010) studied children, the research provides legitimate considerations for adults. That is, changing the way an individual accesses a test instrument may impose additional cognitive and physical challenges that can impact performance and lead to an inaccurate estimation of actual ability.
Clearly, a major factor in functional communication is the severity of an individual’s communication impairment. Communication impairments, whether physical or mental in nature, can range in severity from mild to profound. Some assessment instruments with standard protocols include a description of severity, while for others, severity is determined by percentage of occurrence, by levels of impact on daily activities, and in some cases by the individual’s need for additional supports. Often, severity is rated by the SLP evaluator, the individual, and communication partners using a scale ranging from 0 (normal, minimal disturbance) to 6 (extreme/aphonic). Severity is discussed in greater detail later in this section.
Assessment of the Physical Components of Functional Communication
Any component of speech impairment may result in impaired functional ability to communicate verbally in the context of work. The focus in this section is on those physical aspects of functional communication most
relevant to adults communicating in a work setting: speech (i.e., sound accuracy), voice (i.e., quality, loudness), and fluency (i.e., smooth flow).
Speech
Common measures of speech sound production focus on body structure and function aspects of speech impairments that are used to establish a diagnosis and identify targets for intervention (WHO, 2002). At present, the gold standard for speech assessment involves auditory-perceptual analysis of productions by an SLP experienced with these impairments and the associated assessment procedures (Duffy, 2013). Although this assessment approach is dependent on the SLP’s perceptual skills, evidence supports its effectiveness in differential diagnosis and severity scoring, with high intrarater reliability (Mumby et al., 2007). Annex Table 5-8 lists published tests that are effective for evaluating the accuracy of speech sound productions in various contexts, including
- Frenchay Dysarthria Assessment (Second Edition) (FDA-2) (Enderby, 1983; Enderby and Palmer, 2008),
- Dysarthria Examination Battery (Drummond, 1993),
- Quick Assessment for Dysarthria (Tanner and Culbertson, 1999),
- Apraxia of Speech Rating Scale (Strand et al., 2014), and
- Apraxia Battery for Adults (Second Edition) (Dabul, 2000).
Although the results of this auditory-perceptual assessment contribute to understanding an individual’s speech impairment, the extent of the impairment’s impact on functional communication and work participation can be judged based on measures of intelligibility (i.e., decontextualized words, sentences) (Ishikawa et al., 2017; Kent et al., 1989; McAuliffe et al., 2010; Patel et al., 2014; Stelzle et al., 2013; Yorkston et al., 1992); efficiency (i.e., rate of intelligible/comprehensible utterance production) (Przysiezny and Przysiezny, 2015; Ross and Wertz, 2003; Yorkston and Beukelman, 1981); and comprehensibility and listener comprehesion (i.e., words, sentences, discourse in context) (Hustad, 2008). Together, these features of speech contribute to communication effectiveness, including in a work context.
Intelligibility and efficiency Sentence intelligibility assessment tasks are typically concerned with quantifying the severity of a speech impairment or level of performance (Yorkston et al., 1992). Clinically defined as the extent to which a listener understands a person’s speech, intelligibility is a critical measure of the severity of a communication disorder (Yorkston et al., 2010). Assessment methods used to estimate levels of intelligibility include direct amplitude estimation, Likert-type scales, and categorical estimation
(McAuliffe et al., 2010). Evidence suggests that estimation procedures yield less accurate and more variable results among speakers relative to word-byword transcription measures of intelligibility, which yield more consistent results across speakers (Hustad, 2006). Intelligibility has a ceiling and floor effect; thus it is limited in sensitivity to a narrow range of severity (Yorkston and Beukelman, 1981). A broader index of speech performance is obtained by combining measures of speaking rate and intelligibility, which helps illuminate the complex interaction necessary for functional communication (Yorkston and Beukelman, 1981; Yorkston et al., 1992).
A measure of sentence production will provide a decontextualized assessment of speech performance. Published measures of intelligibility for literate English-language speakers (see Annex Table 5-8) include the Assessment of Intelligibility in Dysarthric Speech (Yorkston and Beukelman, 1981) and its computerized version, the Speech Intelligibility Test (Yorkston et al., 2007). Both versions quantify word and sentence intelligibility (percent of intelligible words) and speaking rate (words per minute), and provide a measure of communication efficiency (ratio of intelligible words per minute). Intelligibility is calculated by dividing the number of correctly identified words by the number of possible words (Yorkston et al., 1996, 2007). The reliability of this instrument has been established for interrater agreement (score dispersion, variance), with reliability coefficients of 0.93 to 0.99 for intelligibility and 0.99 for rate of intelligible speech (Yorkston et al., 2007).
Comprehensibility and listener comprehension Different from intelligibility, comprehensibility is the extent to which a listener understands the speech produced when provided with all available additional information that may add to understanding, or within context (Duffy, 2013). Although measures of intelligibility illustrate the severity of communication impairment, the direct relationship of intelligibility with functional communication remains unclear, as it has not shown to be a significant predictor of the effectiveness of communication (Donovan et al., 2008). The addition of comprehensibility measures to intelligibility measures can provide a more thorough understanding of the “information-bearing capability” of a person’s speech (Hustad, 2008).
Comprehensibility assessment yields a valid measurement of the functional participation impacts of a speech impairment (Duffy, 2013). One method for assessing comprehensibility is to provide two transcriptions: first, the individual is recorded saying a list of prearranged utterances, and a transcriptionist transcribes this recording for intelligibility and speaking rate efficiency (i.e., intelligible words per minute); second, the transcriptionist is provided with a contextual statement for each spoken utterance, and
then transcribes for comprehensibility and speaking rate efficiency (i.e., comprehensible words per minute).
Similarly, listener comprehension tasks require listeners to decode speech signals and subsequently process the linguistic information (Marslen-Wilson, 1989). Listener comprehension tasks gauge a communication partner’s ability to interpret the meaning of messages produced without regard for speech accuracy (e.g., regardless of inaccuracy, dysfluency, or reduced loudness). Listener comprehension is calculated by the listener’s ability to answer questions about or summarize message content (Hustad and Beukelman, 2002). As yet, there is no known standardized assessment protocol for measuring comprehension or comprehensibility, nor is there a definitive metric for determining the threshold of comprehensibility for functional interactions. One strategy for obtaining this information is for the evaluator to devise a set of content-based questions about a passage or set of utterances and ask a listener unfamiliar with the material to respond to the questions after listening to the speaker relate them (Hustad and Beukelman, 2002). Comprehension is quantified by dividing the number of correct responses to content questions by the possible number correct (e.g., (# correct responses/# content questions) × 100 = % comprehension).
Communication effectiveness The Communication Effectiveness Index, developed to assess functional communication among individuals with aphasia, can be used to evaluate progress toward the recovery of communication ability (Lomas et al., 1989). This tool was subsequently adapted for use by individuals with amyotrophic lateral sclerosis (ALS) and found to have high internal test reliability (r = 0.97) and strong correlation (r2 = 0.80, p < 0.01) between ratings obtained from individuals with ALS and their communication partners (Ball et al., 2004). The adapted index, the Communication Effectiveness Survey, was recently found to have construct validity and statistical significance (Donovan et al., 2008). It also identified differences between individuals with speech disorders and with no speech disorder (Donovan et al., 2008). Annex Table 5-8 includes other available measures that can be used to assess communication effectiveness.
Voice
As with assessment of speech, elements of a clinical voice assessment generally focus on body structure and functional aspects of voice. Less helpful for assessment of overall performance are analyses of discrete subsystems (pitch/frequency, loudness/intensity, quality/sound wave complexity, duration/respiratory-phonatory control, and muscle tension). One purpose of the SLP evaluation is to assess voice production and determine the impact of impairments on daily interactions (ASHA, 2004).
The variability of assessment procedures has led to a recent attempt to standardize protocols for acoustic and instrumental assessments of vocal function (ASHA DIV3, n.d.; Patel et al., 2018; Roy et al., 2013). Instruments are now available for measuring the severity of voice impairment (Awan et al., 2009). The Cepstral Spectral Index of Dysphonia is a multifactorial assessment of voice severity in connected speech. This index discriminates normal from impaired voice, and its results correlate with a visual analog scale rating of overall voice impairment severity on the Consensus Auditory-Perceptual Evaluation of Voice (Awan et al., 2010, 2016; Patel et al., 2018; Peterson et al., 2013; Zraick et al., 2011). As previously discussed, most commonly used clinical assessment procedures involve auditory-perceptual evaluation of voice and may include categorical ratings (mild, moderate, severe), equal appearing/visual analog scales, or direct magnitude estimation (see Table 5-2).
A recent review of patient-report measures identified a group of measures addressing voice impairments from a broad perspective (i.e., some targeting specific disorders, such as spasmodic dysphonia) with strong psychometric characteristics. The integration of these measures into voice assessment provides supportive evidence of the consequences of voice disorders directly from the affected individual (Francis et al., 2017). Annex Table 5-8 contains selected measures addressing general voice impairments.
Fluency
Fluency in speech refers to continuity, smoothness, rate, and effort. Stuttering is a disorder in the rhythm of speech in which the individual knows what he or she wants to say but is unable to say it because of involuntary, repetitive prolongation or cessation of sound (Andrews et al., 1983). The disorder may include repetitions (sounds, syllables, words, phrases), word avoidance, sound prolongations, blocks (difficulty starting a sound), and interjections of unnecessary sounds in speech (Craig et al., 1996). Many assessment instruments focus on discrete aspects of speech (e.g., sound repetitions, number of prolongations), although they also often involve a greater focus on activity and participation interactions relative to assessments of other aspects of speech. Fluency assessment involves auditory-perceptual analysis of productions and is completed by an SLP experienced with stuttering. Less helpful for assessment of overall performance are analyses of discrete characteristics (percentage of stuttered syllables, stutter duration, and muscle tension). One purpose of the SLP evaluation is to assess fluency of speech and determine the impact of impairments on daily interactions (ASHA, 2004). Individuals who stutter are at a higher risk of experiencing difficulty obtaining and maintaining
TABLE 5-2
Standard Voice Assessment Procedures, Speech Tasks, and Anticipated Results
| Procedure | Patient Task(s) | Assessment Results | ICF Level | |
|---|---|---|---|---|
| Instrumental | Laryngeal imaging (endoscope) | Inhale-exhale cycles Produce [?i?i?i?i] [i:]-sniff or [i:]-quick inhale Sustained [i:] | Vocal fold edges, mobility, vertical level, closure duration Supraglottic activity Regularity, amplitude Mucosal wave movement Glottal closure, phase symmetry | BSF |
| Acoustic analysis | Standard reading passage Vowel glide [a] Sustained vowel [a] | Vocal sound level, frequency, range, noise (cepstral peak prominence) | BSF ACT | |
| Aerodynamic analysis | Produce [pi:pi:pi:pi] | Glottal airflow rate, pressure Mean frequency, vocal loudness | BSF ACT | |
| Noninstrumental | Consensus Auditory-Perceptual Evaluation of Voice (CAPE-V) | Sustained vowel [a, i:] Sentence production Spontaneous speech | Severity, roughness, breathiness, strain, pitch, loudness | ACT |
| Voice Outcome Survey | Patient report | Emotional, functional, physical aspects of voice | PAR | |
| Voice-related quality of life | Patient report | Physical, socioemotional aspects of voice | PAR | |
NOTES: [?i?i?i?i] refers to production of a glottal stop–vowel combination; [pi:pi:pi:pi] refers to production of a consonant–vowel combination; [a] and [i:] refer to vowel productions. ACT = activity; BSF = body structure and function; ICF = International Classification of Functioning, Disability and Health; PAR = participation.
SOURCE: Assessment procedures adapted and summarized from Patel et al., 2018.
employment (Bloodstein and Bernstein Ratner, 2008; Craig and Calver, 1991; Craig et al., 2009; Klein and Hood, 2004).
Patient-report measures of stuttering with strong psychometric characteristics have been identified (Craig et al., 2009). One example is the Overall Assessment of the Speaker’s Experience of Stuttering, designed to estimate the impact of stuttering on quality of life (Constantino et al., 2016; Siew et al., 2017) (see Annex Table 5-8). The integration of these measures into an assessment provides supportive evidence of the impacts of voice disorders directly from the affected individual (Francis et al., 2017).
The intelligibility and efficiency of speech sound production, and thus functional communication, are affected by effort and fatigue from the perspective of both listener and speaker. For example, although an individual may produce completely intelligible speech via a tracheoesophageal prosthesis following a total laryngectomy (Iverson-Thoburn and Hayden, 2000; Singer and Blom, 1980), the differences between the speech produced in this manner and natural speech require increased listener effort (Nagle and Eadie, 2012). A relationship has been identified between attention allocation (i.e., the amount of effort a listener expends in a conversation) and intelligibility, with the highest levels of attentional need or focus being associated with intelligibility in the range of 75–80 percent (Beukelman et al., 2011). Perceived listening effort (i.e., the amount of effort, attention, or concentration required to understand a speech sample) has a strong negative correlation with intelligibility, and therefore may be useful as an outcome measure (Nagle and Eadie, 2018). Although data are sparse on this question, this measure may serve to supplement objective speech measures of accuracy, intelligibility, and efficiency by illustrating the level of effort involved to sustain performance for functional interactions within a given workplace. Perceived listening effort can be quantified by asking a listener to indicate the effort required on a 10-centimeter vertical visual analog scale marked at the endpoints (0 = very little effort, 10 = extreme effort) after responding to transcription and comprehension questions.
Fatigue may also be experienced by speakers with speech impairments. This is particularly the case for individuals with degenerative disease (e.g., ALS, multiple sclerosis, myasthenia gravis), who may experience rapid declines in speech subsystem performance when in adverse speaking conditions or with repeated or lengthy interactions. In addition to stress testing completed by an SLP, a patient-reported measure of fatigue associated with communication may be included in the assessment process. A strategy similar to that used to measure listener effort can be used for this purpose, with the speaker being asked to indicate the effort required on a 10-centimeter vertical visual analog scale marked at the endpoints (0 = very little effort, 10 = extreme effort) after completing specific speech production tasks.
The Levels of Speech Usage instrument is used for assessment of speech requirements to meet daily communication needs, focusing on variables necessary for functional communication and shifting needs across daily activities (Baylor et al., 2008). With this tool, individuals report the frequency, type, amount, and perceived importance of daily speaking situations (Anderson et al., 2016; Baylor et al., 2008). The results provide categorical ratings of the individual demands of speech (i.e., undemanding, intermittent, routine, extensive, or extraordinary speech usage) (Baylor et al., 2008). Working for pay, time spent talking at work, and education levels are strongly associated with speech usage; in one study, the majority of participants who worked for pay indicated that speech was very to extremely important to their work (Anderson et al., 2016; Gray et al., 2012). Annex Table 5-8 includes available measures that can be used to assess the level of effort and/or fatigue associated with speech production.
Mental Components of Verbal Communication
The mental components of verbal communication addressed here include language skills. Any aspect of language impairment may result in impaired functional ability to communicate verbally within the context of work. The focus of this section is on those aspects most relevant to adults communicating in a work setting: receptive, expressive, and pragmatic language.
Receptive, Expressive, and Pragmatic Language
Language is considered a system “of signs or symbols used according to prescribed rules to convey meaning” (Kent, 1998). Language impairment is generally categorized as a set of specific disabilities impacting a person’s ability to receive, understand, process, produce, and respond to language. Two presentations of language impairment are identified among adults, based primarily on the type of impairment. The first is associated with intellectual disability and/or developmental delay and involves chronically impaired acquisition of language (i.e., receptive, expressive, pragmatic). An example of this type of disorder is that associated with Down syndrome, the most common genetic cause of intellectual disability (Martin et al., 2009). Another example of a developmental disability in which communication is at the core of the impairment is autism spectrum disorder (ASD). In many cases, individuals with this type of language impairment have not fully achieved language proficiency, and, combined with other risks, the impairment adversely impacts them academically and vocationally, with long-term social and economic costs (Williams, 1970). The second type of language impairment is an acquired impairment of language abilities resulting from
damage to portions of the brain responsible for language. For example, aphasia often occurs as a result of brain injury from stroke or trauma but may develop from tumors or progressive neurological disease (NIDCD, 2015). Individuals with this type of impairment have achieved efficient natural language proficiency, often for a number of years, prior to the onset of their loss of language skill.
Although considerable individual variability exists among all causes of language impairment, specific features of language are encompassed by receptive, expressive, and pragmatic skills. In the remainder of this section, three impairments—Down syndrome, ASD, and aphasia—are used to highlight aspects of language impairment and potential influences on employment.
A variety of instruments for assessing language skills among adults exist; some target specific etiologies (i.e., stroke, brain injury, ASD), while others focus on aspects of language skills (i.e., receptive, expressive, pragmatic; see Annex Table 5-9). The focus of many assessment protocols is on identifying the severity of discrete impairments or skills consistent with body structure and function and activity components of the International Classification of Functioning, Disability and Health (Raghavendra et al., 2007; Simeonsson et al., 2012; WHO, 2002). With any assessment, measured severity does “not necessarily relate to measures of life participation … it is not only those with mild aphasia who return to work” (Hinkley, 2002, p. 544); therefore, additional assessment is required to capture potential employment-related communication abilities. In the context of this report, language assessment provides information to assist in determining the ability to express or exchange “ideas by means of the spoken word to impart oral information to clients or the public and to convey detailed verbal instructions to other workers accurately, loudly, or quickly” (DOL, 2018, p. 125).
Receptive language refers to the ability to understand information. It involves understanding spoken words, sentences, and meaning expressed by others within employment (and other) settings. Expressive language refers to being able to put thoughts into words and sentences in a way that makes sense and is grammatically accurate. Expressive language involves speaking words and sentences in a meaningful way to express ideas rapidly and accurately within employment (and other) settings. Pragmatic language refers to the ability to integrate context-dependent aspects of language into interactions relevant during employment-related communication. Discourse—commonly described as any unit of language larger than a single sentence used for a communicative purpose—involves a combination of all three of these language skills and is a crucial component of functional language in an employment setting (Pritchard et al., 2018).
Language Assessment
Formulating a battery of standard language assessments for use in determining an individual’s ability to work involves combining standardized assessment procedures, narrative discourse sampling and analyses, and self- (and communication partner) report measures to examine the impact of language impairments on daily interactions. Annex Table 5-9 summarizes commonly used language protocols in each of these categories (i.e., standard procedures, discourse sampling, patient report). Noteworthy in this table is the number of tests available and the variety of language aspects assessed by each, with the largest focus being on acquired language impairments (i.e., stroke, brain injury). Assessments commonly used to identify discrete language impairments (e.g., body structure and function, activity) include the Boston Diagnostic Aphasia Examination (Third Edition) with the Boston Naming Test (Second Edition) (Goodglass et al., 2000); the Western Aphasia Battery (Kertesz, 2007); the Peabody Picture Vocabulary Test (Fifth Edition) (Dunn, 2018); and the Expressive Vocabulary Test (Third Edition) (Williams, 2018). The protocols range from a broad assessment of language functioning to assessment of specific aspects of language (e.g., picture recall and naming, vocabulary comprehension and expression). Functional language assessment integrates information obtained from these discrete tests with discourse analyses, informant description, and patient self-reports.
Discourse analyses Everyday discourse, such as communication used in descriptions (e.g., describe a work project in detail), recounts (e.g., detail events from a previous meeting), and procedural discourse (e.g., relay instructions to a colleague), entails key interactions expected of many employees. Assessments of discourse require extensive resources. Individuals being assessed typically produce discourse based on an external cue (e.g., topic, image, interview). Their discourse productions are then audio recorded and subsequently manually transcribed. Finally, the transcription is processed using a variety of methods to identify language components (e.g., meaning, topic coherence, reference chains, verb structure and complexity) found to meet acceptability, reliability, and validity standards for clinical assessment (Pritchard et al., 2018). Although discourse analysis is of paramount importance (Wallace et al., 2014), these procedures are rarely performed as components of a clinical assessment because of the prohibitive time, expertise, and training they require.
Informant descriptions and patient self-reports Patient-reported outcomes (e.g., voice-related quality of life measures, communication effectiveness) are important indices of successful communication (Eadie, 2003)
and complement other measurements of language production (Nagle and Eadie, 2012). With these measures, individuals with language impairments complete a structured self-evaluation and report the effects of their communication disability on daily interactions to illuminate functional impacts.
Recently, a number of self-report as well as informant-report measures have been validated for clinical use. Many evaluate communication effectiveness in day-to-day situations, communication quality of life, and overall communication-related function (see Annex Table 5-9). Three frequently used measures address functional communication:
- The ASHA Functional Assessment of Communication Skills for Adults, Revised Edition (Frattali et al., 1995, 2017) measures the functional communication of adults with speech, language, and cognitive-communication impairments. The items on this assessment encompass social communication, communication of basic needs, reading/writing/number concepts, and daily planning.
- The ASHA Quality of Communication Life Scale (QCL) (Paul et al., 2004) measures the extent to which a person’s communication allows participation in life situations. The ASHA QCL captures information about the impact of a communication disorder on communication, interactions, participation (e.g., in social, leisure, work, and education activities), and overall quality of life. It is intended to provide information about the psychosocial, vocational, and educational effects of having a communication impairment. The ASHA QCL is a valid measure of communication-related quality of life for use with adults with neurogenic communication disorders (i.e., aphasia, cognitive communication disorders, and dysarthria).
- The Communication Participation Item Bank is a self-report instrument that can be used to evaluate the extent to which communication disorders impede communicative participation. It is increasingly validated for use with various etiologies (e.g., Parkinson’s disease, spasmodic dysphonia, stroke).
Considerations for Functional Communication
The extent to which communication is functional in a work setting is dependent on (1) the accuracy and effectiveness of an individual’s speech-language communication skills and (2) the communication environment and partner skills. The communication environment links to language disability type; for example, individuals with social communication impairments, such as those with ASD, may be successful with work activities that do not require extensive social interactions (e.g., computer programming, account
management). Figure 5-1 illustrates communication functionality based on the effectiveness of the individual’s skills and the impact of the work environment on situational communication. Each aspect varies, based on the needs of the specific communication act (i.e., face-to-face interactions, small group/conference [business meeting], large group [educator], telephone, intercom, public address system). As is illustrated, an individual with poor communication skills in an employment environment that is also poor for communication (e.g., noise, distance from speakers, rapid response requirement) may have dysfunctional communication. However, an individual with the same poor communication skills may benefit from work-related communication supports sufficiently to become a functional communicator for employment. And a person with good individual communication skills in an adverse work environment may yet require work-related environmental supports for functional communication. The highlighted central areas indicate crossover zones where “fair or good” communication and work environment conditions converge. Assessment will identify the extent to which functional communication is achieved when work environment or individualized communication supports are provided. Employment success will be maximized when the individual is communicating (with or without communication and work environment supports) in one of the three “Functional” quadrants. Therefore, personal communication and work environment adaptations focus on achieving functional communication in that employment setting.
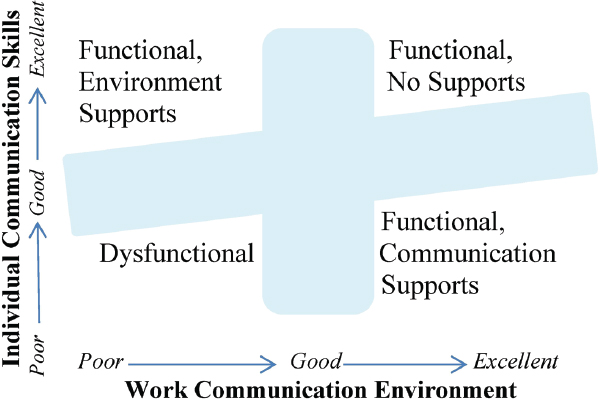
Summary
In the context of functional abilities relevant to work requirements, an individual’s comprehension of language produced by the communication partner, processing of that language, expression of his or her own ideas, and pragmatic interactions in dialogue appropriate to the work context are all relevant to assessing speech and language disorders for purposes of disability determination. Any aspect of speech and/or language impairment may result in impaired functional ability to communicate verbally in the context of work. Physical aspects of functional communication most relevant to adults communicating in a work setting include speech, voice, and fluency, while mental components of verbal communication include receptive, expressive, and pragmatic language.
FINDINGS AND CONCLUSIONS
Findings
5-1. Self-report and performance-based measures provide different perspectives on physical functional ability.
5-2. Numerous self-report measures of physical function have been developed, tested, and verified. Self-report measures are widely used, often require fewer clinical resources to administer, and provide the individual’s perspective on his or her physical functional ability.
5-3. Numerous validated performance-based measures are available for assessing physical function in specific areas (e.g., range of motion, strength, balance). Such measures provide quantitative information about the areas assessed.
5-4. Self-report and performance-based measures of physical function may be limited by a number of factors, including an individual’s underlying physical condition and cognitive status; the experience of pain, depression, or anxiety; and respondent bias or the person’s level of effort.
5-5. Physical performance-based measures can add important information to that obtained with self-report questionnaires, and use of the two together can improve the prediction of work ability and allow comparison of results for consistency.
5-6. Functional capacity evaluations (FCEs) can provide information on an individual’s ability to work.
5-7. There are multiple FCE instruments with varying degrees of reliability and validity. No single FCE instrument has proven superior for determining an individual’s functional ability. The reliability and validity of FCEs can reflect a variety of confounders, including
assessors’ training; nonstandard testing environments; and examinees’ effort, cooperation, and interest in returning to work. Assessors’ estimate of the examinee’s level of effort can enhance the accuracy of test results.
5-8. Metabolic exercise testing provides evidence of both maximal capacity and capacity for sustained work for at least 50 minutes.
5-9. Metabolic exercise testing provides information on functional capacity in units of work energy that are available for many physical activities of employment.
5-10. Performance-based measures have been developed and validated to measure visual, hearing, and communication ability and can be used to inform determinations of work ability.
5-11. Visual field status is one of the most important factors in predicting the mobility skills of individuals with vision loss.
5-12. The degree of hearing loss identified from a pure-tone audiogram can serve as a reasonable predictor of difficulty with workplace communication.
5-13. The extent to which communication is functional in a work setting is dependent on the accuracy and effectiveness of an individual’s speech-language communication skills, as well as the communication environment and partner skills.
Conclusions
5-1. Given the complexity of measuring physical function and the multidimensional nature of work participation, no single instrument has yet been demonstrated to provide a comprehensive assessment of an individual’s physical functional abilities relevant to work.
5-2. Self-report and performance-based measures of physical function can provide useful information for disability determination.
5-3. While individual performance-based measures may be of limited value in determining whole-body work ability, several tests can be of value when combined.
5-4. Self-report and performance-based measures of physical function provide complementary information, and together can be used to assess an individual’s overall functional status, providing a more complete picture of whether or how well the individual will be able to perform everyday activities, including work, on a sustained basis than can be obtained with either type of measure alone.
5-5. Although FCE is not sufficient to predict successful performance of a particular occupation, FCE assessment can be useful to highlight strengths and weaknesses and may help focus intervention to improve ability to work in a specific setting.
5-6. When the ability to work is limited by cardiac function, metabolic exercise testing can help identify specific occupations that should be compatible with the residual cardiac functional capacity.
REFERENCES
Aasheim, T., and V. Finsen. 2014. The DASH and the QuickDASH instruments: Normative values in the general population in Norway. Journal of Hand Surgery (European Volume) 39(2):140–144.
Abel, S. M., S. Boyne, and H. Roesler-Mulroney. 2009. Sound localization with an Army helmet worn in combination with an in-ear advanced communications system. Ottawa, Ontario: Defense Research and Development Canada. http://www.dtic.mil/docs/citations/ADA525193 (accessed April 4, 2019).
AbilityLab (Shirley Ryan AbilityLab). 2013a. Lower Extremity Functional Scale. https://www.sralab.org/rehabilitation-measures/lower-extremity-functional-scale (accessed April 4, 2019).
AbilityLab. 2013b. Numeric Pain Rating Scale. https://www.sralab.org/rehabilitationmeasures/numeric-pain-rating-scale (accessed April 8, 2019).
AbilityLab. 2015. Foot and Ankle Ability Measures. https://www.sralab.org/rehabilitationmeasures/foot-and-ankle-ability-measures (accessed April 4, 2019).
AbilityLab. 2016. Functional Gait Assessment. https://www.sralab.org/rehabilitationmeasures/functional-gait-assessment (accessed April 4, 2019).
Abrams, H. B., and J. Kihm. 2015. An introduction to MarkeTrak IX: A new baseline for the hearing aid market. Hearing Review 22(6):16.
Ackelman, B. H., and U. Lindgren. 2002. Validity and reliability of a modified version of the Neck Disability Index. Journal of Rehabilitation Medicine 34(6):284–287.
Albert, N., K. Trochelman, J. Li, and S. Lin. 2010. Signs and symptoms of heart failure: Are you asking the right questions? American Journal of Critical Care 19(5):443–452.
Amtmann, D., K. F. Cook, M. P. Jensen, W. H. Chen, S. Choi, D. Revicki, D. Cella, N. Rothrock, F. Keefe, L. Callahan, and J. S. Lai. 2010. Development of a PROMIS item bank to measure pain interference. Pain 150(1):173–182.
Anderson, L., C. R. Baylor, T. L. Eadie, and K. M. Yorkston. 2016. Describing speech usage in daily activities in typical adults. Journal of Voice 30(1):42–52. doi: 10.1016/j. jvoice.2015.02.001.
Andrews, G., A. Craig, A. Feyer, S. Hoddinott, P. Howie, and M. Neilson. 1983. Stuttering: A review of research findings and theories circa 1982. Journal of Speech and Hearing Disorders 48(3):226–246.
Ansuategui Echeita, J., B. J. van Holland, D. P. Gross, J. Kool, P. Oesch, M. A. Trippolini, and M. F. Reneman. 2018. Association between social factors and performance during functional capacity evaluations: A systematic review. Disability and Rehabilitation. Epub ahead of print. Pp. 1–11. doi: 10.1080/09638288.2018.1448120.
Arcara, G., and V. Bambini. 2016. A test for the assessment of pragmatic abilities and cognitive substrates (APACS): Normative data and psychometric properties. Frontiers in Psychology 7:70. doi: 10.3389/fpsyg.2016.00070.
Arffa, R. E., P. Krishna, J. Gartner-Schmidt, and C. A. Rosen. 2012. Normative values for the Voice Handicap Index-10. Journal of Voice 26(4):462–465.
Arizona State University. 2011. Compendium of physical activities: Occupation. https://sites.google.com/site/compendiumofphysicalactivities/Activity-Categories/occupation (accessed April 4, 2019).
ASHA (American Speech-Language-Hearing Association). 1993. Definitions of communication disorders and variations. https://www.asha.org/policy/rp1993-00208 (accessed April 4, 2019). doi: 10.1044/policy.RP1993-00208.
ASHA. 2004. Preferred practice patterns for the profession of speech-language pathology. Rockville, MD: ASHA. doi: 10.1044/policy.PP2004-00191.
ASHA. 2005. Guidelines for manual pure-tone threshold audiometry. https://www.asha.org/policy/gl2005-00014.htm (accessed April 4, 2019).
ASHA. 2016. Scope of practice in speech-language pathology. https://www.asha.org/policy/sp2016-00343 (accessed April 4, 2019).
ASHA. n.d. Spoken language disorders. https://www.asha.org/PRPSpecificTopic.aspx?folderid=8589935327§ion=Overview (accessed April 4, 2019).
ASHA DIV3. n.d. Consensus Auditory-Perceptual Evaluation of Voice (CAPE-V) ASHA Special Interest Division 3, voice and voice disorders. https://www.asha.org/uploadedFiles/members/divs/D3CAPEVprocedures.pdf (accessed April 4, 2019).
ATS/ACCP (American Thoracic Society/American College of Chest Physicians). 2003. Statement on cardiopulmonary exercise testing. American Journal of Respiratory and Critical Care Medicine 167(2):211–238.
Awan, S. N., N. Roy, and C. Dromey. 2009. Estimating dysphonia severity in continuous speech: Application of a multi-parameter spectral/cepstral model. Clinical Linguistics and Phonetics 23(11):825–841. doi: 10.3109/02699200903242988.
Awan, S. N., N. Roy, M. E. Jetté, G. S. Meltzner, and R. E. Hillman. 2010. Quantifying dysphonia severity using a spectral/cepstral-based acoustic index: Comparisons with auditory-perceptual judgements from the CAPE-V. Clinical Linguistics & Phonetics 24(9):742–758.
Awan, S. N., N. Roy, D. Zhang, and S. M. Cohen. 2016. Validation of the Cepstral Spectral Index of Dysphonia (CSID) as a screening tool for voice disorders: Development of clinical cutoff scores. Journal of Voice 30(2):130–144.
Bailey, I. L., and J. E. Lovie. 1976. New design principles for visual acuity letter charts. American Journal of Optometry and Physiological Optics 53(11):740–745.
Ball, L. J. 2018. Functional communication. Paper commissioned by the Committee on Functional Assessment for Adults with Disabilities, National Academies of Sciences, Engineering, and Medicine, Washington, DC.
Ball, L. J., D. R. Beukelman, and G. L. Pattee. 2004. Communication effectiveness of individuals with amyotrophic lateral sclerosis. Journal of Communication Disorders 37(3):197–215. doi: 10.1016/j.jcomdis.2003.09.002.
Bayles, K. A., D. R. Boone, C. K. Tomoeda, T. J. Slauson, and A. W. Kaszniak. 1989. Differentiating Alzheimer’s patients from the normal elderly and stroke patients with aphasia. Journal of Speech and Hearing Disorders 54(1):74–87.
Bayles, K. A., C. K. Tomoeda, and R. I. Dharmaperwira-Prins. 1993. ABCD: Arizona Battery for Communication Disorders of Dementia. Tuscon, AZ: Canyonlands Publishing.
Baylor, C. R., K. M. Yorkston, T. L. Eadie, R. Miller, and D. Amtmann. 2008. Levels of speech usage: A self-report scale for describing how people use speech. Journal of Medical Speech-Language Pathology 16(4):191–198. doi: 10.1109/TMI.2012.2196707.
Baylor, C., K. M. Yorkston, T. L. Eadie, J. Kim, H. Chung, and D. Amtmann. 2013. The Communicative Participation Item Bank (CPIB): Item bank calibration and development of a disorder-generic short form. Journal of Speech, Language, and Hearing Research 56(4):1190–1208.
Bean, J. F., D. D. Ölveczky, D. K. Kiely, S. I. LaRose, and A. M. Jette. 2011. Performance-based versus patient-reported physical function: What are the underlying predictors? Physical Therapy 91(12):1804–1811. doi: 10.2522/ptj.20100417.
Beaton, D. E., A. M. Davis, P. Hudak, and S. McConnell. 2001. The DASH (Disabilities of the Arm, Shoulder and Hand) outcome measure: What do we know about it now? The British Journal of Hand Therapy 6(4):109–118.
Beauchemin, G., J. C. MacDermid, K. Bourduas, M. F. Poirier, C. Gaudelli, and D. M. Rouleau. 2015. Translation and validation of the PREE (Patient Rated Elbow Evaluation) to a French version. Orthopaedics & Traumatology: Surgery & Research 101(4):405–409.
Bergström, G., J. Hagberg, H. Busch, I. Jensen, and C. Björklund. 2014. Prediction of sickness absenteeism, disability pension and sickness presenteeism among employees with back pain. Journal of Occupational Rehabilitation 24(2):278–286.
Bet, P. M., J. G. Hugtenburg, B. W. Penninx, and W. J. Hoogendijk. 2013. Side effects of antidepressants during long-term use in a naturalistic setting. European Neuropsychopharmacology 23(11):1443–1451.
Beukelman, D. R., J. Childes, T. Carrell, T. Funk, L. J. Ball, and G. L. Pattee. 2011. Perceived attention allocation of listeners who transcribe the speech of speakers with amyotrophic lateral sclerosis. Speech Communication 53(6):801–806. doi: 10.1016/j. specom.2010.12.005.
Bieniek, S., and M. Bethge. 2014. The reliability of WorkWell Systems Functional Capacity Evaluation: A systematic review. BMC Musculoskeletal Disorders 15:106. doi: 10.1186/1471-2474-15-106.
Bijur, P. E., W. Silver, and E. J. Gallagher. 2001. Reliability of the visual analog scale for measurement of acute pain. Academic Emergency Medicine 8(12):1153–1157.
Bilberg, A., T. Bremell, and K. Mannerkorpi. 2012. Disability of the Arm, Shoulder and Hand questionnaire in Swedish patients with rheumatoid arthritis: A validity study. Journal of Rehabilitation Medicine 44(1):7–11.
Bilek, L., D. Venema, G. Willett, and E. Lyden. 2008. Use of the Human Activity Profile for estimating fitness in persons with arthritis. Arthritis and Rheumatism 59(5):659–664.
Binkley, J. M., P. W. Stratford, S. A. Lott, and D. L. Riddle. 1999. The Lower Extremity Functional Scale (LEFS): Scale development, measurement properties, and clinical application. North American Orthopaedic Rehabilitation Research Network. Physical Therapy 79(4):371–383.
Blackstone, S., M. Williams, and D. Wilkins. 2007. Key principles underlying research and practice in AAC. Augmentative and Alternative Communication 23(3):191–203. doi: 10.1080/07434610701553684.
Bloodstein, O., and N. Bernstein Ratner. 2008. A handbook of stuttering, 6th ed. New York: Thomson Delmar Learning.
Boonstra, A. M., H. R. Schiphorst Preuper, M. F. Reneman, J. B. Posthumus, and R. E. Stewart. 2008. Reliability and validity of the visual analogue scale for disability in patients with chronic musculoskeletal pain. International Journal of Rehabilitation Research 31(2):165–169. doi: 10.1097/MRR.0b013e3282fc0f93.
Brutten, G., and M. Vanryckeghem. 2003. Behavior Assessment Battery: A multi-dimensional and evidence-based approach to diagnostic and therapeutic decision making for children who stutter. Belgium: Stichting Integratie Gehandicapten and Acco Publishers.
Brutten, G. J., and M. Vanryckeghem. 2007. Behavior Assessment Battery for school-age children who stutter. San Diego, CA: Plural Publishing.
Calmels, P., F. Béthoux, A. Condemine, and I. Fayolle-Minon. 2005. Low back pain disability assessment tools. Annales de Réadaptation et de Médecine Physique 48(6):288–297.
Carding, P. N., J. A. Wilson, K. MacKenzie, and I. J. Deary. 2009. Measuring voice outcomes: State of the science review. The Journal of Laryngology & Otology 123(8):823–829.
Chan, P. S., P. G. Jones, S. A. Arnold, and J. A. Spertus. 2014. Development and validation of a short version of the Seattle Angina Questionnaire. Circulation: Cardiovascular Quality Outcomes 7(5):640–647.
Chansirinukor, W., C. G. Maher, J. Latimer, and J. Hush. 2005. Comparison of the Functional Rating Index and the 18-item Roland-Morris Disability Questionnaire: Responsiveness and reliability. Spine 30(1):141–145.
Chapman, J. R., D. C. Norvel, J. T. Hermsmeyer, R. J. Bransford, J. DeVine, M. J. McGirt, and M. J. Lee. 2011. Evaluating common outcomes for measuring treatment success for chronic low back pain. Spine 36(21 Suppl.):S54–S68.
Chen, A. H., F. N. N. Norazman, and N. H. Buari. 2012. Comparison of visual acuity estimates using three different letter charts under two ambient room illuminations. Indian Journal of Ophthalmology 60(2):101–104.
Chen, J. J. 2007. Functional capacity evaluation & disability. Iowa Orthopaedic Journal 27:121–127.
Chien, W., and F. R. Lin. 2012. Prevalence of hearing aid use among older adults in the United States. Archives of Internal Medicine 172(3):292–293.
Chung, K. C., M. S. Pillsbury, M. R. Walters, and R. A. Hayward. 1998. Reliability and validity testing of the Michigan Hand Outcomes Questionnaire. Journal of Hand Surgery 23(4):575–587.
Cleland, J. A., J. D. Childs, and J. M. Whitman. 2008. Psychometric properties of the Neck Disability Index and Numeric Pain Rating Scale in patients with mechanical neck pain. Archives of Physical Medicine and Rehabilitation 89(1):69–74.
Constantino, C. D., P. Leslie, R. W. Quesal, and J. S. Yaruss. 2016. A preliminary investigation of daily variability of stuttering in adults. Journal of Communication Disorders 60(2016):39–50. doi: 10.1016/j.jcomdis.2016.02.001.
Craig, A., and P. Calver. 1991. Following up on treated stutterers: Studies of perceptions of fluency and job status. Journal of Speech and Hearing Research 34(2):279–284.
Craig, A., K. Hancock, E. Chang, C. McCready, A. Shepley, and A. McCaul. 1996. A controlled clinical trial for stuttering in persons aged 9 to 14 years. Journal of Speech and Hearing Research 39(4):808–826.
Craig, A., E. Blumgart, and Y. Tran. 2009. The impact of stuttering on the quality of life in adults who stutter. Journal of Fluency Disorders 34(2):61–71. doi: 10.1016/j. jfludis.2009.05.002.
Curb, J. D., C. D. Ceria-Ulep, B. L. Rodriguez, J. Grove, J. Guralnik, B. J. Willcox, T. A. Donlon, K. H. Masaki, and R. Chen. 2006. Performance-based measures of physical function for high-function populations. Journal of the American Geriatrics Society 54(5):737–742.
Dabul, B. 2000. Apraxia battery for adults: Examiner’s manual. Austin, TX: PRO-ED.
Davidson, M., and N. de Morton. 2007. A systematic review of the Human Activity Profile. Clinical Rehabilitation 21(2):151–162.
Davidson, M., and J. L. Keating. 2002. A comparison of five low back disability questionnaires: Reliability and responsiveness. Physical Therapy 82(1):8–24.
Davies, C. C., and A. J. Nitz. 2013. Psychometric properties of the Roland-Morris Disability Questionnaire compared to the Oswestry Disability Index: A systematic review. Physical Therapy Reviews 14(6):399–408. doi: 10.1179/108331909X12540993898134.
De Baets, S., P. Calders, N. Schalley, K. Vermeulen, S. Vertriest, L. Van Peteghem, M. Coussens, F. Malfait, G. Vanderstraeten, G. Van Hove, and D. Van de Velde. 2017. Updating the evidence on functional capacity evaluation methods: A systematic review. Journal of Occupational Rehabilitation 28(3):418–428. doi: 10.1007/s10926-017-9734-x.
Demeester, K., V. Topsakal, J. J. Hendrickx, E. Fransen, L. Van Laer, G. Van Camp, P. Van de Heyning, and A. Van Wieringen. 2012. Hearing disability measured by the Speech, Spatial, and Qualities of Hearing Scale in clinically normal-hearing and hearing-impaired middle-aged persons, and disability screening by means of a reduced SSQ (the SSQ5). Ear and Hearing 33(5):615–616. doi: 10.1097/AUD.0b013e31824e0ba7.
Dingemans, S. A., S. C. Kleipool, M. A. M. Mulders, J. Winkelhagen, N. W. L. Schep, J. C. Goslings, and T. Schepers. 2017. Normative data for the Lower Extremity Functional Scale (LEFS). Acta Orthopaedica 88(4):422–426. doi: 10.1080/17453674.2017.1309886.
Dixon, D., M. Johnston, and M. McQueen. 2008. The Disabilities of the Arm, Shoulder and Hand Questionnaire (DASH) can measure the impairment, activity limitations and participation restriction constructs from the International Classification of Functioning, Disability and Health (ICF). BMC Musculoskeletal Disorders 9:114. doi: 10.1186/1471-2474-9-114.
DOL (U.S. Department of Labor). 2018. Occupational Requirements Survey (ORS): Collection manual, 4th ed. https://www.bls.gov/ors/about/information-for-survey-participants/pdf/occupational-requirements-survey-collection-manual-082018.pdf (accessed April 4, 2019).
DOL. n.d. Abilities. https://www.onetonline.org/find/descriptor/browse/Abilities (accessed April 4, 2019).
Donovan, N. J., D. L. Kendall, M. E. Young, and J. C. Rosenbek. 2008. The Communicative Effectiveness Survey: Preliminary evidence of construct validity. American Journal of Speech-Language Pathology 17(4):335–347. doi: 10.1044/1058-0360(2008/07-0010).
Douglas, J. M., C. A. O’Flaherty, and P. C. Snow. 2000. Measuring perception of communicative ability: The development and evaluation of the La Trobe communication questionnaire. Aphasiology 14(3):251–268.
Drummond, S. S. 1993. Dysarthria Examination Battery. Tuscon, AZ: Communication Skill Builders.
Dubno, J. R., D. D. Dirks, and D. E. Morgan. 1984. Effects of age and mild hearing loss on speech recognition in noise. The Journal of the Acoustical Society of America 76(1):87–96.
Duffy, J. R. 2013. Motor speech disorders: Substrates, differential diagnosis, and management, 3rd ed. St. Louis, MO: Elsevier Mosby.
Dunn, D. 2018. Peabody Picture Vocabulary Test. San Antonio, TX: Pearson. https://www.pearsonclinical.com/language/products/100001984/peabody-picture-vocabulary-test-fifth-edition.html (accessed April 4, 2019).
Eadie, T. L. 2003. The ICF: A proposed framework for comprehensive rehabilitation of individuals who use alaryngeal speech. American Journal of Speech-Language Pathology 12(2):189–197.
Ellestad, M. H., W. Allen, M. C. K. Wan, and G. L. Kemp. 1969. Maximal treadmill stress testing for cardiovascular evaluation. Circulation 39(4):517–522.
Elman, R. J., and E. Bernstein-Ellis. 1995. What is functional? American Journal of Speech-Language Pathology 4(4):115–117.
Enderby, P. M. 1983. Frenchay Dysarthria Assessment. Austin, TX: PRO-ED.
Enderby, P. M., and R. Palmer. 2008. FDA-2: Frenchay Dysarthria Assessment: Examiner’s manual. Austin, TX: PRO-ED.
Erb, B. D. 1970. Physician’s handbook for evaluation of cardiovascular and physical fitness (Table F-4 Estimated VO2 for various activities). Nashville, TN: Tennessee Heart Association Physical Exercise Committee.
Erber, N. P. 1982. Auditory training. Washington, DC: Alex Graham Bell Association for Deaf and Hard of Hearing.
Fairbank, J. C., and P. B. Pynsent. 2000. The Oswestry Disability Index. Spine 25(22):2940–2952.
Fairbank, J. C., J. Couper, J. B. Davies, and J. P. O’Brien. 1980. The Oswestry Low Back Pain Disability Questionnaire. Physiotherapy 66(8):271–273.
Félin-Germain, A., I. Denis, S. Turcotte, R. Fleet, P. Archambault, C. E. Dionne, and G. Foldes-Busque. 2018. Work absenteeism and presenteeism loss in patients with noncardiac chest pain. Journal of Occupational and Environmental Medicine 60(9):781–786.
Fore, L., Y. Perez, R. Neblett, S. Asih, T. G. Mayer, and R. J. Gatchel. 2015. Improved functional capacity evaluation performance predicts successful return to work one year after completing a functional restoration rehabilitation program. PM&R: The Journal of Injury, Function, and Rehabilitation 7(4):365–375. doi: 10.1016/j.pmrj.2014.09.013.
Francis, D., J. Daniero, K. Hovis, N. Sathe, B. Jacobson, D. Penson, I. D. Feurer, and M. L. McPheeters. 2017. Voice-related patient-reported outcome measures: A systematic review of instrument development and validation. Journal of Speech, Language, and Hearing Research 60(1):62–88. doi: 10.1044/2016_JSLHR-S-16-0022.
Frattali, C., C. Thompson, A. Holland, M. Ferketic, and C. Wohl. 1995. Functional Assessment of Communication Skills for Adults (ASHA FACS). Rockville, MD: ASHA.
Frattali, C. M., C. K. Thompson, A. L. Holland, C. B. Wohl, C. J. Wenck, S. C. Slater, and D. Paul. 2017. American Speech-Language-Hearing Association Functional Assessment of Communication Skills for adults (ASHA FACS). Rockville, MD: ASHA.
Gatehouse, S., and W. Noble. 2004. The Speech, Spatial and Qualities of Hearing Scale (SSQ). International Journal of Audiology 43(2):85–99.
Genovese, E., and J. S. Galper (Eds.). 2009. Guide to the evaluation of functional ability: How to request, interpret, and apply functional capacity evaluations. Chicago, IL: American Medical Association.
Giguère, C., C. Laroche, S. D. Soli, and V. Vaillancourt. 2008. Functionally-based screening criteria for hearing-critical jobs based on the Hearing in Noise Test. International Journal of Audiology 47(6):319–328.
Gliklich, R. E., R. M. Glovsky, and W. W. Montgomery. 1999. Validation of a voice outcome survey for unilateral vocal cord paralysis. Otolaryngology—Head and Neck Surgery 120(2):153–158.
Goldman, L., B. Hashimoto, E. F. Cook, and A. Loscalzo. 1981. Comparative reproducibility and validity of systems for assessing cardiovascular functional class, advantages of a new specific activity scale. Circulation 64(6):1227–1234.
Goldman, N., D. A. Glei, L. Rosero-Bixby, S.-T. Chiou, and M. Weinstein. 2014. Performance-based measures of physical function as mortality predictors: Incremental value beyond self-reports. Demographic Research 30(7):227–252.
Goodglass, H., E. Kaplan, and B. Barresi. 2000. Boston Diagnostic Aphasia Examination, 3rd ed. Austin, TX: PRO-ED.
Gorga, M. P., S. T. Neely, B. Ohlrich, B. Hoover, J. Redner, and J. O. Peters. 1997. From laboratory to clinic: A large scale study of distortion product otoacoustic emissions in ears with normal hearing and ears with hearing loss. Ear and Hearing 18(6):440–455.
Gouttebarge, V., H. Wind, P. P. Kuijer, and M. H. Frings-Dresen. 2004. Reliability and validity of functional capacity evaluation methods: A systematic review with reference to Blankenship system, Ergos work simulator, Ergo-Kit and Isernhagen work system. International Archives of Occupational and Environmental Health 77(8):527–537.
Grant, K. W., B. E. Walden, and P. F. Seitz. 1998. Auditory-visual speech recognition by hearing-impaired subjects: Consonant recognition, sentence recognition, and auditory-visual integration. The Journal of the Acoustical Society of America 103(5):2677–2690.
Gray, C., C. Baylor, T. Eadie, D. Kendall, and K. Yorkston. 2012. The levels of speech usage rating scale: Comparison of client self-ratings with speech pathologist ratings. International Journal of Language and Communication Disorders 47(3):333–344. doi: 10.1111/j.1460-6984.2011.00112.x.
Greenberg, B., and A. M. Kahn. 2012. Clinical assessment of heart failure. In Braunwald’s Heart Disease: A textbook of cardiovascular medicine, 9th ed., edited by R. O. Bonow, D. L. Mann, D. P. Zipes, and P. Libby. Philadelphia, PA: Elsevier Saunders. Pp. 505–516.
Grobbel, J., J. Dietzsch, C. A. Johnson, R. Vonthein, K. Stingl, R. G. Weleber, and U. Schiefer. 2016. Normal values for the full visual field, corrected for age-and reaction time, using semiautomated kinetic testing on the Octopus 900 perimeter. Translational Vision Science & Technology 5(2):5.
Gross, D. P. 2006. Are functional capacity evaluations affected by the patient’s pain? Current Pain and Headache Reports 10(2):107–113.
Gross, D. P., and M. C. Battié. 2004. The prognostic value of functional capacity evaluation in patients with chronic low back pain: Part 2: Sustained recovery. Spine 29(8):920–924.
Gross, D. P., and M. C. Battié. 2005. Functional capacity evaluation performance does not predict sustained return to work in claimants with chronic back pain. Journal of Occupational Rehabilitation 15(3):285–294.
Gross, D. P., M. C. Battié, and J. D. Cassidy. 2004. The prognostic value of functional capacity evaluation in patients with chronic low back pain: Part 1: Timely return to work. Spine 29(8):914–919.
Grotle, M., J. I. Brox, and N. K. Vøllestad. 2005. Functional status and disability questionnaires: What do they assess? A systematic review of back-specific outcome questionnaires. Spine 30(1):130–140.
Häusler, R., S. Colburn, and E. Marr. 1983. Sound localization in subjects with impaired hearing: Spatial-discrimination and interaural-discrimination tests. Acta Oto-Laryngologica 96(Suppl. 400):1–62.
Hawker, G. A., S. Mian, T. Kendzerska, and M. French. 2011. Measures of adult pain. Arthritis Care & Research 63(Suppl. 11):S240–S252.
HealthMeasures. 2017. Pain interference: A brief guide to the PROMIS pain interference instruments. http://www.healthmeasures.net/images/PROMIS/manuals/PROMIS_Pain_Interference_Scoring_Manual.pdf (accessed April 8, 2019).
Helm-Estabrooks, N. 2017. Cognitive-Linguistic Quick Test-Plus. https://www.pearsonassessments.com/store/usassessments/en/Store/Professional-Assessments/Cognition-&-Neuro/Non-Verbal-Ability/Cognitive-Linguistic-Quick-Test-Plus/p/100000459.html (accessed April 12, 2019).
HHS (U.S. Department of Health and Human Services). 2018. Patient-Reported Outcomes Measurement Information System: Program snapshot. https://commonfund.nih.gov/promis/index (accessed April 4, 2019).
Hicks, G. E., and T. J. Manal. 2009. Psychometric properties of commonly used low back disability questionnaires: Are they useful for older adults with low back pain? Pain Medicine 10(1):85–94, doi: 10.1111/j.1526-4637.2008.00548.x.
Hilari, K., S. Byng, D. L. Lamping, and S. C. Smith. 2003. Stroke and Aphasia Quality of Life Scale-39 (SAQOL-39): Evaluation of acceptability, reliability, and validity. Stroke 34(8):1944–1950.
Hinckley, J. J. 2002. Vocational and social outcomes of adults with chronic aphasia. Journal of Communication Disorders 35(6):543–560.
Hirano, M. 1981. Clinical Examination of Voice. New York: Springer-Verlag.
Hlatky, M. A., R. E. Boineau, M. B. Higginbotham, K. L. Lee, D. B. Mark, R. M. Califf, F. R. Cobb, and D. B. Pryor. 1989. A brief self-administered questionnaire to determine functional capacity (the Duke Activity Status Index). American Journal of Cardiology 64(10):651–654.
Hogan, A., K. O’Loughlin, A. Davis, and H. Kendig. 2009. Hearing loss and paid employment: Australian population survey findings. International Journal of Audiology 48(3):117–122.
Hogikyan, N. D., and G. Sethuraman. 1999. Validation of an instrument to measure voice-related quality of life (V-RQOL). Journal of Voice 13(4):557–569.
Holland, A. L., C. Frattali, and D. Fromm. 1999. Communication Activities of Daily Living: CADL-2. Austin, TX: PRO-ED.
Hotz, M. A., R. Probst, F. P. Harris, and R. Hauser. 1993. Monitoring the effects of noise exposure using transiently evoked otoacoustic emissions. Acta Oto-Laryngologica 113(4):478–482.
Hula, W. D., P. J. Doyle, C. A. Stone, S. N. Austermann Hula, S. Kellough, J. L. Wambaugh, K. B. Ross, J. G. Schumacher, and A. St. Jacque. 2015. The Aphasia Communication Outcome Measure (ACOM): Dimensionality, item bank calibration, and initial validation. Journal of Speech, Language, and Hearing Research 58(3):906–919.
Humes, L. E. 2002. Factors underlying the speech-recognition performance of elderly hearing-aid wearers. The Journal of the Acoustical Society of America 112(3):1112–1132.
Hustad, K. C. 1999. Optimizing communication effectiveness: Bringing it together. In Management of motor speech disorders in children and adults, edited by K. M. Yorkston, D. R. Beukelman, E. A. Strand, and M. Hakel. Austin, TX: PRO-ED.
Hustad, K. C. 2006. Estimating the intelligibility of speakers with dysarthria. Folia Phoniatrica et Logopaedica 58(3):217–228.
Hustad, K. C. 2008. The relationship between listener comprehension and intelligibility scores for speakers with dysarthria. Journal of Speech, Language, and Hearing Research 51(3):562–573. doi: 10.1044/1092-4388(2008/040).
Hustad, K. C., and D. Beukelman. 2002. Listener comprehension of severely dysarthric speech: Effects of linguistic cues and stimulus cohesion. Journal of Speech, Language, and Hearing Research 45(3):545–558. doi: 10.1044/1092-4388(2002/043).
IOM (Institute of Medicine). 2010. Cardiovascular disability: Updating the Social Security listings. Washington, DC: The National Academies Press.
Ishikawa, K., S. Boyce, L. Kelchner, M. G. Powell, H. Schieve, A. de Alarcon, and S. Khosla. 2017. The effect of background noise on intelligibility of dysphonic speech. Journal of Speech, Language, and Hearing Research 60(7):1919–1929. doi: 10.1044/2017_JSLHR-S-16-0012.
Iverson-Thoburn, S., and D. Hayden. 2000. Alaryngeal speech utilization: A survey. Journal of Medical Speech–Language Pathology 8(2):85–99.
IWH (Institute for Work & Health). n.d. The DASH outcome measure: About the DASH. http://www.dash.iwh.on.ca/about-dash (accessed April 4, 2019).
Jahn, W. T., L. N. Cupon, and J. H. Steinbaugh. 2004. Functional and work capacity evaluation issues. Journal of Chiropractic Medicine 3(1):1–5. doi: 10.1016/S0899-3467(07)60059-7.
Jennings, M. B., and L. Shaw. 2008. Impact of hearing loss in the workplace: Raising questions about partnerships with professionals. Work 30(3):289–295.
Jester, A., A. Harth, G. Wind, G. Germann, and M. Sauerbier. 2005. Disabilities of the Arm, Shoulder and Hand (DASH) questionnaire: Determining functional activity profiles in patients with upper extremity disorders. Journal of Hand Surgery 30(1):23–28.
John, M., F. Angst, G. Pap, A. Junge, and A. F. Mannion. 2007. Cross-cultural adaptation, reliability and validity of the Patient Rated Elbow Evaluation (PREE) for German-speaking patients. Clinical and Experimental Rheumatology 25(2):195–205.
Johnson, C. A., and J. L. Keltner. 1983. The incidence of visual field loss in 20,000 eyes and its relationship to driving performance. Archives of Ophthalmology 101(3):371–376.
Joseph, S. M., E. Novak, S. Z. Arnold, P. G. Jones, H. Khattak, A. E. Platts, V. DavilaRoman, D. L. Mann, and J. A. Spertus. 2013. Comparable performance of the Kansas City Cardiomyopathy Questionnaire in heart failure patients with preserved and reduced ejection fraction. Circulation: Heart Failure 6(6):1139–1146. doi: 10.1161/CIRCHEARTFAILURE.113.000359.
Kaiser, P. K. 2009. Prospective evaluation of visual acuity assessment: A comparison of Snellen versus ETDRS charts in clinical practice (an AOS thesis). Transactions of the American Ophthalmological Society 107:311–324.
Kawai, K., A. T. Kawai, P. Wollan, and B. P. Yawn. 2017. Adverse impacts of chronic pain on health-related quality of life, work productivity, depression and anxiety in a community-based study. Family Practice 34(6):656–661.
Kay, J. M., R. Lesser, and M. Coltheart. 1992. PALPA: Psycholinguistic assessment of language performance in aphasia. Hove, England: Lawrence Erlbaum Associates.
Kelkar, A. A., J. Spertus, P. Peter, R. F. Pierson, R. J. Cody, I. L. Pina, A. Hernandez, and J. Butler. 2016. Utility of patient-reported outcome instruments in heart failure. Journal of the American College of Cardiology 4(3):116–125.
Keltner, J. L., and C. A. Johnson. 1980. Mass visual field screening in a driving population. Ophthalmology 87(8):785–792.
Kendall, S. E., P. Sjøgren, C. A. de Mattos Pimenta, J. Højsted, and G. P. Kurita. 2010. The cognitive effects of opioids in chronic non-cancer pain. Pain 150(2):225–230.
Kennedy, C. A., D. E. Beaton, P. Smith, D. Van Eerd, K. Tang, T. Inrig, S. Hogg-Johnson, D. Linton, and R. Couban. 2013. Measurement properties of the QuickDASH (Disabilities of the Arm, Shoulder and Hand) outcome measure and cross-cultural adaptations of the QuickDASH: A systematic review. Quality of Life Research 22(9):2509–2547. doi: 10.1007/s11136-013-0362-4.
Kent, R. D. 1998. Normal aspects of articulation. In Articulation and phonological disorders, 4th ed., edited by J. E. Bernthal and N. Bankson. Needham Heights, MA: Allyn and Bacon. Pp. 1–62.
Kent, R. D., G. Weismer, J. F. Kent, and J. C. Rosenbek. 1989. Toward phonetic intelligibility testing in dysarthria. Journal of Speech and Hearing Disorders 54(4):482–499.
Kertesz, A. 1982. Western Aphasia Battery test manual. San Antonio, TX: The Psychological Corporation.
Kertesz, A. 2007. Western Aphasia Battery-revised. San Antonio, TX: Pearson.
Klein, J., and S. Hood. 2004. The impact of stuttering on employment opportunities and job performance. Journal of Fluency Disorders 29(4):255–273.
Ko, S., and S. Chae. 2017. Correlations between the SF-36, the Oswestry-Disability Index and Rolland-Morris Disability Questionnaire in patients undergoing lumbar decompression according to types of spine origin pain. Clinical Spine Surgery 30(6):E804–E808.
Kochkin, S. 2009. MarkeTrak VIII: 25-year trends in the hearing health market. Hearing Review 16(11):12–31.
Kopec, J. A., J. M. Esdaile, M. Abrahamowicz, L. Abenhaim, S. Wood-Dauphinee, D. L. Lamping, and J. I. Williams. 1995. The Quebec Back Pain Disability Scale: Measurement properties. Spine 20(3):341–352.
Kramer, S. E., T. S. Kapteyn, and T. Houtgast. 2006. Occupational performance: Comparing normally-hearing and hearing-impaired employees using the Amsterdam Checklist for Hearing and Work: Desempeño laboral: Comparación de empleados con audición normal o alterada usando el Listado Amsterdam para Audición y Trabajo. International Journal of Audiology 45(9):503–512.
Kresal, F., V. Roblek, A. Jerman, and M. Meško. 2015. Lower back pain and absenteeism among professional public transport drivers. International Journal of Occupational Safety and Ergonomics 21(2):166–172.
Krupp, L. B., N. G. LaRocca, J. Muir-Nash, and A. D. Steinberg. 1989. The fatigue severity scale: Application to patients with multiple sclerosis and systemic lupus erythematosus. Archives of Neurology 46(10):1121–1123.
Kuijer, P. P. F. M., V. Gouttebarge, S. Brouwer, M. F. Reneman, and M. H. W. Frings-Dresen. 2012. Are performance-based measures predictive of work participation in patients with musculoskeletal disorders? A systematic review. International Archives of Occupational and Environmental Health 85(2):109–123.
Laplante-Lévesque, A., K. J. Brännström, E. Ingo, G. Andersson, and T. Lunner. 2015. Stages of change in adults who have failed an online hearing screening. Ear and Hearing 36(1):92–101.
Laroche, C., S. Soli, C. Giguère, J. Lagacé, V. Vaillancourt, and M. Fortin. 2003. An approach to the development of hearing standards for hearing-critical jobs. Noise and Health 6(21):17–37.
Leddy, A. L., B. E. Crowner, and G. M. Earhart. 2011. Functional Gait Assessment and Balance Evaluation System Test: Reliability, validity, sensitivity, and specificity for identifying individuals with Parkinson Disease who fall. Physical Therapy 91(1):102–113.
Lichtenstein, M. J., F. H. Bess, and S. A. Logan. 1988. Validation of screening tools for identifying hearing-impaired elderly in primary care. JAMA 259(19):2875–2878.
Light, J. 1988. Interaction involving individuals using augmentative and alternative communication systems: State of the art and future directions. Augmentative and Alternative Communication 4(2):66–82. doi: 10.1080/07434618812331274657.
Lin, F. R., J. K. Niparko, and L. Ferrucci. 2011. Hearing loss prevalence in the United States. Archives of Internal Medicine 171(20):1851–1853.
Llewellyn-Thomas, H., H. J. Sutherland, R. Tibshirani, A. Ciampi, J. E. Till, and N. F. Boyd. 1984. Describing health states: Methodologic issues in obtaining values for health states. Medical Care 22(6):543–552.
Lomas, J., L. Pickard, S. Bester, H. Elbard, A. Finlayson, and C. Zoghaib. 1989. The Communicative Effectiveness Index: Development and psychometric evaluation of a functional communication measure for adult aphasia. Journal of Speech and Hearing Disorders 54(1):113–124. doi: 10.1044/jshd.5401.113.
Lucas, C., L. W. Stevenson, J. Johnson, H. Hartley, M. A. Hamilton, J. Walder, V. Lem, and E. Eagen-Bengsten. 1999. The 6-min walk and peak oxygen consumption in advanced heart failure. American Heart Journal 138(4 Pt. 1):618–624.
MacDermid, J. C. 2001. Outcome evaluation in patients with elbow pathology: Issues in instrument development and evaluation. Journal of Hand Therapy 14(2):105–114.
MacDermid, J. C. 2010. The Patient-Rated Elbow Evaluation (PREE) user manual. https://srs-mcmaster.ca/wp-content/uploads/2015/05/English-PREE-User-Manual_June-2010.pdf (accessed April 4, 2019).
MacDermid, J. C., T. Turgeon, R. S. Richards, M. Beadle, and J. H. Roth. 1998. Patient rating of wrist pain and disability: A reliable and valid measurement tool. Journal of Orthopaedic Trauma 12(8):577–586.
MacPhee, G. J., J. A. Crowther, and C. H. McAlpine. 1988. A simple screening test for hearing impairment in elderly patients. Age and Ageing 17(5):347–351.
Marron, J. A., and I. L. Bailey. 1982. Visual factors and orientation and mobility performance. American Journal of Optometry and Physiological Optics 59(5):413–426.
Marslen-Wilson, W. 1989. Access and integration: Projecting sound onto meaning. In Lexical representation and processing, edited by W. Marslen-Wilson. Cambridge, MA: MIT Press. Pp. 3–24.
Martin, G. E., J. Klusek, B. Estigarribia, and J. E. Roberts. 2009. Language characteristics of individuals with Down syndrome. Topics in Language Disorders 29(2):112–132. doi: 10.1097/TLD.0b013e3181a71fe1.
Martin, R. T., and J. J. Irrgang. 2007. A survey of self-reported outcome instruments for the foot and ankle. The Journal of Orthopaedic and Sports Physical Therapy 37(2):72–84.
Martin, R. T., J. J. Irrgang, R. G. Burdett, S. F. Conti, and J. M. Van Swearingen. 2005. Evidence of validity for the Foot and Ankle Ability Measure (FAAM). Foot & Ankle International 26(11):968–983. doi: 10.1177/107110070502601113.
Mathiowetz, V., S. Rogers, M. Dowe-Keval, and C. Rennels. 1986. The Purdue Pegboard Norms for 14-19 year olds. American Journal of Occupational Therapy 40(3):174–179.
McAuliffe, M. J., S. Carpenter, and C. Moran. 2010. Speech intelligibility and perceptions of communication effectiveness by speakers with dysarthria following traumatic brain injury and their communication partners. Brain Injury 24(12):1408–1415. doi: 10.3109/02699052.2010.511590.
McBride, W. S., C. D. Mulrow, C. Aguilar, and M. R. Tuley. 1994. Methods for screening for hearing loss in older adults. American Journal of the Medical Sciences 307(1):40–42.
McCarthy, M. J. H., M. P. Grevitt, P. Silcocks, and G. Hobbs. 2007. The reliability of the Vernon and Mior Neck Disability Index, and its validity compared with the Short Form-36 health survey questionnaire. European Spine Journal 16(12):2111–2117.
McCreery, R. 2018. Functional assessment of hearing. Paper commissioned by the Committee on Functional Assessment for Adults with Disabilities, National Academies of Sciences, Engineering, and Medicine, Washington, DC.
McDonald, M., M. da Costa DiBonaventura, and S. Ullman. 2011. Musculoskeletal pain in the workforce: The effects of back, arthritis, and fibromyalgia pain on quality of life and work productivity. Journal of Occupational and Environmental Medicine 53(7):765–770.
McGregor, A. 2003. Fitness standards in airline staff. Occupational Medicine 53(1):5–9.
Mehta, S. P., A. Fulton, C. Quach, M. Thistle, C. Toledo, and N. A. Evans. 2016. Measurement properties of the Lower Extremity Functional Scale: A systematic review. Journal of Orthopaedic & Sports Physical Therapy 46(3):200–216.
Meterko, M., E. E. Marfeo, C. M. McDonough, A. M. Jette, P. Ni, K. Bogusz, E. K. Rasch, D. E. Brandt, and L. Chan. 2015. The Work Disability Functional Assessment Battery (WD-FAB): Feasibility and psychometric properties. Archives of Physical Medicine and Rehabilitation 96(6):1028–1035. doi: 10.1016/j.apmr.2014.11.025.
Meterko, M., M. Marino, P. Ni, E. Marfeo, C. M. McDonough, A. Jette, K. Peterik, E. Rasch, D. E. Brandt, and L. Chan. 2018. Psychometric evaluation of the improved Work-Disability Functional Assessment Battery. Archives of Physical Medicine and Rehabilitation. In press. Corrected proof available online December 19, 2018. doi: 10.1016/j.apmr.2018.09.125.
Metra, M., R. Raddino, L. D. Cas, and O. Visioli. 1990. Assessment of peak oxygen consumption, lactate, and ventilator thresholds and correlation with resting and exercise hemodynamic data in chronic congestive heart failure. American Journal of Cardiology 65(16):1127–1133.
Montgomery, S., S. D. Soli, L. S. Meyers, L. Alvaraz, K. A. Hunley, S. L. Fuller, and P. Duenas. 2011. Hearing standard for selection of entry-level correctional officers. Sacramento, CA: State of California Corrections Standards Authority, California Department of Corrections and Rehabilitation.
Mumby, K., A. Bowen, and A. Hesketh. 2007. Apraxia of speech: How reliable are speech and language therapists’ diagnoses? Clinical Rehabilitation 21(8):760–767. doi: 10.1177/0269215507077285.
Nagle, K. F., and T. L. Eadie. 2012. Listener effort for highly intelligible tracheoesophageal speech. Journal of Communication Disorders 45(3):235–245. doi: 10.1016/j. jcomdis.2012.01.001.
Nagle, K. F., and T. L. Eadie. 2018. Perceived listener effort as an outcome measure for disordered speech. Journal of Communication Disorders 73(May–June):34–49. doi: 10.1016/j. jcomdis.2018.03.003.
Newman, C. W., B. E. Weinstein, G. P. Jacobson, and G. A. Hug. 1990. The Hearing Handicap Inventory for Adults: Psychometric adequacy and audiometric correlates. Ear and Hearing 11(6):430–433.
Newman, C. W., B. E. Weinstein, G. P. Jacobson, and G. A. Hug. 1991. Test-retest reliability of the Hearing Handicap Inventory for Adults. Ear and Hearing 12(5):355–357.
NIDCD (National Institute on Deafness and Other Communication Disorders). 2015. NIDCD Fact Sheet|Voice, Speech, and Language: Aphasia. Publication no. 97–4257. https://www.nidcd.nih.gov/sites/default/files/Documents/health/voice/Aphasia.pdf (accessed April 4, 2019).
Nielsen, L. M., H. Kirkegaard, L. G. Østergaard, K. Bovbjerg, K. Breinholt, and T. Maribo. 2016. Comparison of self-reported and performance-based measures of functional ability in elderly patients in an emergency department: Implications for selection of clinical outcome measures. BMC Geriatrics 16:199. doi: 10.1186/s12877-016-0376-1.
NINDS (National Institute of Neurological Disorders and Stroke). 2011. NIH Stroke Scale. Bethesda, MD: National Institute of Neurological Disorders and Stroke, U.S. Department of Health and Human Services.
NRC (National Research Council). 1987. Night vision: Current research and future directions, symposium proceedings. Washington, DC: National Academy Press.
NRC. 2002. Visual impairments: Determining eligibility for Social Security benefits. Washington, DC: National Academy Press.
NYHA (Criteria Committee of the New York Heart Association). 1994. Nomenclature and criteria for diagnosis of diseases of the heart and great vessels, 9th edition. Boston, MA: Little, Brown & Co.
Oesch, P., K. Meyer, B. Jansen, P. Mowinckel, S. Bachmann, and K. B. Hagen. 2012. What is the role of “nonorganic somatic components” in functional capacity evaluations in patients with chronic nonspecific low back pain undergoing fitness for work evaluation? Spine 37(4):243–250.
Overbeek, C. L., S. P. Nota, P. Jayakumar, M. G. Hageman, and D. Ring. 2015. The PROMIS physical function correlates with the QuickDASH in patients with upper extremity illness. Clinical Orthopaedics and Related Research 473(1):311–317. doi: 10.1007/s11999-014-3840-2.
Packham, T., and J. C. MacDermid. 2013. Measurement properties of the Patient-Rated Wrist and Hand Evaluation: Rasch analysis of responses from a traumatic hand injury population. Journal of Hand Therapy 26(3):216–223. doi: 10.1016/j.jht.2012.12.006.
Patel, R., N. Usher, H. Kember, S. Russell, and J. Laures-Gore. 2014. The influence of speaker and listener variables on intelligibility of dysarthric speech. Journal of Communication Disorders 51(2014):13–18. doi: 10.1016/j.jcomdis.2014.06.006.
Patel, R. R., S. N. Awan, J. Barkmeier-Kraemer, M. Courey, D. Deliyski, T. Eadie, D. Paul, J. G. Švec, and R. Hillman. 2018. Recommended protocols for instrumental assessment of voice: American Speech-Language-Hearing Association expert panel to develop a protocol for instrumental assessment of vocal function. American Journal of Speech–Language Pathology 27(3):887–905. doi: 10.1044/2018_AJSLP-17-0009.
Paul, D. R., C. Frattali, A. L. Holland, C. K. Thompson, C. J. Caperton, and S. C. Slater. 2004. Quality of Communication Life Scale: Manual. Rockville, MD: American Speech-Language-Hearing Association.
Peel, N. M., S. S. Kuys, and K. Klein. 2012. Gait speed as a measure in geriatric assessment in clinical settings: A systematic review. Journal of Gerontology 68(1):39–46.
Pepin, V., J. L. Alexander, and W. T. Phillips. 2004. Physical function assessment in cardiac rehabilitation: Self-report, proxy-report and performance-based measures. Journal of Cardiopulmonary Rehabilitation and Prevention 24(5):287–295.
Peterson, E. A., N. Roy, S. N. Awan, R. M. Merrill, R. Banks, and K. Tanner. 2013. Toward validation of the Cepstral Spectral Index of Dysphonia (CSID) as an objective treatment outcomes measure. Journal of Voice 27(4):401–410.
Picard, M., S. A. Girard, M. Simard, R. Larocque, T. Leroux, and F. Turcotte. 2008. Association of work-related accidents with noise exposure in the workplace and noise-induced hearing loss based on the experience of some 240,000 person-years of observation. Accident Analysis & Prevention 40(5):1644–1652.
Poburka, B. J. 1999. A new stroboscopy rating form. Journal of Voice 13(3):403–413.
Porch, B. E. 2001. The Porch Index of Communicative Ability, 3rd ed. Palo Alto, CA: Consulting Psychologists Press.
Porreca, F., and M. H. Ossipov. 2009. Nausea and vomiting side effects with opioid analgesics during treatment of chronic pain: Mechanisms, implications, and management options. Pain Medicine 10(4):654–662.
Pritchard, M., K. Hilari, N. Cocks, and L. Dipper. 2018. Psychometric properties of discourse measures in aphasia: Acceptability, reliability, and validity. International Journal of Language & Communication Disorders 53(6):1078–1093. doi: 10.1111/1460-6984.12420.
Prutting, C. A., and D. M. Kirchner. 1987. A clinical appraisal of the pragmatic aspects of language. Journal of Speech and Hearing Disorders 52(2):105–119.
PRWE (Patient-Rated Wrist Evaluation). 2011. The Patient-Rated Wrist Evaluation (PRWE) user manual, June 2011. https://srs-mcmaster.ca/wp-content/uploads/2015/05/EnglishPRWE-User-Manual.pdf (accessed April 4, 2019).
Przewozny, T. 2016. Possibilities of spatial hearing testing in occupational medicine. International Journal of Occupational Medicine and Environmental Health 29(4):527–538. doi: 10.13075/ijomeh.1896.00537.
Przysiezny, P. E., and L. T. S. Przysiezny. 2015. Work-related voice disorder. Brazilian Journal of Otorhinolaryngology 81(2):202–211. doi: 10.1016/j.bjorl.2014.03.003.
Punch, J. L., D. O. Robinson, and D. F. Katt. 1996. Development of a hearing performance standard for law enforcement officers. Journal of the American Academy of Audiology 7(2):113–119.
Raghavendra, P., J. Bornman, M. Granlund, and E. Björck-Åkesson. 2007. The World Health Organization’s International Classification of Functioning, Disability and Health: Implications for clinical and research practice in the field of augmentative and alternative communication. Augmentative and Alternative Communication 23(4):349–361. doi: 10.1080/07434610701650928.
Raphael, C., C. Briscoe, J. Davies, Z. I. Whinnett, C. Manistry, R. Sutton, K. J. Mayet, and D. P. Francis. 2007. Limitations of the New York Heart Association functional classification system and self-reported walking distances in chronic heart failure. Heart 93(4):476–482.
Ratcliff, A. 1994. Comparison of relative demands implicated in direct selection and scanning: Considerations from normal children. Augmentative and Alternative Communication 10(2):67–74.
Rector, T. S., I. S. Anand, and J. N. Cohn. 2006. Relationships between clinical assessments and patient perceptions of the effects of heart failure on their quality of life. Journal of Cardiac Failure 12(2):87–92.
Reiman, M. P., and R. C. Manske. 2011. The assessment of function: How is it measured? A clinical perspective. Journal of Manual & Manipulative Therapy 19(2):91–99.
Riley, G. D., and K. Bakker. 2009. Stuttering Severity Instrument: SSI-4. Austin, TX: PRO-ED.
Rocchi, M. B., D. Sisti, P. Benedetti, M. Valentini, S. Bellagamba, and A. Federici. 2005. Critical comparison of nine different self-administered questionnaires for the evaluation of disability caused by low back pain. Europa Medicophysica 41(4):275–281.
Roeser, R. J., K. A. Buckley, and G. S. Stickney. 2000. Pure tone tests. In Audiology diagnosis, edited by R. J. Roeser, M. Valente, and H. Hosford-Dunn. New York: Thieme. Pp. 227–251.
Roland, M., and J. Fairbank. 2000. The Roland–Morris Disability Questionnaire and the Oswestry Disability Questionnaire. Spine 25(24):3115–3124.
Roland, M., and R. Morris. 1983. A study of the natural history of back pain. Spine 8(2):141–144. doi: 10.1097/00007632-198303000-00004.
Rosen, C. A., A. S. Lee, J. Osborne, T. Zullo, and T. Murry. 2004. Development and validation of the Voice Handicap Index-10. The Laryngoscope 114(9):1549–1556.
Ross, K. B., and R. T. Wertz. 2003. Discriminative validity of selected measures for differentiating normal from aphasic performance. American Journal of Speech-Language Pathology 12(3):312–319. doi: 10.1044/1058-0360(2003/077).
Roy, N., J. Barkmeier-Kraemer, T. Eadie, M. P. Sivasankar, D. Mehta, D. Paul, and R. Hillman. 2013. Evidence based clinical voice assessment: A systematic review. American Journal of Speech-Language Pathology 22(2):212–226. doi: 10.1044/1058-0360(2012/12-0014).
Rustenburg, G., P. P. Kuijer, and M. H. Frings-Dresen. 2004. The concurrent validity of the ERGOS Work Simulator and the Ergo-Kit with respect to maximum lifting capacity. Journal of Occupational Rehabilitation 14(2):107–118.
Sager, M., N. Dunham, A. Schwantes, L. Mecum, K. Halverson, and D. Harlowe. 1992. Measurement of activities of daily living in hospitalized elderly: A comparison of self-report and performance-based methods. Journal of the American Geriatrics Society 40(5):457–462.
Shauver, M. J., and K. C. Chung. 2013. The Michigan Hand Outcomes Questionnaire (MHQ) after 15 years of field trial. Plastic and Reconstructive Surgery 131(5):779e.
Siew, C. S. Q., K. M. Pelczarski, J. S. Yaruss, and M. S. Vitevitch. 2017. Using the OASES-A to illustrate how network analysis can be applied to understand the experience of stuttering. Journal of Communication Disorders 65(January–February):1–9. doi: 10.1016/j. jcomdis.2016.11.001.
Simeonsson, R. J., E. Björck-Åkessön, and D. J. Lollar. 2012. Communication, disability, and the ICF-CY. Augmentative and Alternative Communication 28(1):3–10. doi: 10.3109/07434618.2011.653829.
Simmons-Mackie, N., A. Kagan, J. C. Victor, A. Carling-Rowland, A. Mok, J. S. Hoch, M. Hujibregts, and D. L. Streiner. 2014. The assessment for living with aphasia: Reliability and construct validity. International Journal of Speech-Language Pathology 16(1):82–94.
Singer, M., and E. Blom. 1980. An endoscopic technique for restoration of voice after laryngectomy. Annals of Otology, Rhinology & Laryngology 89(6 Pt. 1):529–533.
Singh, G., and M. K. Pichora-Fuller. 2010. Older adults’ performance on the Speech, Spatial, and Qualities of Hearing Scale (SSQ): Test-retest reliability and a comparison of interview and self-administration methods. International Journal of Audiology 49(10):733–740.
Sivan, M., B. Sell, and P. Sell. 2009. A comparison of functional assessment instruments and work status in chronic back pain. European Journal of Physical and Rehabilitation Medicine 45(1):31–36.
Smeets, R., A. Köke, C.-W. Lin, M. Ferreira, and C. Demoulin. 2011. Measures of function in low back pain/disorders: Low Back Pain Rating Scale (LBPRS), Oswestry Disability Index (ODI), Progressive Isoinertial Lifting Evaluation (PILE), Quebec Back Pain Disability Scale (QBPDS), and Roland-Morris Disability Questionnaire (RDQ). Arthritis Care and Research 63(Suppl. 11):S158–S173. doi: 10.1002/acr.20542.
Smits, C., T. S. Kapteyn, and T. Houtgast. 2004. Development and validation of an automatic speech-in-noise screening test by telephone. International Journal of Audiology 43(1):15–28.
Smits, C., P. Merkus, and T. Houtgast. 2006. How we do it: The Dutch functional hearing–screening tests by telephone and Internet. Clinical Otolaryngology 31(5):436–440.
Soer, R., C. P. Van der Schans, J. W. Groothoff, J. H. Geertzen, and M. F. Reneman. 2008. Towards consensus in operational definitions in functional capacity evaluation: A Delphi Survey. Journal of Occupational Rehabilitation 18(4):389–400.
Soli, S. D., A. Amano-Kusumoto, O. Clavier, J. Wilbur, K. Casto, D. Freed, C. Laroche, V. Vaillancourt, C. Giguère, W. A. Dreschler, and K. S. Rhebergen. 2018a. Evidence-based occupational hearing screening II: Validation of a screening methodology using measures of functional hearing ability. International Journal of Audiology 57(5):323–334.
Soli, S. D., C. Giguère, C. Laroche, V. Vaillancourt, W. A. Dreschler, K. S. Rhebergen, K. Harkins, M. Ruckstuhl, P. Ramulu, and L. S. Meyers. 2018b. Evidence-based occupational hearing screening I: Modeling the effects of real-world noise environments on the likelihood of effective speech communication. Ear and Hearing 39(3):436–448.
Speksnijder, C. M., T. Koppenaal, J. A. Knottnerus, M. Spigt, J. B. Staal, and C. B. Terwee. 2016. Measurement properties of the Quebec Back Pain Disability Scale in patients with nonspecific low back pain: Systematic review. Physical Therapy 96(11):1816–1831.
Spertus, J. A., and P. G. Jones. 2015. Development and validation of a short version of the Kansas City Cardiomyopathy Questionnaire. Circulation: Cardiovascular Quality Outcomes 8(5):469–476.
Spertus, J. A., J. A. Winder, T. A. Dewhurst, R. A. Deyo, J. Prodzinski, M. McDonnell, and S. D. Fihn. 1995. Development and evaluation of the Seattle Angina Questionnaire: A new functional status measure for coronary artery disease. Journal of the American College of Cardiology 25(2):333–341.
SSA (U.S. Social Security Administration). 2008. Listing of impairments—Adult listings (Part A). 4.00 Cardiovascular system. https://www.ssa.gov/disability/professionals/bluebook/4.00-Cardiovascular-Adult.htm (accessed April 4, 2019).
SSA. 2018. OIS project frequently asked questions. https://www.ssa.gov/disabilityresearch/ois_project_faqs.html (accessed April 3, 2019).
Stelzle, F., C. Knipfer, M. Schuster, T. Bocklet, E. Nöth, W. Adler, L. Schempf, P. Vieler, M. Riemann, F. W. Neukam, and E. Nkenke. 2013. Factors influencing relative speech intelligibility in patients with oral squamous cell carcinoma: A prospective study using automatic, computer-based speech analysis. International Journal of Oral and Maxillofacial Surgery 42(11):1377–1384. doi: 10.1016/j.ijom.2013.05.021.
Stevens, M. L., C. C.-W. Lin, and C. G. Maher. 2016. The Roland Morris Disability Questionnaire. Journal of Physiotherapy 62(2):116. doi: 10.1016/j.jphys.2015.10.003.
Stewart, W. F., J. A. Ricci, E. Chee, D. Morganstein, and R. Lipton. 2003. Lost productive time and cost due to common pain conditions in the US workforce. JAMA 290(18):2443–2454.
Strand, E. A., J. R. Duffy, H. M. Clark, and K. Josephs. 2014. The Apraxia of Speech Rating Scale: A tool for diagnosis and description of apraxia of speech. Journal of Communication Disorders 51(September–October):43–50. doi: 10.1016/j.jcomdis.2014.06.008.
Swinburn, K., G. Porter, and D. Howard. 2004. CAT: Comprehensive Aphasia Test. Hove, England: Psychology Press.
Tanner, D., and W. Culbertson. 1999. Quick Assessment for Dysphagia. Oceanside, CA: Academic Communication Associates.
Tarlov, A. R., J. E. Ware, S. Greenfield, E. C. Nelson, E. Perrin, and M. Zubkoff. 1989. The Medical Outcomes Study: An application of methods for monitoring the results of medical care. JAMA 262(7):925–930.
Tiffin, J., and E. J. Asher. 1948. The Purdue Pegboard: Norms and studies of reliability and validity. Journal of Applied Psychology 32(3):234–247.
Touré-Tillery, M., and A. Fishbach. 2014. How to measure motivation: A guide for the experimental social psychologist. Social and Personality Psychology Compass 8(7):328–341.
Tsuji, T., K. Matsudaira, H. Sato, J. Vietri, and D. H. Jaffe. 2018. Association between presenteeism and health-related quality of life among Japanese adults with chronic lower back pain: A retrospective observational study. BMJ Open 8(6):e021160.
Tufts, J. B., K. A. Vasil, and S. Briggs. 2009. Auditory fitness for duty: A review. Journal of the American Academy of Audiology 20(9):539–557.
Tye-Murray, N. 2014. Foundations of aural rehabilitation: Children, adults, and their family members. Stamford, CT: Nelson Education.
University of Michigan. 2014a. MHQ Michigan Hand Outcomes Questionnaire: The MHQ. http://mhq.lab.medicine.umich.edu/mhq (accessed April 4, 2019).
University of Michigan. 2014b. MHQ Michigan Hand Outcomes Questionnaire: Translations. http://mhq.lab.medicine.umich.edu/translations (accessed April 4, 2019).
Varma, R., T. S. Vajaranant, B. Burkemper, S. Wu, M. Torres, C. Hsu, F. Choudhury, and R. McKean-Cowdin. 2016. Visual impairment and blindness in adults in the United States: Demographic and geographic variations from 2015 to 2050. JAMA Ophthalmology 134(7):802–809.
Vernon, H. 2008. The Neck Disability Index: State-of-the-art, 1991–2008. Journal of Manipulative and Physiological Therapeutics 31(7):491–502.
Vianin, M. 2008. Psychometric properties and clinical usefulness of the Oswestry Disability Index. Journal of Chiropractic Medicine 7(4):161–163. doi: 10.1016/j.jcm.2008.07.001.
Vincent, J. I., J. C. MacDermid, G. J. King, and R. Grewal. 2015. Rasch analysis of the Patient Rated Elbow Evaluation questionnaire. Health and Quality of Life Outcomes 13:84. doi: 10.1186/s12955-015-0275-8.
Vowles, K. E., R. T. Gross, and J. T. Sorrell. 2004. Predicting work status following interdisciplinary treatment for chronic pain. European Journal of Pain 8(4):351–358.
Walker, M. L., A. G. Austin, G. M. Banke, S. R. Foxx, L. Gaetano, L. A. Gardner, J. McElhiney, K. Morris, and L. Penn. 2007. Reference group data for the Functional Gait Assessment. Physical Therapy 87(11):1468–1477.
Wallace, S., L. Worrall, T. Rose, and G. Le Dorze. 2014. Measuring outcomes in aphasia research: A review of current practice and an agenda for standardisation. Aphasiology 28(11):1364–1384. doi: 10.1080/02687038.2014.930262.
Wang, Y. F., S. S. Wang, C. C. Tai, L. C. Lin, and A. S. Shiao. 2002. Hearing screening with portable screening pure-tone audiometer and distortion-product otoacoustic emissions. Zhonghua Yi Xue Za Zhi [Chinese Medical Journal] 65(6):285–292.
Wasserman, K., J. E. Hansen, D. Y. Sue, B. J. Whipp, and R. Casaburi 1994. Principles of exercise testing and interpretation, 2nd ed. Philadelphia, PA: Lea & Febiger.
Watson, C. S., G. R. Kidd, J. D. Miller, C. Smits, and L. E. Humes. 2012. Telephone screening tests for functionally impaired hearing: Current use in seven countries and development of a U.S. version. Journal of the American Academy of Audiology 23(10):757–767.
Weber, C., M. Schwieterman, K. Fier, J. Berni, N. Swartz, R. S. Phillips, and J. C. Reneker. 2016. Reliability and validity of the Functional Gait Assessment: A systematic review. Physical & Occupational Therapy in Geriatrics 34(1):88–103. doi: 10.3109/02703181.2015.1128509.
Wenzel, E. M., M. Arruda, D. J. Kistler, and F. L. Wightman. 1993. Localization using non-individualized head-related transfer functions. The Journal of the Acoustical Society of America 94(1):111–123.
Westaway, M. D., P. W. Stratford, and J. M. Binkley. 1998. The Patient Specific Functional Scale: Validation of its use in persons with neck dysfunction. Journal of Orthopaedic & Sports Physical Therapy 27(5):331–338. doi: 10.2519/jospt.1998.27.5.331.
White, A. R., E. Carney, and J. Reichle. 2010. Group-item and directed scanning: Examining preschoolers’ accuracy and efficiency in two augmentative communication symbol selection methods. American Journal of Speech-Language Pathology 19(4):311–320.
Whitehouse, A. J. O., and D. V. M. Bishop. 2009. Communication Checklist—Adult. London: The Psychological Corporation.
WHO (World Health Organization). 2001. International classification of functioning, disability and health. Geneva, Switzerland: WHO.
WHO. 2002. Towards a common language for functioning, disability and health: ICF. Geneva, Switzerland: WHO.
Wilkinson, M., G. Dagnelie, and C. A. Johnson. 2018. Visual functions to test for disability determinations. Paper commissioned by the Committee on Functional Assessment for Adults with Disabilities, National Academies of Sciences, Engineering, and Medicine, Washington, DC.
Williams, F. 1970. Language and poverty: Perspectives on a theme. New York: Academic Press.
Williams, K. 2018. Expressive Vocabulary Test-3. San Antonio, TX: Pearson.
Williamson, A., and B. Hoggart. 2005. Pain: A review of three commonly used pain rating scales. Journal of Clinical Nursing 14(7):798–804.
Wind, H., V. Gouttebarge, P. P. F. Kuijer, and M. H. Frings-Dresen. 2005. Assessment of functional capacity of the musculoskeletal system in the context of work, daily living, and sport: A systematic review. Journal of Occupational Rehabilitation 15(2):253–272.
Wong, J. Y., B. K. Fung, M. M. Chu, and R. K. Chan. 2007. The use of Disabilities of the Arm, Shoulder, and Hand Questionnaire in rehabilitation after acute traumatic hand injuries. Journal of Hand Therapy 20(1):49–55.
Woods, W. S., S. Kalluri, S. Pentony, and N. Nooraei. 2013. Predicting the effect of hearing loss and audibility on amplified speech reception in a multi-talker listening scenario. The Journal of the Acoustical Society of America 133(6):4268–4278.
Wrisley, D. M., and N. A. Kumar. 2010. Functional Gait Assessment: Concurrent, discriminative, and predictive validity in community-dwelling older adults. Physical Therapy 90(5):761–773. doi: 10.2522/ptj.20090069.
Wrisley, D. M., G. F. Marchetti, D. K. Kuharsky, and S. L. Whitney. 2004. Reliability, internal consistency, and validity of data obtained with the Functional Gait Assessment. Physical Therapy 84(10):906–918.
Yaruss, J. S. 2010. Assessing quality of life in stuttering treatment outcomes research. Journal of Fluency Disorders 35(3):190–202.
Yaruss, J. S., and R. W. Quesal. 2006. Overall Assessment of the Speaker’s Experience of Stuttering (OASES): Documenting multiple outcomes in stuttering treatment. Journal of Fluency Disorders 31(2):90–115.
Yates, M., and N. Shastri-Hurst. 2017. The Oswestry Disability Index. Occupational Medicine 67(3):241–242.
Yorkston, K. M., and D. R. Beukelman. 1981. Communication efficiency of dysarthric speakers as measured by sentence intelligibility and speaking rate. Journal of Speech and Hearing Disorders 46(3):296–301.
Yorkston, K. M., D. R. Beukelman, and C. Traynor. 1984. Assessment of Intelligibility of Dysarthric Speech. Austin, TX: PRO-ED.
Yorkston, K., P. Dowden, and D. Beukelman. 1992. Intelligibility measurement as a tool in the clinical management of dysarthric speakers. In Intelligibility in speech disorders: Theory, measurement and management, edited by R. D. Kent. Amsterdam, The Netherlands: John Benjamin Publishing Company. Pp. 265–285.
Yorkston, K. M., D. Beukelman, and M. Hakel. 1996. Speech Intelligibility Test for windows. Lincoln, NE: Madonna Rehabilitation Hospital.
Yorkston, K. M., D. R. Beukelman, M. E. Hakel, and M. Dorsey. 2007. Speech Intelligibility Test (SIT). Lincoln, NE: Madonna Rehabilitation Hospital. https://www.madonna.org/research/software (accessed April 8, 2019).
Yorkston, K. M., D. R. Beukelman, E. A. Strand, and M. Hakel. 2010. Management of motor speech disorders in children and adults, 3rd ed. Austin, TX: PRO-ED.
Yueh, B., N. Shapiro, C. H. MacLean, and P. G. Shekelle. 2003. Screening and management of adult hearing loss in primary care: Scientific review. JAMA 289(15):1976–1985.
Zraick, R. I., G. B. Kempster, N. P. Connor, S. Thibeault, B. K. Klaben, Z. Bursac, C. R. Thrush, and L. E. Glaze. 2011. Establishing validity of the Consensus Auditory-Perceptual Evaluation of Voice (CAPE-V). American Journal of Speech-Language Pathology 20(1):14–22. doi: 10.1044/1058-0360(2010/09-0105).
ANNEX TABLE 5-1
Data Elements on Physical Demands in the Occupational Requirements Survey (ORS)
| Category | Data Element | Definition |
|---|---|---|
| Sitting Versus Standing/Walking | Sitting |
|
| Standing/walking |
|
|
| Sitting/standing at will |
|
|
| Lifting/Carrying | Lifting |
|
| Carrying |
|
|
| Pushing/Pulling (separated based on the part of the body used: hands/arms, feet/legs [DOL, 2018, p. 105]) | Pushing |
|
| Pulling |
|
|
| Reaching | Reaching |
|
| Overhead reaching |
|
|
| At/below the shoulder reaching |
|
|
| Category | Data Element | Definition |
|---|---|---|
| Manipulation | Gross manipulation |
|
| Fine manipulation |
|
|
| Foot/leg controls |
|
|
| Keyboarding |
|
|
| Stooping, Crouching, Kneeling, Crawling | Stooping |
|
| Crouching |
|
|
| Kneeling |
|
|
| Crawling |
|
|
| Category | Data Element | Definition |
|---|---|---|
| Climbing | Climbing |
|
| Climbing ramps or stairs |
|
|
| Climbing ladders, ropes, or scaffolds |
|
|
| Vision | Near visual acuity |
|
| Far visual acuity |
|
|
| Peripheral vision |
|
|
| Speaking and Hearing Requirements | Speaking |
|
| Hearing requirements |
|
|
SOURCE: DOL, 2018.
ANNEX TABLE 5-2
Physical Functional Abilities Relevant to Work Requirements
| Relevant Functional Domains (identified by the committee) | Task | Occupational Requirements Survey | |
|---|---|---|---|
| Lower Extremities and Feet, Back and Neck | Walk | Standing/walking | |
| Stand | |||
| Back and Neck | Sit | Sitting | |
| Sitting/standing at will | |||
| Lower Extremities and Feet, Upper Extremities, and Hands and Fingers | Climb | Climbing ramps or stairs | |
| Climbing ladders, ropes, scaffolds | |||
| Back and Neck | Stoop (bend down and forward at waist) | Stooping | |
| Lower Extremities and Feet | Kneel (bend legs to rest on knees) | Kneeling | |
| Lower Extremities and Feet, Back and Neck | Crouch (bend legs and back down and forward) | Crouching | |
| Lower Extremities and Feet, Upper Extremities and Hands and Fingers | Crawl (move on hands and knees) | Crawling | |
| Lower Extremities and Feet | Manipulation | Foot/leg controls | |
| Upper Extremities and Hands and Fingers | Handle large objects | Manipulation | Gross manipulation |
| Upper Extremities and Hands and Fingers | Write, type, or handle small objects | Manipulation | Fine manipulation |
| Keyboarding | |||
| Occupational Information Network (O*NET) | Disability Report-Adult (SSA-3368-BK) | Work History Report (SSA-3369-BK) | Function Report-Adult (SSA-3373-BK) | Physical Residual Functional Capacity Form (SSA-4734-BK) | |
|---|---|---|---|---|---|
| Gross body coordination | Trunk strength | Walk | Walk | Walking | Addressed in terms of frequency or number of hours under “exertional limitations” |
| Stand | Stand | Standing | |||
| Trunk strength | Sit | Sit | Sitting | ||
| Gross body coordination | Climb | Climb | Stair climbing | Climbing ramps or stairs | |
| Climbing ladders, ropes, scaffolds | |||||
| Extent flexibility | Stoop | Stoop | Bending | Stooping | |
| Extent flexibility | Kneel | Kneel | Kneeling | Kneeling | |
| Extent flexibility | Crouch | Crouch | Squatting | Crouching | |
| Gross body coordination | Crawl | Crawl | Crawling | ||
| Gross body equilibrium | Balancing (U.S. Department of Transportation [DOT] element excluded from Occupational Information System [OIS] [SSA, 2018]) | ||||
| Manual dexterity | Handle large objects | Handle large objects | Using hands | Handling | |
| Finger dexterity | Write, type, or handle small objects | Write, type, or handle small objects | Using hands | Fingering | |
| Finger dexterity | Wrist-finger speed | Feeling (skin receptors) | |||
| Relevant Functional Domains (identified by the committee) | Task | Occupational Requirements Survey |
|---|---|---|
| Upper Extremities and Hands and Fingers | Reach | Overhead reaching |
| At/below shoulder reaching | ||
| Upper Extremities and Hands and Fingers, Back and Neck Lower Extremities and Feet (for carry) | Lift | Lifting/carrying |
| Carry | ||
| Upper Extremities and Hands and Fingers, Back and Neck, Lower Extremities and Feet | Push | Pushing/pulling (exerting force, measure of strength) |
| Pull | ||
| Vision | See | Near visual acuity |
| Far visual acuity | ||
| Peripheral vision | ||
| Communicationa | Hear |
Hearing
|
| Speak | Speaking | |
aCommunication: Here refers to anatomical impairments that affect hearing and speech. Certain brain/cognitive disorders (e.g., expressive/receptive aphasias) also can affect communication.
| Occupational Information Network (O*NET) | Disability Report-Adult (SSA-3368-BK) | Work History Report (SSA-3369-BK) | Function Report-Adult (SSA-3373-BK) | Physical Residual Functional Capacity Form (SSA-4734-BK) | ||
|---|---|---|---|---|---|---|
| Dynamic flexibility | Extent flexibility | Multilimb coordination | Reach | Reach | Reaching | Reaching all directions |
| Static strength | Multilimb coordination | Lifting and carrying | Lifting and carrying | Lifting | Exertional limitations | |
| Static strength | Multilimb coordination | Exertional limitations | ||||
| Near vision | Seeing | Near acuity | ||||
| Far vision | Far acuity | |||||
| Peripheral vision | Field of vision (visual fields) | |||||
| Depth perception | Depth perception | |||||
| Accommodation | ||||||
| Night vision | ||||||
| Glare sensitivity | ||||||
| Visual color discrimination | Color vision (DOT element excluded from OIS [SSA, 2018]) | |||||
| Auditory attention | Hearing | Hearing | ||||
| Hearing sensitivity | ||||||
| Sound localization | ||||||
| Speech recognition | ||||||
| Speech clarity | Talking | Speaking | ||||
| Relevant Functional Domains (identified by the committee) | Task | Occupational Requirements Survey |
|---|---|---|
| Strength and Endurance | Push | Pushing/pulling |
| Pull | ||
| Lift | Lifting/carrying | |
| Carry | ||
| Stand and/or walk | Standing/walking | |
| Sit | Sitting | |
| Sitting/standing at will | ||
| Stamina | ||
| Occupational Information Network (O*NET) | Disability Report-Adult (SSA-3368-BK) | Work History Report (SSA-3369-BK) | Function Report-Adult (SSA-3373-BK) | Physical Residual Functional Capacity Form (SSA-4734-BK) |
|---|---|---|---|---|
| Static strength | Exertional limitations | |||
| Dynamic strength | Lifting and carrying | Lifting and carrying | Lifting | |
| Dynamic strength | ||||
| Dynamic flexibility | ||||
| Trunk strength | ||||
| Stamina | ||||
ANNEX TABLE 5-3
Selected General Assessments for Physical Function
| Physical Functional Domain | Functional Assessment Tool | References | Qualifications to Administer | How Administered |
|---|---|---|---|---|
| Full-Body Assessments | Functional capacity evaluation (FCE) | Chen, 2007; Fore, 2015; Genovese and Galper, 2009; Jahn et al., 2004; Kuijer et al., 2012; Soer et al., 2008 | Physical therapist, occupational therapist, exercise physiologist | Provide instructions to patients and observe task completion |
| Time to Administer | Psychometric Properties (reliability, validity) | Proprietary | Population to Which Applies | Comments |
|---|---|---|---|---|
| Usually at least 4–6 hours and often administered over 2 days | Often reliable; limited validity. | There are approximately 10 commonly utilized FCE instruments: Blankenship, ERGOS Work Simulator, Ergo-Kit variation, WorkWell Systems (formerly known as Isernhagen Work Systems), Hanoun Medical, Physical Work Performance Evaluation (Ergoscience), WEST-EPIC, Key, ERGOS, and ARCON | Injured workers, patients participating in a rehabilitation program, individuals applying for a strenuous or skill-specific occupation (law enforcement, military, professional sports) | There are no quantifiable measures of employment or activities of daily living prior to a disability or whether a disability is task specific for each job position, defining and measuring the essential demands. |
| Physical Functional Domain | Functional Assessment Tool | References | Qualifications to Administer | How Administered |
|---|---|---|---|---|
| Work Disability Functional Assessment Battery (WD-FAB) Physical Function | Meterko et al., 2015 | No specialized training | Self-administered | |
| Meterko et al., 2018 | ||||
NOTE: ICC = intraclass correlation coefficient.
| Time to Administer | Psychometric Properties (reliability, validity) | Proprietary | Population to Which Applies | Comments |
|---|---|---|---|---|
| 10 minutes or less | Score reliability criterion (≥0.85); median convergent correlation = 0.55; median discriminant correlation = 0.18. | No | Individuals with self-reported physical disabilities | Strong evidence of construct validity. Data suggest that the WD-FAB could be used to assess physical and behavioral health function related to work disability. Future work will focus on item replenishment and refinement to increase the overall performance of these scales. |
| ICCs = 0.69–0.77 (general sample); 0.66–0.86 (disability sample); standard errors of mean for all scales indicated good discrimination; minimum detectable change 90 values = 3.41–10.55. | Although initially developed for use within the U.S. Social Security Administration, the WD-FAB 2.0 could be used for assessment and measurement of work-related physical and mental health function in other contexts as well. | |||
ANNEX TABLE 5-4
Selected Musculoskeletal Assessments
| Physical Functional Domain | Functional Assessment Tool | References | Qualifications to Administer | How It Is Administered |
|---|---|---|---|---|
| Upper Extremities and Hands and Fingers | Disabilities of the Arm, Shoulder, and Hand Questionnaire (DASH) and QuickDASH | Aasheim and Finsen, 2014 | No specialized qualifications | Self-administered |
| Dixon et al., 2008 | ||||
| Jester et al., 2005 | ||||
| Beaton et al., 2001 | ||||
| Kennedy et al., 2013 | ||||
| Bilberg et al., 2012 | ||||
| Time to Administer | Psychometric Properties (reliability, validity) | Proprietary | Population to Which Applies | Comments |
|---|---|---|---|---|
| Minutes | Spearman’s correlation coefficient for mean DASH and QuickDASH = 0.965. | No | Individuals with upper-extremity injuries, pain, and/or status postsurgery | DASH is available in 27 languages. |
| Valid and frequently used measure of upper-limb function. | ||||
| Significantly higher DASH scores found for older workers, females, and manual workers. | ||||
| Test-retest reliability (ICC = 0.96) exceeded guidelines. Responsiveness of DASH was comparable to or better than that of the joint-specific measures in the whole group and in each region. Evidence for validity, test-retest reliability, and responsiveness of DASH, and validity and responsiveness in both proximal and distal disorders, confirming its usefulness across the whole extremity. | ||||
| QuickDASH English version performs well, with strong positive evidence for reliability and validity. | Information about the measurement properties of the cross-cultural adaptation versions is still lacking. | |||
| Confirmed satisfactory concurrent, convergent, and face validity. Test-retest reliability coefficient 0.99 (95% CI: 0.98–0.99) confirmed. | ||||
| Physical Functional Domain | Functional Assessment Tool | References | Qualifications to Administer | How It Is Administered |
|---|---|---|---|---|
| Upper Extremities and Hands and Fingers | Patient-Reported Outcomes Measurement Information System (PROMIS) Physical Function—Upper Extremity | Overbeek et al., 2015 | No specialized qualifications | Self-administered; paper or computer based |
| Patient-Rated Elbow Evaluation (PREE) | Vincent et al., 2015 | No specialized qualifications | Self-administered | |
| MacDermid, 2001 | ||||
| John et al., 2007 | ||||
| Beauchemin et al., 2015 | ||||
| Time to Administer | Psychometric Properties (reliability, validity) | Proprietary | Population to Which Applies | Comments |
|---|---|---|---|---|
| Minutes | Substantial qualitative and quantitative evidence has been gathered that supports the validity of PROMIS measures (http://www.healthmeasures.net/explore-measurement-systems/promis/measure-development-research/validation [accessed April 4, 2019]). | No | Individuals with upper-extremity pain, injury, or status postsurgery | Based on item response theory; questionnaires may be paper based or administered using computer adaptive testing; translated into several languages. |
| Minutes | The three subscales appear to be robust. | No | Individuals with elbow pain, injury, surgery | Low patient burden. |
| DASH ICC = 0.93; test-retest reliability (2–7 days); pain items ICC = 0.76 to 0.87; function items ICC = 0.60 to 0.88. | ||||
| Test-retest reliability (3–4 days); pain items ICC = 0.56 to 0.76; function items ICC = 0.48 to 0.83. | ||||
| ICC for reliability = 0.89 (95% CI: 0.79–0.94) for the PREE-French; for construct validity, excellent correlation between PREE-Fr and QuickDASH (0.89–0.96); good to excellent correlation between the PREE and Medical Expenditure Panel Survey (MEPS) = (0.70–0.95). | . | |||
| Physical Functional Domain | Functional Assessment Tool | References | Qualifications to Administer | How It Is Administered |
|---|---|---|---|---|
| Upper Extremities and Hands and Fingers | Patient-Rated Wrist Evaluation (PRWE) | Packham and MacDermid, 2013 | No specialized qualifications | Self-administered |
| MacDermid et al., 1998 | ||||
| Michigan Hand Outcomes Questionnaire (MHQ) | Shauver and Chung, 2013; University of Michigan, 2014b | No specialized qualifications | Self-administered | |
| Chung et al., 1998 | ||||
| Time to Administer | Psychometric Properties (reliability, validity) | Proprietary | Population to Which Applies | Comments |
|---|---|---|---|---|
| Minutes | α = 0.96; reliability = 0.95. | No | Individuals with hand injury | |
| Test-retest reliability was excellent (2–7 days ICC ≥0.90, long-term [1 year] ICC = 0.91); pain subscale and excellent short-term and long-term reliability (ICC = 0.90, 0.91, respectively); function subscale demonstrated excellent short-term reliability (ICC 0.61–0.88). | Psychometric testing on individuals with distal radius and scaphoid fractures. | |||
| PRWE has been translated into Chinese, Dutch, English, German, Hindi, and Japanese. | ||||
| 15 minutes | ICC range = 0.85–0.96; test-retest reliability = 0.85–0.95; α = 0.84–0.93 for each domain. | Use requires completion of a license | Individuals with hand pain, injury, or status postsurgery | Chinese, Dutch, Farsi, French, German, Japanese, Korean, Polish, Portuguese, Spanish, Turkish. |
| Test-retest reliability = 0.81 (aesthetics)–0.97 (activities of daily living [ADLs]); α = 0.86 (pain) and 0.97 (ADLs); correlation between scales gave evidence of construct validity. | Short time to complete; reliable and valid instrument for measuring hand outcomes; can be used in clinic setting with minimal burden to patients; has undergone rigorous psychometric testing. | |||
| Physical Functional Domain | Functional Assessment Tool | References | Qualifications to Administer | How It Is Administered |
|---|---|---|---|---|
| Back and Neck | Roland-Morris Disability Questionnaire (RMDQ) | Chansirinukor et al., 2005 | Self-administered | |
| Stevens et al., 2016 | No specialized qualifications | Self-administered | ||
| Smeets et al., 2011 | ||||
| Stevens et al., 2016 | No training is required to administer or score the questionnaire | Face-to-face, electronically, or over the phone | ||
| Rocchi et al., 2005 | Self-administered | |||
| Calmels et al., 2005 | Self-administered | |||
| Davies and Nitz, 2013 | Self-administered | |||
| Owestry Disability Index (ODI) | Vianin, 2008 | No specialized qualifications | Self-administered | |
| Fairbank and Pynsent, 2000 | ||||
| Roland and Fairbank, 2000 | ||||
| Davidson and Keating, 2002 | ||||
| Time to Administer | Psychometric Properties (reliability, validity) | Proprietary | Population to Which Applies | Comments |
|---|---|---|---|---|
| Low patient burden. | ||||
| 5 minutes | No | RMDQ is cross-culturally adapted or translated for use in other countries. | ||
| α = 0.84–0.96; test-retest reliability = 0.83–0.91. | ||||
| Correlation with Quebec Scale: r = 0.6; α = 0.84–0.96; Test-retest reliability = 0.83–0.91. | ||||
| Low patient burden. | ||||
| Strong content and construct validity, feasibility, linguistic adaptation and international use; low patient burden. | ||||
| Most sensitive for patients with mild to moderate disability; low patient burden. | ||||
| 5 minutes | α = 0.71–0.87. | No | Individuals with back pain, injury, status postsurgery | Responsiveness is reported to be high. |
| α = 0.71–0.87; test-retest reliability r = 0.83–0.99. | ||||
| α = 0.71–0.87. | ||||
| ICC = 0.84–0.94. | ||||
| Physical Functional Domain | Functional Assessment Tool | References | Qualifications to Administer | How It Is Administered |
|---|---|---|---|---|
| Back and Neck | Quebec Back Pain Disability Questionnaire (Quebec Scale) | Kopec et al., 1995 | Self-administered | |
| Hicks and Manal, 2009 | ||||
| Speksnijder et al., 2016 | ||||
| Neck Disability Index (NDI) | Vernon, 2008 | No specialized training | Self-administered | |
| Ackelman and Lindgren, 2002 | Self-administered | |||
| Cleland et al., 2008 | Self-administered | |||
| McCarthy et al., 2007 | Self-administered | |||
| Time to Administer | Psychometric Properties (reliability, validity) | Proprietary | Population to Which Applies | Comments |
|---|---|---|---|---|
| Test-retest reliability = 0.92; α = 0.96. | Evaluates functional disability in patients with chronic back pain. | |||
| ICC = 0.94 (95% CI: 0.90, 0.97). | ||||
| There is limited to moderate evidence for good reliability, validity, and responsiveness of the Quebec Scale for different language versions. | ||||
| Minutes | Spearmans correlation coefficient revealed a significant association. | No | Translated in 22 languages. | |
| Levels of sensitivity, test-retest reliability, and validity were acceptable. | ||||
| Test-retest = fair to moderate. | Low patient burden. | |||
| α = 0.86, 95% CI: 0.82–0.89; test-retest reliability = high; ICC = 0.93, 95% CI: 0.86–0.97. | ||||
| Physical Functional Domain | Functional Assessment Tool | References | Qualifications to Administer | How It Is Administered |
|---|---|---|---|---|
| Lower Extremities and Feet | Lower-Extremity Functional Scale (LEFS) | Mehta et al., 2016 | No specialized qualifications | Self-administered |
| Binkley et al., 1999 | ||||
| AbilityLab, 2013a | ||||
| Functional Gait Assessment (FGA) | Weber et al., 2016 | Trained/experienced individual, such as a physician or physical therapist | Instructions and demonstration—walking test | |
| Wrisley and Kumar, 2010; Wrisley et al., 2004 | ||||
| Walker et al., 2007 | ||||
| Wrisley and Kumar, 2010 | ||||
| Leddy et al., 2011 | ||||
| Foot and Ankle Ability Measure (FAAM) | AbilityLab, 2015 | No specialized training | Self-administered | |
| Martin and Irrgang, 2007 | ||||
| Time to Administer | Psychometric Properties (reliability, validity) | Proprietary | Population to Which Applies | Comments |
|---|---|---|---|---|
| Test-retest reliability = excellent. | No | Individuals with lower-extremity pain, injury, status postsurgery | ||
| Test-retest reliability = 0.94. | ||||
| 5 minutes | ||||
| 10 minutes | Interrater reliability high. | No | Individuals at risk of falls | |
| For individuals with vestibular dysfunction; interrater reliability: r = 0.86; intrarater reliability: r = 0.74, α = 0.79; Spearman rank correlation coefficients of the FGA scores with balance measurements = 0.11–0.67. | ||||
| For community-dwelling adults, interrater reliability: r = 0.93. | ||||
| Appears to predict falls in community-dwelling older adults. | ||||
| Test-retest reliability = 0.91; interrater reliability >0.93. | ||||
| 10 minutes | No | |||
| Activities of Daily Living subscale ICC = 0.87, α = 0.96; sports subscale ICC = 0.89, α = 0.98. | ||||
| Physical Functional Domain | Functional Assessment Tool | References | Qualifications to Administer | How It Is Administered | |||||
|---|---|---|---|---|---|---|---|---|---|
| Pain Assessments | Visual Analog Scale (VAS) for Pain | Bijur et al., 2001 | Minimal training | Self-administered | |||||
| Numeric Rating Scale (NRS) for Pain | AbilityLab, 2013b | No specialized training | Self-administered | ||||||
| Patient-Reported Outcomes Measurement Information System (PROMIS) Pain Interference Instruments | HealthMeasures, 2017 | Self-administered | |||||||
NOTE: α = Cronbach’s alpha; CI = confidence interval; ICC = intraclass correlation coefficient.
| Time to Administer | Psychometric Properties (reliability, validity) | Proprietary | Population to Which Applies | Comments |
|---|---|---|---|---|
| Minutes | Good reliability but “questionable” validity as a measure of disability for individuals with chronic musculoskeletal pain (Boonstra et al., 2008). VAS has been shown to be reliable and valid in an acute setting, such as a hospital emergency department (Bijuer et al., 2001). | No | Measurement of pain can be via a horizontal or vertical scale from 0 to 10 (0 = no pain; 10 = severe pain). Individuals with cognitive limitations or those with fine motor deficits may have trouble completing the assessment (Hawker et al., 2011; Williamson and Hoggart, 2005). | |
| Less than 3 minutes | Instrument has been shown to be valid and reliable (Hawker et al., 2011; Williamson and Hoggart, 2005). | No | Adults | Can be administered verbally as well as in writing. |
| Instrument has been shown to be valid and reliable (Amtmann et al., 2010). | No | Measure self-reported effects of pain on relevant aspects of one’s life (HealthMeasures, 2017). | ||
ANNEX TABLE 5-5
Selected Cardiovascular Assessments
| Physical Functional Domain | Functional Assessment Tool | References | Qualifications to Administer | How It Is Administered |
|---|---|---|---|---|
| Cardiovascular System | Minnesota Living with Heart Failure Questionnaire | Rector et al., 2006 | None except calculation of score | Self-administered |
| Kansas City Cardiomyopathy Questionnaire | Joseph et al., 2013 | None except calculation of score | Self-administered | |
| Seattle Questionnaire for Angina | Spertus et al., 1995 | None except calculation of score | Self-administered | |
| Time to Administer | Psychometric Properties (reliability, validity) | Proprietary | Population to Which It Applies | Comments |
|---|---|---|---|---|
| 5–8 minutes | Good reliability, responsiveness, performance across populations; feasibility; and interpretability (Kelkar et al., 2016). | Yes | Measures the overall impact of a decrease in heart function on the life of an individual; 21 items for which the responses are summed to a 105-point score, where a higher score indicates more limitations. | |
| 5–8 minutes | Good reliability, responsiveness, performance across populations; feasibility; and interpretability (Kelkar et al., 2016). | Yes | Measures the overall impact of a decrease in heart function on the life of an individual; 23 items and more specific description of limitation on specific activities such as walking, climbing stairs, housework, and yardwork. A difference of 5 points between two time points has been validated as a meaningful change in quality of life. | |
| 5 minutes | Reliability in small-sized populations tested. | Yes | Developed using a framework similar to that for the Kansas City Questionnaire for cardiomyopathy/heart failure; recently adapted and validated as shorter versions consisting of 7 items (Chan et al., 2014). | |
| Physical Functional Domain | Functional Assessment Tool | References | Qualifications to Administer | How It Is Administered |
|---|---|---|---|---|
| Cardiovascular System | New York Heart Association Classification | Albert et al., 2010; Joseph et al., 2013; NYHA, 1994; Raphael et al., 2007 | Physician assessment during routine clinical care | |
| Exercise tolerance test with treadmill or bicycle exercise (occasionally with hand ergometer) with monitoring of electrocardiogram and blood pressure | Ellestad et al., 1969 | Licensed exercise physiologist, nurse, or physician | In an exercise testing laboratory with available equipment for monitoring and resuscitation | |
| Time to Administer | Psychometric Properties (reliability, validity) | Proprietary | Population to Which It Applies | Comments |
|---|---|---|---|---|
| Reproducibility across clinicians is limited, in part because it changes in response to fluctuations in clinical status from day to day. | No | Populations of adult patients with heart failure or angina; applicable to and is often used to describe the degree of limitation with other cardiac disorders, such as adult congenital heart disease and acquired valve disease | Robust predictor of outcomes with heart failure, as measured by rates of hospitalization, heart transplant or mechanical circulatory support, or death. | |
| 30–45 minutes | Good responsiveness, reproducibility, and correlation with physical capacity. | No | Populations of adults with multiple etiologies of heart disease | Objective measurements of exercise level allow estimates of peak capacity for specific work and recreational activities. Markedly influenced by level of patient effort. |
| Physical Functional Domain | Functional Assessment Tool | References | Qualifications to Administer | How It Is Administered |
|---|---|---|---|---|
| Cardiovascular System | Cardiopulmonary exercise tolerance test with gas exchange measurement during treadmill or bicycle exercise (occasionally with hand ergometer) | ATS/ACCP, 2003 | Licensed exercise physiologist or other licensed provider; additional expertise needed beyond that for other exercise testing | Equipment for usual exercise testing with additional equipment needed for metabolic equivalents |
| Time to Administer | Psychometric Properties (reliability, validity) | Proprietary | Population to Which It Applies | Comments |
|---|---|---|---|---|
| 40–60 minutes | Most responsive and reproducible measurement of integrated heart and lung reserve and high correlation with physical capacity. | No | Populations of adults with multiple etiologies of heart disease | Level of effort can be objectively assessed from measured gas exchange. Provides the most accurate measurement of peak physical work capacity in the exact units that have been measured for specific work and recreational activities. Estimation can be made of the lower level of activity that could likely be sustained for 50 minutes. |
ANNEX TABLE 5-6
Selected Visual Assessments
| Physical Functional Domain | Functional Assessment Tool | References | Qualifications to Administer | How It Is Administered |
|---|---|---|---|---|
| Visual Acuity | Snellen Chart | Chen et al., 2012; Kaiser, 2009 | Ophthalmologist, optometrist | Chart, read one eye at a time, at a distance of 10 or 20 feet |
| Bailey-Lovie Chart | Bailey and Lovie, 1976; Kaiser, 2009; NRC, 2002 | Ophthalmologist, optometrist | Chart, read one eye at a time | |
| Early Treatment Diabetic Retinopathy Study visual activity chart | Bailey and Lovie, 1976; Chen et al., 2012; Kaiser, 2009; NRC, 2002 | Ophthalmologist, optometrist | Chart, read one eye at a time | |
| Peripheral Vision | Kinetic perimetry | Grobbel et al., 2016 | Perimetrist | |
| Semiautomated kinetic perimetry | Grobbel et al., 2016 | Perimetrist | Allows computer-controlled standardized presentation for any chosen Goldmann stimulus size-intensity combination | |
| Time to Administer | Psychometric Properties (reliability, validity) | Proprietary | Population to Which Applies | Comments |
|---|---|---|---|---|
| Quick and easy to administer | Disadvantage: each line has a variable letter size and variable letters per line; not all presented characters are equally legible. | |||
| Quick and easy to administer | Improved test-retest reliability. | Used for purposes of determining eligibility for driving and legal blindness | Each row has the same number of letters with between-letter spacing equal to 1 letter width; letter size follows a geometric progression. | |
| Prolonged testing time compared with Snellen Chart | Improved test-retest reliability. | Used for purposes of determining eligibility for driving and legal blindness | Equal number of characters per row; equal logarithmic decrement between successive rows; use of character types with relatively uniform legibility. | |
| Less tedious and time-consuming compared with conventional automated static perimetry | Used for qualification for driver’s license, assessment of disability, qualification for special support programs for the visually impaired | Advantages: sensitive for detecting peripheral visual field defects; efficient for detection and monitoring progression of steep-edged field defects; kinetic examination results correlate with activities of daily living. | ||
| Greater consistency, reliability, standardization, analysis and interpretation of visual field results. | Individuals with visual field loss | Advantage: can assess the reaction time for a subject for each visual field session. | ||
ANNEX TABLE 5-7
Selected Hearing Assessments
| Physical Functional Domain | Functional Assessment Tool | References | Qualifications to Administer | How It Is Administered |
|---|---|---|---|---|
| Hearing | Pure-tone audiometric screening | McBride et al., 1994; Yueh et al., 2003 | Trained medical assistant, nurse, or physician | In a quiet office setting using a handheld or portable device |
| Otoacoustic emissions (OAEs) | Wang et al., 2002 | Trained medical assistant, nurse, or physician | In a quiet office setting using portable equipment | |
| Hearing localization tasks | Abel et al., 2009; Przewozny, 2016 | Audiologist or scientist with expertise in spatial hearing | Using multiple sound sources in an acoustically treated environment | |
| Diagnostic pure-tone audiometry | ASHA, 2005; Roeser et al., 2000 | Audiologist | Using specialized equipment in a sound-treated test booth | |
| Extended Speech Intelligibility Index (ESII) | Soli et al., 2018a,b | Audiologist | Using software to estimate the impact of an audiogram in real-world listening conditions | |
| Speech recognition in noise testing | Giguère et al., 2008; Laroche et al., 2003 | Audiologist | Using recorded speech materials delivered at a calibrated level in an audiometric test booth | |
| Live-voice speech testing | MacPhee et al., 1988 | Anyone | A person says words or phrases that the listener must repeat back | |
| Internet- and telephone-based screening | Smits et al., 2004; Watson et al., 2012 | None | Speech in noise is presented either over the phone or through an Internet-based application | |
| Time to Administer | Psychometric Properties (reliability, validity) | Proprietary | Population to Which Applies | Comments |
|---|---|---|---|---|
| 3 minutes per ear | Sensitivity: 0.8–0.96; specificity: 0.77–0.89. | No | Older children, adults, elderly | |
| 3–5 minutes per ear | Sensitivity: 0.91–0.98; specificity: 0.62–0.86. | No | Any age | |
| 30–45 minutes | Test-rest reliability of 0.8, with differences of 1–3 degrees. | No | Adults | Not widely implemented because of technical challenges. |
| 20 minutes | Test-retest reliability of 0.9, with differences of 3–5 dB. | No | Any age | |
| 5 minutes | Test-retest reliability ranging from 0.78 to 0.97. | No | Any age | Software for calculating ESII is not currently available. |
| 15 minutes | Test-retest reliability of 0.85 or higher for recorded materials. | Yes, depending on the stimuli | Any age | |
| 1–2 minutes | Sensitivity of 1 for hearing loss and specificity of 0.84. | No | Any age | Numerous limitations related to lack of calibration and standardization across talkers. |
| 5–10 minutes | Sensitivity of 0.80 for hearing loss and specificity of 0.84. | Yes | Adults | |
| Physical Functional Domain | Functional Assessment Tool | References | Qualifications to Administer | How It Is Administered | |||||
|---|---|---|---|---|---|---|---|---|---|
| Hearing | |||||||||
| Hearing questionnaires: | None | Can be administered as an interview or self-administered by the listener | |||||||
| Hearing Handicap Inventory for Adults (HHIA) | Newman et al., 1990 | ||||||||
| Speech, Spatial and Qualities of Hearing Scale (SSQ) | Gatehouse and Noble, 2004 | ||||||||
| Time to Administer | Psychometric Properties (reliability, validity) | Proprietary | Population to Which Applies | Comments |
|---|---|---|---|---|
| 10 minutes | No | Adults | ||
| HHIA—α = 0.93; test-retest reliability of 0.97. | ||||
| SSQ—test-retest reliability of 0.84 for interview and 0.72 for self-administration. | ||||
ANNEX TABLE 5-8
Selected Speech/Fluency and Voice Assessments
| Physical Functional Domain | Functional Assessment Tool | References | Qualifications to Administer | How It Is Administered |
|---|---|---|---|---|
| Speech and Fluency Assessments | ||||
| Intelligibility | Speech/Phoneme Intelligibility Test (SIT) | Yorkston et al., 2007 | MA, MS, SLPD, PhD; CCC, SLP | Record utterances; transcribe and calculate intelligibility, communication efficiency |
| Assessment of Intelligibility in Dysarthric Speech (AIDS) | Yorkston et al., 1984 | |||
| Phoneme Intelligibility Test | Yorkston et al., 2007 | MA, MS, SLPD, PhD; CCC, SLP | Record utterances; transcribe and calculate intelligibility in words | |
| Motor Speech Disorders | Frenchay Dysarthria Assessment, 2nd Edition | Enderby and Palmer, 2008 | MA, MS, SLPD, PhD; CCC, SLP | Rate performance on speech tasks, structures, and functions |
| Apraxia Battery for Adults, 2nd Edition | Dabul, 2000 | MA, MS, SLPD, PhD; CCC, SLP | 6 subtests with varying levels of speech production complexity | |
| Apraxia of Speech Rating Scale | Strand et al., 2014 | MA, MS, SLPD, PhD; CCC, SLP | 16 items; scored 0–4 for characteristics, prominence, severity on speech production tasks | |
| Time to Administer | Psychometric Properties (reliability, validity) | Proprietary | Population to Which Applies | Comments |
|---|---|---|---|---|
| 30 minutes | Madonna Rehabilitation Institute, Lincoln, Nebraska | Literate, English | SIT is computer based. | |
| ProEd | AIDS is paper based. | |||
| 30 minutes | Literate, English | |||
| 20 minutes | ProEd | Ages 12–97, English | ||
| 20 minutes | Reliability: α = 0.83–0.99; validity: content, criterion, construct. | Adolescents, adults, English | ||
| 30 minutes | Reliability: ICC = 0.94; validity: specificity 100%, sensitivity 75–96%. | Journal of Communication Disorders | Adults, English | |
| Physical Functional Domain | Functional Assessment Tool | References | Qualifications to Administer | How It Is Administered |
|---|---|---|---|---|
| Functional Communication | Communication Effectiveness Checklist | PRO | ||
| Communication Participation Item Bank | Baylor et al., 2013 | PRO | ||
| Levels of Speech Usage | Baylor et al., 2008 | PRO | 5-category scale rates type, frequency, amount, and perceived importance of daily speaking situations | |
| Fatigue Severity Scale | Krupp et al., 1989 | PRO | 9 items; 7-point Likert scale | |
| Quality of Communication Life Scale | Paul et al., 2004 | MA, MS, SLPD, PhD; CCC, SLP | Psychosocial, vocational, educational effects of communication impairment | |
| ASHA Functional Assessment of Communication Skills for Adults | Frattali et al., 2017 | MA, MS, SLPD, PhD; CCC, SLP | 43 items | |
| Time to Administer | Psychometric Properties (reliability, validity) | Proprietary | Population to Which Applies | Comments |
|---|---|---|---|---|
| English | ||||
| English | ||||
| English | ||||
| 5 minutes | Valid, reliable. | Archives of Neurology, open access | Adults; multiple sclerosis, traumatic brain injury (TBI), Parkinson’s disease; variety of populations | Several language versions validated. |
| 15 minutes | Validated. | American Speech-Language-Hearing Association (ASHA) | Adults with neurogenic communication disorders, English | |
| Validated. | ASHA | Adults with stroke, TBI; English | Downloadable Excel spreadsheet to calculate scores. | |
| Physical Functional Domain | Functional Assessment Tool | References | Qualifications to Administer | How It Is Administered |
|---|---|---|---|---|
| Fluency | Behavior Assessment Battery for Adults who Stutter | Brutten and Vanryckeghem, 2003, 2007 | PRO | Individual indicates strength of various negative emotional reactions to situations |
| Overall Assessment of the Speaker’s Experience of Stuttering-Adult | Yaruss, 2010; Yaruss and Quesal, 2006 | MA, MS, SLPD, PhD; CCC, SLP; PRO | Individual responds to each question on 5-point Likert scale | |
| Stuttering Severity Instrument, 4th Edition | Riley and Bakker, 2009 | MA, MS, SLPD, PhD; CCC, SLP | Collect speech using pictures and readings provided; score frequency and severity | |
| Time to Administer | Psychometric Properties (reliability, validity) | Proprietary | Population to Which Applies | Comments |
|---|---|---|---|---|
| Validity: construct, content; reliability: internal (α = 0.96–0.98). | Plural Publishing, Inc. | Adults who stutter | ||
| 20 minutes | Validated; criterion-referenced. | Stuttering Therapy Resources, Inc. | Ages 18+, English | Electronic and paper versions; also validated in Dutch, German, Hebrew, Portuguese, Spanish; based on International Classification of Functioning, Disability and Health. |
| 20 minutes | Descriptive; norm-referenced (N = 60 adults). | ProEd | Ages 2–adult | Has a computerized scoring option. |
| Physical Functional Domain | Functional Assessment Tool | References | Qualifications to Administer | How It Is Administered |
|---|---|---|---|---|
| Voice Assessments | ||||
| Patient-Reported Assessment/Outcomes (PRO) | Voice Outcome Survey | Gliklich et al., 1999 | PRO | 5-point Likert scale |
| Voice-Related Quality of Life | Hogikyan and Sethuraman, 1999 | PRO | 5-point Likert scale | |
| Communication Participation Item Bank | Baylor et al., 2013 | PRO | 5-point Likert scale | |
| Linear Analog Scale Assessment of Voice Quality | Llewellyn-Thomas et al., 1984 | PRO | Visual analog scale | |
| Voice Handicap Index 10 | Arffa et al., 2012; Rosen et al., 2004 | PRO | 5-point Likert scale | |
| Auditory-Perceptual | Consensus Auditory-Perceptual Evaluation of Voice | ASHA DIV3, n.d.; Zraick et al., 2011 | MA, MS, PhD; CCC, SLP | Visual analog scales, measure mm (0–100) |
| Grade, Roughness, Breathiness, Asthenia, Strain (GRBAS) scale | Carding et al., 2009; Hirano, 1981 | MA, MS, PhD; CCC, SLP | 4-point grading scale (0 = normal/absent deviance; 1 = slight deviance; 2 = moderate deviance; 3 = severe deviance) | |
| Time to Administer | Psychometric Properties (reliability, validity) | Proprietary | Population to Which Applies | Comments |
|---|---|---|---|---|
| 5 items | Validity: content, construct, longitudinal, convergent; reliability +. | No | 5th-grade literacy, English, unilateral vocal fold paralysis | |
| 10 items | Validity: content, longitudinal, convergent; reliability +. | No | English, voice disorders | |
| 48 items, long version; 10 items, short version | Validity: content, construct, convergent; reliability +. | No | English, communication disorders | |
| 16 items | Validity: content, longitudinal, convergent; reliability +. | No | English, laryngeal cancer | |
| 10 items | Validity: construct, convergent; reliability +. | No | 5th-grade literacy, English, voice disorders | |
| Speech tasks: vowels, sentences, running speech; 6 items completed after person performs voice tasks | Construct validity, reliability +. | ASHA, available at http://www.asha.org | Voice disorders | |
| Assess current conversational speech or reading aloud | Valid and reliable. | |||
| Physical Functional Domain | Functional Assessment Tool | References | Qualifications to Administer | How It Is Administered |
|---|---|---|---|---|
| Visual-Perceptual | Laryngoscopy, endoscopy, stroboscopy | Poburka, 1999 | MD; MA, MS, PhD; CCC, SLP | Examine structures at rest and during speech |
| Physiological | Acoustic analyses; Multidimensional Voice Program (MDVP) | MA, MS, PhD; CCC, SLP | ||
| Aerodynamic analyses | ||||
NOTE: α = Cronbach’s alpha; CCC, SLP = certificate of clinical competence, speech-language pathologist; ICC = intraclass correlation coefficient; MA, MS, SLPD, PhD = master of arts, master of science, doctor of speech-language pathology, doctor of philosophy; PRO = patient-reported outcome measure.
| Time to Administer | Psychometric Properties (reliability, validity) | Proprietary | Population to Which Applies | Comments |
|---|---|---|---|---|
| 30 minutes | View structures. | |||
| Kay Elemetrics | Habitual pitch, loudness, ranges. | |||
| Average pressure, airflow. | ||||
ANNEX TABLE 5-9
Selected Language Assessments
| Mental Functional Domain | Functional Assessment Tool | References | Qualifications to Administer | How It Is Administered |
|---|---|---|---|---|
| Language and Communication | Boston Diagnostic Aphasia Examination-Third Edition (BDAE-3) Component: Boston Naming Test, Second Edition (BNT-2) |
Goodglass et al., 2000 | MA, MS, PhD; CCC, SLP | Long version: every test in the inventory; short version: selected items from test inventory; extended testing probes language within each area; assessment of aphasia and related disorders includes aphasia definition and characteristics, normative basis, administration and interpretation instructions, severity rating, visuospatial and quantitative skills after brain injury |
| Western Aphasia Battery-Revised | Kertesz, 2007 | MA, MS, PhD; CCC, SLP | Individually administered subtests | |
| Arizona Battery for Communication Disorders of Dementia | Bayles et al., 1989, Bayles 1993 | MA, MS, PhD; CCC, SLP | 17 subtests (speech discrimination, visual perception, literacy) | |
| Time to Administer | Psychometric Properties (reliability, validity) | Proprietary | Population to Which Applies | Comments |
|---|---|---|---|---|
| Long version: 60–120 minutes; short version: 30–45 minutes | Reliability: 0.68–0.98; demonstrates good internal consistency; validity: discriminant analysis yielded no misclassification; normative data: 242 people with aphasia. | https://www.linguisystems.com (accessed June 21, 2019) | Adult, aphasia, brain injury | |
| Bedside screen: 15 minutes; full: 45 minutes, 8 tests, 105 minutes, 8+ supplementary | Reliability: test-retest, inter- and intrajudge; validity: face, content, construct. | Kertesz, 1982, 2007 | Adult, aphasia, brain injury | Even when considered nonaphasic, has ongoing discourse impairments; high scores correlate with Communicative Effectiveness Index functional communication; evidence of racial/ethnic differences on selected subtests. |
| 45–90 minutes | Validity: criterion, construct. | Adult (15+ yrs), Alzheimer’s, Parkinson’s disease, traumatic brain injury (TBI) | ||
| Mental Functional Domain | Functional Assessment Tool | References | Qualifications to Administer | How It Is Administered |
|---|---|---|---|---|
| Language and Communication | Porch Index of Communicative Ability-Revised | Porch, 2001 | MA, MS, PhD; CCC, SLP certified in scoring system | Multidimensional scoring designed to measure level of performance; 18 subtests |
| Psycholinguistic Assessments of Language Processing in Aphasia (PALPA) | Kay et al., 1992 | 60 subtests (auditory processing, reading, spelling, naming, comprehension) | ||
| National Institutes of Health (NIH) Stroke Scale | NINDS, 2011 | Certified health care provider (participate in online training) | 15 items (consciousness, language, neglect, visual field, extraocular movement, motor strength, ataxia, dysarthria, sensory) | |
| Comprehensive Aphasia Test (CAT) | Swinburn et al., 2004 | MA, MS, PhD; CCC, SLP | 34 subtests (language comprehension, repetition, spoken language, reading, writing) | |
| Peabody Picture Vocabulary Test, 5th Edition | Dunn, 2018 | MA, MS, PhD; CCC, SLP | Select image from 4 displayed | |
| Expressive Vocabulary Test, 3rd Edition | Williams, 2018 | MA, MS, PhD; CCC, SLP | ||
| Time to Administer | Psychometric Properties (reliability, validity) | Proprietary | Population to Which Applies | Comments |
|---|---|---|---|---|
| http://www.picaprograms.com/pica-test-materials-and-pricing.html (accessed April 4, 2019) | Adult, aphasia | Evidence that scoring is not of equal intervals. | ||
| 90–120 minutes | None | |||
| <10 minutes | Reliability: interrater reliability = 0.62; validity: content, responsiveness. | NINDS, 2011 | Stroke, aphasia | Dutch, English, Italian, Portuguese, Spanish. |
| 90–120 minutes | Validity: none; reliability: interrater (0.90). | Adult aphasia | ||
| 10–15 minutes | Validity; reliability. | Pearson | Ages 26–90+ | Receptive vocabulary; correlates with cognition; online scoring system available. |
| 15–20 minutes | Validity; reliability. | Pearson | Expressive vocabulary; online scoring available. | |
| Mental Functional Domain | Functional Assessment Tool | References | Qualifications to Administer | How It Is Administered |
|---|---|---|---|---|
| Language and Communication | Cognitive Linguistic Quick Test-Plus | Helm-Estabrooks, 2017 | MA, MS, PhD; CCC, SLP | 5 communication domains (attention, memory, executive functions, language, visuospatial skills) |
| Communicative Activities of Daily Living-2 | Holland et al., 1999 | MA, MS, PhD; CCC, SLP | 50 items (social interaction, communication, sequential relationships, humor/metaphor/absurdity) | |
| Pragmatic Protocol | Prutting and Kirchner, 1987 | MA, MS, PhD; CCC, SLP | 30 communication abilities observed | |
| Assessment of Pragmatic Abilities and Cognitive Substrates (APACS) | Arcara and Bambini, 2016 | MA, MS, PhD; CCC, SLP | 2 domains: discourse and nonliteral language | |
| Communication Effectiveness Inventory | Lomas et al., 1989 | PRO | 16 communication situations | |
| La Trobe Communication Questionnaire | Douglas et al., 2000 | 2 forms: PRO, clinician | 30-item Likert-type ratings | |
| Communication Checklist-Adult | Whitehouse and Bishop, 2009 | Well-known informant | 70 items | |
| Time to Administer | Psychometric Properties (reliability, validity) | Proprietary | Population to Which Applies | Comments |
|---|---|---|---|---|
| 15–30 minutes | One pilot (N = 13) and three studies (N = 92, 154, 119, respectively) established reliability and validity; criterion-referenced; descriptive severity. | Pearson | Adult ages 18–90, aphasia, brain injury | English and Spanish versions. |
| 30 minutes | Reliability: coefficient (0.93), test-retest (0.85), interrater (0.99); validity: 0.66. | Adult | ||
| 15 minutes | Reliability: interrater (0.90). | |||
| 35–45 minutes | Reliability: test-retest; internal consistency (α = 0.60–0.70); validity: construct, content. | Download | Adults ages 19–89 | |
| 10 minutes | Internal consistency (α = 0.90), test-retest (ICC = 0.94), interrater (ICC = 0.73); validity: construct. | Adults, literate, aphasia | ||
| PRO: 30 minutes; informant: 15 minutes | Internal consistency (α = 0.8596); reliability: test-retest (r = 0.7558). | Adolescents ages 13–17, adults ages 18–64; TBI | See Donovan et al., 2008. | |
| Pearson | Adults, developmental and acquired | |||
| Mental Functional Domain | Functional Assessment Tool | References | Qualifications to Administer | How It Is Administered |
|---|---|---|---|---|
| Language and Communication | Stroke and Aphasia Quality of Life Scale-39 | Hilari et al., 2003 | PRO | 39 items |
| Assessment of Living with Aphasia | Simmons-Mackie et al., 2014 | |||
| Aphasia Communication Outcome Measure | Hula et al., 2015 | PRO | 59 items; domains: talking, comprehension, writing | |
| American Speech-Language-Hearing Association Functional Assessment of Communication Skills | Frattali et al., 1995, 2017 | MA, MS, PhD; CCC, SLP; PRO | 43 items, 4 domains (social, basic need, written language, and daily planning) | |
| ASHA Quality of Communication Life Scale | Paul et al., 2004 | MA, MS, PhD; CCC, SLP; PRO | ICF participation focus | |
NOTE: α = Cronbach’s alpha; CCC, SLP = certificate of clinical competence, speech-language pathologist; ICC = intraclass correlation coefficient; MA, MS, PhD = master of arts, master of science, doctor of philosophy.
| Time to Administer | Psychometric Properties (reliability, validity) | Proprietary | Population to Which Applies | Comments |
|---|---|---|---|---|
| Reliability: internal consistency (α = 0.74–0.94), test-retest (ICC = 0.89–0.98); validity: acceptability, construct (r = 0.38–0.58; convergent, r = 0.55–0.67; discriminant, r = 0.02–0.27). | Adults with stroke, aphasia | |||
| Internal consistency reliability coefficient >0.80. | ||||
| Communicative functioning in aphasia (validity: factor analyses supported a coherent measurement model, items functioned similarly across demographic and clinical subgroups, and scores showed convergence with related constructs). | JSLHR, 2015 | Adult, aphasia | ||
| 20 minutes | Reliability: interrater (0.88–0.95); validity: external (0.73). | Rockville, MD; ASHA | Adult, U.S. American | A software application available from the first author may be used to administer and score the assessment. |
| 15 minutes | Reliability; validity. | Rockville, MD; ASHA | Adult, neurogenic communication impairments | |
This page intentionally left blank.


