
2
The Scope and Burden of Traumatic Brain Injury
This chapter reviews the scope and burden of traumatic brain injury (TBI), including the frequency of injury among segments of the global and U.S. populations. The chapter examines the economic cost of TBI and the potential for cost savings from improved care and outcomes. Finally, the chapter highlights themes reported by patients and families during the study’s information-gathering workshops with respect to the burden imposed by TBI. The data and testimonies summarized in this chapter establish TBI as a significant health challenge.
FREQUENCY OF TRAUMATIC BRAIN INJURY
This section presents epidemiological data on the frequency—incidence and prevalence—of TBI.1
___________________
1 The incidence of TBI reflects newly diagnosed cases of people with TBI over a specified period, often a year. It provides the rate of TBI—how frequently such injuries are occurring. Prevalence, on the other hand, reflects the total number of cases of people with TBI in a population at a given time. Prevalence is a percentage, representing what proportion of the population is affected by TBI at the measured time.
Limitations in Data and Data Quality
Limitations in TBI surveillance are broadly recognized, and it is widely acknowledged that nearly all TBI estimates are undercounts. These limitations affect estimates of mortality, hospitalization, emergency department (ED) care, and population-level incidence.
The most comprehensive source for mortality data in the United States is the National Vital Statistics System, which collects information from death certificates. Although the death certification process in the United States is very thorough, case identification of deaths due to TBI is challenging. Traumatic deaths disproportionally occur out of hospital, becoming the jurisdiction of a medical examiner’s office. If the intent of the death is not in question (e.g., not a homicide)—as in a fall or road traffic injury, both of which are leading causes of TBI—an autopsy is not required, and detailed diagnoses are often not provided on the death certificate. Many deaths of individuals who sustained a TBI are identified as “blunt traumatic injury,” and thus are not coded as TBIs in vital statistics data systems. Deaths that occur after an extended period of disability due to TBI may also not be captured, even if the ultimate cause of death is related to the initial injury.
Globally, mortality underestimates are far more problematic. In 2012, the World Health Organization (WHO) examined vital statistics systems and rated only roughly 20 countries, all high-income, as having high-quality death certification systems (WHO, 2014). Many countries use hospital-based death certification systems, yet up to 80 percent of deaths—and disproportionately traumatic deaths—occur outside of health care settings (World Bank/WHO, 2014). WHO estimates that two-thirds of all deaths globally are not counted, with low-income countries the most impacted. Thus, mortality due to TBI may be far greater than is currently known.
The most common source of TBI incidence data is health care records, and sources such as the Healthcare Cost and Utilization Project’s (HCUP’s) National Inpatient Sample, the National Emergency Department System, the Consumer Product Safety Commission’s National Electronic Injury Surveillance System, and the American College of Surgeons’ National Trauma Data Bank have all been used to estimate incidence. In each of these sources, cases of people with TBI are ascertained through the International Classification of Diseases (ICD) codes (and related Diagnosis Related Group codes)—a detailed listing of individual medical diagnoses. In the Ninth Revision of the ICD (ICD-9), used from the 1990s to 2015, traumatic injury codes were difficult to differentiate from nontrauma and neurologic disease codes. Although the current ICD-10 coding system includes more codes specific to TBI, identification remains challenging. For example, many analyses rely only on the primary diagnosis in a record, defined as the diagnosis requiring the most care. If a patient has multiple injuries and a brain injury is not the most severe of these at the time of admission (e.g., the patient also has an open fracture), the brain injury may be recorded as a secondary code and thus not picked up by case ascertainment algorithms.
Because of differences in the databases available for studying TBI and their coding limitations, TBI incidence estimates vary widely. One study found that the sample population estimates for ED visits in the National Inpatient Survey were 805 percent higher in 2007 and 1,169 percent higher in 2013 than those in the National Trauma Data Bank (Stopa et al., 2020), mainly because the latter source includes primarily large trauma hospitals and so misses many milder brain injuries. Studies have also examined the predictive value of the ICD-10 system in detecting cases of people with TBI by comparing those data against the corresponding full medical records. One study focused on intracranial injury and skull fracture. Because these are severe injuries with very specific ICD-10 codes, the authors hypothesized that the codes would have very high predictive value (i.e., ability to catch all cases). They found, however, that the predictive value for intracranial injury ranged from 82
percent to 92 percent and for skull fracture from 57 percent to 61 percent (Gabella et al., 2021). A study in New Zealand designed to prospectively identify people with TBI found that the medical records of only 312 (18.6 percent) of 1,369 identified TBI cases contained one of the TBI ICD-10 diagnostic codes (Barker-Collo et al., 2016). And an analysis of Department of Veterans Affairs (VA) data comparing three ICD algorithms for capturing TBI found only partial sensitivity (Carlson et al., 2013).
Estimating the incidence of people with cases on the milder end of the TBI spectrum poses even more substantial challenges relative to TBIs causing death or requiring acute care. Because many individuals with less severe injury do not seek acute care, no secondary data sources are available with which to enumerate them, and acute care for some such cases may be provided in outpatient or sports medicine clinics, for which nationally weighted data are not collected. Studies have found that a large proportion of people with TBI do not seek medical care at all. For example, in the New Zealand prospective study referenced above, 64 percent of people with TBI went to a hospital, 8 percent saw a family doctor, and 28 percent were identified through other sources (Feigin et al., 2013). Studies of medical sources show that 75–80 percent of TBI is in the mild category (Bruns and Hauser, 2003; CDC, 2003; Sosin et al., 1996), and the impact of undercounting such a prevalent outcome results in vastly underestimating the burden of TBI. The recognized limitations in data from such sources as medical coding, insurance claims, and death certificates also highlight the complementary role of self-reporting using structured and validated screening tools, including questionnaires and interviews, in helping to better understand the prevalence and burden of TBI.
Finally, it should be noted that data on race, ethnicity, and rates of TBI are difficult to interpret. One challenge is that race/ethnicity categories between TBI sources and population data often do not align, with different categories, different options for identifying multiple races, and different formats for differentiating race and ethnicity. Ongoing discussions with agencies that collect data to study race/ethnicity as a health determinant, such as the National Center for Health Statistics, to identify more uniform coding protocols will be valuable in improving the capture and presentation of race/ethnicity health data.
Global TBI Incidence and Prevalence
According to the most comprehensive study to date on the estimated global incidence of TBI, more than 27 million new cases of people with medically treated TBI occurred in 2016, for an age-standardized incidence of 369 per 100,000 world population (James et al., 2019). This study estimated global TBI prevalence at more than 55 million, indicating that about 0.7 percent of the world’s population was living with a medically treated brain injury. These estimates are from the Global Burden of Disease study and literature review, however, and the authors acknowledge many limitations in their TBI estimation. For example, these estimates include only hospital-treated TBI, which excludes deaths occurring prior to hospital arrival (at-scene), injuries treated in nonhospital settings or not treated at all, and individuals seeking treatment for symptoms after their original injury.
Several studies have extrapolated global TBI estimates from more focused studies. The BIONIC study in New Zealand estimated population-level TBI incidence (Barker-Collo and Feigin, 2009; Feigin et al., 2013; Theadom et al., 2012) using multiple-source prospective case ascertainment of TBIs of all severity, regardless of medical treatment. The authors of this study
estimated a TBI incidence of 790 per 100,000, which extrapolates globally to more than 50 million TBIs occurring each year, with approximately 30 percent of these individuals not seeking acute medical care (Feigin et al., 2013). Dewan and colleagues (2019) estimated the global incidence of TBIs of all severity, regardless of medical care, based on the proportion of TBIs in road traffic injuries (such as motor vehicle crashes) and incidence ratios in more than 240 published studies (Dewan et al., 2019). They estimated a TBI incidence of 939 per 100,000 population, which included 55.9 million mild and 5.48 million severe TBIs annually. These estimates are far higher than any other global estimates, yet are unlikely to include falsely identified cases of people with TBI, and therefore provide some idea of the extent of TBI undercounting.
Comparing rates of TBI across countries and over time is highly problematic because of underreporting and difficulty in ascertaining cases. The Lancet Neurology Commission on TBI reported that estimates from region-specific population studies range from 200 to 600 TBIs per 100,000 people, with variance based on such factors as case definition and ascertainment, the qualities of data systems, and methodological differences (Johnson and Griswold, 2017). Based on data from the Global Burden of Disease consortium, TBI rates were highest in central and eastern Europe and central Asia (James et al., 2019). Dewan and colleagues (2019) concluded that although their measured per capita TBI rates were highest in high-income countries, low- and low-middle income countries experienced nearly three times more total TBIs. Access to trauma care is an important factor in considering global estimates of TBI. Indeed, by one estimate, approximately 2 million lives could be saved if trauma care available in high-income countries were available in lower- and middle-income countries (Mock et al., 2012).
Studies generally find that TBI is increasing globally. From 1990 to 2016, the incidence and prevalence of medically treated TBI rose globally by 3.6 percent and 8.4 percent, respectively (James et al., 2019). These increases were driven mainly by increases in fall-related TBI among older adults, particularly in high-income countries, as well as by road traffic injuries and violence, which rose particularly rapidly in low- and middle-income countries.
Measures that reflect disproportionately high TBI rates among the young and account for the high rates of disability among survivors are important for understanding the true population-level burden of TBI. However, very few studies have estimated such measures as premature loss of life or years lived with disability. One study of 16 European countries found that TBI contributed more than 1.3 million years of potential life lost (YPLL) in 2013, which accounted for 41 percent of overall YPLL among all injuries (Majdan et al., 2017). The Global Burden of Disease TBI consortium estimated that TBI was responsible for 8.1 million years lived with disability, with a global disability rate of 111 per 100,000 population (James et al., 2019).
TBI Incidence in the U.S. Civilian Population
The Centers for Disease Control and Prevention (CDC) initiated efforts to create a system for national surveillance for TBI by launching the multistate Traumatic Brain Injury Surveillance Program in 1989 (Thurman et al., 1999). The program began by funding 4 states to collect population-based incidence data and by 1997 had grown to include 15 states. In the first official report from this program, it was estimated that each year, a TBI was sustained by 1.5 million Americans, 50,000 of whom died; 230,000 of whom were hospitalized; and 90,000 of whom experienced long-term disability, with an estimated prevalence of 5.3 million people living with a permanent TBI-related disability. In addition to generating among the first population-based TBI incidence estimates, CDC’s TBI Surveillance Program initiated efforts to standardize data definitions and reporting. For example, Guidelines for Surveillance of Central Nervous System Injury was published in 1995 to support the collection of valid, comparable data (Thurman et al., 1995).
CDC’s National Center for Injury Prevention and Control continues to report TBI incidence data for the United States but now relies on death certificates and weighted national samples of health data, enabled by improvements in electronic medical records. The center’s most recent report provides information on TBI mortality in 2017, including an estimated 61,131 TBI deaths (Daugherty et al., 2019).2 TBI-related death rates remained steady at about 17.5 per 100,000 from 2000 through 2005, decreased to 16.3 in 2014, and increased back to 17.5 in 2017. Throughout this period, TBI death rates were significantly higher for males than for females and were higher for American Indian/Alaska Native people than for other reported racial/ethnic groups. The leading causes of TBI death included motor vehicle crashes, falls, suicide, and homicide. Suicide became the leading cause of TBI-related death, increasing by 32 percent over this period, with the highest increase among non-Hispanic White people.
The most recent report on the incidence of nonfatal TBI provides data for 2016–2017 (CDC, 2021). This report, as well as prior reports for 2014 (CDC, 2019) and 2007 and 2013 (Taylor et al., 2017), use data from the Health Resources and Services Administration’s (HRSA’s) HCUP Nationwide Emergency Department Sample and National Inpatient Sample. Prior studies, from 2003 (Rutland-Brown et al., 2006) and 2002 to 2006 (Faul et al., 2010), used data from the National Hospital Discharge Survey and National Hospital Ambulatory Medical Care Survey. All of the above sources represent nationally weighted samples of electronic medical records.
According to the CDC (2021) report, in 2017 there were almost 224,000 TBI-related hospitalizations, with the rates highest among those over age 75 (320.8 per 100,000), those aged 65–74 (102.7), and those aged 55–64 (67.5). The leading causes of TBI hospitalization were falls (49.1 percent) and motor vehicle crashes (24.5 percent). An estimated 61,000 deaths were attributed to TBI in 2017, with mortality rates highest among those over age 75 (77.0 per 100,000), those aged 65–74 (24.3 per 100,000), and those aged 55–64 (19.5 per 100,000). See Figure 2-1 and Table 2-1 for rates of hospitalizations and deaths by age group.
___________________
2 Note that this number represents an undercount of cases of people with TBI because it requires an ICD-10 TBI code and uses new methodology that requires the presence of a cause-of-injury code.
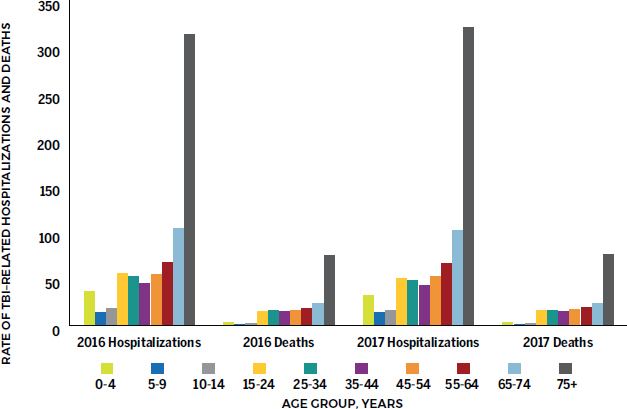
SOURCE: CDC, 2021.
| Hospitalization Rate per 100,000 Population (95% CI) |
Death Rate per 100,000 Population (95% CI) |
|||||
|---|---|---|---|---|---|---|
| Age Group (years) | 2014 | 2016a | 2017a | 2014 | 2016 | 2017 |
| 0–17 | 31.4 (27.6–35.1) | 26.5 (23.3–29.7) | 23.9 (21.0–26.9) | 3.4 (3.3–3.6) | 3.7 (3.5–3.8) | 3.8 (3.7–4.0) |
| 0–4 | 45.1 (38.5–51.7) | 37.1 (31.4–42.8) | 32.7 (27.2–38.1) | 3.6 (3.4–3.9) | 3.6 (3.3–3.8) | 3.8 (3.5–4.0) |
| 5–9 | — | 14.4 (12.1–16.8) | 14.1 (11.9–16.3) | — | 1.5 (1.3–1.7) | 1.3 (1.2–1.5) |
| 10–14 | — | 18.5 (15.8–21.3) | 16.7 (14.2–19.2) | — | 2.5 (2.2–2.7) | 2.5 (2.3–2.7) |
| 5–14 | 20.0 (17.1–22.9) | — | — | 1.9 (1.7–2.0) | — | — |
| 15–24 | 60.1 (55.3–64.9) | 55.9 (51.3–60.5) | 51.0 (47.0–55.0) | 14.4 (14.0–14.7) | 15.9 (15.5–16.3) | 16.3 (15.9–16.7) |
| 25–34 | 58.6 (54.1–63.2) | 53.0 (48.7–57.3) | 48.5 (44.6–52.4) | 14.7 (14.3–15.0) | 16.8 (16.4–17.1) | 16.7 (16.3–17.1) |
| 35–44 | 51.8 (48.1–55.4) | 45.6 (42.0–49.1) | 43.4 (40.0–46.8) | 13.7 (13.3–14.1) | 15.2 (14.8–15.6) | 15.1 (14.7–15.5) |
| 45–54 | 70.8 (66.4–75.2) | 55.6 (51.6–59.6) | 53.6 (49.8–57.4) | 16.9 (16.5–17.3) | 16.5 (16.2–16.9) | 17.0 (16.6–17.4) |
| 55–64 | 89.5 (84.8–94.2) | 67.7 (63.3–72.1) | 67.5 (63.5–71.6) | 19.1 (18.7–19.5) | 19.1 (18.7–19.5) | 19.5 (19.1–19.9) |
| 65–74 | 145.5 (139.2–151.8) | 104.8 (99.2–110.4) | 102.7 (97.3–108.1) | 24.7 (24.1–25.3) | 24.2 (23.6–24.7) | 24.3 (23.7–24.9) |
| 75+ | 470.6 (452.8–488.5) | 313.4 (298.5–328.4) | 320.8 (305.8–335.7) | 78.5 (77.2–79.7) | 75.5 (74.3–76.7) | 77.0 (75.8–78.1) |
| Totalb | 90.5 (86.5–94.6) | 70.3 (66.5–74.1) | 68.8 (65.2–72.4) | 17.8 (17.7–18.0) | 18.4 (18.3–18.6) | 18.8 (18.7–19.0)c |
| Adjustedd | 86.1 (84.3–88.0) | 65.7 (64.3–67.2) | 63.6 (62.3–65.0) | 17.0 (16.9–17.2) | 17.3 (17.1–17.4) | 17.5 (17.4–17.7) |
NOTES: In 2016, the TBI surveillance definition was updated to reflect the transition from the use of the International Classification of Diseases, Ninth Revision (ICD-9) to ICD-10 diagnostic codes. Differences in the definitions used before and after 2016 mean that the 2014 numbers are not directly comparable to those for 2016 and 2017. See CDC, 2021 for an explanation. CI = confidence interval.
a In-hospital deaths and patients who transferred from another hospital were excluded.
b Cases with missing age were included. Numbers subject to rounding error.
c Rate significantly different compared with 2016; t-tests p-value <0.05.
d For 2014 rates: age-adjusted to the 2000 U.S. standard population. For 2016 and 2017 rates: cases with missing age were excluded; rates age-adjusted to National Center for Health Statistics (NCHS) 2000 U.S. standard population.
In 2017, the leading causes of TBI death were suicide (34.7 percent) and falls (28 percent) (CDC, 2021). Differences in rates by age and mechanism indicate differing levels of severity by mechanism (for example, suicide is more likely to cause death than is being struck by/against an object) and reduced resiliency/increased severity among older individuals, who have much higher rates of hospitalization and death by falls compared with younger age groups.
In 2014, approximately 2.5 million TBIs were treated in EDs. Rates for ED treatment were highest for those over age 75 (1,682 per 100,000) and aged 0–17 (1,104 per 100,000). The leading mechanisms for TBI in ED patients were falls (47.9 percent); being struck by/against an object, which is a common mechanism for sports injuries (17.1 percent); and road traffic injuries (13.2 percent) (CDC, 2019). According to CDC, between 2006 and 2014, TBI ED visits increased substantially for all leading mechanisms, including road traffic injuries (24 percent increase), falls (80 percent), being struck by/against an object (58 percent), self-harm (60 percent), and assault (18 percent). During this period, however, the TBI-related hospitalization rate decreased 8 percent, primarily as the result of a 34 percent decrease in road traffic–related hospitalizations. A similar decrease of 6 percent was noted for TBI deaths. These estimates are similar to those provided through the Global Burden of Disease study, which reported a 2016 U.S. TBI incidence of 333 per 100,000, with a 3.3 percent decrease between 1990 and 2016 (James et al., 2019).
CDC does not report such measures as YPLL or disability-adjusted life years (DALYs).3 However, Rosenbaum and colleagues (2014) estimated YPLL among hospitalized patients using the National Inpatient Sample, the same hospitalization source as that used by CDC (Rosenbaum et al., 2014). They estimated more than 25.5 million years of potential life lost for all ICD-9 neurologic disease categories between 1988 and 2011, with the highest contribution from the codes of intracerebral hemorrhage and cerebral ischemia. Two other studies have included estimates of YPLL. The first, conducted using TBIs in 1985, yielded an estimate of 1.4 million YPLL and 2.6 million life years lost as a result of temporary and permanent disability (Max et al., 1991). The second study used TBIs from 2012 and estimated DALYs among survivors to be 117,000 lifetimes of quality lost (Lawrence et al., 2018). These estimates are difficult to compare because they are based on different TBI case inclusion criteria, as well as different analytic methods.
TBI incidence rates in the United States have been estimated in a number of studies the majority of which have focused on those who are hospitalized (Bruns and Hauser, 2003; Fife, 1987; Guerrero et al., 2000; Jager et al., 2000; Sosin et al., 1996; Thurman and Guerrero, 1999). These studies have yielded varying rates, generally ranging from 180 to 250 hospitalizations per 100,000 population, 392 to 444 ED visits per 100,000, and 600 to more than 800 total TBIs per 100,000. This variance is attributable to multiple definitions of TBI (e.g., many early studies did not include skull fracture), sampling frames, and data sources (Bruns and Hauser, 2003). Most of these estimates are now outdated, moreover, because of the shift from ICD-9 to ICD-10 codes in the third quarter of 2015, which makes analysis of data from that year particularly difficult. This change improved TBI case ascertainment because the ICD-10 codes are more specific to trauma, and the TBI codes are more detailed. One consistent finding, however, is that the number of TBI-related ED visits is far higher than the hospitalization rate; further, when estimated, the number of people who experience a potential TBI but do not seek medical attention is high.
These studies provide a foundation for increased focus in recent years on what has been considered “mild” TBI. In addition, recognition has grown that “mild” TBI can cause long-
___________________
3 DALYs are a measure of the health burden of a condition, and reflect an estimation of the number of years of life lost due to premature death and the number of years of life lived with illness or disability.
term effects in some people. A burst of research activity over the past decade has sought to advance understanding of TBI, its diagnosis and management, and influences on the trajectories of recovery. Yet despite the resulting advances in knowledge, gaps remain with regard to understanding of the breadth of the burden of disease; objective tools with which to diagnose milder forms of TBI, such as concussion; and treatments to improve outcomes. And the advances in understanding that have been achieved are tempered by substantial gaps in implementation that continue to exist, preventing the potential of these research advances from reaching those adult and pediatric patients who would most benefit (Haarbauer-Krupa et al., 2017).
Pediatric TBI
TBI represents a substantial burden in childhood, resulting in the United States in more than 2,000 deaths and more than 17,500 hospitalizations in 2017 and more than 812,000 ED visits in 2014 (CDC, 2019, 2021). According to CDC’s 2021 Surveillance Report on TBI in the United States,4 children and adolescents aged <18 accounted for roughly 8 percent of TBI-related hospitalizations and about 4.5 percent of TBI-related deaths in 2016 and 2017 (CDC, 2021). Among that age group, falls and motor vehicle crashes were the most common principal mechanisms of injury for hospitalization related to TBI.
The vast majority (>70 percent) of all TBIs, including those in pediatric populations, are defined as mild (Dewan et al., 2016), and more than 70 percent of pediatric patients with mild TBI recover within 1–3 months (Lumba-Brown et al., 2018). Pediatric TBI, including concussion, can result from participation in sports or recreation or from other mechanisms of injury, such as motor vehicle crashes or falls (CDC 2003, 2021). These statistics also likely represent a substantial undercount of the burden of TBI, as many children either do not seek care or seek care with their primary care physician for milder injures (Arbogast et al., 2016), numbers not easily captured in estimates that typically use ED and hospitalization data. In fact, according to the 2017 National Youth Risk Behavior Survey, 2.5 million high school students reported at least one concussion within the prior year (DePadilla et al., 2018). In light of these data, it is clear that TBIs, especially mild TBIs, including concussions, have a wide-ranging impact on children in the United States.
As noted above, there is increasing awareness that the effects of TBI can be experienced not merely acutely, at the time of injury, but also long-term, even throughout the lifespan, and even for injuries classified as mild. This potential for lifetime impact is particularly important for children, for whom TBI can affect both current function and future potential. More than 62 percent of children with moderate-to-severe TBI, and even 14 percent of those with mild TBI, experience ongoing disability, requiring specialized medical services and educational support (Rivara et al., 2012).
TBI Among Older Adults
The distribution of TBI is bimodal with respect to age: the incidence of TBI is highest among the youngest and oldest age groups, which are more susceptible to TBI caused by particular kinds of injuries, including falls and motor vehicle crashes (Haarbauer-Krupa et al., 2021). The majority of TBIs in older adults involve falls, and a single fall is a risk factor for later falls (Faul et al., 2010; Narapareddy et al., 2019). In 2016 and 2017, roughly half of
___________________
4 The report does not include TBIs from VA, military, or federal hospitals; patients who sought care outside of a hospital setting; or those who did not seek care.
TBI-related hospitalizations due to unintentional falls in the United States occurred among adults aged ≥75 (CDC, 2021).
In 2016 and 2017, adults aged ≥55 had the highest rate of TBI-related hospitalization in the United States (CDC, 2021). The rate among adults aged ≥75 (2016: 313.4/100,000; 2017: 320.8/100,000) far exceeded that among those aged 65–74 (2016: 104.8/100,000; 2017: 102.7/100,000) and those aged 55–64 (2016: 67.7/100,000; 2017: 67.5/100,000). During this same period in the United States, the most recently reported CDC data indicate that the rates of TBI-related death were highest in adults aged ≥75 (2016: 75.5/100,000; 2017: 77.0/100,000), followed by those aged 65–74 (2016: 24.2/100,000; 2017: 24.3/100,000) and those aged 55–64 (2016: 19.1/100,000; 2017: 19.5/100,000) (CDC, 2021). In 2017, these figures translated to more than 67,000 hospitalizations and more than 16,000 deaths among adults aged 75 and older (CDC, 2021).
Another study evaluated age group-specific trends in rates of TBI using U.S. census data and data from the National Trauma Data Bank. The investigators found a 20–25 percent increase in trauma center admissions for TBI among those aged 75 and over between 2007 and 2010 (Dams-O’Connor et al., 2013). They noted the tendency for older adults (aged ≥65) with TBI to be White females who had suffered injury from a fall.
A review of the literature on TBI sustained in older adulthood found that the highest incidence of TBI-related ED visits, hospitalizations, and deaths occurred in older adults (Gardner et al., 2018). Another study of TBI in older adults found that TBI was responsible for more than 80,000 ED visits per year among persons aged 65 and older; furthermore, three-quarters of these visits resulted in hospitalization (Thompson et al., 2006). Similarly, a population-based descriptive epidemiological study of TBI-related ED visits in the United States between 2006 and 2010 found that children younger than 3 years and adults older than 60 had the largest increase in TBI rates during that period (Marin et al., 2014).
In addition to exhibiting among the highest rates of TBI-related hospitalization and death, persons 65 years of age and over face especially poor TBI outcomes.
Gender Differences in TBI Incidence
TBI incidence in the United States is significantly higher among males (388 per 100,000) than females (195 per 100,000) (Haarbauer-Krupa et al., 2021). Data indicate that females, who account for just over 50 percent of the U.S. population, account for approximately half of all TBI-related ED visits, 41 percent of TBI-related hospitalizations, and 27 percent of TBI-related deaths (Haarbauer-Krupa et al., 2021). As with other rates of TBI, these may be underestimates, as brain injury often is not reported or detected, particularly in cases of mild injury. There are also no national prevalence estimates for TBI caused by intimate partner violence, although an estimated 30–74 percent of women who experience intimate partner violence have a history of TBI (Haarbauer-Krupa et al., 2021).
Compared with females, males had significantly higher age-adjusted rates of principal mechanisms of injury contributing to TBI-related hospitalization and death in the United States between 2016 and 2017 (CDC, 2021). The most common injuries precipitating hospitalization were unintentional falls, motor vehicle crashes, unintentionally being struck by an object, intentional self-harm, and assault; the latter was more than four-fold higher among men than women (see Figure 2-2 and Table 2-2). Unintentional falls, motor vehicle crashes, suicide, and homicide were the most common injuries contributing to TBI-related death. Additionally, males have higher rates of concussion in certain contact sports, such as football; however, females have higher rates of concussion in gender-comparable sports, such as soccer (Haarbauer-Krupa et al., 2021). An analysis of sex differences in injury rates and recovery
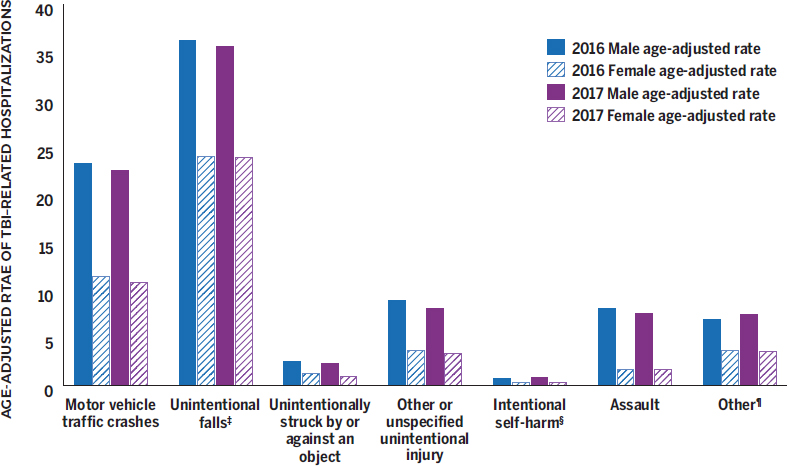
SOURCE: CDC, 2021.
times among National Collegiate Athletic Association (NCAA) athletes who experienced TBI found that females had higher concussion rates than males in baseball/softball, basketball, ice hockey, and soccer; females also took longer than males to recover (longer to return to nonrestricted participation) in almost all sports (Covassin et al., 2016).
TBI Incidence in the U.S. Military Population
TBI incidence is higher among military than civilian populations, in part because of the physical demands of military service and the potentially dangerous activities associated with military operations and training (Haarbauer-Krupa et al., 2021). Notably, military personnel are at greater risk of exposure to explosions that can lead to blast overpressure injuries, and
| Rate (per 100,000 population) | ||||
|---|---|---|---|---|
| TBI Principal Mechanism | Males (2016) | Females (2016) | Males (2017) | Females (2017) |
| Unintentional falls | 36.2 | 24.0 | 35.6 | 23.9 |
| Motor vehicle crashes | 23.3 | 11.4 | 22.5 | 10.8 |
| Unintentionally being stuck by or against an object | 2.5 | 1.2 | 2.3 | 0.9 |
| Intentional self-harm | 0.7 | 0.3 | 0.8 | 0.3 |
| Assault | 8.1 | 1.7 | 7.5 | 1.7 |
SOURCE: CDC, 2021.
penetrating brain injuries from fragments and bullets are an important concern for them as well. Among the U.S. armed services, the incidence of TBI is highest among those in the Army, and is generally higher among those on versus not on active duty. Data from the largest study to date on mental health risk, resilience, and pathophysiology in army service members (Army STARRS), however, found that nearly half of those entering the service reported experiencing a concussion or mild TBI prior to enlistment (Naifeh et al., 2019; Stein et al., 2012), highlighting the prevalence of brain injury in the civilian population. By comparison, according to unpublished data from this same study, approximately 20 percent reported having been “knocked out” or “dazed” at some time while in or after joining the service.5 Although preenlistment TBIs are common, however, deployment-acquired TBIs are more strongly associated with elevated risk for posttraumatic stress disorder (PTSD), generalized anxiety disorder, major depressive episodes, and suicidality (Naifeh et al., 2019; Stein et al., 2019).
The Department of Defense (DoD) provides publicly available information about the number of service members who have sustained a mild, moderate, penetrating, or severe TBI since 2000 (see Table 2-3). TBIs are identified based on billing codes from insurance claims for inpatient or outpatient TBI medical encounters defined by the appropriate ICD coding guidelines.6 These statistics include TBIs sustained by service members during military training, military deployment, and day-to-day activities. Of note, among service members having sustained more than one TBI, the reporting counts only a single TBI; if a service member has sustained multiple TBIs of different types, the injury with the highest severity is reported. Of more than 434,000 TBIs reported since 2000, the majority (82.3 percent) were classified as mild (for example, concussion).
The VA’s Traumatic Brain Injury Veterans Health Registry captures data about TBIs experienced by Veterans who seek care or benefits from the VA and who served in Operation Enduring Freedom (OEF), Operation Iraqi Freedom (OIF), or Operation New Dawn (OND). Data in the registry are drawn from such sources as the VA TBI Screen, administered when
___________________
5 Communication from Ronald C. Kessler, Ph.D., McNeil Family Professor, Department of Health Care Policy, Harvard Medical School, regarding data from Army STARRS program to Eric Schoomaker, M.D., Ph.D. September 13, 2021. Similar findings are reported in Stein et al., 2015.
6 According to the DoD website, “The International Classification of Diseases, 10th edition, Clinical Modification (ICD-10-CM) took effect Oct. 1, 2015, replacing the ICD-9-CM coding guidelines. Military treatment facilities code medical encounters using ICD-10-CM and other DOD specific codes” https://www.health.mil/Military-Health-Topics/Centers-of-Excellence/Traumatic-Brain-Injury-Center-of-Excellence/DOD-TBI-Worldwide-Numbers (accessed October 4, 2021).
TABLE 2-3 Department of Defense Numbers for TBI Among Service Members Worldwide
| TBI Severity | 2014 | 2016 | 2017 | 2020 | 2000–2021 Q1 |
|---|---|---|---|---|---|
| Penetrating | 174 | 92 | 73 | 70 | 5,544 |
| Severe | 173 | 184 | 134 | 100 | 4,545 |
| Moderate | 2,335 | 2,633 | 2,559 | 2,503 | 46,716 |
| Mild | 20,837 | 15,420 | 15,042 | 13,802 | 361,848 |
| Not Classifiable | 1,549 | 13 | 33 | 1 | 20,956 |
| Total | 25,068 | 18,342 | 17,841 | 16,476 | 439,609 |
NOTE: Q1 = Quarter 1.
SOURCE: https://www.health.mil/Military-Health-Topics/Centers-of-Excellence/Traumatic-Brain-Injury-Center-of-Excellence/DOD-TBI-Worldwide-Numbers (accessed October 8, 2021).
Veterans seek health care from the VA, as well as information from diagnostic codes in electronic medical records and the VA’s disability benefit file. Between 2001 and 2013, a total of 221,895 Veterans were included in the registry, most of whom (185,437, or 84 percent) were identified using the TBI screen (Whiteneck et al., 2015). Veterans identified through their positive responses on the screen are offered a clinical evaluation to confirm the TBI diagnosis, as well as a plan of care. Those with clinically confirmed TBI commonly report blast injuries (77 percent), loss of consciousness (52 percent), and posttraumatic amnesia (40 percent). Most of the cases of people with TBI in the registry are classified as mild (81 percent), followed by moderate (9 percent) and severe (6 percent).
ECONOMIC COSTS
The economic costs associated with injury, in general, are high. In 2019, for example, CDC estimated that “the economic cost of injury was $4.2 trillion, including $327 billion in medical care, $69 billion in work loss, and $3.8 trillion in value of statistical life and quality of life losses” (Peterson et al., 2021, p. 1656). TBI represents only one condition that can result from an injury, and the report does not break down economic costs by such types, but notes among its limitations that the costs derived for nonfatal injuries are based on the year following injury, and thus do not account for costs of potential long-term consequences that may also be significant.
The first TBI cost study estimated the direct costs (medical care) and indirect costs (nonmedical costs, such as lost work) accrued over the lifetime of individuals who experienced a TBI in 1985 that led to hospitalization or death (Max et al., 1991). The lifetime accrual of costs for an annual cohort of injuries is a common estimation used by health economists, but is one of the most misinterpreted findings in cost studies because the total lifetime cost is often interpreted as an annual cost. Max and colleagues (1991) estimated that the 327,907 head injuries sustained in 1985 that resulted in death or hospitalization incurred $37.8 billion in total lifetime costs. The per-person lifetime cost was $115,300 averaged across minor, moderate, severe, and fatal injuries. Direct costs were estimated as $4.5 billion and accounted for 12 percent of total lifetime costs; indirect morbidity costs (e.g., lost work) were $20.6 billion and accounted for 54 percent; and the costs associated with premature death from TBI accounted for the remaining 34 percent.
Lawrence and colleagues (2018) conducted a study on lifetime cost estimation for TBIs that occurred in 2012. For the 2,123,120 TBIs recorded in that year, the estimated lifetime costs totaled $758 billion. To compare, the Max et al. (1991) estimate in 2012 dollars would be $80.51 billion,7 making the Lawrence et al. estimate nearly 9.5 times higher. Lawrence and colleagues derived these higher estimates by including nonhospitalized cases of people with TBI, both civilian and military, and also more categories of indirect costs, illustrating that cost estimates are greatly influenced by such factors as case inclusion, valuation of premature life lost, wage valuation, and categories and values of costs that are included in quality-of-life estimates. Lawrence and colleagues (2018) further estimated that of the $758 billion in total lifetime costs, $250 billion could be attributed to fatal, $335 billion to nonfatal hospitalized, and $173 billion to nonhospitalized TBIs. Medical costs were estimated to account for $26 billion of the $758 billion total, which the authors note represents 1 percent of total U.S. personal health care spending. Of the total lifetime costs, they estimated that 2.4 percent was direct costs, 13.3 percent was for work loss, and 83.3 percent ($631 billion) was for quality of life lost.
Using a claims database for 2016, authors of a recent study estimated the direct costs per year of nonfatal TBI care, including inpatient and outpatient care and prescription drugs
___________________
7 Converted based on the Consumer Price Index and inflation.
(Miller et al., 2021). Costs were determined over the year following diagnosis and totaled approximately $40 billion, with approximately $10 billion coming from private insurance and $22.5 billion from Medicare. The majority of cases in the database were classified as “head injury unspecified.” However, “total estimated annual healthcare costs attributable to low severity TBIs were substantially higher than total estimated annual healthcare costs attributable to middle and high severity TBIs” (Miller et al., 2021).
In a study of the Rochester Epidemiology Project, the authors found that costs for moderate and severe TBI were generally incurred in the first 6 months after injury, whereas costs for mild TBI began to increase above comparison control levels at 1 year, and overall accounted for a large proportion of incremental costs above comparison controls (Leibson et al., 2012). These costs may also represent an underestimate, failing to account for additional indirect costs, such as travel for appointments, tutoring for academic difficulties, and lost time from work (Graves et al., 2020).
Several other studies and reviews have examined the costs of TBI. Humphreys and colleagues (2013) summarize findings from 10 studies published between 2010 and 2012, 8 of which are from the United States. These 10 studies examine direct and lifetime costs and include cost/benefit analyses, mainly of rehabilitation care. Van Dijck and colleagues (2019) review 25 studies published before 2018 that measure annual costs for hospital treatment, reporting a range of in-hospital treatment costs of $2,130 to $401,808 per patient. The authors of both of these reviews conclude that TBI cost estimates are rare; generally have weaker designs (van Dijck and colleagues assigned an overall low quality score of 71 percent); do not adequately describe methods; and have large inconsistencies in their inclusion criteria, definitions, and analytic approaches.
Cost of Pediatric TBI
The cost of pediatric TBI has been estimated to be as high as $1.0–$2.56 billion based on data from the Pediatric Health Information System and the HCUP Kids’ Inpatient Database. The data show 15- to 17-year-olds shouldering most of the burden with the highest rates of inpatient hospitalization for pediatric TBI, and with motor vehicle crashes and falls causing most of the injuries (Robertson et al., 2013; Schneier et al., 2006; Shi et al., 2009). Estimates of the costs for hospitalized pediatric patients are greater than $1 billion a year, excluding ongoing costs incurred after discharge, including rehabilitation and other support necessary after a life-changing injury (Schneier et al., 2006).
Pediatric mild TBI or concussion is often overlooked in cost estimation as it is treated primarily in the ambulatory outpatient setting and generally incurs less cost per case relative to moderate or severe TBI, the latter cases entailing emergency diagnostic imaging; procedures; inpatient hospitalization, sometimes in the intensive care setting; and longer-term rehabilitation care, both inpatient and outpatient. However, the vast majority of pediatric TBI is classified as mild, and it is increasingly recognized that these cases can have both lingering and longer-term impacts on function and quality of life and benefit from treatment with rehabilitation, often requiring short- to medium-term academic accommodations as children return to school. Therefore, analyses of the costs associated with these cases have been undertaken, and have found that the costs of pediatric mild TBI may actually exceed those of moderate and severe TBI (Graves et al., 2015). Estimates of the costs associated with pediatric mild TBI or concussion range from $277–$284 per pediatric visit to the ED (Hardesty et al., 2019) to greater than $3,500 per child for those with persisting postconcussion symptoms (Corwin et al., 2020), estimated to be 30 percent of all children sustaining concussion (Zemek et al., 2016). The analysis by Corwin and colleagues includes estimates of
direct outpatient costs for specialist appointments, rehabilitation therapies, medications, and education-related support, but does not include indirect costs of lost wages due to parental time spent accompanying the child to medical treatment or address important issues related to quality of life. Based on the sheer numbers of children sustaining concussion or mild TBI, then, the overwhelming proportion of the costs of pediatric TBI is attributable to injuries on the milder end of the spectrum of severity.
Cost-Effectiveness and Cost Savings
Research suggests that providing optimal care for TBI is cost-effective and yields cost savings. A study evaluating the use of Brain Trauma Foundation guidelines for those with severe TBI found that routine use of the guidelines helped achieve substantial cost savings; furthermore, the net savings were associated with improved TBI outcomes and decreased burden on social support systems (Faul et al., 2007). A multicenter cohort analysis of prospectively collated clinical data from the UK Rehabilitation Outcomes Collaborative national database found that specialist rehabilitation was highly cost-effective for TBI patients who were severely disabled, despite their reduced lifespan (Turner-Stokes et al., 2019). The authors found that specialist rehabilitation could potentially generate savings of more than £4 billion in the cost of ongoing care for the 8-year cohort. Another study used a decision-analytical model to compare the costs, outcomes, and cost-effectiveness of three strategies for treating patients with severe TBI (Whitmore et al., 2012). The authors found aggressive treatment for severe TBI to be a cost-effective option even for older patients. Furthermore, they found an association between the provision of comfort care and poorer outcomes and higher costs. A scoping literature review investigating economic evaluations of inpatient and outpatient neuropsychological rehabilitation in individuals with acquired brain injury found that the majority documented cost savings (Stolwyk et al., 2021). However, the review acknowledged methodologic limitations in many of the cost evaluations reviewed, making it difficult to eliminate potential confounding effects or to capture a full picture of indirect and societal costs and savings and highlighting a role for further economic analyses addressing TBI. Another literature review concluded that little research has been published on the economic impacts of mild and moderate TBI on families, caregivers, and society. The authors of that study called for more research on this issue, emphasizing the need to estimate the economic burden of mild and moderate TBI on health care providers and social services (Humphreys et al., 2013).
Overall, the number and breadth of studies estimating cost, cost-effectiveness, and cost/benefit for TBI are lacking, with a dearth of evidence for either the most or the least promising strategies. This lack of evidence hinders the ability to identify state-of-the-art treatment and translate it into practice.
Burden of TBI on Patients and Families
In addition to economic costs, TBI imposes a tremendous burden on individuals, families, and communities. To better understand the perspectives of individuals and families recovering from TBI, the committee made patient and family voices an important component of its information-gathering workshop. The participating patients and family members expressed seven illustrative themes that help provide a more comprehensive understanding of the challenges faced following a TBI.8
___________________
8 The content of this section was drawn from the committee’s discussions during sessions of the public workshop held on March 16, 2021. See Appendix B for additional information on the workshop topics and speakers.
-
Overwhelmingly, speakers were grateful for the care they had received and for the providers who listened to their concerns and needs. Having one provider with whom they had a strong connection was vital to recovery, and one essential quality was the provider’s ability to hear their concerns and help with the total experience of the individual and family. One parent reported the following experience based on participation in a research study:
What transpired after that [referral because of research] was just really a very careful coordinated plan for [her son]. And it was really the first time as a parent or a patient that I’ve ever experienced a doctor really listening and wanting to collaborate with other fields.
General health care practitioners, including mental health therapists and primary care physicians, often serve people with TBI and their caregivers, but may not have the knowledge of their unique needs and how to assist them.
- Families wanted comprehensive information about what to do, what to expect, and how to negotiate the many life changes involved in accommodating ongoing TBI symptoms. The information they received was not coordinated and often had gaps in addressing their concerns and situations.
When I graduated [from rehab], there was no guidance on the best recovery process going forward, what would be good to do and what I shouldn’t be doing…. Bad is that no doctor was officially on my case post-acute rehab.
And, you know, work issues and stuff like that kept coming up. There was no support on that aspect to where, you know, I could comfortably tell people what was wrong with me.
A second challenge is a lack of information and training for families…. Wouldn’t it be great if case managers and discharge planners were paid based on patient and family satisfaction?
[After four months in the hospital], I was discharged home to my parents without much care after that. And my parents had no idea really about what to do, what to do with me and I had no idea. And I was, I had a lack of insight and I was very impulsive.
I was faced in 2013, when my husband shared with me that he would rather take his life than to face that daily burden of, putting the burdens on not only myself but our family and loved ones, Nobody understood the pain he was going through. And so from that moment on, I knew that this was something very serious and we needed to find out what was happening.
As a family, the impacts on my children have been so severe that my oldest son was suicidal at times because the impacts of caregiving on him was too much.
- Many speakers reported that care felt far less comprehensive and cohesive after hospital discharge, and there was little or no real support after treatment was over, even though symptoms often persist and impact the patient’s life.
I don’t have follow up. I go see the doctor once a year for my annual checkup. But I don’t get the opportunity to really be diagnosed or re-diagnosed.
I was discharged from a neurological intensive care unit directly from the ICU to
- Speakers identified a disconnect between the symptoms on which doctors were focused and the symptoms that had the most impact on patients and their families.
I feel I did not get enough information about my recovery and perhaps the doctors didn’t know it…. You know, practical things like when could I actually drive again. I mean, how do you know when you’re to the point when you know you recovered sufficiently to be able to drive.
[I brought up my headaches] over and over and over and over again. And I honestly, every time, like I said, I’m constantly told there’s nothing wrong with me.
- Speakers identified the need for patients to have advocates to help ask questions and seek resources. Several speakers mentioned that they had advocates or served in the advocate role, and they worried about patients and families who did not have this support.
It’s almost impossible to advocate for yourself. So you need another person to advocate on your behalf, whether it’s a family member or friend. And unfortunately some people don’t have those advocates and they really suffer.
It became just this dark process of trying to figure out what can we do to treat this next symptom that’s popping up…. It just became a trial and error for us. And I mean, fortunately for my husband. I am an advocate. I am a go getter. I’m a pusher and … [what do people without this do]?
- Speakers mentioned that insurance was challenging with respect to what was and was not covered and the process of negotiating coverage.
I just wanted to reiterate my experience of having to really fight…. [Insurance company] was going to put me in a nursing home because it’s a lot cheaper. To me it’s just criminal that so many victims of TBI are just forced by insurance companies into bed rest, which is just killing their chances of a good recovery.
Many people actually max out their benefits at that point [inpatient rehab]. And so then when they are home they have problems and they don’t have any insurance funds to help with those.
- A wide range of research needs was identified—in particular, research integrating patient and family experiences.
The research that documents negative impact on family caregivers has not been matched with research funding to develop and systematically disseminate interventions and programs that can assist them.... There also appears to be a disconnect between existing research evidence and clinical practice.
- Some patients and families reported that clinical research programs helped make them aware of and gain access to specialty TBI care.
home with no follow up. Zero follow up. I just had to hunt down all the various other doctors I needed to see to take care of my problems.
Everyone who has a severe TBI should have some doctor assigned who calls them and who they can call with questions, issues, I think.
We were lucky enough to be at [school] that was partnering … for some research on pediatric concussions. [Son] had already completed baseline testing as part of the program and was immediately referred [to provider] for evaluation. And what transpired after that was just really a very careful, coordinated plan for him.
They said hey, we have a study that’s going on [at university] and you should probably sign up and see what happens, and I finally did, and it worked. Some things finally came to fruition. Things started making sense
These themes and quotations were instrumental in guiding this report to focus on a holistic approach to TBI treatment and care, integrating individuals within their families and support structures and acknowledging the many systems (including health care, work, school, social, and recreational) with which patients interact.
CONCLUSIONS
The committee identified a clear need to better document TBI’s incidence, burden, and vulnerable populations through improved data collection and analysis systems and further research. Obtaining high-quality data, at the population level and from patient care, is an integral component of a learning health care system, in which data are used to inform research and improve care, among other features (see Chapter 8). Despite significant gaps in measurement of the incidence and prevalence of TBI at all levels of severity, existing data create a compelling picture that TBI is a prevalent health issue with increasing incidence in the civilian and military U.S. populations, as well as globally. A similar dearth of evidence is available for measuring the full burden of TBI, including monetary costs, but again, existing data indicate that TBI imposes a high burden on individuals, families, and communities, as well as the nation as a whole. Despite the data limitations, moreover, the information that does exist supports the need to disseminate and implement best practices that can improve the lives of all TBI patients and their families. Reducing the burden of TBI will require developing not only treatments and interventions for those who experience it, but also prevention policies and programs to reduce the frequency with which it occurs.
REFERENCES
Arbogast, K. B., A. E. Curry, M. R. Pfeiffer, M. R. Zonfrillo, J. Haarbauer-Krupa, M. J. Breiding, V. G. Coronado, and C. L. Master. 2016. Point of health care entry for youth with concussion within a large pediatric care network. JAMA Pediatrics 170(7):e160294.
Barker-Collo, S. L., and V. L. Feigin. 2009. Capturing the spectrum: Suggested standards for conducting population-based traumatic brain injury incidence studies. Neuroepidemiology 32(1):1-3.
Barker-Collo, S., Theadom, A., Jones, K., Feigin, V. L., and M. Kahan. 2016. Accuracy of an International Classification of Diseases Code surveillance system in the identification of traumatic brain injury. Neuroepidemiology 47(1):46-52.
Bruns, J., Jr., and W. A. Hauser. 2003. The epidemiology of traumatic brain injury: A review. Epilepsia 44(s10):2-10.
Carlson, K. F., J. E. Barnes, E. M. Hagel, B. C. Taylor, D. X. Cifu, and N. A. Sayer. 2013. Sensitivity and specificity of traumatic brain injury diagnosis codes in United States Department of Veterans Affairs administrative data. Brain Injury 27(6):640-650.
CDC (Centers for Disease Control and Prevention). 2003. Report to Congress on mild traumatic brain injury in the United States: Steps to prevent a serious public health problem. National Center for Injury Prevention and Control. Atlanta, GA: Centers for Disease Control and Prevention.
CDC. 2019. Surveillance report of traumatic brain injury-related emergency department visits, hospitalizations, and deaths—United States, 2014. Atlanta, GA: Department of Health and Human Services.
CDC. 2021. Surveillance report of traumatic brain injury-related hospitalizations and deaths by age group, sex, and mechanism of injury—United States, 2016 and 2017. Atlanta, GA: Department of Health and Human Services.
Corwin, D. J., C. L. Master, M. F. Grady, and M. R. Zonfrillo. 2020. The economic burden of pediatric postconcussive syndrome. Clinical Journal of Sport Medicine 30(5):e154-e155.
Covassin, T., R. Moran, and R. J. Elbin. 2016. Sex differences in reported concussion injury rates and time loss from participation: An update of the national collegiate athletic association injury surveillance program from 2004-2005 through 2008-2009. Journal of Athletic Training 51(3):189-194.
Dams-O’Connor, K., J. P. Cuthbert, J. Whyte, J. D. Corrigan, M. Faul, and C. Harrison-Felix. 2013. Traumatic brain injury among older adults at level I and II trauma centers. Journal of Neurotrauma 30(24):2001-2013.
Daugherty, J., D. Waltzman, K. Sarmiento, and L. Xu. 2019. Traumatic brain injury-related deaths by race/ethnicity, sex, intent, and mechanism of injury—United States, 2000–2017. Morbidity and Mortality Weekly Report 68(46):1050-1056.
DePadilla, L., G. F. Miller, S. E. Jones, A. B. Peterson, and M. J. Breiding. 2018. Self-reported concussions from playing a sport or being physically active among high school students—United States, 2017. Morbidity and Mortality Weekly Report 67(24):682-685.
Dewan, M. C., N. Mummareddy, J. C. Wellons 3rd., and C. M. Bonfield. 2016. Epidemiology of global pediatric traumatic brain injury: Qualitative review. World Neurosurgery 91:497-509.
Dewan, M. C., A. Rattani, S. Gupta, R. E. Baticulon, Y. C. Hung, M. Punchak, A. Agrawal, A. O. Adeleye, M. G. Shrime, A. M. Rubiano, J. V. Rosenfeld, and K. B. Park. 2019. Estimating the global incidence of traumatic brain injury. Journal of Neurosurgery 130:1080-1097.
Faul, M., M. M. Wald, W. Rutland-Brown, E. E. Sullivent, and R. W. Sattin. 2007. Using a cost-benefit analysis to estimate outcomes of a clinical treatment guideline: Testing the Brain Trauma Foundation guidelines for the treatment of severe traumatic brain injury. Journal of Trauma 63(6):1271-1278.
Faul, M., M. M. Wald, L. Xu, and V. G. Coronado. 2010. Traumatic brain injury in the United States: Emergency department visits, hospitalizations, and deaths, 2002–2006. Atlanta, GA: Centers for Disease Control and Prevention.
Feigin, V. L., A. Theadom, S. Barker-Collo, N. J. Starkey, K. McPherson, M. Kahan, A. Dowell, P. Brown, V. Parag, R. Kydd, K. Jones, A. Jones, S. Ameratunga, and B. S. Group. 2013. Incidence of traumatic brain injury in New Zealand: A population-based study. Lancet Neurolology 12(1):53-64.
Fife, D. 1987. Head injury with and without hospital admission: Comparisons of incidence and short-term disability. American Journal of Public Health 77(7):810-812.
Gabella, B. A., J. E. Hathaway, B. Hume, J. Johnson, J. F. Costich, S. Slavova, and A. Y. Liu. 2021. Multisite medical record review of emergency department visits for traumatic brain injury. Injury Prevention 27(S1):i42-i48.
Gardner, R. C., K. Dams-O’Connor, M. R. Morrissey, and G. T. Manley. 2018. Geriatric traumatic brain injury: Epidemiology, outcomes, knowledge gaps, and future directions. Journal of Neurotrauma 35(7):889-906.
Graves, J. M., F. P. Rivara, and M. S. Vavilala. 2015. Health care costs 1 year after pediatric traumatic brain injury. American Journal of Public Health 105(10):e35-41.
Graves, J. M., M. Moore, L. Kehoe, M. Li, A. Chan, K. Conrick, W. Williams-Gilbert, and M. S. Vavilala. 2020. Family hardship following youth concussion: Beyond the medical bills. Journal of Pediatric Nursing 51:15-20.
Guerrero, J. L., D. J. Thurman, and J. E. Sniezek. 2000. Emergency department visits associated with traumatic brain injury: United States, 1995-1996. Brain Injury 14(2):181-186.
Haarbauer-Krupa, J., A. Ciccia, J. Dodd, D. Ettel, B. Kurowski, A. Lumba-Brown, and S. Suskauer. 2017. Service delivery in the healthcare and educational systems for children following traumatic brain injury: Gaps in care. Journal of Head Trauma Rehabilitation 32(6):367-377.
Haarbauer-Krupa, J., M. J. Pugh, E. M. Prager, N. Harmon, J. Wolfe, and K. C. Yaffe. 2021. Epidemiology of chronic effects of traumatic brain injury. Journal of Neurotrauma. https://doi.org/10.1089/neu.2021.0062.
Hardesty, W., B. Singichetti, H. Yi, J. C. Leonard, and J. Yang. 2019. Characteristics and costs of pediatric emergency department visits for sports- and recreation-related concussions, 2006–2014. Journal of Emergency Medicine 56(5):571-579.
Humphreys, I., R. L. Wood, C. J. Phillips, and S. Macey. 2013. The costs of traumatic brain injury: A literature review. ClinicoEconomics and Outcomes Research 5:281-287.
Jager, T. E., H. B. Weiss, J. H. Coben, and P. E. Pepe. 2000. Traumatic brain injuries evaluated in us emergency departments, 1992–1994. Academic Emergency Medicine 7(2):134-140.
James, S. L., A. Theadom, R. G. Ellenbogen, M. S. Bannick, W. Montjoy-Venning, L. R. Lucchesi, N. Abbasi, et al. 2019. Global, regional, and national burden of traumatic brain injury and spinal cord injury, 1990-2016: A systematic analysis for the Global Burden of Disease study 2016. Lancet Neurology 18(1):56-87.
Johnson, W. D., and D. P. Griswold. 2017. Traumatic brain injury: A global challenge. Lancet Neurology 16(12):949-950.
Lawrence B. A., J. A. Orman, T. R. Miller, R. S. Spicer, and D. Hendrie. 2018. Ch. 32. Cost of traumatic brain injuries in the United States and the return on helmet investments. In Neurotrauma and critical care of the brain, 2nd ed., edited by J. Jallo and C. M. Loftus. New York: Thieme Medical Publishers, Inc.
Leibson, C. L., A. W. Brown, K. Hall Long, J. E. Ransom, J. Mandrekar, T. M. Osler, and J. F. Malec. 2012. Medical care costs associated with traumatic brain injury over the full spectrum of disease: A controlled population-based study. Journal of Neurotrauma 29(11):2038-2049.
Lumba-Brown A., K. O. Yeates, K. Sarmiento, M. J. Breiding, T. M. Haegerich, G. A. Gioia, M. Turner, E. C. Benzel, S. J. Suskauer, C. C. Giza, M. Joseph, C. Broomand, B. Weissman, W. Gordon, D. W. Wright, R. S. Moser, K. McAvoy, L. Ewing-Cobbs, A. C. Duhaime, M. Putukian, B. Holshouser, D. Pauk, S. Wade, S. Herring, M. Halstead, H. Keenan, M. Choe, C. Christian, K. Guskiewicz, P. Raskin, A. Gregory, A. Mucha, H. Taylor, J. Callahan, J. Dewitt, M. Collins, M. Kirkwood, J. Ragheb, R. Ellenbogen, T. Spinks, T. Ganiats, L. Sabelhaus, K. Altenhofen, R. Hoffman, T. Getchius, G. Gronseth, Z. Donnell, R. O’Connor, and S. Timmons. 2018. Centers for Disease Control and Prevention guideline on the diagnosis and management of mild traumatic brain injury among children. JAMA Pediatrics 172(11):e182853.
Majdan, M., D. Plancikova, A. Maas, S. Polinder, V. Feigin, A. Theadom, M. Rusnak, A. Brazinova, and J. Haagsma. 2017. Years of life lost due to traumatic brain injury in Europe: A cross-sectional analysis of 16 countries. PLoS Medicine 14(7):e1002331.
Marin, J. R., M. D. Weaver, D. M. Yealy, and R. C. Mannix. 2014. Trends in visits for traumatic brain injury to emergency departments in the United States. Journal of the American Medical Association 311(18):1917-1919.
Max, W., E. J. MacKenzie, and D. P. Rice. 1991. Head injuries: Costs and consequences. Journal of Head Trauma Rehabilitation 6(2):76-91.
Miller, G. F., L. DePadilla, and L. Xu. 2021. Costs of nonfatal traumatic brain injury in the United States, 2016. Medical Care 59(5):451-455.
Mock, C., Joshipura, M., Arreola-Risa, C., and R. Quansah. 2012. An estimate of the number of lives that could be saved through improvements in trauma care globally. World Journal of Surgery 36(5):959-963.
Naifeh, J. A., Mash, H., Stein, M. B., Fullerton, C. S., Kessler, R. C., and R. J. Ursano. 2019. The Army Study to Assess Risk and Resilience in Servicemembers (Army STARRS): Progress toward understanding suicide among soldiers. Molecular Psychiatry 24:34-48.
Narapareddy, B., L. Richey, and M. Peters. 2019. The growing epidemic of TBI in older patients. NeurologyLive. https://www.neurologylive.com/view/growing-epidemic-tbi-older-patients (accessed November 10, 2021).
Peterson, C., G. F. Miller, S. Barnett, and C. Florence. 2021. Economic cost of injury—United States, 2019. Morbidity and Mortality Weekly Report 70(48):1655–1659.
Rivara, F. P., T. D. Koepsell, J. Wang, N. Temkin, A. Dorsch, M. S. Vavilala, D. Durbin, and K. M. Jaffe. 2012. Incidence of disability among children 12 months after traumatic brain injury. American Journal of Public Health 102(11):2074-2079.
Robertson, B. D., C. E. McConnel, and S. Green. 2013. Charges associated with pediatric head injuries: A five year retrospective review of 41 pediatric hospitals in the US. Journal of Injury & Violence Research 5(1):51-60.
Rosenbaum, B. P., M. L. Kelly, V. R. Kshettry, and R. J. Weil. 2014. Neurologic disorders, in-hospital deaths, and years of potential life lost in the USA, 1988–2011. Journal of Clinical Neuroscience 21(11):1874-1880.
Rutland-Brown, W., J. A. Langlois, K. E. Thomas, and Y. L. Xi. 2006. Incidence of traumatic brain injury in the United States, 2003. Journal of Head Trauma Rehabilitation 21(6):544-548.
Schneier, A. J., B. J. Shields, S. G. Hostetler, H. Xiang, and G. A. Smith. 2006. Incidence of pediatric traumatic brain injury and associated hospital resource utilization in the United States. Pediatrics 118(2):483-492.
Shi, J., H. Xiang, K. Wheeler, G. A. Smith, L. Stallones, J. Groner, and Z. Wang. 2009. Costs, mortality likelihood and outcomes of hospitalized us children with traumatic brain injuries. Brain Injury 23(7):602-611.
Sosin, D. M., J. E. Sniezek, and D. J. Thurman. 1996. Incidence of mild and moderate brain injury in the United States, 1991. Brain Injury 10(1):47-54.
Stein, M. B., R. J. Ursano, N. A. Sampson, and R. C. Kessler. 2012. Suicide and traumatic brain injury. Annual Meeting of the American College of Neuropsychopharmacology. Hollywood, Florida.
Stein, M. B., R. C. Kessler, S. G. Heeringa, S. Jain, L. Campbell-Sills, C. Colpe, C. Fullerton, M. Nock, N. Sampson, M. Schoenbaum, X. Sun, M. Thomas, R. Ursano, and Army STARRS collaborators. 2015. Prospective longitudinal evaluation of the effect of deployment-acquired traumatic brain injury on posttraumatic stress and related disorders: Results from the Army Study to Assess Risk and Resilience in Servicemembers (Army STARRS). American Journal of Psychiatry 172:1101-1111.
Stein, M. B., S. Jain, J. T. Giacino, H. Levin, S, Dikmen, L. D. Nelson, M. J. Vassar, D. O. Okonkwo, R. Diaz-Arrastia, C. S. Robertson, P. Mukherjee, M. McCrea, C. L. Mac Donald, J. K. Yue, E. Yuh, X. Sun, L. Campbell-Sills, N. Temkin, G. T. Manley, TRACK-TBI Investigators, … and R. Zafonte. 2019. Risk of posttraumatic stress disorder and major depression in civilian patients after mild traumatic brain injury: A TRACK-TBI study. JAMA Psychiatry 76(3):249-258.
Stolwyk, R. J., J. R. Gooden, J. Kim, and D. A. Cadilhac. 2021. What is known about the cost-effectiveness of neuropsychological interventions for individuals with acquired brain injury? A scoping review. Neuropsychology Rehabiliation 31(2):316-344.
Stopa, B. M., M. Harary, R. Jhun, A. Job, S. Izzy, T. R. Smith, and W. B. Gormley. 2020. Divergence in the epidemiological estimates of traumatic brain injury in the United States: Comparison of two national databases. Journal of Neurosurgery. Online ahead of print.
Taylor, C. A., J. M. Bell, M. J. Breiding, and L. Xu. 2017. Traumatic brain injury-related emergency department visits, hospitalizations, and deaths—United States, 2007 and 2013. Morbidity and Mortality Weekly Report Surveillance Summaries 66(9):1-16.
Theadom, A., S. Barker-Collo, V. L. Feigin, N. J. Starkey, K. Jones, A. Jones, S. Ameratunga, P. A. Barber, and B. R. Group. 2012. The spectrum captured: A methodological approach to studying incidence and outcomes of traumatic brain injury on a population level. Neuroepidemiology 38(1):18-29.
Thompson, H. J., W. C. McCormick, and S. H. Kagan. 2006. Traumatic brain injury in older adults: Epidemiology, outcomes, and future implications. Journal of the American Geriatrics Society 54(10):1590-1595.
Thurman, D., and J. Guerrero. 1999. Trends in hospitalization associated with traumatic brain injury. Journal of the American Medical Association 282(10):954-957.
Thurman, D. J., J. E. Sniezek, D. Johnson, A. Greenspan, and S. M. Smith. 1995. Guidelines for surveillance of central nervous system injury. Atlanta, GA: National Center for Injury Prevention and Control, Centers for Disease Control and Prevention.
Thurman, D. J., C. Alverson, D. Browne, K. Dunn, J. Guerrero, R. Johnson, V. Johnson, J. Langlois, D. Pilkey, J. Sniezek, and S. Toal. 1999. Traumatic brain injury in the United States: A report to Congress. Atlanta, GA: National Center for Injury Prevention and Control, Centers for Disease Control and Prevention. https://www.cdc.gov/traumaticbraininjury/pdf/TBI_in_the_US.pdf (accessed December 1, 2021).
Turner-Stokes, L., M. Dzingina, R. Shavelle, A. Bill, H. Williams, and K. Sephton. 2019. Estimated life-time savings in the cost of ongoing care following specialist rehabilitation for severe traumatic brain injury in the United Kingdom. Journal of Head Trauma Rehabilitation 34(4):205-214.
van Dijck, J., M. D. Dijkman, R. H. Ophuis, G. C. W. de Ruiter, W. C. Peul, and S. Polinder. 2019. In-hospital costs after severe traumatic brain injury: A systematic review and quality assessment. PLoS One 14(5):e0216743.
Whiteneck, G. G., J. Cuthbert, and D. Mellick. 2015. VA Traumatic brain injury veterans health registry report. Washington, DC: Department of Veterans Affairs.
Whitmore, R. G., J. P. Thawani, M. S. Grady, J. M. Levine, M. R. Sanborn, and S. C. Stein. 2012. Is aggressive treatment of traumatic brain injury cost-effective? Journal of Neurosurgery 116(5):1106-1113.
WHO (World Health Organization). 2014. Improving mortality statistics through civil registration and vital statistics systems: Strategies for country and partner support. Geneva, Switzerland: World Health Organization.
World Bank/WHO. 2014. Global civil registration and vital statistics: Scaling up investment plan, 2015—2024.https://www.worldbank.org/en/topic/health/publication/global-civil-registration-vital-statistics-scaling-upinvestment (accessed November 11, 2021).
Zemek, R., N. Barrowman, S. B. Freedman, J. Gravel, I. Gagnon, C. McGahern, M. Aglipay, G. Sangha, K. Boutis, D. Beer, W. Craig, E. Burns, K. J. Farion, A. Mikrogianakis, K. Barlow, A. S. Dubrovsky, W. Meeuwisse, G. Gioia, W. P. Meehan, 3rd, M. H. Beauchamp, Y. Kamil, A. M. Grool, B. Hoshizaki, P. Anderson, B. L. Brooks, K. O. Yeates, M. Vassilyadi, T. Klassen, M. Keightley, L. Richer, C. DeMatteo, M. H. Osmond, and the Pediatric Emergency Research Canada Concussion Team. 2016. Clinical risk score for persistent postconcussion symptoms among children with acute concussion in the ED. Journal of the American Medical Association 315(10):1014-1025.


