
Trends and Drivers of Greening and Browning
THE GLOBAL CONTEXT
Wolfgang Buermann, Augsburg University, began the workshop using satellite data to show that the Earth as a whole—driven by carbon dioxide (CO2) fertilization—has greened considerably in recent years (Xu et al., 2013). Buermann noted that research focused on the linkage among increased atmospheric CO2 concentration, warming, and vegetation change at northern latitudes may have been stimulated by an observed increase in the amplitude of the CO2 concentration measured at Hawaii’s Mauna Loa Observatory. That amplitude correlated with the integrated temperature change observed at northern high latitudes during the second half of the 20th century (Keeling et al., 1996), with increased vegetation activity inferred as the cause.
More recent measurements of atmospheric CO2 concentration collected at Mauna Loa and Point Barrow, Alaska (with Point Barrow providing an integrated measure for northern high latitudes) show increasing seasonal amplitude, with larger values at Point Barrow (Graven et al., 2013). Buermann indicated that the mechanism driving this increase is not known. Model results by Forkel et al. (2016) have reproduced the pattern and suggest that photosynthetic response to temperature and biome shifts, such as northward shifts in deciduous trees that displace polar grasses and needle leaf evergreens, could play a role. However, Buermann noted that there is no observational evidence to support the biome shift.
HIGH LATITUDE TRENDS
The “Northern Greening Trend” idea likely began with the work of Myneni et al. (1997), Buermann said. Results of that work showed greening over about 25% of the circumpolar region between 1981-1991, largely in boreal forest. Many studies discussed by workshop attendees followed this early work and illustrated details about the variation and complexity in the spatial and temporal observations of greening and browning trends, as well as drivers of identified patterns measured using a range of techniques.
Tundra Trends
Many studies discussed at the workshop showed tundra greening across much of the circumpolar region in recent decades. For example, Scott Goetz, Northern Arizona University, noted that greening was observed over about 30% of tundra area in North America from 1981-2003 (Goetz et al., 2005). The National Oceanic and Atmospheric Administration’s (NOAA’s) most recent Arctic Report Card also shows evidence for strong greening from 1982-2017 across much of the circumpolar north (see Figure 1).
Logan Berner, Northern Arizona University, discussed how pervasive and rapid Arctic warming, particularly since the 1980s, can affect tundra productivity and greening and browning trends. Berner and colleagues are developing a pan-Arctic assessment of plant productivity that compares Landsat satellite maximum normalized difference vegetation index (MaxNDVI) data and field measurements from select sites, including sedge aboveground net primary productivity (ANPP), shrub radial growth, and annual ecosystem gross primary productivity (GPP). Measurable relationships between NDVI and all field-collected growth metrics were found, which Berner noted provides some degree of evidence that the greening detected by Landsat MaxNDVI is tracking meaningful aspects of productivity in tundra.
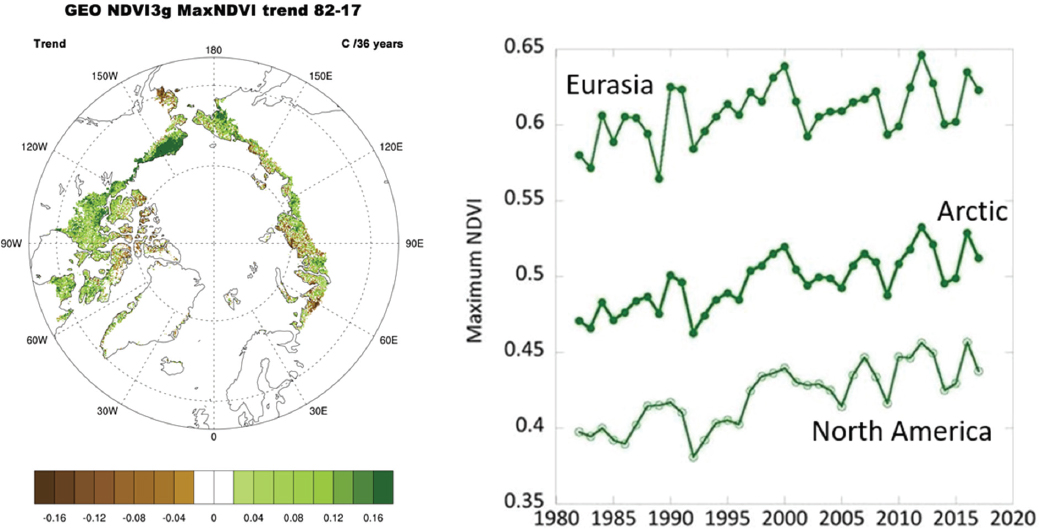
Changes within the Landsat MaxNDVI record over time (1985-2016) have also been evaluated and show a strong greening trend across much of northern Canada, Alaska, and western Eurasia, and little evidence for any widespread browning. This was true over the entire biome and for each tundra bioclimatic zone during this time period. Focusing on only 2000-2016 yields a broadly similar pattern of greening, with the addition of pervasive greening in eastern Eurasia (a region where data are not available earlier in the Landsat record). Browning was also observed in Greenland, northern Canada, and western Siberia in this shorter evaluation period. Greening trends in the MaxNDVI Landsat record were significant when considered across the tundra biome as a whole for 2000-2016, but when bioclimatic zones were evaluated separately, only the southernmost tundra bioclimatic zone showed a greening trend. In total, about half the tundra biome showed no systematic trend toward greening or browning. Summer temperatures could explain nearly 70% of the interannual variability in the biome average summer greenness, with shortwave radiation and precipitation also contributing. This suggests biome productivity is currently strongly constrained by these factors, Berner noted. Berner and colleagues also found that the magnitude of warming does not seem to drive whether a tundra area will green; warming was seen everywhere, including areas that showed browning or no trend, which suggests that climate sensitivity is not uniform across the landscape, but rather that the portion of the landscape that greens is particularly responsive to warming, according to Berner.
Looking to the future, Buermann presented recent work that questions whether an overall tundra greening trend will continue if temperature limitation is alleviated by climate warming (i.e., when the ecosystem is no longer temperature limited, productivity will not continue to increase in response to further warming; see Keenan and Riley, 2018). Modeling results indicate that temperature-limited regions will shift further northward, with very little vegetated land being temperature limited by the end
of the century, especially under a high greenhouse gas emissions scenario. Other research suggests that temperature controls on spring leaf unfolding, net primary production (NPP), and carbon uptake are weakening (Fu et al., 2015; Piao et al., 2015), supporting this idea.
Boreal Forest Trends
In boreal forest, the trends have been more mixed, but browning has often been observed. Studies discussed at the workshop associated browning over about 20% of North American boreal forest with fire disturbance in the 1981-2003 time period (Goetz et al., 2005). A decrease in productivity observed as browning linked to drought in Interior Alaska has also been documented, with an increase in growth observed as greening occurring at the boreal-tundra ecotone for a 1982-2008 record (Beck et al., 2011). Other work based on long-term forest inventory plots has shown little evidence of a widespread greening across Canada (when warming and CO2 fertilization were considered as potential drivers; Girardin et al., 2016). The connection between disturbance drivers and boreal forest vegetation trends was commonly discussed at the workshop, with particular focus on fire, insect outbreaks, and forest harvest.
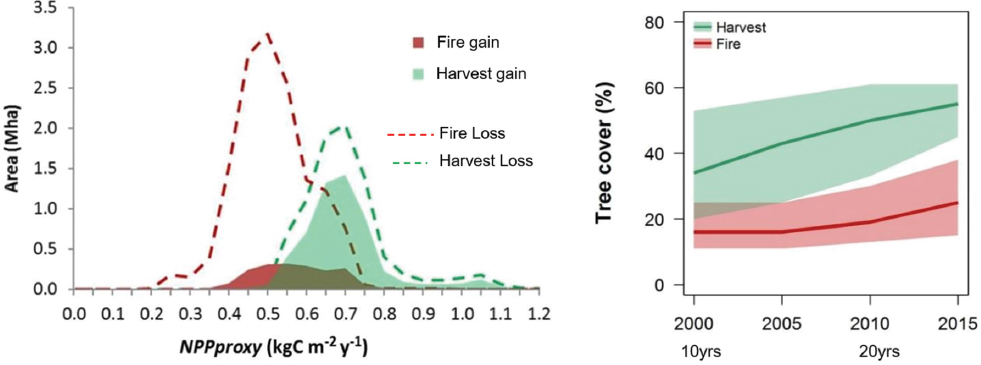
Sylvie Gauthier, Natural Resources Canada, provided a more in-depth look at the impacts of fire and harvest disturbance on boreal forest productivity and recovery across Canada. Recent remote sensing work suggests that forest cover losses have been greater than gains in Canada between 2000 and 2012 (Hansen et al., 2013), which may appear as browning and greening on the landscape, respectively. These losses and gains were attributed to specific types of disturbance using a new disturbance database (Guindon et al., 2017) to improve understanding of disturbance and associated change across the landscape, Gauthier explained. Losses of forest cover observed as browning in low productivity areas has been caused primarily by fire while losses observed in high productivity areas are the result of harvesting. Overall, the gains in forest cover observed as greening were more prominent in harvest
areas. On sites with similar productivity pre-disturbance, forest cover gains were found to be larger following harvest than fire (see Figure 2), which may be expected to result in a higher degree of greening in these areas. To explain this finding, Gauthier stated that harvest in Canadian forest occurs only in productive areas, and forest regeneration is encouraged after harvesting. In contrast, fires occur on both high- and low-productivity sites and strongly affect understory vegetation, which creates an environment in which recovery occurs more slowly. For instance, Guindon et al. (2018) showing that low-productivity black spruce stands are quite slow to recover, taking more found that 10-20 years post-disturbance, gains in tree cover were faster and larger in areas disturbed by harvest than areas that burned (see Figure 2). This is consistent with other research than 30 years for half the trees to reach 2 m in height, while higher-productivity harvested stands, such as jack pine, can reach this milestone within 10 years (Renard et al., 2016; Van Bogaert et al., 2015). Trends in greening or browning post-disturbance could therefore be impacted by site productivity and different recovery rates, depending on disturbance type.
In Eastern Canada, harvesting currently occurs only in the south, where there is closed canopy conifer forest. However, there is an effort to evaluate the possibility of extending the practice northward into more open woodland areas. This assessment has included consideration of productivity in relation to fire, with a focus on current (based on site index and stem density) and potential (based on a site index) productivity. Results illustrate a gradient in potential productivity that can be explained largely by growing season length, surficial geology, and topography (Gauthier et al., 2015). Current productivity was found to be much lower than potential productivity, with patterns explained by growing season length (climate), surficial geology, topography, proportion of open woodland, and observed fire frequency. The difference between potential and current productivity increases as the fire return interval decreases (i.e., fire occurs more frequently). This finding aligns with other work evaluating transition from closed forest to open woodland (e.g., Girard et al., 2008; Payette and Delwaide, 2018) and could affect trends in greening and browning as forest cover and time since disturbance are altered. If the fire return interval is long enough, seed supply can be sufficient to re-establish the stand at the same stem density and a comparable degree of greening could occur with time. However, if the return interval is too short or conditions too dry for a high rate of seedling establishment, stand density will be low, resulting in open woodland that may appear to be less green, depending on understory vegetation. Although transition from open woodland to closed forest may be possible, it has never been documented.
CHALLENGES TO DEFINING TRENDS
Throughout the workshop, participants discussed the complexity in determining when a change in vegetation would be considered a greening or browning trend. It was recognized that calling something a trend often needs to be fit for purpose. For instance, an ecologically important change may be observed on a 5-year timescale, yet many studies using satellite datasets look across multiple decades. The time period under consideration, whether a disturbance has occurred, and when it occurred during that time period can also influence whether a trend is detected (and the direction of that trend). Berner’s presentation illustrated the challenge of how selected time periods can affect observed trends, showing some differences between 1985-2016 and 2000-2016 for the same dataset (although trends were broadly similar). The effects of the timing of disturbance and land cover change were detailed by Jonathan Wang, Boston University, and are summarized in the Disturbance section. A related question that was also raised but not thoroughly explored at the workshop was how interannual variability or short-term events—including extreme events—could be viewed in the context of trends in vegetation change.
What Is Special About Areas That Green or Brown?
Although the workshop and much research has focused on the portions of the tundra and boreal forest where greening and browning have been observed, much of the region has not undergone this type of change. Participants discussed how adjacent areas may respond differently to the same environmental factors, raising questions about what may be unique about “hotspots” and how these locations can be better detected using available methods. As remote sensing research moves to finer resolution (e.g., Landsat, Sentinel, MODIS Visible Infrared Imaging Radiometer Suite [VIIRS] series onboard the Suomi National Polar-orbiting Partnership satellite), identification of these hotspots and the drivers of change are expected to become more straightforward, some participants suggested.
DISTURBANCES AS DRIVERS OF CHANGE
Disturbances are strongly linked to greening and browning trends because they often alter the landscape. Disturbances that remove or defoliate vegetation may initially result in browning, but greening may be observed over time as the ecosystem recovers. Ben Bond-Lamberty, Pacific Northwest National Laboratory, provided an overview of common disturbances occurring at northern latitudes. Disturbances can be complex with long-lasting impacts, but a disturbance itself can occur over either short or long timescales. Shorter-term events can include fires, droughts, extreme weather, thermokarst formation, and insect and pathogen outbreaks, while longer-term disturbances include warming, CO2 fertilization, and prolonged water stress. Researchers also need to be cognizant of forest harvest and land use change when thinking about disturbances and climate feedbacks, Bond-Lamberty said, as was also highlighted by Gauthier in the previous section. Many disturbance types at high latitudes are either directly tied to climate warming, or warming indirectly alters conditions that then contribute to the disturbance. The workshop had a few presentations that explored a dominant disturbance types in detail and many other presentations provided some discussion other disturbances in the context of greening and browning. Other disturbance types not discussed are knowns to occur, including those related to climate change, and the contents in this proceedings should not be viewed as a comprehensive list.
A large and complex disturbance agent in North America is forest fire. Overall, climate-related increases have been observed in the length of the fire season and in fire frequency, severity, and intensity (e.g., Hanes et al., 2018). These fires can be high-intensity crown fires that are stand-killing events. Across Eurasia, the severity and extent of area burned has also risen in recent decades, but not as consistently as in western North America. Eurasian fires tend to be structurally different, occurring commonly as lower-intensity surface fires (Rogers et al., 2015). Fires are also occurring in the tundra, where they have been observed less frequently than in the boreal forest in the long-term historic record. A notable example is the 2007 Anaktuvuk River tundra fire, which emitted an amount of carbon equivalent to the entire Arctic carbon sink for that year (Mack et al., 2011). Shrubification, drying, and ignition may lead to tundra fire expansion and intensification, and Bond-Lamberty thinks it is likely more of these types of events will be seen in the future.
Impacts of fire disturbance on regional to global carbon balance and long-term vegetation patterns can be large. Fires can shift very large areas from being a carbon source or neutral to being a carbon sink. Boreal forest fires make up about 10% of total fire emissions globally. This is unique in that forest and underlying soils are the primary source of burning, whereas elsewhere around the globe, other types of vegetation are more commonly burned. Bond-Lamberty noted that an appreciable percentage of boreal
forest carbon stocks may have already been lost with the recent increase in the fire regime. A particularly challenging element of fire disturbance is that the event itself is just the start of the story. Immediate effects, such as increased emission and aerosols, often receive focus because they can be visually striking and have significant near-term consequences. Yet, there are also longer-term impacts, including changes to vegetation and forest successional states (see Mack and Foster presentations in the Implications section), water cycling, climate forcing, and albedo. Albedo, over decades, will swamp the short-term effects. See O’Halloran presentation in the Implications section for more details about albedo.
Interactions between pulse disturbances is a real frontier in science, Bond-Lamberty said. These interactions are poorly understood at present, but they are potentially important because they can be tied to legacy effects that can last for years (ecological memory). It remains unclear whether potential interactions will be significant or if cumulative effects will occur that may lead to stronger negative impacts.
Land Cover Change
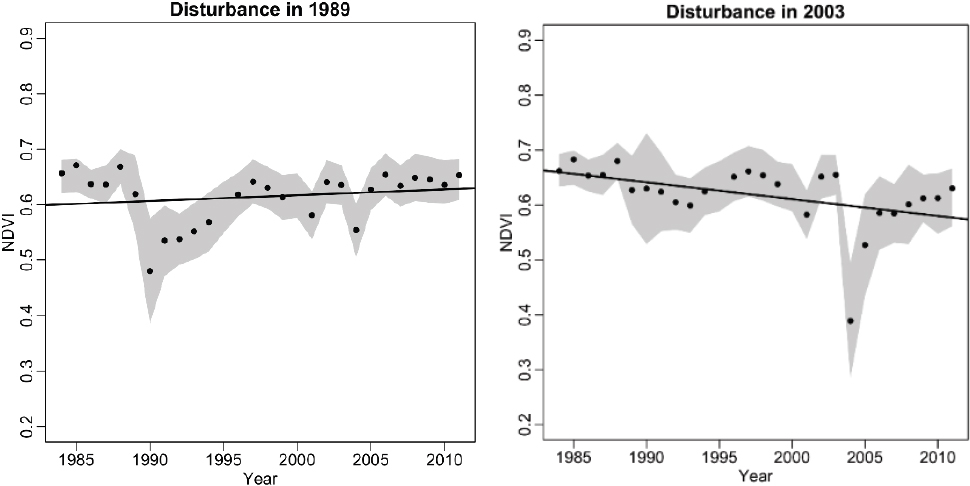
Jonathan Wang, focused his remarks on the role of disturbance and associated land cover change in influencing trends in greening and browning. Trends in NDVI have been shown to depend on land cover history, where time since disturbance impacts the observed trend (Sulla-Menashe et al., 2018). For instance, if a disturbance occurs early in the time series studied, there may be an initial decline in NDVI, caused by the loss or major change in the vegetation, followed by an increase later as the ecosystem recovers from the disturbance. In contrast, if a disturbance occurs later in the time series, the overall trend may appear to be one of browning (see Figure 3).
Wang and colleagues are examining Landsat pixel-scale changes in land cover and the relationship to statistically significant trends in NDVI from 1984-2014 for the National Aeronautics and Space Administration (NASA) Arctic Boreal Vulnerability Experiment (ABoVE) domain (most of Alaska and
Northwest Canada). This analysis is being conducted using pixel-based break-point detection and statistical models to evaluate when there are likely land cover changes in the spectral time series. A random forest algorithm and digital globe imagery are then used to predict what meaningful land cover classes are likely to be present on the landscape over time (e.g., evergreen forest, grass, shrubs, etc.). They have found that about one-third of the pixels showing NDVI trends are associated with land cover change and that the NDVI trends are stronger (i.e., relatively high values of either greening or browning) in these areas when compared to locations where NDVI trends are observed in the absence of land cover change. Fire is a likely driver of these strong patterns, Wang noted. When considering only locations that underwent land cover change during the study period, greening occurred over about 37% of the area and browning covered 18%, with the rest showing no trend. This differed from locations with no land cover change, which showed a greening trend over about 31% of the area and browning over 6%, while the remainder showed no trend.
Another way to look at interactions between disturbance and land cover is using the Orbiting Carbon Observatory (OCO-2) satellite measurements of sun-induced fluorescence (SIF). SIF is thought to be a proxy for GPP, and Wang showed that values generally track logically with vegetation class (e.g., forests show higher values than shrubs). Measurements in disturbed areas tended to be higher than undisturbed areas, suggesting increased productivity and greening following land cover change. For a more in-depth discussion of SIF, see Yang presentation in the New Remote Sensing Technologies section.
Insect Outbreaks
Insect outbreaks can act as large disturbances to forests that drive browning trends when trees are killed or defoliated. As explained by Arjan Meddens, University of Idaho, there have been widespread insect outbreaks in North America in the past. For example, in the early 2000s a mountain pine beetle outbreak in British Columbia, Canada affected 12 million hectares and a spruce beetle infested about 0.2 million hectares in North America (Hicke et al., 2012). These bark beetles kill trees by feeding on phloem (the living tissue making up the innermost layer of bark that transports the products of photosynthesis). In contrast, defoliators are generally not tree-killing insects, but tree mortality can occur if outbreaks occur over multiple years. An example of this is the eastern spruce budworm, which affected 50 million hectares from the late 1970s into the early 1980s.
Linkages between insect outbreaks and climate change are now being made. In Western Canada, a mountain pine beetle outbreak seems to have peaked and is now declining, likely due to host depletion—essentially all the trees in the historical range of mountain pine have been killed. Meddens explained that there is new evidence that mountain pine beetle can also affect jack pine and that the beetle’s range is expanding north and east into this novel host. This expansion is thought to be related to climate warming; temperatures below −40°C can kill beetle populations, but this threshold is being reached less frequently. Recent increases in spruce beetle activity in south-central Alaska have also been seen. This beetle typically has a 2-year cycle for a brood to be produced, but increasing temperature is shortening the life cycle to 1 year, leading to more beetles, which may result in more vigorous outbreaks (e.g., Bentz et al., 2010). In general, Meddens suggested that with uncertainties around future climate change, surprises should be expected.
Insect disturbances can affect a wide range of forest ecosystem dynamics including forest composition, carbon cycling, and wildlife. They may also interact with wildfire disturbances by producing large areas of dead and drying wood that can act as a fuel source. The disturbed forest can also influence climate feedbacks via changes in snowpack and albedo (see O’Halloran presentation in the Implications section
for more details on albedo). In order to understand impacts and the outbreaks themselves, Meddens suggested that continued monitoring of vegetation change in remote areas is needed, with a move toward higher-resolution imagery that allows for tree-level mortality detection. Currently, Landsat is at fine enough resolution to detect severe mortality, but cannot pick up mortality at levels below 40% (Meddens et al., 2013).
During the general discussion about disturbance, some participants questioned whether disturbance events could be factored out of some analyses to allow for focused attention on other drivers and exploration of why trends may be seen in areas that have not experienced recent disturbance or identifiable land cover changes. Others, however, suggested that inclusion of the disturbance is essential to understanding ecosystems and the factors driving change.


