National Academies Press: OpenBook
« Previous: Introduction
Suggested Citation:"Earth Science and Applications Research." National Academies of Sciences, Engineering, and Medicine. 2019. Thriving on Our Changing Planet: A Decadal Strategy for Earth Observation from Space: An Overview for Decision Makers and the Public. Washington, DC: The National Academies Press. doi: 10.17226/25437.
×

EARTH SCIENCE AND APPLICATIONS RESEARCH

Space-based Earth observations are also vital for national security. As an example, understanding atmospheric and oceanic processes (such as sea-level rise and the impacts of ocean warming on ocean circulation associated with climate change) and their implications are critical for naval operations. Operations of all armed services depend on environmental information, such as accurate weather forecasts, characteristics and changes of terrestrial landscapes, atmospheric conditions and processes, coastal information, and more. Satellite observations play a crucial role in addressing these needs.

On a broader level, understanding the role of climate and other environmental changes is important for anticipating future sources of geopolitical instability. For example, weather- and climate-related events such as floods and droughts can create humanitarian crises to which troops may be called to respond and from which refugees may seek to cross our borders or those of our allies. Perhaps of even greater concern, many military analysts suspect that drought in the Middle East played a significant role in leading to the Syrian civil war and the attendant rise of ISIS. Only by understanding our changing planet—including a changing climate—can we hope to limit and mitigate these types of threats to our national security.

Image

Image

Suggested Citation:"Earth Science and Applications Research." National Academies of Sciences, Engineering, and Medicine. 2019. Thriving on Our Changing Planet: A Decadal Strategy for Earth Observation from Space: An Overview for Decision Makers and the Public. Washington, DC: The National Academies Press. doi: 10.17226/25437.
×

CRITICAL ADVANCES IN CLIMATE SCIENCE ENABLED BY SPACE-BASED OBSERVATIONS

In the past four decades, satellite based observations have provided significant advances in our understanding of the Earth climate system. Some of these advances are as follows:

  • Producing a 40-year global trend of atmospheric temperature, providing an important means to confirm regional trends observed by ground-based in situ sensors.
  • Accurate measurements of rising sea level, documenting regional sea-level changes, which can differ substantially from the global mean.
  • Quantifying yearly variations in rates of ocean warming, and confirming the consistency of decadal ocean heating and sea-level rise.
  • Precise measurements of melting land ice contributions to sea-level rise.
  • Daily observations documenting the reductions in Arctic sea-ice extent and thinning of multi-year ice.
  • Understanding the effect of clouds on the radiative heating of Earth’s atmosphere.
  • Understanding of aerosols and their influences on clouds.
  • Increased knowledge of rain formation processes in clouds.
  • Tracking land use change and ecosystem responses to climate variations, which improve the understanding of the carbon cycle, while methods to quantify carbon stocks and fluxes are rapidly evolving.
  • Monitoring changes in the atmospheric composition and geographical distributions of climate-influencing atmospheric trace gases.
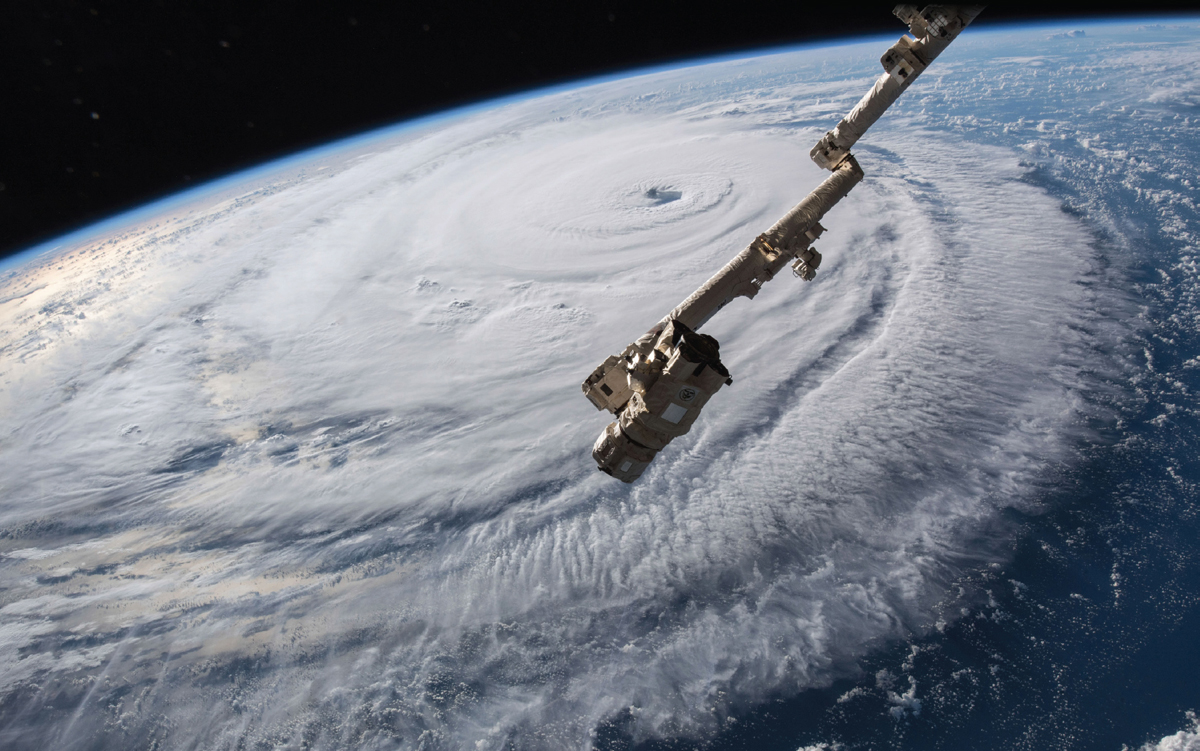
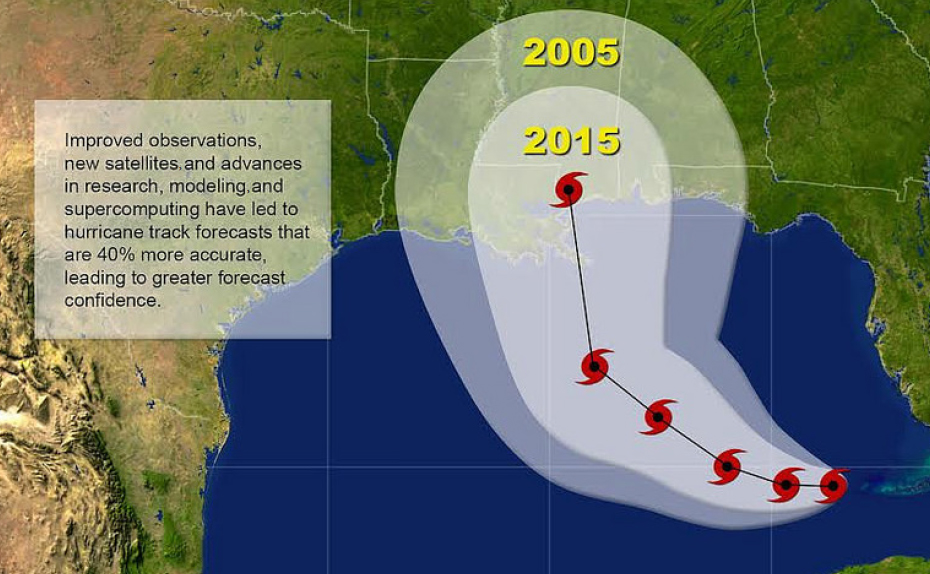
Image

Suggested Citation:"Earth Science and Applications Research." National Academies of Sciences, Engineering, and Medicine. 2019. Thriving on Our Changing Planet: A Decadal Strategy for Earth Observation from Space: An Overview for Decision Makers and the Public. Washington, DC: The National Academies Press. doi: 10.17226/25437.
×

HURRICANE WARNINGS

Three major hurricanes—Harvey, Irma, and Maria—struck the United States in a 1-month period during August and September of 2017. In 2018, the United States was again struck by major hurricanes, including Florence and Michael. While catastrophic in their impacts, with hundreds of lives lost and some $265 billion in damages from just Harvey, Irma, and Maria, the devastation and loss of lives would undoubtedly have been far worse without the warnings that allowed emergency managers and residents to prepare in advance. As new and better satellite observations are assimilated into forecast models, scientists will be able to further improve predictions of hurricane wind strength and path, as well as the effects from storm surge, rain, and flooding, thus reducing the human and economic toll of severe storms.
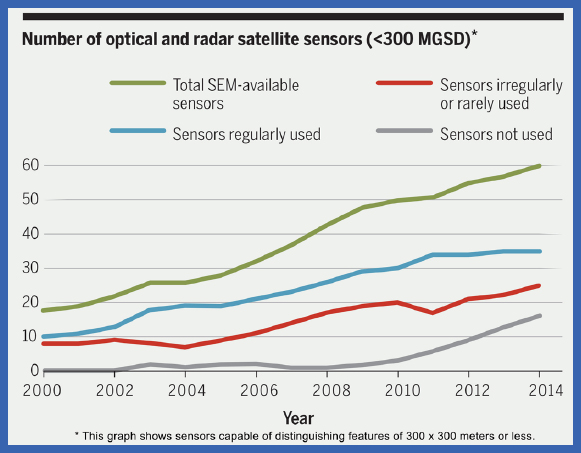
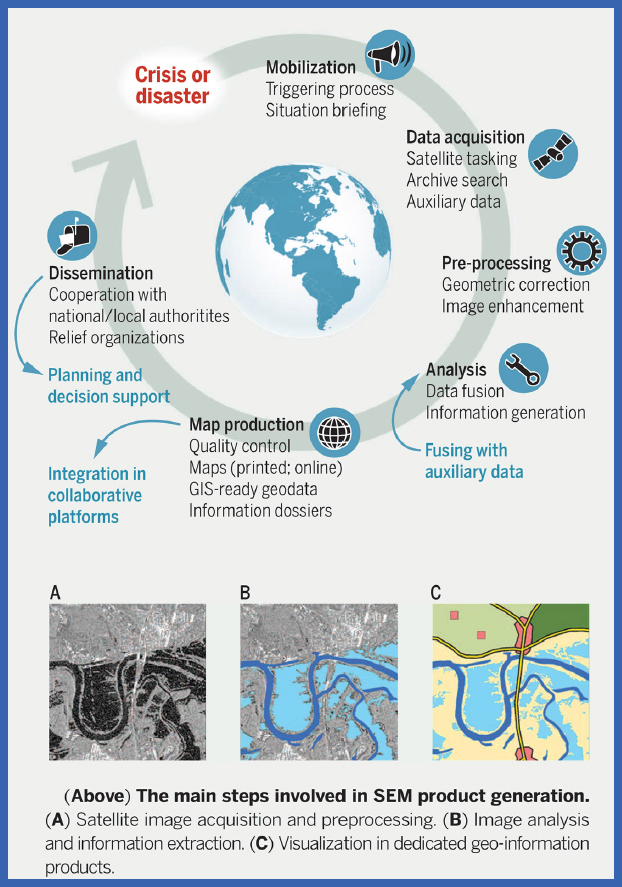
Image
Illustration of how 10 years of improved use of observations and advances in modeling and computing would have affected the forecast uncertainty for Hurricane Katrina, which made landfall on August 29, 2005. Katrina was the most destructive storm to strike the United States and the costliest storm in U.S. history, causing $108 billion in damage, according to NOAA. NOTE: The forecast uncertainty is conveyed by a track forecast “cone.” The cone represents the probable track of the center of a tropical cyclone. With better forecasts of populations and property at highest risk, emergency preparations can be concentrated where they will do the most good.
Image
Among the necessary ingredients for hurricanes is sufficiently warm ocean temperatures, typically above approximately 28°C (about 82°F). This color-coded image from NASA’s Aqua satellite from June 1, 2010, shows sea surface temperatures across the equatorial Atlantic Ocean and part of the Pacific Ocean at the beginning of the 2010 season. Waters that are warm enough to promote hurricane formation appear in shades of yellow to orange-red. Waters too cool to foster hurricane formation appear in shades of blue.

Suggested Citation:"Earth Science and Applications Research." National Academies of Sciences, Engineering, and Medicine. 2019. Thriving on Our Changing Planet: A Decadal Strategy for Earth Observation from Space: An Overview for Decision Makers and the Public. Washington, DC: The National Academies Press. doi: 10.17226/25437.
×

EMERGENCY MAPPING

Over the past few decades, satellite observations have been used effectively for warnings and assessments of high-impact natural hazards such as hurricanes, severe winter storms, and wildfires. Enabled by advances in satellite remote sensing capability and information technology, more sophisticated global and regional mapping systems based on rapid assessments of flooding, earthquake damage, and other natural and human-made disasters are being developed. For example, the International Working Group on Satellite-based Emergency Mapping (IWG-SEM; http://www.unspider.org/network/iwg-sem) was established after the Haiti earthquake and Pakistan flood in 2010 to improve information sharing and cooperation across the international community. As a result, disaster response is improving rapidly. In some cases, the creation and dissemination of disaster-related products has been accelerated to just a few hours or less through capabilities such as crowdsourcing, machine learning, satellite constellations, and use of day/night all-weather sensors such as radar.

Image

Image

Image
Oil from the Deepwater Horizon disaster in the Gulf of Mexico created a silvery sheen on the water southeast of the Mississippi Delta. Image from NASA Terra satellite instrument Moderate Resolution Imaging Spectroradiometer (MODIS).

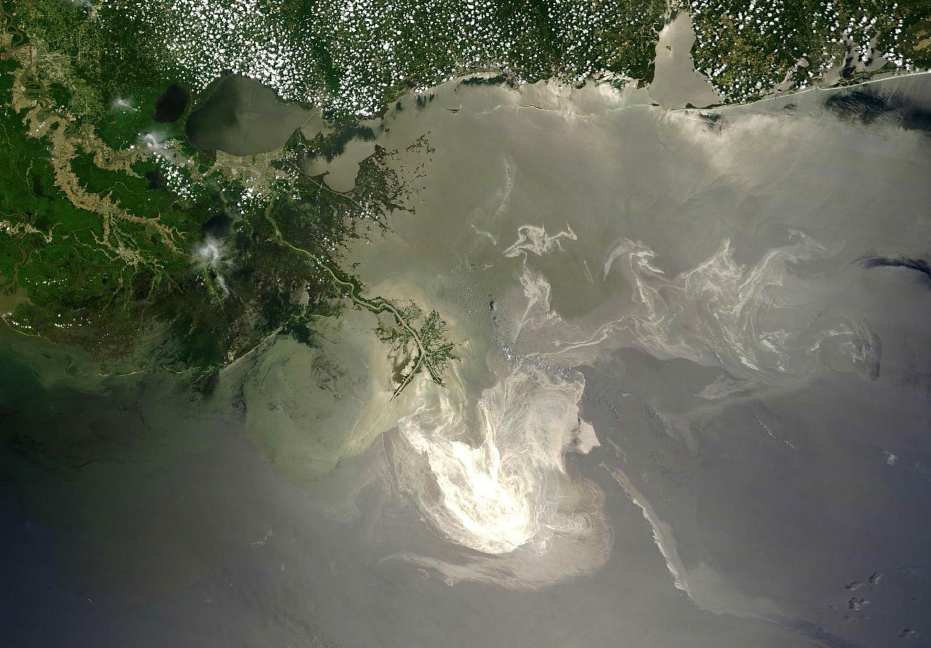
DEEPWATER HORIZON ACCIDENT

Satellite, research aircraft, and ground-based data are used during and after major oil spills to monitor their spread and impact—information critical for deploying resources during the event and assessing ecosystem impacts post-event. On April 20, 2010, a deadly explosion at the Deepwater Horizon offshore drilling platform started a catastrophic oil leak into the waters of the Gulf of Mexico. After several cloudy days, the first image showing significant oil on the surface was captured on the afternoon of April 25 by the Aqua satellite. The NASA Terra and Aqua satellites monitored this disaster daily for 4 months until the leak in the oil well was stopped.

Suggested Citation:"Earth Science and Applications Research." National Academies of Sciences, Engineering, and Medicine. 2019. Thriving on Our Changing Planet: A Decadal Strategy for Earth Observation from Space: An Overview for Decision Makers and the Public. Washington, DC: The National Academies Press. doi: 10.17226/25437.
×

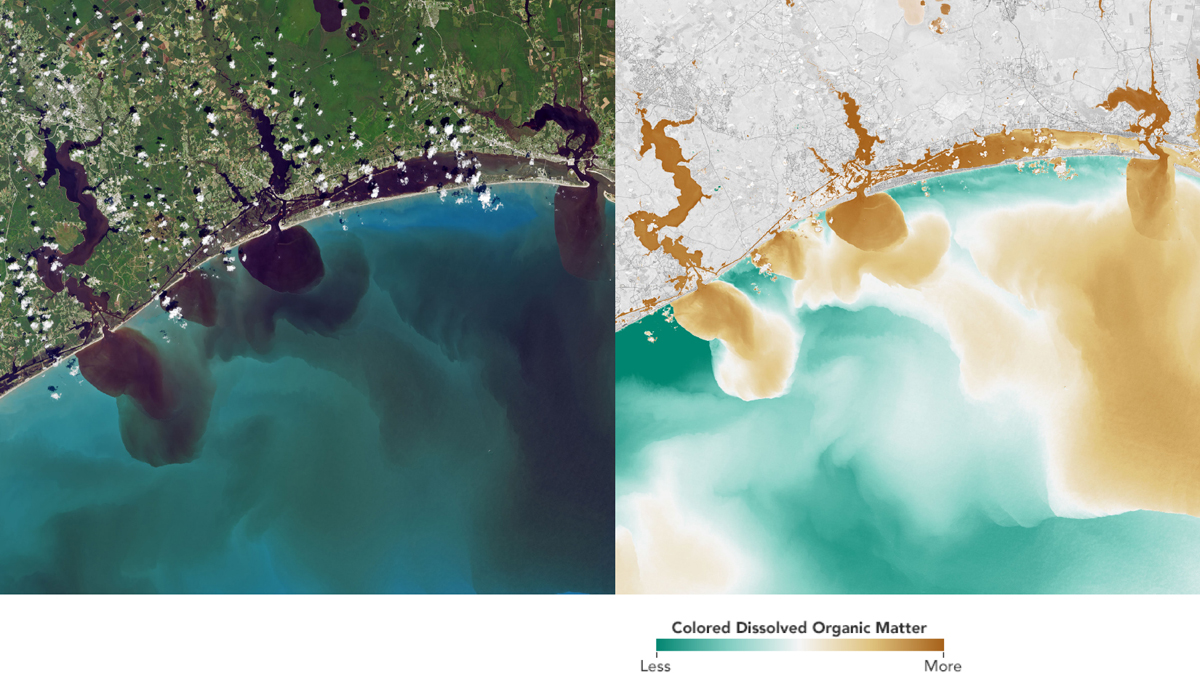
NORTH CAROLINA FLOODING

Satellite observations of water quality play an important role in understanding coastal ecosystems, including monitoring and forecasting harmful algal blooms and their impacts on fisheries. The National Weather Service office in Raleigh offered a preliminary estimate that nearly 8 trillion gallons of rain fell on North Carolina from September 13 to 17, 2018, that led to catastrophic flooding across many parts of the state. Before and after Hurricane Florence swept through the Carolinas, the Landsat 8 satellite observed several residential areas and major rivers. Natural color images can reveal how soils, sediments, decaying leaves, pollution, and other debris discolor the water in the swollen rivers, bays, estuaries, and the nearshore ocean.

Image
Landsat images from September 20, 2018, of the White Oak River, New River, Adams Creek, and their outflows along the South Carolina coast show how the hurricane-related flooding on September 13-17, 2018 affected water quality. The natural color image (left) and visible and infrared data (right) reveal the amount of colored dissolved organic matter (CDOM) in the waterways. Organic matter—such as leaves, roots, or bark—contain pigments and chemicals (such as tannins) that can color the water when they dissolve. Depending on the amount of dissolved particles, the water in the visible/infrared image appears blue, green, yellow, or brown as the CDOM concentration increases.

Suggested Citation:"Earth Science and Applications Research." National Academies of Sciences, Engineering, and Medicine. 2019. Thriving on Our Changing Planet: A Decadal Strategy for Earth Observation from Space: An Overview for Decision Makers and the Public. Washington, DC: The National Academies Press. doi: 10.17226/25437.
×

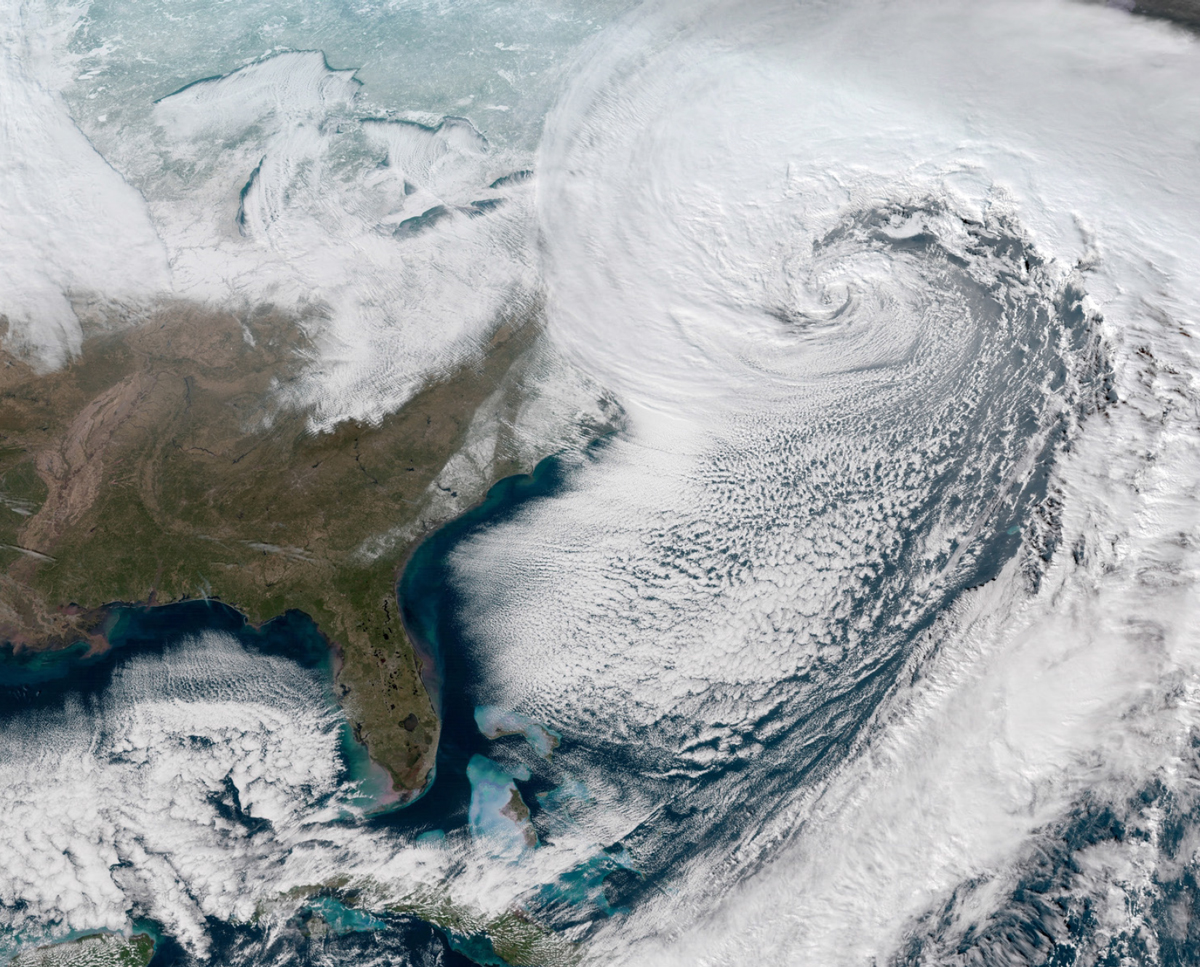
WINTER SNOW AND ICE STORMS

The frequency, intensity, and duration of extreme weather events is changing as our climate changes. Satellites provide critical information necessary for understanding and improving our prediction of these events. This image taken Jan. 4, 2018 from NOAA’s GOES-16 satellite shows the center of a low pressure area off the coast of the northeastern U.S. and a thick band of clouds bringing snow and gusty winds from the Mid-Atlantic states to New England. These types of storms can cause blizzard conditions, power outages, flooding, and bitter wind chill across the entire east coast.
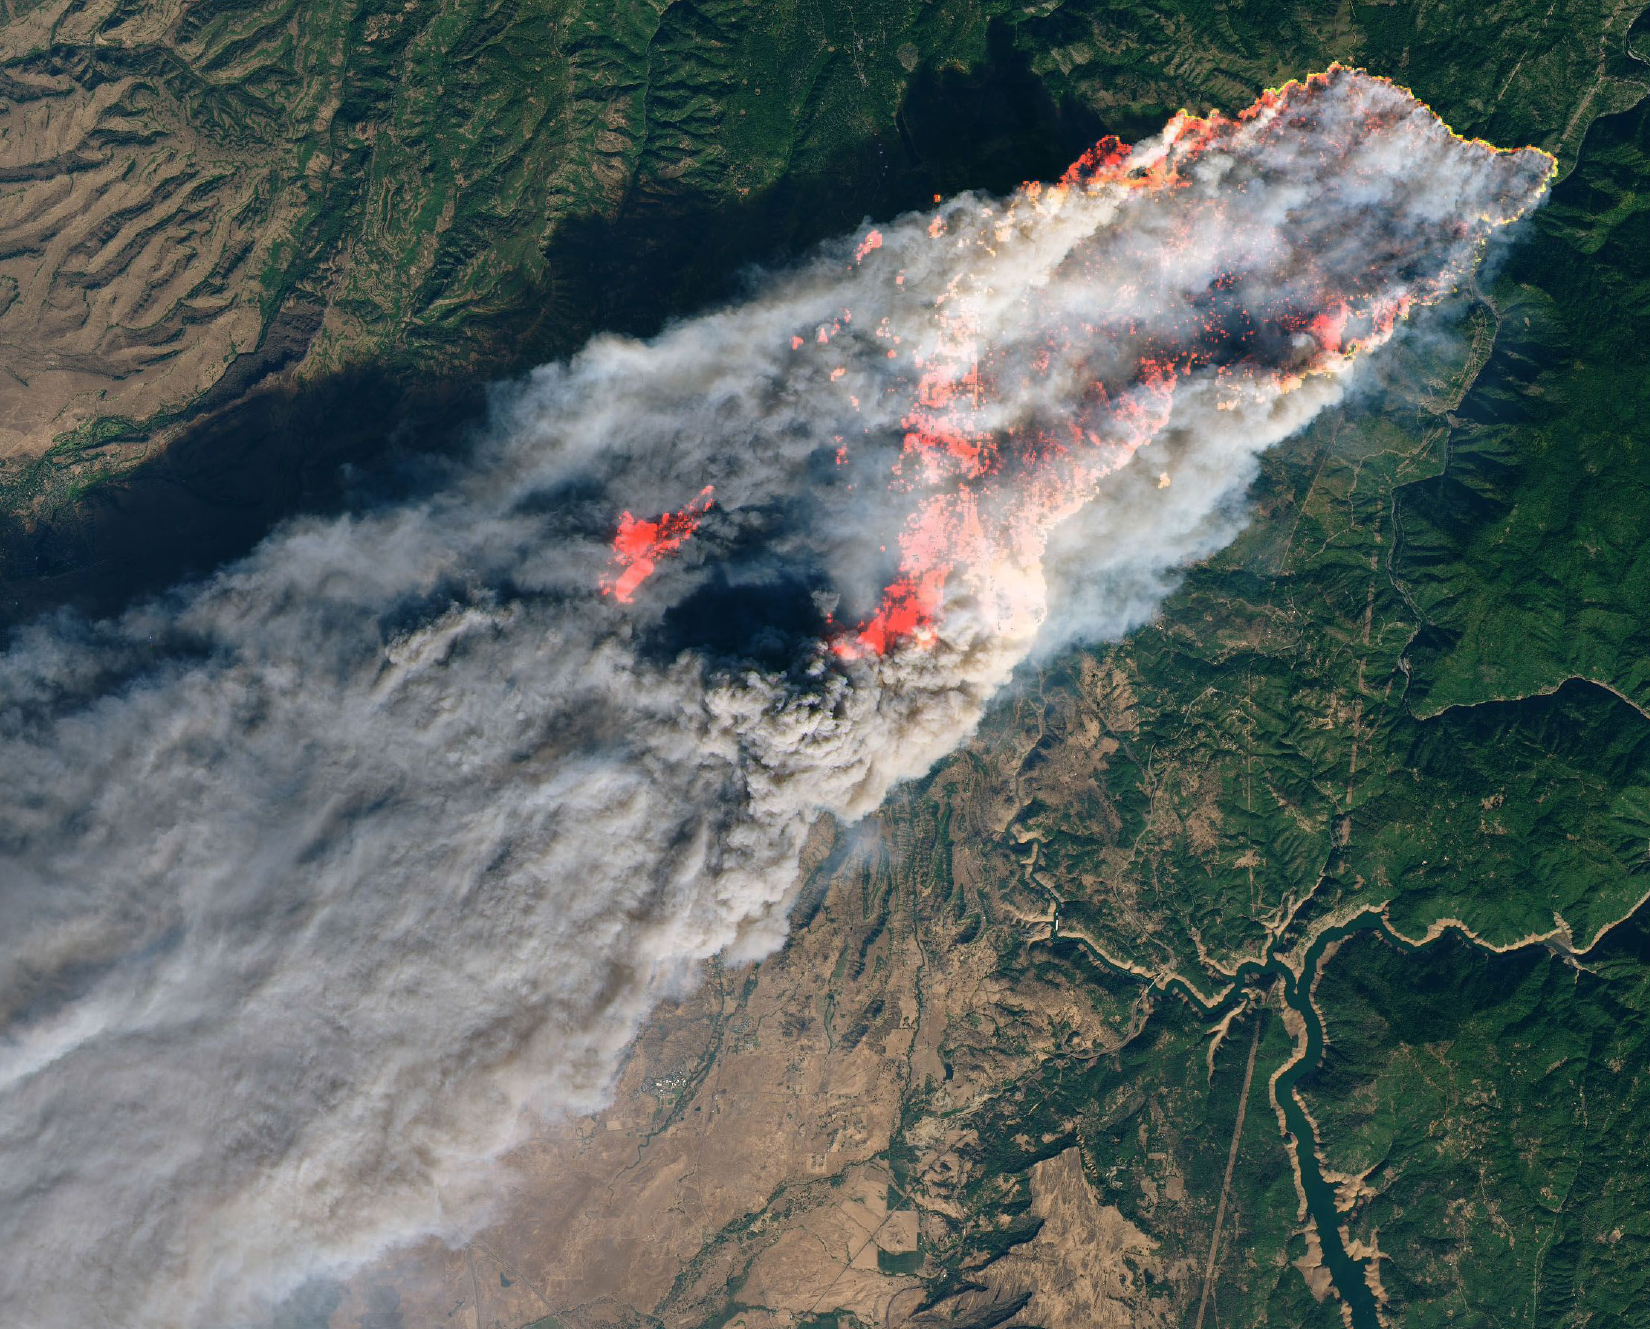
Image

Suggested Citation:"Earth Science and Applications Research." National Academies of Sciences, Engineering, and Medicine. 2019. Thriving on Our Changing Planet: A Decadal Strategy for Earth Observation from Space: An Overview for Decision Makers and the Public. Washington, DC: The National Academies Press. doi: 10.17226/25437.
×

WILDFIRES

The 2018 National Climate Assessment stated that “by the middle of this century, the annual area burned in the western United States could increase 2 to 6 times from the present, depending on the geographic area, ecosystem, and local climate.” In 2017 the federal firefighting costs were $2.9 billion. On November 8, 2018, the Camp Fire erupted 90 miles north of Sacramento, California. By the next day, the fire had consumed 70,000 acres of land and was 5 percent contained. The USGS Operational Land Imager on Landsat 8 acquired the image of the Camp Fire below. The image was created using Landsat bands 4-3-2 (visible light), along with shortwave-infrared light to highlight the active fire. Satellite data is used to track wildfire spread, plan fire suppression logistics and tactics, determine evacuation needs, project air quality issues, and aid other decision-making.

Image

Suggested Citation:"Earth Science and Applications Research." National Academies of Sciences, Engineering, and Medicine. 2019. Thriving on Our Changing Planet: A Decadal Strategy for Earth Observation from Space: An Overview for Decision Makers and the Public. Washington, DC: The National Academies Press. doi: 10.17226/25437.
×

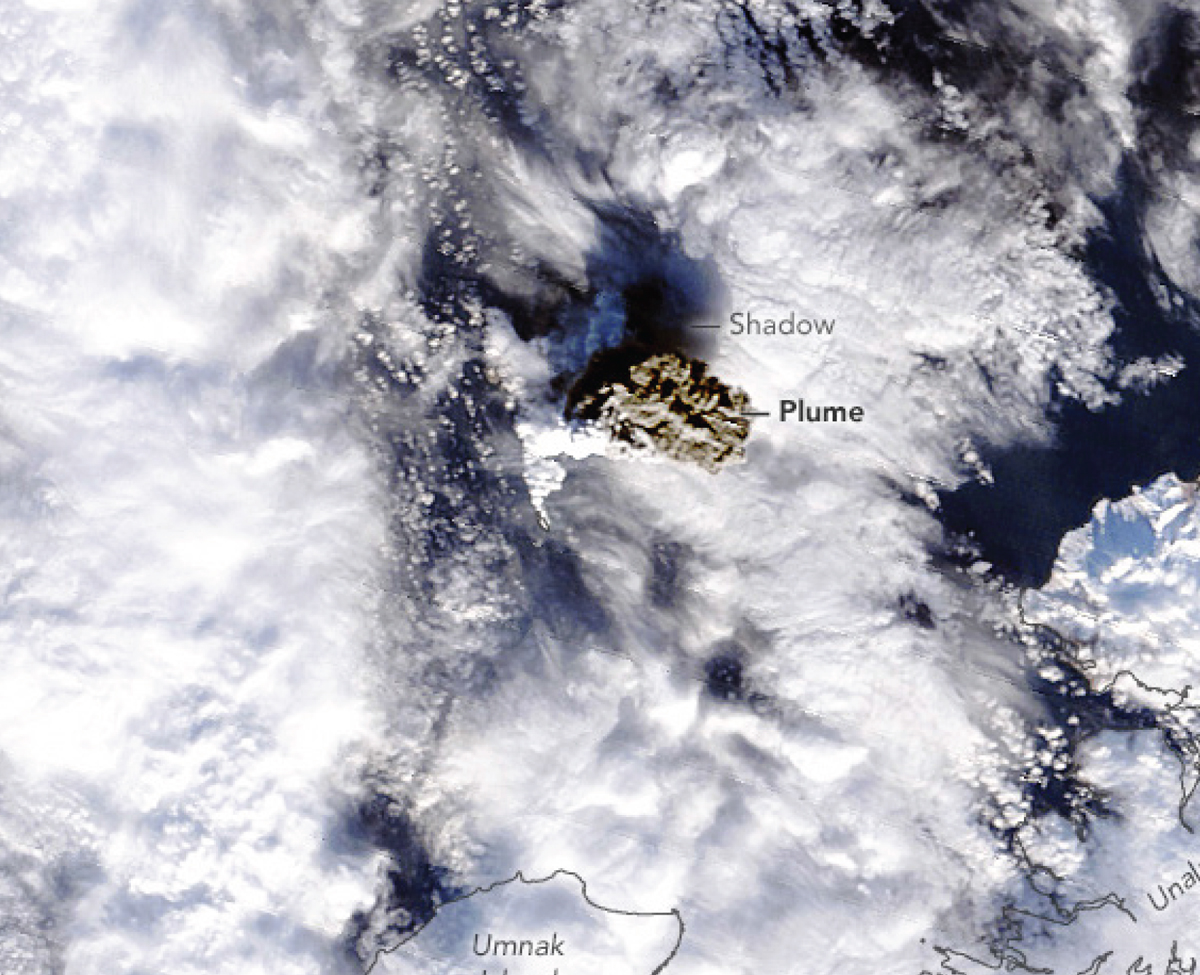
VOLCANIC ERUPTIONS AND ASH CLOUDS

Satellite observations can help pilots avoid potential engine failures caused by the ingestion of volcanic ash. Additionally, by observing the dispersal of volcanic ash clouds, the economic and other impacts caused by rerouting aircraft can be minimized. In 2007, 63,000 flights were canceled during the 4 days after the Eyjafjallajökull eruption in Iceland. The use of NASA Earth observations may have contributed as much as $72 million in avoided revenue losses and costs to U.S. carriers. In addition, had the NASA observations been used by the London Volcanic Ash Advisory Centre, an estimated additional $132 million, for a total of $204 million, in revenue losses and costs might have been avoided during the incident. More recently, flights over the Alaskan Aleutian Islands were disrupted during an underwater volcanic eruption near Bogoslof Island (see image below).
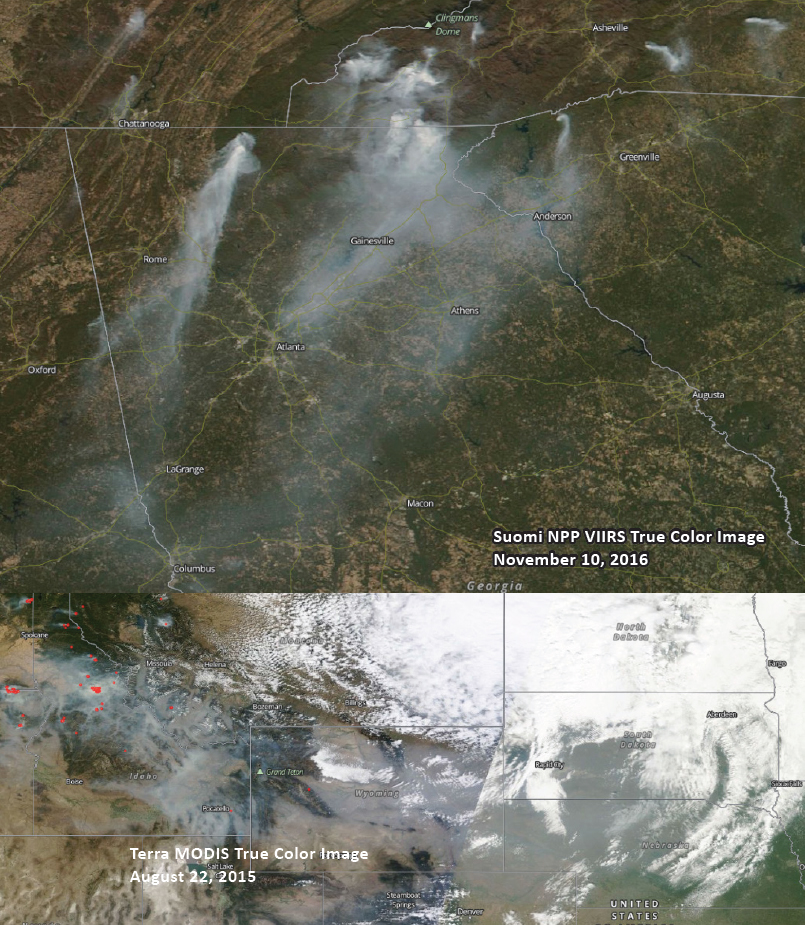
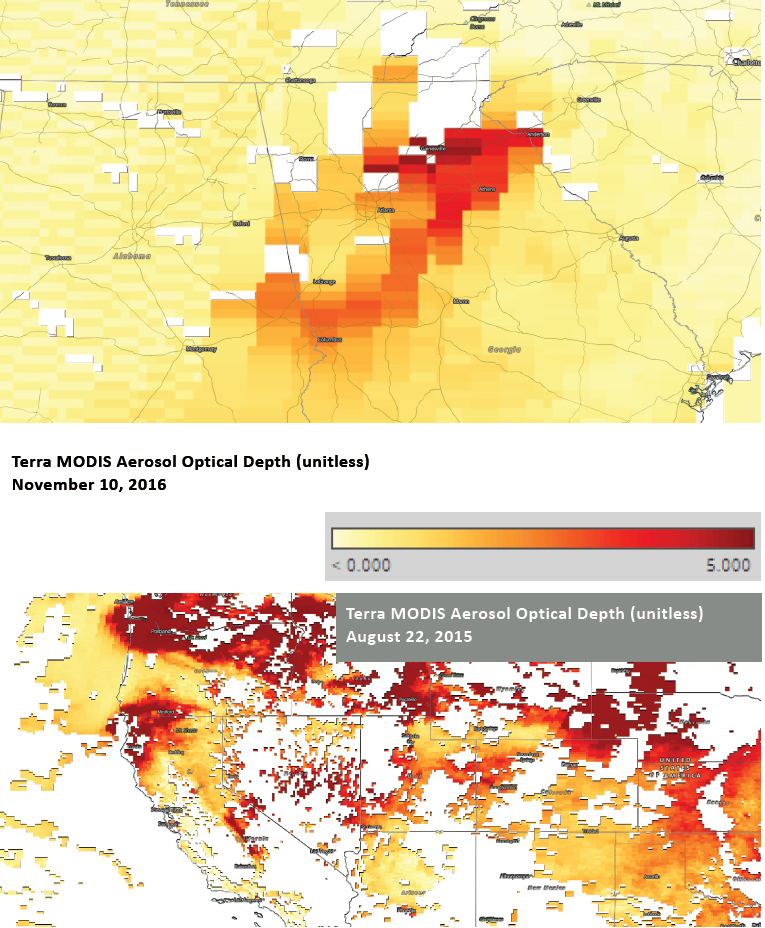
Image
On January 18, 2017, the Moderate Resolution Imaging Spectroradiometer (MODIS) on NASA’s Terra satellite captured this image of a plume rising from the volcano. Note how the plume appears to be two colors. The lower part is white and composed primarily of steam and water vapor. Because the vent has been under the ocean for most of the eruption, its plume contains more water vapor than a plume from a typical terrestrial volcano in Alaska. The upper part of the plume is dark gray-brown and rich in ash.

Suggested Citation:"Earth Science and Applications Research." National Academies of Sciences, Engineering, and Medicine. 2019. Thriving on Our Changing Planet: A Decadal Strategy for Earth Observation from Space: An Overview for Decision Makers and the Public. Washington, DC: The National Academies Press. doi: 10.17226/25437.
×

AIR QUALITY

One out of every nine premature deaths is related to conditions linked to air pollution. Of those deaths, around 4 million per year are related to outdoor air pollution (WHO, 2016; Cohen et al., 2017), costing the global economy about $225 billion in lost labor income annually and more than $5 trillion in welfare losses (World Bank, 2016). Just one fire season in Indonesia in 2015 led to an estimated 100,000 excess deaths from severe haze (Koplitz et al., 2016). Wildfire pollution also affects large U.S. populations. The degradation of air quality in many countries over the past decade has been well documented by satellite air pollutant data (Duncan et al., 2016; Geddes et al., 2016; Ma et al., 2016). By 2060, 6 to 9 million annual premature deaths are expected, with annual global welfare costs projected to rise to $18 trillion to $25 trillion (in U.S. dollars; OECD, 2016).

Image
True color images of widespread wildfire smoke over the southeastern United States (top), which intermittently degraded air quality in several major cities, including Atlanta, over a period of several weeks in 2016, and western United States (bottom), where wildfires are common.
Image
Aerosol optical depth (unitless) data illustrate the widespread impact of these wildfires and allow for the inference of surface concentrations of fine particulate matter using an atmospheric model and exposure estimates for human health studies.

______

A.J. Cohen et al., 2017, Lancet 389(10082):1907-1918; B.N. Duncan et al., 2016, Journal of Geophysical Research 121:976-996; J.A. Geddes et al., 2016, Environmental Health Perspectives 124(3):281-289; S.N. Koplitz et al., 2016, Environmental Research Letters 11:094023; Z. Ma et al., 2016, Environmental Health Perspectives 124:184-192; OECD (Organisation for Economic Co-operation and Development), 2016, The Economic Consequences of Outdoor Air Pollution, Paris: OECD Publishing; WHO (World Health Organization), 2016, Ambient Air Pollution: A Global Assessment of Exposure and Burden of Disease, http://apps.who.int/iris/bitstream/10665/250141/1/9789241511353-eng.pdf; World Bank and the Institute for Health Metrics and Evaluation, 2016, The Cost of Air Pollution: Strengthening the Economic Case for Action, Washington, DC: World Bank.

Suggested Citation:"Earth Science and Applications Research." National Academies of Sciences, Engineering, and Medicine. 2019. Thriving on Our Changing Planet: A Decadal Strategy for Earth Observation from Space: An Overview for Decision Makers and the Public. Washington, DC: The National Academies Press. doi: 10.17226/25437.
×

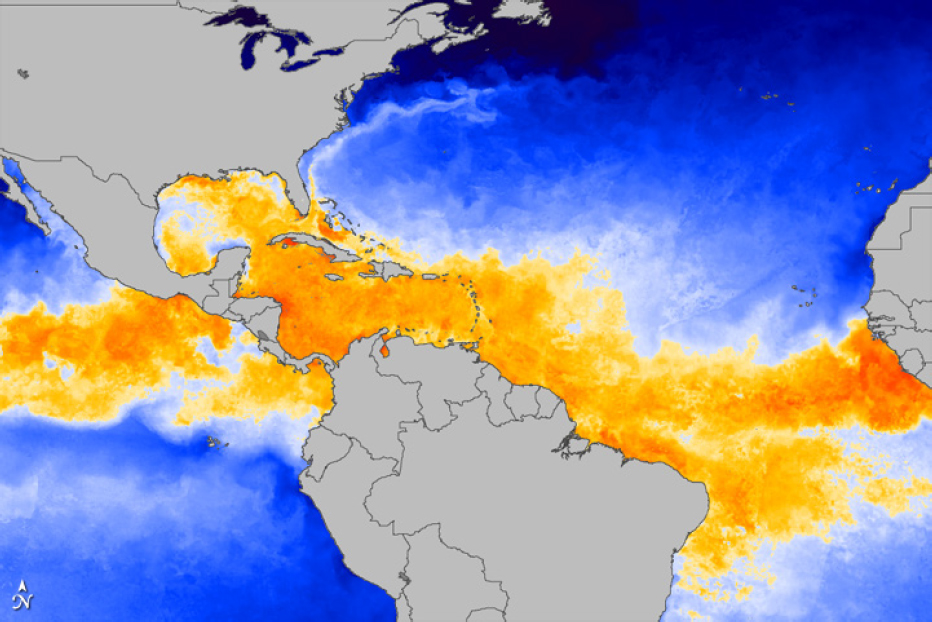
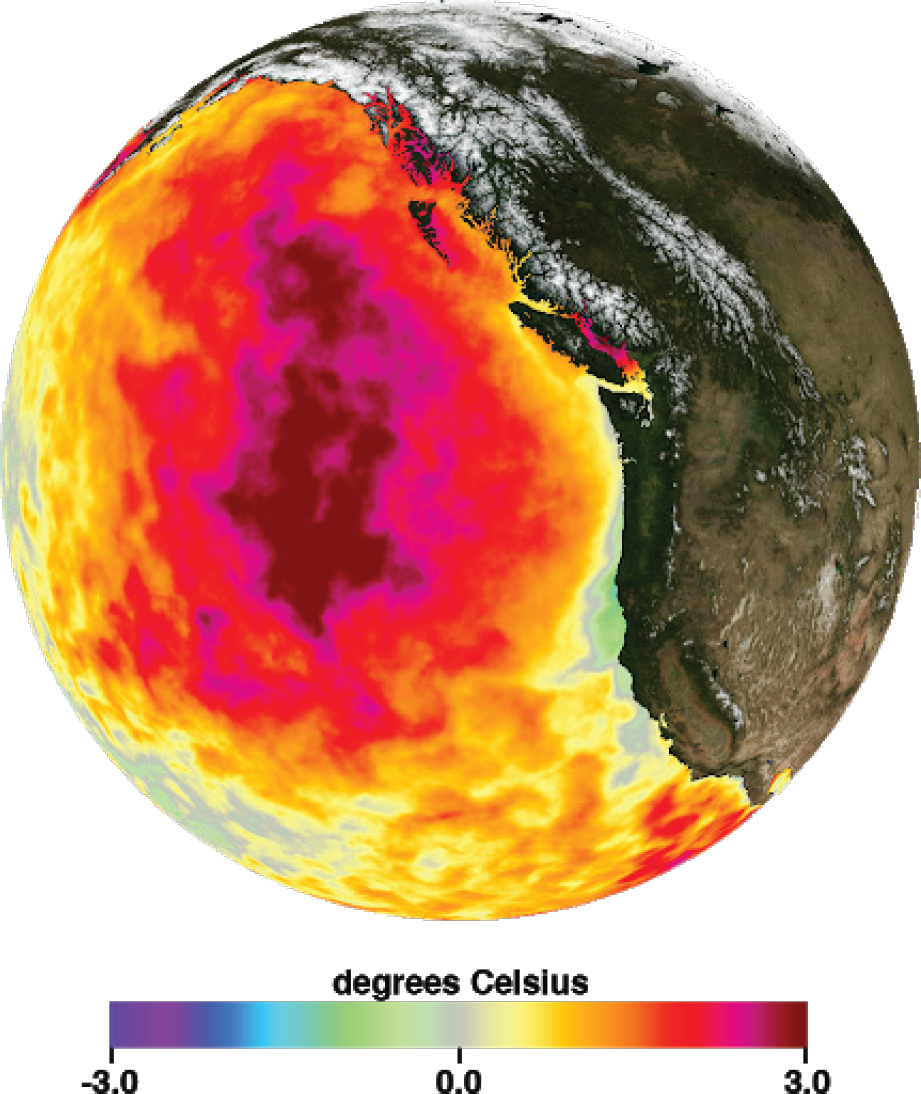
NORTHEAST PACIFIC OCEAN WARMING

Satellites measure the ocean temperature, which can strongly affect weather and marine ecosystems. For example, much of the West Coast relies on episodic “Atmospheric River” storm events for a substantial portion of their annual rainfall. In the winters of 2012 to 2016, a stationary atmospheric ridge formed over the North Pacific, preventing these storms from reaching the West Coast and partially causing a severe drought. The drought was compounded by warmer than normal ocean temperatures. The warming event was the largest and longest warming event on record, affecting weather and causing major sea life mortality events from Alaska to Baja California. Due to a severe, prolonged, harmful algae bloom, commercial crabbing was closed or delayed in Oregon, Washington, and California.

Image
The May 2015 monthly average sea-surface temperature, minus the monthly climatological values, showing "The Blob" of record warm temperatures in the Pacific Ocean. Along the U.S. West Coast, warm ocean temperatures were present from 2014 to 2016 and were pushed offshore for brief periods each spring during upwelling-favorable wind events.
Suggested Citation:"Earth Science and Applications Research." National Academies of Sciences, Engineering, and Medicine. 2019. Thriving on Our Changing Planet: A Decadal Strategy for Earth Observation from Space: An Overview for Decision Makers and the Public. Washington, DC: The National Academies Press. doi: 10.17226/25437.
×

SATELLITE OBSERVATIONS OF CLIMATE SYSTEM TRENDS

In our changing world, Earth observations from space are important for supporting humanity’s ability to thrive. Such observations enable scientific breakthroughs and have direct impacts on our economy, national security, public safety, and quality of life.
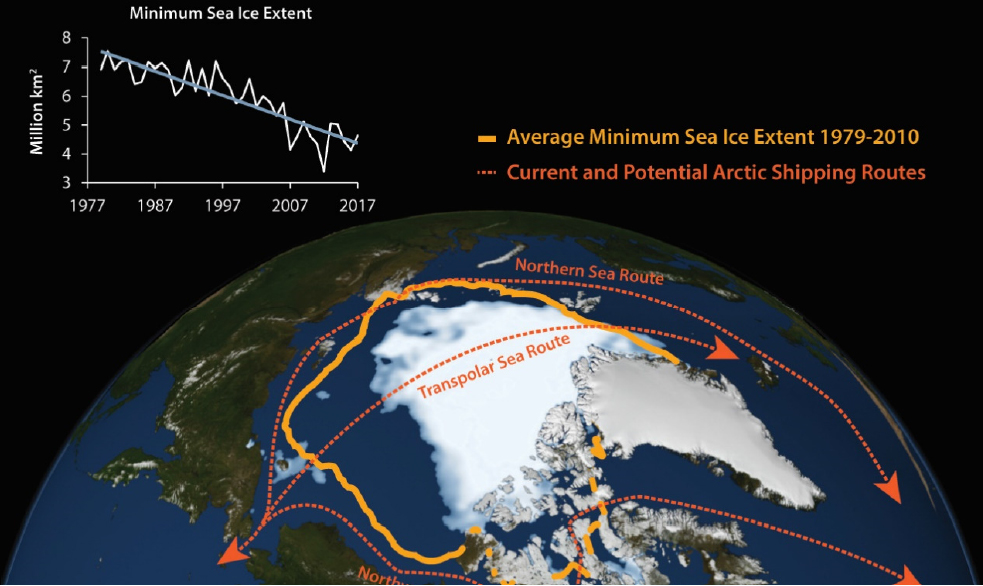
ARCTIC SEA ICE

The changing Arctic sea-ice cover presents us with a challenging confluence of risk and opportunity, complete with underlying international, commercial, and military implications. The rates of changes in sea-ice coverage are extraordinarily high. Space-based observations have recorded a decline in the summer’s ice extent at a rate of 13 percent per decade. The Northwest Passage and trans-Arctic shipping routes may open soon to regular transit.
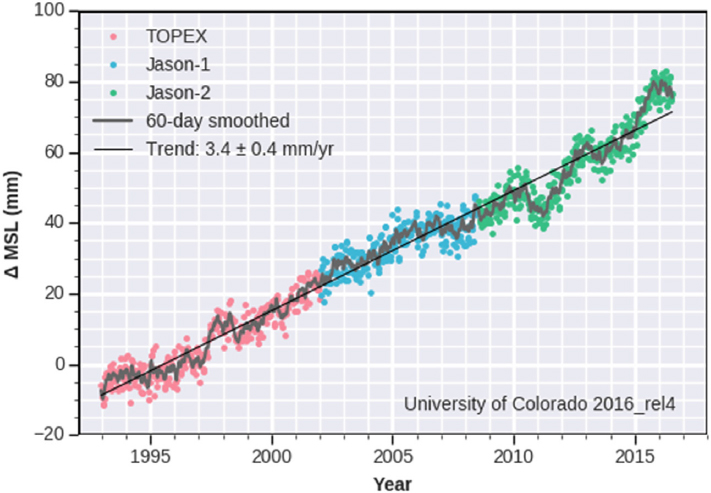
Image
Late summer 2012 Arctic sea-ice area (in white), overlaid with current and potential Arctic shipping routes (dotted red lines) resulting from sea-ice loss. These routes substantially decrease shipping times between Europe and Asia and other parts of the world. The orange line shows the average extent of the annual Arctic sea-ice minimum for 1979–2010, and the inset shows the monthly average values of sea-ice extent for each September (the month at which the ice reaches its minimum extent) during the full satellite record, 1979–2017. Measurements of sea ice thickness, an important additional factor in determining the mass and volume changes of the sea ice cover, have been far less complete than the measurements of ice extent and distribution in the past four decades. With the recent launch of NASA’s ICESat-2, scientists will be able to create detailed maps of sea ice thickness in both the Arctic and the Antarctic.

SEA-LEVEL RISE

Global sea-level rise is an interdisciplinary issue with immense societal impact. Sea-level rise is the combined result of warming oceans (thermal expansion) and more water (the addition of mass as glaciers and land ice sheets melt). Since the advent of satellite altimetry in 1992, measurements of the absolute sea level from space indicate an average global rate of sea-level rise between +2.6 to +2.9 mm/yr—more than twice the average rate for the entire 20th century. The estimated 146 million people worldwide living along the coast within 1 m or less above mean high tide—about 2 percent of the global population—are at direct risk this century. The largest impacts will be associated with storm surge and intense rainfall, which are exacerbated by changes in local relative sea level, tidal amplitudes, local subsidence, and the nature of extreme meteorological forces. The Intergovernmental Panel on Climate Change (IPCC) in its 5th Assessment Report (2013) projects anywhere from ~25 cm to 1 m by 2100, but more recent projections, adopted by California, are larger, ranging from 0.5 to 1.2 m.

Image
Right: Global mean sea-level as recorded from a series of satellite altimetry missions. Data was based on precision altimetry missions covering a swath from latitude 66 degrees north to 66 degrees south.

Suggested Citation:"Earth Science and Applications Research." National Academies of Sciences, Engineering, and Medicine. 2019. Thriving on Our Changing Planet: A Decadal Strategy for Earth Observation from Space: An Overview for Decision Makers and the Public. Washington, DC: The National Academies Press. doi: 10.17226/25437.
×

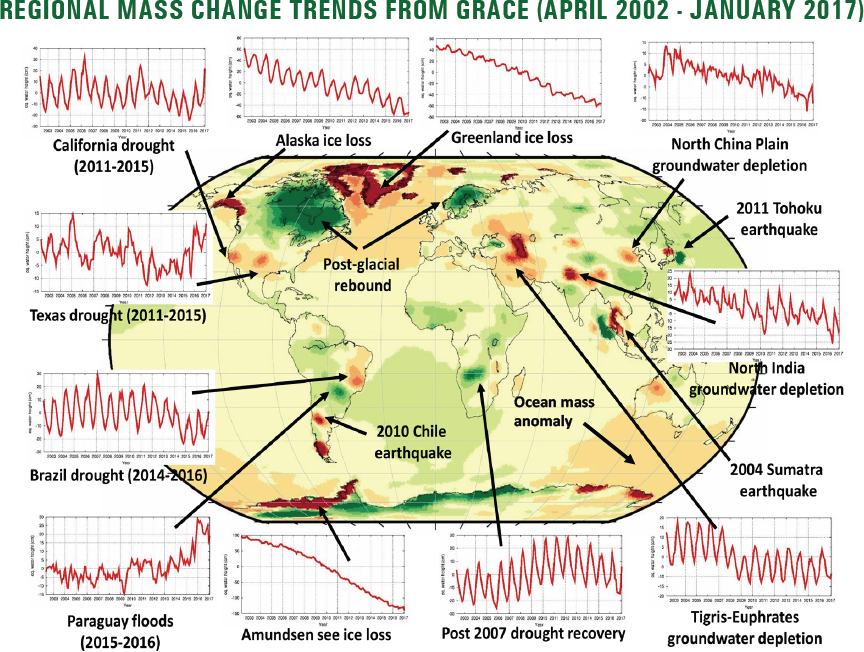
GROUNDWATER DEPLETION

Since its launch in 2002, the Gravity Recovery and Climate Experiment (GRACE) has provided unique insights with far-reaching benefits for understanding the transport of mass in the Earth system. By measuring gravity changes over the entire Earth, the GRACE mission produces monthly maps of how liquid water, ice, and solid Earth components are being redistributed within and between the ocean and the continents. This information has helped to explain and to quantify mass changes of ice sheets and mountain glaciers, water losses from lakes and underground aquifers, and their overall contribution to sea-level rise. By mapping seasonal and year-to-year changes in water storage across the landscape, GRACE contributes to our understanding of the global water cycle. Based on the significant advances in both measurement capability and the analytical framework during the mission life span of 15 years, GRACE data are now an essential asset for a number of operational applications, such as drought forecasting within the framework of the U.S. National Drought Monitor. Recent international efforts were initiated that use GRACE gravity observations for disaster forecasting and management response (e.g., the multination European Gravity Service for Improved Emergency Management, EGSIEM).
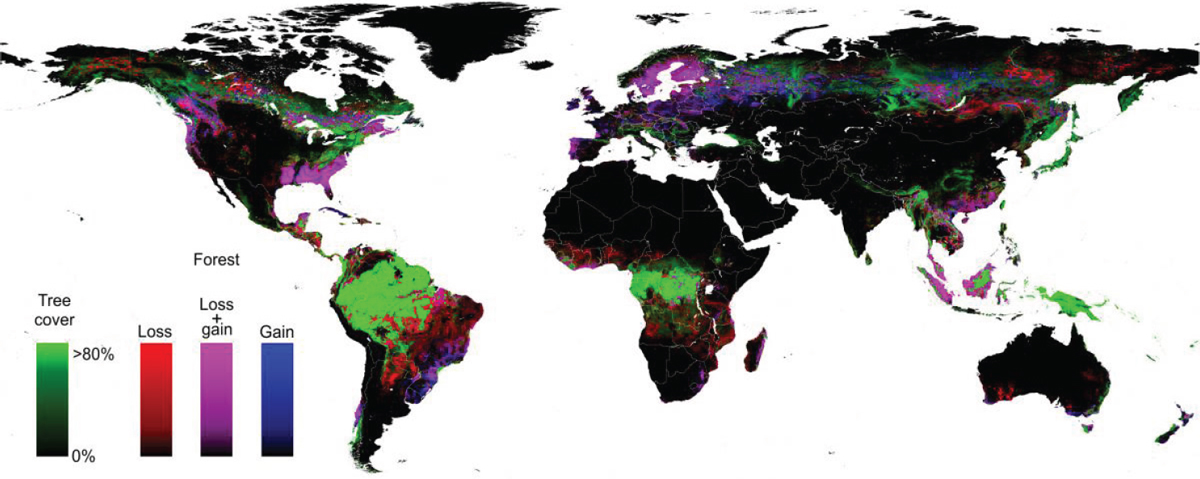
Image
In addition to earthquake assessment and drought forecasting (https://nasagrace.unl.edu), the GRACE Total Water Column measurements provide crucial information for implementing a global early flood detection and prediction capability (http://egsiem.eu/project/introduction). These examples, which demonstrate the ability of the GRACE measurement as a unique tool to quantify Earth’s mass change on a global basis as well as the ability to determine the distinct local components of the global mass change, underscore the importance of global gravity measurements in understanding the Earth system interactions.

Suggested Citation:"Earth Science and Applications Research." National Academies of Sciences, Engineering, and Medicine. 2019. Thriving on Our Changing Planet: A Decadal Strategy for Earth Observation from Space: An Overview for Decision Makers and the Public. Washington, DC: The National Academies Press. doi: 10.17226/25437.
×

FOREST COVER CHANGE

Earth’s forests contain a vast amount of carbon. Recent estimates put the total carbon in trees at 450 to 650 billion tons. This is equivalent to more than half the quantity of carbon in carbon dioxide in the atmosphere, or the amount in approximately 45 to 65 years of industrial emissions, at current emission rates. Carbon emissions from the clearing of forests represent one of the largest anthropogenic sources of greenhouse gases. In recent years, forest clearing has released about 10 percent as much carbon dioxide as fossil energy and industrial activity, and fires associated with climate change are increasing. Forest managers in many parts of the world have active discussions or operational programs that allow countries and individuals to make forests key mechanisms in the portfolio of strategies they use to manage their carbon emissions.

The current state-of-the-science in global forest mapping shows that, from 2000 to 2012, the world lost 2.3 and gained 0.8 million square kilometers of forest. Google Earth Engine was used to analyze over 600,000 Landsat 7 ETM+ (Enhanced Thematic Mapper Plus) scenes, coupled with high-resolution imagery for validation, to produce global maps of tree cover at 30 m spatial resolution.

Image

Image

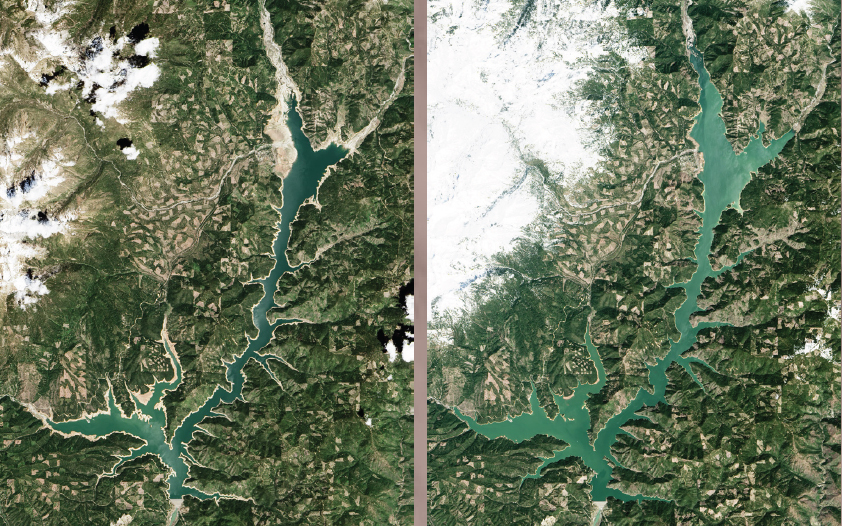
A 5-year drought in California ended spectacularly in the winter of 2017, with the state emerging from one of its driest periods on record by enduring a wet winter. A steady stream of storms brought 175 percent of the long-term average of rain and snow to California between October 2016 and April 2017. The left image from the Landsat 8 Operational Land Imager (OLI) shows tan bands around the shoreline of Trinity Lake, California’s third largest reservoir, in April 2015, when the reservoir level was at 59 percent of the historical average; the right image shows the reservoir in April 2017, with the level at 114 percent of the historical average.

Suggested Citation:"Earth Science and Applications Research." National Academies of Sciences, Engineering, and Medicine. 2019. Thriving on Our Changing Planet: A Decadal Strategy for Earth Observation from Space: An Overview for Decision Makers and the Public. Washington, DC: The National Academies Press. doi: 10.17226/25437.
×
Page 3
Suggested Citation:"Earth Science and Applications Research." National Academies of Sciences, Engineering, and Medicine. 2019. Thriving on Our Changing Planet: A Decadal Strategy for Earth Observation from Space: An Overview for Decision Makers and the Public. Washington, DC: The National Academies Press. doi: 10.17226/25437.
×
Page 4
Suggested Citation:"Earth Science and Applications Research." National Academies of Sciences, Engineering, and Medicine. 2019. Thriving on Our Changing Planet: A Decadal Strategy for Earth Observation from Space: An Overview for Decision Makers and the Public. Washington, DC: The National Academies Press. doi: 10.17226/25437.
×
Page 5
Suggested Citation:"Earth Science and Applications Research." National Academies of Sciences, Engineering, and Medicine. 2019. Thriving on Our Changing Planet: A Decadal Strategy for Earth Observation from Space: An Overview for Decision Makers and the Public. Washington, DC: The National Academies Press. doi: 10.17226/25437.
×
Page 6
Suggested Citation:"Earth Science and Applications Research." National Academies of Sciences, Engineering, and Medicine. 2019. Thriving on Our Changing Planet: A Decadal Strategy for Earth Observation from Space: An Overview for Decision Makers and the Public. Washington, DC: The National Academies Press. doi: 10.17226/25437.
×
Page 7
Suggested Citation:"Earth Science and Applications Research." National Academies of Sciences, Engineering, and Medicine. 2019. Thriving on Our Changing Planet: A Decadal Strategy for Earth Observation from Space: An Overview for Decision Makers and the Public. Washington, DC: The National Academies Press. doi: 10.17226/25437.
×
Page 8
Suggested Citation:"Earth Science and Applications Research." National Academies of Sciences, Engineering, and Medicine. 2019. Thriving on Our Changing Planet: A Decadal Strategy for Earth Observation from Space: An Overview for Decision Makers and the Public. Washington, DC: The National Academies Press. doi: 10.17226/25437.
×
Page 9
Suggested Citation:"Earth Science and Applications Research." National Academies of Sciences, Engineering, and Medicine. 2019. Thriving on Our Changing Planet: A Decadal Strategy for Earth Observation from Space: An Overview for Decision Makers and the Public. Washington, DC: The National Academies Press. doi: 10.17226/25437.
×
Page 10
Suggested Citation:"Earth Science and Applications Research." National Academies of Sciences, Engineering, and Medicine. 2019. Thriving on Our Changing Planet: A Decadal Strategy for Earth Observation from Space: An Overview for Decision Makers and the Public. Washington, DC: The National Academies Press. doi: 10.17226/25437.
×
Page 11
Suggested Citation:"Earth Science and Applications Research." National Academies of Sciences, Engineering, and Medicine. 2019. Thriving on Our Changing Planet: A Decadal Strategy for Earth Observation from Space: An Overview for Decision Makers and the Public. Washington, DC: The National Academies Press. doi: 10.17226/25437.
×
Page 12
Suggested Citation:"Earth Science and Applications Research." National Academies of Sciences, Engineering, and Medicine. 2019. Thriving on Our Changing Planet: A Decadal Strategy for Earth Observation from Space: An Overview for Decision Makers and the Public. Washington, DC: The National Academies Press. doi: 10.17226/25437.
×
Page 13
Suggested Citation:"Earth Science and Applications Research." National Academies of Sciences, Engineering, and Medicine. 2019. Thriving on Our Changing Planet: A Decadal Strategy for Earth Observation from Space: An Overview for Decision Makers and the Public. Washington, DC: The National Academies Press. doi: 10.17226/25437.
×
Page 14
Suggested Citation:"Earth Science and Applications Research." National Academies of Sciences, Engineering, and Medicine. 2019. Thriving on Our Changing Planet: A Decadal Strategy for Earth Observation from Space: An Overview for Decision Makers and the Public. Washington, DC: The National Academies Press. doi: 10.17226/25437.
×
Page 15
Next: The Recommended Program for the Next Decade »
Thriving on Our Changing Planet: A Decadal Strategy for Earth Observation from Space: An Overview for Decision Makers and the Public Get This Book
×
 Thriving on Our Changing Planet: A Decadal Strategy for Earth Observation from Space: An Overview for Decision Makers and the Public
Buy Ebook | $0.00
MyNAP members save 10% online.
Login or Register to save!
Download Free PDF

We live on a dynamic Earth shaped by both natural processes and the impacts of humans on their environment. It is in our collective interest to observe and understand our planet, and to predict future behavior to the extent possible, in order to effectively manage resources, successfully respond to threats from natural and human-induced environmental change, and capitalize on the opportunities – social, economic, security, and more – that such knowledge can bring.

By continuously monitoring and exploring Earth, developing a deep understanding of its evolving behavior, and characterizing the processes that shape and reshape the environment in which we live, we not only advance knowledge and basic discovery about our planet, but we further develop the foundation upon which benefits to society are built. Thriving on Our Changing Planet: A Decadal Strategy for Earth Observation from Space (National Academies Press, 2018) provides detailed guidance on how relevant federal agencies can ensure that the United States receives the maximum benefit from its investments in Earth observations from space, while operating within realistic cost constraints. This short booklet, designed to be accessible to the general public, provides a summary of the key ideas and recommendations from the full decadal survey report.

READ FREE ONLINE

  1. ×

    Welcome to OpenBook!

    You're looking at OpenBook, NAP.edu's online reading room since 1999. Based on feedback from you, our users, we've made some improvements that make it easier than ever to read thousands of publications on our website.

    Do you want to take a quick tour of the OpenBook's features?

    No Thanks Take a Tour »
  2. ×

    Show this book's table of contents, where you can jump to any chapter by name.

    « Back Next »
  3. ×

    ...or use these buttons to go back to the previous chapter or skip to the next one.

    « Back Next »
  4. ×

    Jump up to the previous page or down to the next one. Also, you can type in a page number and press Enter to go directly to that page in the book.

    « Back Next »
  5. ×

    Switch between the Original Pages, where you can read the report as it appeared in print, and Text Pages for the web version, where you can highlight and search the text.

    « Back Next »
  6. ×

    To search the entire text of this book, type in your search term here and press Enter.

    « Back Next »
  7. ×

    Share a link to this book page on your preferred social network or via email.

    « Back Next »
  8. ×

    View our suggested citation for this chapter.

    « Back Next »
  9. ×

    Ready to take your reading offline? Click here to buy this book in print or download it as a free PDF, if available.

    « Back Next »
Stay Connected!