
3
Overview of Supply Chain Impacts from the 2017 Hurricanes
While hurricanes are not new to communities across the Caribbean and southeastern United States, the 2017 storm season will be long remembered. There were 17 named storms that season, and the 3 most impactful—Hurricanes Harvey, Irma, and Maria—were unprecedented in different ways. Each storm individually posed substantial challenges to emergency management officials, and their occurrence in such quick succession stretched response capacities tremendously. A large part of this challenge was managing the movement of relief supplies and supporting the supply chains that provided the basic commodities necessary for survival.
This chapter provides a brief overview of what transpired as these three storms struck in the focal areas for this study: Texas, Florida, Puerto Rico, and the U.S. Virgin Islands. It then discusses how physical geography and supply chain characteristics influenced the vulnerability of each location to disruptions from the storms. The chapter concludes by exploring the differences and similarities in how critical supply chains were affected in each place by the different storms.
3.1 OVERVIEW OF HURRICANES HARVEY, IRMA, AND MARIA
Below is a recap of how the historic 2017 hurricanes unfolded in the four focal areas for this study (drawing largely from more detailed summaries provided in the CNA investigations that were part of this study). Figure 3.1 shows the three hurricanes’ paths and dates.
Hurricane Harvey
Harvey made landfall as a Category 4 storm near Rockport, Texas, on August 25, 2017, with winds reaching 152 miles per hour and storm surges in the range of 5 to 10 feet. Most of
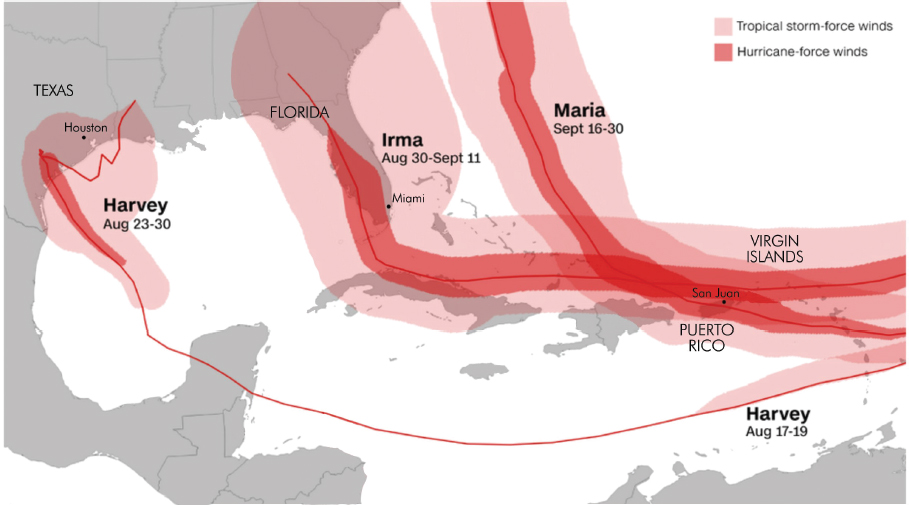
SOURCE: National Weather Service / U.S. Census Bureau.
the initial wind and wave damage affected the Coastal Bend area. Over the next several days, the storm then drifted back out toward the Gulf of Mexico, made a second landfall near the Texas-Louisiana border, and stalled over Houston—during which time the region received more than 50 inches of rainfall (five-day rain totals exceeded 64 inches in Nederland, Texas), shattering previous U.S. rainfall records. Massive flooding occurred across Houston, Beaumont, and many other communities in southeast Texas. Virtually the entire nation’s helicopter search-and-rescue resources were deployed to Texas, and there were thousands of aerial and water evacuations of stranded residents. Stagnant floodwaters blocked roadways and damaged 204,000 homes,1 forcing tens of thousands of people into shelters. Hurricane Harvey also flooded 800 wastewater treatment facilities and 13 Superfund sites, spreading sewage and toxic chemicals into the flooded areas.2 Hurricane Harvey was estimated to cause more than $125 billion in damages, making it the second most costly storm in U.S. history (after Hurricane Katrina in 2005), and the emergency management response was one of the largest in our nation’s history.
___________________
1 See https://www.houstonchronicle.com/news/article/In-Harvey-s-deluge-most-damaged-homes-were-12794820.php.
2 See https://www.washingtonpost.com/news/post-nation/wp/2017/09/03/trump-administration-wants-to-tie-harvey-recovery-aid-to-debt-ceiling-legislation/?utm_term=.683e23ab5a0d.
Hurricane Irma
Irma reached hurricane strength on August 31, 2017. By September 5, it had rapidly intensified, with sustained wind speeds of 185 mph, becoming the strongest hurricane ever observed in the Atlantic Ocean. Irma maintained Category 5 winds for three days as it moved west, and on September 6 it slammed the U.S. Virgin Islands. The island of St. Thomas in particular suffered widespread destruction. Hurricane Irma passed just north of Puerto Rico, knocking out the island’s fragile, aging electricity system and leaving more than 1 million people without power.3 During this time, evacuations began from high-risk areas in Florida, eventually reaching 6.8 million evacuees, the largest in the state’s history. On September 10, Irma made landfall at Category 4 strength in the Florida Keys, where it caused extensive damage. Hurricane-force winds extended up to 80 miles from the center, and tropical storm–force winds extended outward up to 400 miles, affecting nearly the entire Florida peninsula. As Irma advanced across Florida, severe flooding, storm surges, and tornadoes occurred across numerous counties. The storm’s huge size and rapidly changing track created unprecedented challenges for the region’s emergency management officials.
Hurricane Maria
Less than two weeks after Irma, Maria was declared a hurricane, and warnings were issued across the Caribbean. The storm continued to strengthen, and on September 19, 2017, Hurricane Maria passed over St. Croix in the U.S. Virgin Islands, destroying much of the island’s buildings and communications and power infrastructure. On September 20, Maria made landfall in Puerto Rico, still at Category 5 strength. The storm moved slowly across the island, dumping more than 30 inches of rain. By the time it eventually weakened, the entire island’s power infrastructure was destroyed, and 100 percent of customers had lost service. Over the course of the next few days, the Puerto Rico Electric Power Authority worked with the Department of Energy, the Department of Defense, and FEMA to distribute fuel and generators in order to keep critical infrastructure online across Puerto Rico and the U.S. Virgin Islands. As ports and airports reopened over the coming days, more shipments of critical relief supplies were brought in. In late September and early October, the Department of Defense provided a large contingent of employees to support response efforts in the U.S. Virgin Islands, including bringing the Navy ship Comfort to San Juan for additional medical support. However, it was not until many months later that services for potable water, electricity, and cell phone connection were fully restored across the islands.
___________________
3 See https://www.wired.com/story/puerto-rico-hurricane-maria-recovery/.
3.2 SUPPLY CHAIN CHARACTERISTICS THAT INFLUENCE DISRUPTION VULNERABILITY
Just as each storm has a unique fingerprint, the supply chains operating in any particular area have unique profiles based on many factors, including the area’s physical geography and historical development patterns as well as the strength and response capacity of critical public and private sector networks. This profile can inform, and to some degree predict, vulnerabilities and ways in which a storm may impact the area. Below are some examples of comparative supply chain profiles in the different regions covered in this study, focusing on a series of broad “meta-factors” of key importance to the functioning of supply chains.4 The main focus in this section is on physical geographical factors and not the far more complex social characteristics of the four locations (e.g., the vitality, organization, resources, and capacity of the public and private sector institutions relevant to supply chains and emergency response).
Defining Geographical Features
This element involves an area’s geographical features that drive patterns of connectivity, both within an area and with other neighboring areas. With respect to the locations considered in this study, the differences are stark (see Figure 3.2).
- South Texas. Houston is highly flood-prone due to low elevation and flat topography, which offer no natural physical drainage pathways for intense rainfall. (During Hurricane Harvey, the city’s bayous and drainage systems quickly filled, leading to rapid flooding of freeways and roads.) These flooding risks have been exacerbated by sprawling development patterns that displaced wetlands and other green spaces with impervious concrete and asphalt surfaces. The Texas coastline is long and exposed, but accessible from inland areas, and thus not largely dependent on water-bound shipments when relief efforts are needed. Inland evacuation is a possibility. At the same time, the region’s widely dispersed residential, commercial, and industrial development patterns means that the distribution of goods and services requires considerable, reliable road transport capacity. When roadways are cut off by flooding, normal supply chain systems can quickly become paralyzed.
- Florida. Much of Florida is similarly flood-prone due to low elevations and development patterns that undermine natural drainage systems. South Florida has underlying porous limestone that allows floodwaters to arise from underground and has coastal exposure to both Atlantic and Gulf Coast storms. As an 800-mile long, densely developed peninsula with just a few main transport corridors, Florida’s
___________________
4 Here Puerto Rico and the U.S. Virgin Islands are grouped together because they share many common characteristics, but there are of course important differences between the two locations; for example, Puerto Rico’s local distribution problem was vastly more complex and the impacted population was significantly larger.
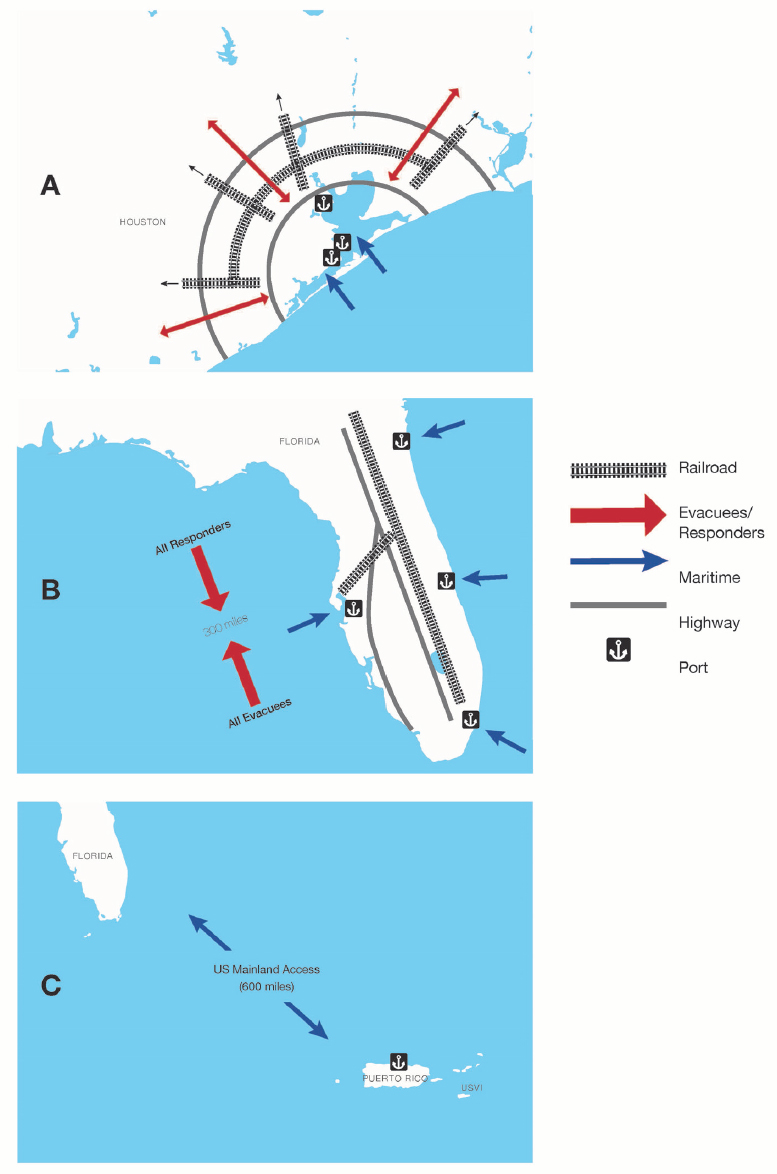
- geography exacerbates challenges when there is a mass evacuation from vulnerable areas along congested routes or large-scale delivery of critical goods and services into affected areas. Hurricane Irma caused record-breaking rapid evacuations along congested highway routes. Relief supplies can be sourced from U.S. areas outside of the state, but it is still necessary to navigate the peninsula to deliver goods and services, with the uncertainty of being able to return home. Fuel delivery to Florida is primarily by water to port facilities, where it is then distributed by tanker trucks.
- Puerto Rico and the U.S. Virgin Islands. These islands rely entirely on delivery of goods and relief supplies by ship and barge, primarily from U.S. ports more than 1,200 miles away. Transit times and delays for delivery of goods are thus an important factor in emergency response planning. Puerto Rico has one large natural harbor (housing the Port of San Juan, a critical node for most supply chains), plus a number of smaller ports located around the island. The island also has mountainous terrain that poses challenges for emergency response and goods delivery. On the island of St. Thomas the main industrial port has very limited space for unloading shipping containers and staging of large-scale relief supply deliveries (which elevates the likelihood of bottlenecks), and there is even less port capacity on the other islands. Evacuation from an island requires considerable advance planning.
Directional Configuration of the Main Supply Chain Links and Corridors
The most tangible elements of supply chains are physical links such as interstate highways, pipeline routes, and railroad rights-of-way. Development patterns are determined by local geography and by historical economic factors. The levels of redundancy and connectedness are both highly relevant to supply chain resilience.
- South Texas. The area has plentiful capacity in terms of multi-modal transport links and corridors, which are highly interconnected and multi-directional.
- Florida. The state of Florida is more capacity-limited than South Texas, due to the linear, parallel transport links that predominate along the peninsula.
- Puerto Rico and the U.S. Virgin Islands. Puerto Rico is characterized by circumferential routes around the Island’s perimeter. The U.S. Virgin Islands are capacity-constrained by a small number of roads on each island. As a result, people living in more isolated inland locations, away from metropolitan centers, often faced far more severe problems with delivery of critical goods.
Concentration of Critical Nodes and Possible Points of Failure
Links in a supply chain that connect key nodes can often become severe bottlenecks in emergency situations. This is a particular risk where different modes of transportation connect
with one another (e.g., port to truck, port to rail, or pipeline to truck). Capacity constraints on the connecting nodes, and/or a configuration that limits network redundancy, can exacerbate these bottlenecks.
- South Texas. Road and rail transport nodes are relatively dispersed, but for maritime transport, the Houston Ship Channel is a critical transportation link and potential single point of failure for a critical distribution network.
- Florida. Refined petroleum distribution for a very large market is concentrated at a limited number of fuel racks (an example of critical nodes in the fuel supply chain).
- Puerto Rico and the U.S. Virgin Islands. Both settings are significantly constrained by having just a single port of entry for the vast majority of supplies imported to the islands, ports that represent both critical nodes and potential bottlenecks (see Box 3.1).
Modal Diversity Available
Geography, history, and public and private investments will determine the modes available to serve an area’s supply chain needs. Access to multiple modes provides the resilience benefit of redundant routes and services, which help prevent bottlenecks when primary modes are disrupted.
- South Texas. The Houston area has a well-developed multimodal infrastructure, including rail, truck, barge, ship, and pipeline options. There is also substantial intermodal connectivity and redundancy.
- Florida. Truck transport is by far the dominant mode for most goods, with petroleum products arriving primarily by ship. This is augmented by some limited rail capacity.
- Puerto Rico and the U.S. Virgin Islands. Most goods arrive by ship. Within each island only truck-based distribution originating at the port of entry is available.
Vulnerability of Critical Infrastructure Needed to Support Supply Chain Operation and Continuity
Energy supplies (especially refined petroleum and electricity) are essential to support the operation of supply chains. Additionally, in today’s connected world, telecom and wireless have become necessary to support both supply chain operations and financial transactions.
- South Texas. Lessons learned from past storms resulted in the hardening and resilience of many supply systems, driven in large part by concerns about the operating risks of petrochemical industries. For instance, petroleum companies have installed redundant power supplies, relocated communications systems, and elevated control rooms and pump stations.5 Utility companies have made similar improvements including investments to their electricity systems by installing intelligent sensors that provide real-time situational awareness about the grid (OEDER, 2010).
- Florida. The refined fuel distribution system can be subject to bottlenecks and constrained by access to a limited number of port-based receiving facilities and long intra-state transport distances. The state is subject to large swings in seasonal demand due to tourism. On the other hand, power distribution system upgrades and smart grid investments have reduced vulnerabilities of the electric grid, aiding in quicker response and restoration of power (EEI, 2014).
- Puerto Rico and the U.S. Virgin Islands. Critical infrastructure is extremely vulnerable, especially with respect to the electric power and communications networks that are old, outmoded, and inaccessible in mountainous areas.
___________________
5 See Hurricane Security Operations, Association of Fuel and Petrochemical Manufacturers, https://www.afpm.org/industries/performance/preparing-disruption.
3.3 COMPARISON OF THE HURRICANE IMPACTS ON SUPPLY CHAINS IN THE FOUR STUDY AREAS
For the purpose of this study, the committee was asked to “discuss commonalities and differences in how supply chain systems were affected by Hurricanes Harvey, Irma, and Maria in the affected areas of Texas, Florida, Puerto Rico, and the U.S. Virgin Islands” and to “identify and explain crucial interdependencies, supply chain nodes, and disruptions to supply chains in each of the impacted areas that affected response and recovery” (see the Statement of Task in Box 1.1). It is not feasible to capture the thousands of diverse individual incidents and stories that make up any individual storm event, and it was well beyond the committee’s capacity to provide a comprehensive summary of the supply chain impacts that unfolded in each place. Rather, highlighted here are some select examples of impacts that are most pertinent to the focus of this study. Unless otherwise noted, the information presented in this section comes from the CNA investigations (Palin et al., 2018) and from speakers at the committee meetings. (See list of speakers in Appendix A. This information is paraphrased here, and not presented as direct quotes attributed to individual speakers.)
In all of the cases studied, supply chain problems were related to some element of each storm that was unexpected and/or beyond the scale of what government officials and businesses had prepared for. Houston officials were not expecting such massive flooding that cut off most all road transport for days; Florida officials were not expecting a hurricane with a track that affected most of the state and led to the evacuation of 6 million people; Puerto Rico was not expecting a direct hit by a Category 5 hurricane and complete loss of the power grid; and the U.S. Virgin Islands was not expecting to be hit by two major storms in rapid succession. The 2017 hurricane season vividly illustrated that when unprecedented disasters unfold, it is difficult to predict all possible scenarios of impacts. Hence, supply chain resilience is about not only preventing all adverse impacts, but also being ready to respond nimbly when impacts do occur.
Unsurprisingly, each of the four locations faced many supply chain disruptions that were unique to their situations, and a wide variety of differing experiences unfolded across Texas, Florida, Puerto Rico, and the U.S. Virgin Islands. Some of these distinct features are discussed below.
Southeast Texas / Hurricane Harvey
The city of Houston, Harris County, and surrounding areas have sophisticated systems for disaster preparedness and response, including strong Emergency Operation Center links with many large private sector organizations. Because many critical facilities in the region (e.g., the Port of Houston, fuel refineries) had engaged in a variety of preparedness exercises and had well-developed platforms for sharing information, during Hurricane Harvey they averted some major problems that could have devastated local, regional, and even national supply chains.
Power and Communications
Some utilities experienced significant damage to areas northeast of Corpus Christi (AEP Texas, in Port Aransas and Rockport), mostly due to wind, but only about 2.5 percent of customers in Texas experienced power outages, with the majority of customers being restored one week to 10 days after the storm landfall (ISER, 2017). Texas utilities’ preparedness efforts and investments in smart grid technologies aided in the rapid response.6
Food and Water Supplies
Distribution and delivery services for food, bottled water, and other critical goods were interrupted for more than one week, during the time that flooding made road deliveries impossible, but as the waters receded (and high-water trucks were brought in to help with delivery) most grocery stores quickly recovered and reopened. The disruption to municipal water systems (discussed below) led to a surge in demand for bottled water, but prepositioning of supplies seems to have prevented widespread supply shortages.
One unique aspect of the Hurricane Harvey response is the region’s readiness to collect and distribute food aid through an extensive network of food banks and community-sponsored or operated points of distribution; a network that essentially operated as its own supply chain, under the Emergency Food and Shelter Program.7 More than 40 trailers of food and supplies were collected and distributed through this system to cover local needs in the first days after the event.8
As Harvey’s flooding increased, many parts of the municipal water system in the region failed with little notice. More than 1 million people in the region had their water service temporarily affected, and some remained on boil-water advisories for more than three weeks. Many unforeseen complications hindered efforts to repair the system, and this had cascading impacts across numerous critical facilities (e.g., hospitals unable to operate). Due to help from regional peer utilities and the Texas Department of Emergency Management, however, little federal assistance for system repair and restoration was ultimately needed.
Fuel Supplies
Texas and Louisiana are major fuel-producing hubs that supply the local region as well as many other regions, primarily along the east coast. Therefore, any sustained closure or damage at these facilities can have widespread impacts on supply chains, involving numerous critical production nodes and transportation links in the fuel supply chain. During and
___________________
6 See testimony by DeAnn Walker, Public Utility Commission of Texas (Walker, 2017).
7 See https://www.fema.gov/media-library-data/1532523209760.4943fdee1432ba47de17e2a9c5357502/mergencyFood.pdf.
8 See https://www.citylab.com/environment/2017/09/houston-food-storm/538521/.
immediately after Hurricane Harvey struck, most major facilities were closed for some period of time. For instance, there was closure of all major ports along the Texas coastline (Sector Corpus Christi, Sector Houston/Galveston, Sector Port Arthur/Lake Charles), of approximately 25 percent of Gulf Coast offshore oil and natural gas production, and of approximately 50 percent of Gulf Coast refinery capacity,9 as well as some major marine terminals and crude and product pipelines (Colonial, Explorer, Magellan).
While the state of Texas issued emergency evacuation orders prior to the storm, Houston and Galveston did not.10 After the storm, local fuel-distribution facilities and retail fuel stations did experience temporary fuel shortages due to increased demand, driven largely by public fear of gas shortages11 as well as some flooding-related delivery problems. However, major pressures on this supply chain were alleviated by the lack of major evacuations, the limited power outages, and the fact that most critical nodes had a high inventory of fuel supply when the storm hit.
Medical and Pharmaceutical Supplies
Medical supply chain systems and local care coalitions were relatively well-prepared and ready to function when needed. Pharmaceutical manufacturers and distributors in the region remained mostly stable. Closure of the airport caused some disruptions, but because there was a surge of products into the region before the storm, no major shortfalls resulted. Officials from the Department of Health and Human Services and the Office of the Assistant Secretary for Preparedness and Response helped to ensure that hospitals had what they needed.
As with other supply chains, flooding caused the greatest challenges in the delivery of medical and drug supplies and maintaining the population’s access to medical care. For instance, the Hospital Corporation of America’s health care network (discussed in the Florida section) had extensive disaster preparedness plans, yet the massive flooding led to major difficulties in delivering supplies to medical facilities. Some other challenges included:
- re-entry and credentialing issues that arose due to lack of clear procedures;
- getting supply deliveries to home health care providers, again largely due to the flooding of roads; and
- insufficient understanding of which critical infrastructure facilities (especially water treatment plants and power plants) provide service to which hospitals and other health facilities, meaning that the operators of a given facility did not know whether the shutdown of a particular water treatment or power plant would affect them.
___________________
9 See https://www.bakerobrien.com/bakerobrien3/assets/File/BakerObrien_com-AftertheStorm–Part1.pdf.
10 See https://law.utexas.edu/news/2018/09/14/the-cost-of-emergency-evacuation/.
11 For example, https://patch.com/texas/downtownaustin/hurricane-harvey-social-driven-panic-leads-mad-rush-gasoline-texas.
Supply chains in the South Texas region proved largely flexible and resilient during Hurricane Harvey, but the event illustrated that even the most prepared organizations and systems will have great difficulties functioning when flooding is too severe and when critical infrastructure (e.g., municipal water supplies) is damaged. This suggests that for this region, priorities for building resilience are investments to advance more sustainable development patterns that minimize flooding problems (e.g., to elevate critical roadways and to minimize impervious surfaces) and preparedness efforts to mitigate vulnerabilities in infrastructure that can affect multiple supply chain nodes.
Florida / Hurricane Irma
With a long history of hurricane landfalls, Florida has well-organized systems for disaster preparedness and response. This includes a strong Emergency Operations Center with extensive networks of relationships among emergency management officials at state, county, and local levels together with representatives of industry groups responsible for maintaining the flow of critical goods and services (e.g., the Food Marketing Institute, the Florida Petroleum Council, the American Fuel and Petrochemical Manufacturers), integrated via the state’s Business Emergency Operations Center. This foundation helped prevent many adverse outcomes that could have otherwise occurred during Hurricane Irma. Yet Irma illustrated some important limitations and vulnerabilities of current systems, for instance, in terms of:
- meeting fuel demand in the face of a massive evacuation that caused demand spikes across the state;
- maintaining a sufficient inflow of supplies despite serious transportation bottlenecks caused by fuel limitations, traffic backups, and lengthy deadheading12 return trips; and
- ensuring adequate coordination in the movement of trucks and supplies across state lines, in the face of information disruptions and communication problems.
Compared to the large, highly populated counties such as Miami-Dade and Broward, less populated counties such as Collier and Monroe (which includes the Florida Keys) have few emergency management staff members and much less private sector engagement. Representatives from these areas (at the committee’s meeting in Florida) noted their heavy dependence on state resources for disaster response and their struggles with onerous FEMA procurement regulations (including limitations on purchasing supplies locally), as well as long wait times for reimbursement of expenditures.
___________________
12 The term “deadheading” refers to trips made by truckers pulling an empty trailer with no cargo, thus generating no revenue.
Power and Communications
Power outages were widespread across Florida during Hurricane Irma. At its peak, approximately 60 percent of Florida customers were without power.13 Twelve counties had 90 percent or more of electricity customers without power. However, power was restored to most customers relatively quickly. Worse problems were avoided largely thanks to preparedness efforts that had been implemented over the preceding decade, in which Florida Power & Light and other investor-owned utilities in the state made significant investments to upgrade power system infrastructure and deploy smart grid technologies that provided timelier, more accurate information about outages.14 Florida officials also noted that the state designates electric utilities as first responders and coordinates with the investor-owned utilities prior to a major storm to pre-stage fuel across the state, which facilitates the restoration of power.
Food and Water Supplies
Preparedness strategies of large retailers and “big box” stores (e.g., Publix, BJs) allowed for substantial advance stockpiling of food and bottled water, and made possible the use of generators during power outages. Therefore, storm-related shutdowns of most grocery stores lasted for only a few days. Staffing shortages were one of the more significant challenges, as many workers had evacuated or had to care for others. Hurricane Irma caused breaks in water mains, which led to boil-water orders in four counties, driving a surge in demand for bottled water and ice in impacted areas. Grocery chain Publix reported having a large stockpile of bottled water and ice, and yet could not keep up with demand.
Fuel Supplies
Florida has almost no fuel production facilities in state; rather, it receives the bulk of fuel from the Gulf Coast region and foreign imports. When Irma approached, there was temporary closure of most major Florida ports (Miami, Key West, St. Petersburg, Port Everglades, Jacksonville, and Pensacola), the Kinder-Morgan petroleum pipeline, and major petroleum marine terminals. However, such closures were short-lived and thus did not themselves cause any major supply problems. During disasters, the state of Florida sets up fuel-staging depots for first responders; public and private utilities are allowed access to the fuel depots to aid in quicker response and restoration of power.
An array of fuel problems did arise, however, stemming initially from the evacuation of more than 6 million people and the resulting surge in fuel demand, which caused bottlenecks at many fuel stations. This surging demand at retail stations was exacerbated by re-supply
___________________
13 See https://www.energy.gov/ceser/downloads/hurricanes-nate-maria-irma-and-harvey-situation-reports.
14 See https://www.eia.gov/todayinenergy/detail.php?id=32992.
bottlenecks resulting in part from long wait times for refueling tanker trucks at petroleum loading racks. Factors such as limited rack space and contractual allocation limitations on fuel withdrawals15 contributed to the bottlenecks and attendant delays at retail fueling stations.
As the storm struck, bottlenecks at retail gas stations were further aggravated by power outages, flooding, and staff shortages, as well as the inability of some smaller stations to obtain banking credit to keep pace with the fuel demand surge. This all forced a prolonged closure of many retail gas stations, including facilities located at critical spots along evacuation routes. There was also a short-term surge in demand for diesel fuel after the storm, related to the use of generators, debris removal, and vehicle equipment used for restoration and recovery efforts.
Medical and Pharmaceutical Supplies
There were few major problems reported in the delivery of medical and pharmaceutical supplies in Florida after Hurricane Irma, in part because many Florida-based medical and pharmaceutical supply companies have robust continuity plans in place. For instance, some companies pre-positioned pallets of critical supplies at area hospitals and had systems to access their warehouse supplies in the absence of power. The Hospital Corporation of America manages a network of more than 200 hospitals and has a sophisticated Enterprise Preparedness and Emergency Operations system that includes real-time situational awareness dashboards and asset trackers; systems to pull staff from across state borders and to provide mass transportation services (including helicopters) to mobilize supplies and staff; and 60 warehouses to stockpile supplies. Some of the supply and distribution challenges that did arise included the following:
- Small nursing homes, hospice, and home care providers often were lacking back-up power,16 and they were particularly vulnerable to supply shortages, as they could not stockpile many supplies and often had only one provider to service them.17
- Onerous procurement regulations prevented local emergency managers from requisitioning supplies from nearby stores and distribution centers.
- In the absence of electricity, pharmacists could not submit electronic forms for releasing controlled substances.
- Coordination challenges related to re-entry procedures arose for medical-industry personnel.
___________________
15 See discussion of issues related to fuel contracts in Box 4.4.
16 See https://www.usnews.com/news/best-states/florida/articles/2018-06-02/agency-most-florida-nursing-homesare-without-backup-power.
17 Florida now requires that nursing homes have back-up generators with at least a 96-hour fuel supply. For more information, see https://ahca.myflorida.com/MCHQ/Emergency_Activities/EPP.shtml.
- There was limited understanding by federal emergency managers of local medical supply producers and distributors that needed to be prioritized for support, leading to misallocation of capacity and supplies.
- Key federal officials in the Department of Health and Human Services had insufficient information about drug manufacturers in the region (e.g., the location, capabilities, and criticality for national supply chains), which impeded strategic decisions about which facilities to prioritize for operational assistance.
Puerto Rico / Hurricanes Irma and Maria
Compared to the other locations examined, Puerto Rico faced some fundamental vulnerabilities that underlay how the 2017 hurricanes affected the island. This included:
- significant limitations in the coordination of emergency preparedness systems, stemming from insufficient communication among federal and local agencies, and lack of trust and partnership between government and the private sector;
- the failure of fragile and aging (and thus vulnerable) electric power and communications infrastructure, leading to a host of cascading impacts (e.g., hindering emergency response efforts, disrupting the ability to process electronic payments in stores);
- limited understanding by government officials of the island’s critical supply chains and a lack of capacity for assessing the status of those systems in the aftermath of the storm, leading to many inaccurate assumptions about what response efforts were most needed; and
- multiple hurricanes in quick succession diminishing FEMA’s response capacity by the time Maria struck and also exacerbating bottlenecks across many supply chains.
Many of the post-hurricane supply chain challenges that arose in Puerto Rico centered around the Port of San Juan. Cargo was able to make it to the port, but due to the sustained power outage, goods coming in could not be processed effectively, and due to blocked roads and shortages of trucks and drivers, many goods could not be removed from the port area. The port thus quickly became overwhelmed as large loads of relief supplies poured in. Related problems stemmed from the fact that many arriving relief shipments had little or no descriptive labelling, which further slowed processing steps. Disaster relief shipments also displaced shipments of other goods that were crucial for restoration of the island’s normal supply chains (see, for example, the bottled water discussion below).
Power and Communications
The power infrastructure in Puerto Rico was fragile even during normal times, with power plants located in the south of the island and the main consumption in the north. Power lines
(about 75 percent of them aerial) had to cross over the mountains, with a significant loss of energy during transmission. The grid had no redundancy; therefore, even with only limited damage, significant portions of the grid could go down. Hurricane Irma led to power outages for more than 55 percent of utility customers, and Hurricane Maria led to an almost complete failure of the electricity transmission system, with 100 percent of customers losing power. Restoring power was a complex, controversial process that took many months to complete.
Food and Water Supplies
In the aftermath of Hurricane Maria many communities in Puerto Rico faced major food shortages and thus initially were heavily dependent on relief supplies.18 At the same time, however, many grocery stores across the island proved quite resilient and were able to re-open within a few days after the storm. Even well after resumption of normal food distribution and re-opening of grocery stores, FEMA continued to receive and fill requests for food aid (in the form of “meals ready to eat”), and as this meal distribution continued, it raised concerns that people were stockpiling excess “meals ready to eat” and local commerce was being undermined. Grocery stores were also adversely impacted when truckers were lured away from their normal jobs to run relief supplies or wait at the port. Perhaps of greatest impact, however, was the fact that sustained power and communication outages meant no processing of electronic payments (including the electronic benefits transfer system that many people depend on to buy food), along with constraints in obtaining cash from automated teller machines. Therefore, many people had no means of buying food even when shelves were stocked.
Potable drinking water services on the island were disrupted for an extended period of time (more than three months), driving an ongoing need for bottled water. FEMA stockpiled huge quantities of bottled water at the Port of San Juan, but much of this did not get distributed.19 Meanwhile, Puerto Rico’s local water-bottling facilities remained idle for an extended time after the storm because the containers holding the raw materials needed for the bottling process (resin for bottle caps) were not considered a high priority and were not released from the port, while relief shipments of bottled water continued to flow in—thus prolonging the island’s dependence on imported relief supplies.
Fuel Supplies
All of Puerto Rico’s fuel is imported to the islands from the Atlantic and Caribbean basins. During Hurricane Maria, petroleum terminals were shut down and retail fuel stations were temporarily closed, but there were no reports of serious shortages of gasoline supply on the island. The main problems were related to fuel distribution, including the power outages that prohibited the processing of some fuel shipments, a lack of truck drivers, and the need
___________________
18 See https://www.theguardian.com/world/2017/oct/11/puerto-rico-food-shortage-hurricane-maria.
19 See https://www.cnn.com/2018/09/12/us/puerto-rico-bottled-water-dump-weir/index.html.
for security escorts for the tankers that were able to deliver. Gas stations’ inability to use electronic commerce (i.e., credit and debit cards) posed further problems and security concerns, as many had to purchase fuel supplies with large sums of cash, and customers could only pay in cash as well.
Because Puerto Rico’s residents were without power for sustained periods of time, there was a heavy reliance on generators. While a significant percentage of households and facilities across the island did have generators, many had not been maintained, and stocks of generator fuel were scarce, which led to a cascade of problems for many critical facilities (e.g., hospitals, manufacturing plants, and grocery stores). There was little clarity regarding how FEMA and other officials made decisions regarding what public facilities received generator and diesel fuel aid, and regarding how to provide such support for private sector entities with important roles in providing critical resources.
As one positive example of preparedness—the island’s propane and liquified petroleum gas supply and distribution proved resilient, largely because the island’s largest supplier (Empire Gas) was well prepared to sustain the operations of its delivery terminal, storage facilities, truck fleets, and networks of drivers.
Medical and Pharmaceutical Supplies
Puerto Rico is a hub of manufacturing for a range of pharmaceuticals and medical goods, with at least 40 manufacturing facilities, 13 of which produce drugs that have no other supplier. For instance, Baxter operates three large manufacturing facilities in Puerto Rico that produce sterile saline solutions (i.e., intravenous fluids) for most of the United States. After Hurricane Maria, all of the Baxter facilities lost power and reduced production to what could be achieved with generators. In October 2017, the Food and Drug Administration urged FEMA, Puerto Rico’s governor, and the Puerto Rico Electric Power Authority to prioritize power restoration to these facilities; however, the national importance (criticality) of these facilities was not completely understood, and it took until early January 2018 to return them to full operation. This disruption caused supply chain effects that cascaded to the mainland United States and around the world. While many of Puerto Rico’s individual pharmaceutical industry plants had substantial preparedness and continuity plans, these critical nodes in pharmaceutical supply chains were still vulnerable to the sustained, island-wide power loss. There was also a wide variety of challenges that arose in providing medical goods and services to residents on the island in the days and weeks after the storms hit. Some examples noted in the committee’s meetings were:
- confusion about who was responsible for meeting needs or providing assistance (including power restoration and generator fuel assistance) for private hospitals, medical facilities, and dialysis centers;
- problems with supply and distribution of medical oxygen, which could not be produced locally due to lack of power and which faced many barriers in being
- shipped to the island (an example of a critical supply chain with predictable vulnerable nodes); and
- confusion over local curfews, which created an artificial bottleneck that impeded the ability to distribute medical supplies.
U.S. Virgin Islands / Hurricanes Irma and Maria
The U.S. Virgin Islands were tremendously affected by Hurricanes Irma and Maria (USVI HRRTF, 2018).20 Some of their challenges were similar to those in Puerto Rico, for instance, in terms of being almost entirely dependent on ship and barge imports for food, fuel, medicine, and other critical goods; limited emergency management resources; and aging, fragile infrastructure. The U.S. Virgin Islands also faced some unique challenges, such as the complexity meeting the needs of affected populations on three different islands; difficulties in finding means to dispose of post-storm debris; and very limited options for housing for relief workers along with displaced residents (USVI HRRTF, 2018).
Despite these challenges, the conveyance of some critical relief supplies by FEMA and others operated relatively efficiently, at least relative to the problems that arose in Puerto Rico. This is partly because the scale of the population being served was much smaller, with fewer communities isolated by onerous terrain. The main port for the U.S. Virgin Islands, on the island of St. Thomas, is relatively small, with little space or equipment (e.g., forklifts, trucks) for receiving, storing, and processing relief goods. On St. John and St. Croix such constraints were even more acute. This led to some competition for resources between relief supply chains and regular commercial supply chains at certain points in the response process. There were also problems with relief supplies arriving with no clear inventory or labeling, and shortages of workers, given that essentially everyone on the island was a storm victim.
One concern noted by meeting participants was how efforts to proceed in repairing and rebuilding damaged structures were hampered when relief supplies such as tarps and water bottles were given priority for shipment over cement and other construction materials. It took many months for the main hardware store on St. Thomas (Home Depot) to re-open and restock, although, fortunately, two other smaller hardware stores on the island (MSI, SeaChest) were well prepared with advance stocking of key inventory and facilities that withstood major storm damage.
Despite the tremendous destruction of the two storms, there were many signs of resilience among the local population. Most island businesses re-opened quickly; most island roads were cleared with help from residents; and many homes and facilities had working generators, fuel, and other emergency supplies, as well as cisterns to collect
___________________
20 Many of the impact details in this section came from the report of the U.S. Virgin Islands Hurricane Recovery and Resilience Task Force (USVI HRRTF, 2018).
water (discussed below). On St. Croix, a coalition of nonprofit organizations that had recently formed to advance community preparedness provided crucial aid for many people immediately after the storm. Local community centers were a lifeline in supporting residents, especially in isolated areas. Improvised partnerships with a local AM radio station provided crucial post-storm communication aid for people trying to find missing persons or share important safety information.
Power and Communications
The two hurricanes caused almost complete disruption to the U.S. Virgin Islands’ power systems. During Hurricane Irma, the power grid was badly damaged and went down on the islands of St. Thomas and St. John. And St. Croix lost all power during Hurricane Maria. In many places, the outages lasted for more than four months. There were challenges obtaining raw materials and parts from the mainland for repairing the grid, and more than 800 linemen were brought in from off-island to aid the restoration efforts. As happened elsewhere, these power outages had many cascading impacts on the ability to resume normal commerce and other operations across the islands. Some wind and solar power generation on the islands survived, illustrating how distributed energy systems can reduce vulnerability.
Many places were equipped with back-up generators, but many of these eventually failed because they were not designed to run continuously for months; obtaining generator fuel over this extended time period was also a challenge. Critical public sector facilities such as airports and hospitals received generator assistance (from the Army Corps of Engineers, FEMA, the Virgin Islands Territorial Emergency Management Agency), but privately owned critical facilities (such as radio stations and private cell phone towers) were not eligible to receive generators and thus could not get back online.
The island’s communications infrastructure (cell service, broadcast radio, Internet) was severely disabled. Damage to cell towers meant loss of around 80 percent of cell service on St. Thomas and St. Croix and 100 percent on St. John. Full restoration required bringing in off-island personnel and took several months.
Food and Water Supplies
Nearly all facilities for the production and delivery of potable water across the U.S. Virgin Islands were affected by direct damage and/or the power outages, and full restoration of the system took roughly a month. Fortunately, almost all households in the U.S. Virgin Islands are equipped with cisterns to collect rainwater for household water use. This adaptation, driven largely by the limited groundwater options and relatively recent development of municipal water systems, greatly alleviated water stresses in the aftermath of the storms. At the same time, however, most residents use bottled water for drinking, so there was continued high demand for bottled water following the storms.
Following both storms, grocery stores were closed, but only for a few days. There were no wide-scale reports of food shortages, but the power and communication outages meant that residents faced real challenges paying for store purchases, given the lack of access to cash withdrawal or to electronic commerce (i.e., Electronic Benefit Transfer (EBT) and debit/credit cards). The limited curfew hours imposed on residents, coupled with damaged and congested roads, made it difficult for many residents to simply find time to gather needed daily supplies. The storms also raised new concerns about the U.S. Virgin Islands’ total dependence on imports for food, which lowers costs (relative to local food production) but increases supply chain vulnerabilities.
Fuel Supplies
During the emergency response and recovery period, gas stations established a rule that each individual could purchase only as much gasoline they could carry, which helped prevent hoarding and alleviate bottlenecks that would have caused fuel shortages. Some fuel distribution problems arose, in part because fuel racks were not powered for a period of time and because (unlike places such as Florida),21 the U.S. Virgin Islands has no requirements that retail gas stations have generators or are generator-ready.
Medical and Pharmaceutical Supplies
There was major damage to the U.S. Virgin Islands’ hospitals and other critical health facilities, and power outages meant prolonged closure of many pharmacies lacking generators. The islands’ longstanding problems with insufficient numbers of medical personnel were exacerbated when many left the islands after the hurricanes due to destroyed homes, family safety needs, etc. Another major challenge was that the great majority of the U.S. Virgin Islands’ medical supply distributors are in Puerto Rico, and because those companies were themselves dealing with hurricane impacts, they could not maintain normal shipments. Some medical supplies were also delayed in Puerto Rico because the boxes were not marked as “critical” until FEMA stepped in to help get them labeled as priority (an example of an information failure that created an artificial bottleneck in a critical supply chain).
As a result of these and other constraints, medical and pharmaceutical services across the U.S. Virgin Islands experienced many difficulties in the aftermath of the storms. The U.S. Virgin Islands Department of Human Services faced many coordination challenges such as the following:
- problems gathering needed data from the Red Cross and other territorial public agencies, and operational silos that limited coordination among federal agencies (including FEMA, see FEMA (2018a)), local government agencies, companies, and nongovernmental organizations;
___________________
21 It is the law in Florida that retail gas stations within one-mile of an evacuation route have a generator hook-up.
- little pre-positioning of essential medication stocks for the islands22 and lack of coordination in distributing available drugs and determining who was permitted to write prescriptions;
- problems of donated pharmaceuticals having no documented source, which local pharmacists did not feel comfortable dispensing; and
- mismatches between the medical supplies needed and those provided by federal aid programs (e.g., regarding specific types of insulin needed versus received).
Eventually the arrival of mutual aid support medical teams (i.e., human and material resource assistance coming from across jurisdictional boundaries) alleviated some of these problems.
Common Features and Lessons Learned from the 2017 Experiences
Even with the diverse contexts and experiences of the different storm-affected areas, some of the dynamics that unfolded—both pre- and post-hurricane—were common across each of the places considered, pointing to important lessons to consider moving forward.
- Post-hurricane bottlenecks and disruptions arose more frequently at the distribution level than at the production level. This is in part simply because distribution occurs within the affected region, while (in many cases) much of the production occurs elsewhere. But in addition, this is because distribution is often carried out by businesses and organizations with less preparedness capacity than large companies have (discussed below).
- Some of the most common factors underlying these “last mile” distribution challenges were shortages of trucks and drivers for goods delivery, other personnel shortages that occurred when workers themselves became storm victims, and damage to critical infrastructure that impeded the distribution and selling of goods. Another common source of bottlenecks at the distribution level was unsolicited donations sent to affected areas, which drew critical resources away from more strategically targeted needs (see Box 3.2).
- Many large companies had invested in continuity planning, partnerships with government officials, employee assistance programs, and resources to harden and back up critical systems. Comparatively, small businesses (e.g., locally owned groceries and convenience stores, home health care providers) generally had much less capacity to prepare for and avoid supply chain disruptions.
___________________
22 Most pharmacies in the U.S. Virgin Islands are family-owned rather than national chains—and this limits their ability to stockpile certain critical drugs because of restrictions in returning unsold merchandise.
- Vulnerable infrastructure, especially for power and communications, is a predictable vulnerability, and the speed with which supply chains can recover often heavily depends on the resilience of this infrastructure. In places where there was investment in reducing vulnerabilities (especially for hardening electric power systems), benefits are seen in terms of minimizing storm disruptions and thus bolstering the speed with which local economies could resume normal operations (see Box 3.3). Emergency managers’ ability to understand post-storm supply chain bottlenecks was constrained by limited pre-storm assessment of vulnerable and critical supply chain nodes, together with information disruptions resulting from power and communication loss. This in
- turn limited their ability to make optimal decisions about prioritizing the allocation of relief supplies and to know when to stop the push of relief supplies into an area.
- There was often confusion regarding the priorities and practices of FEMA and other emergency management officials for providing generators and fuel to parties in need of assistance—in particular priorities and practices around supporting private entities that are critical nodes in local or national supply chains.
These concepts are discussed further in the following chapter, and they underlie the committee’s recommended actions and resilience strategies.


