
5
Geological Hazards: Earthquakes and Volcanoes
The Decadal Survey identified several Earth surface and interior questions that require maintenance or enhancement of the geodetic infrastructure. The most stringent geodetic demands are associated with geological hazards. Earthquakes and volcanic eruptions provide a window on processes operating within the Earth. They are also capable of great destruction, which has led to substantial efforts to forecast their occurrence and mitigate their impacts (e.g., reinforcing buildings to withstand expected shaking). This chapter describes the geodetic infrastructure needed to understand the causes and impacts of geological hazards, primarily earthquakes and volcanic eruptions, but also landslides and tsunamis. The guiding Decadal Survey (NASEM, 2018) science questions for this chapter are:
S-1. How can large-scale geological hazards be accurately forecast in a socially relevant time frame?
S-2. How do geological disasters directly impact the Earth system and society following an event?
The geodetic infrastructure needs associated with these questions are summarized in the Geological Hazards Science and Applications Traceability Matrix (see Appendix A, Table A.3).
SCIENCE OVERVIEW
Over the past quarter century, earthquakes, tsunamis, and, to a lesser extent, volcanic eruptions and landslides have caused heavy economic losses and deaths, and they will continue to be major threats to lives and economies in the future. For example, the 2004 magnitude (M) 9.2 megathrust earthquake in Sumatra generated a tsunami that propagated across the Indian Ocean Basin, killing more than 230,000 people in coastal areas.1 The 2011 M9.0 Tohoku earthquake in Japan was the most costly natural disaster in history at up to $235 billion (World Bank, 2011). In addition to the massive destruction of the Sendai region, the complete shutdown of nuclear energy generation in Japan for more than 1 year and permanent closures of many nuclear plants in other countries raised questions about the safety of coastal nuclear power plants (NRC, 2014). The 2010 eruption of the Eyjafjallajökull volcano in Iceland halted air traffic in northern Europe, causing a significant disruption to the European population and economy (Gill, 2010). Similar threats to the U.S. population and economy are associated with the Cascadia subduction zone (last major event in 1700; see Figure 5.1), the San Andreas Fault System (last major earthquakes in 1856 and 1906), and the volcanoes in the Aleutians and Pacific Northwest (last major eruption at Mount St. Helens in 1980).
Although these events cannot be prevented, steps can be taken to lessen the adverse impacts on life and property. The first step is to monitor the earthquake, volcano, or landslide areas before the event. For example, in the case of an earthquake, the surface deformation rate surrounding the fault can be inverted for the seismic moment accumulation rate (Maurer et al., 2018). Then, knowing the time since the last major event, one can
___________________
1 See https://web.archive.org/web/20130507101448 and http://earthquake.usgs.gov/earthquakes/world/most_destructive.php.
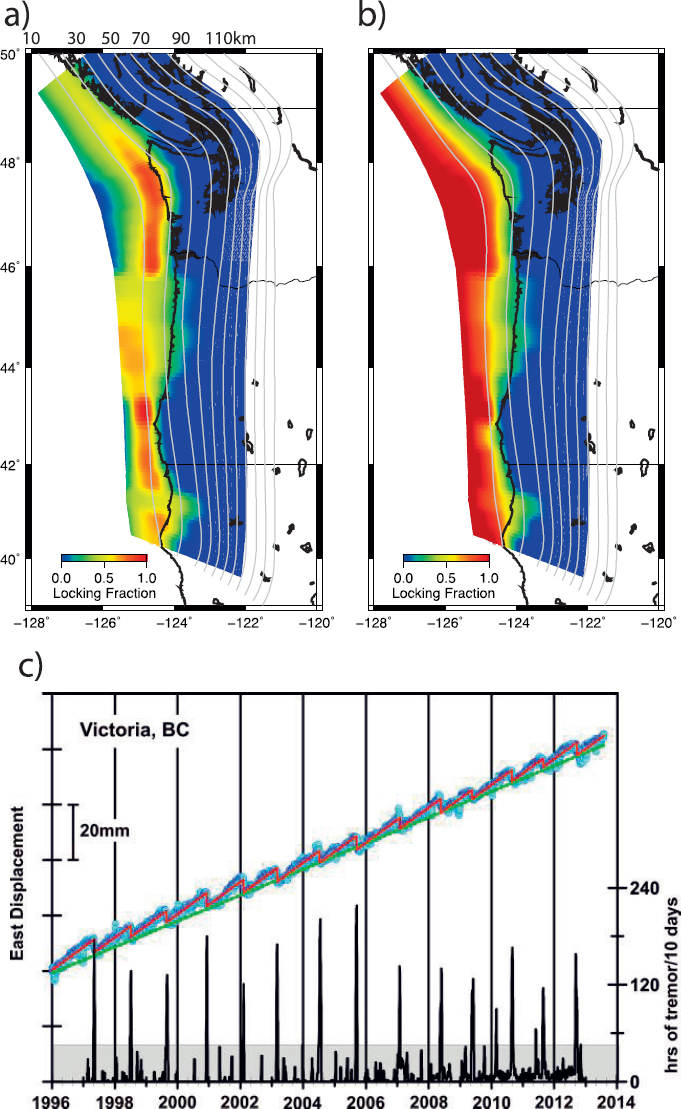
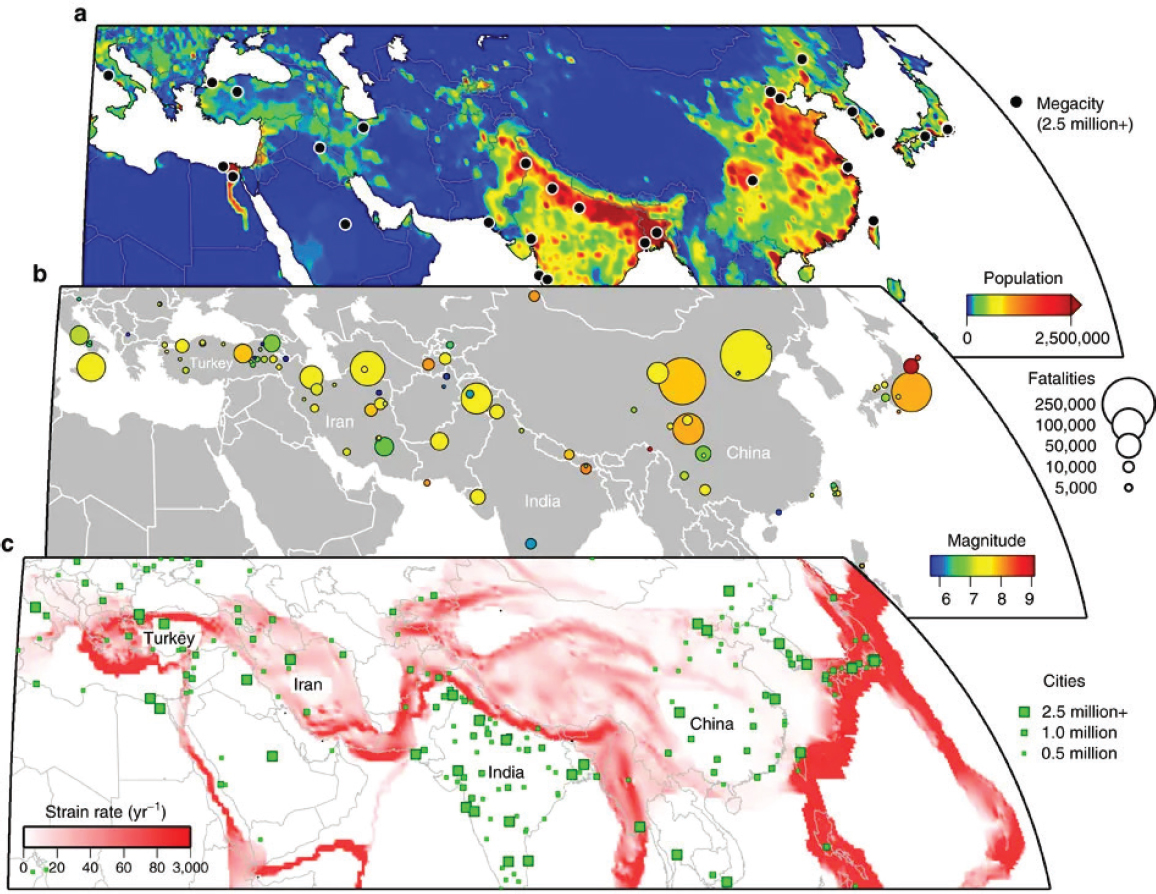
place bounds on the size of the next major rupture. Most destructive earthquakes occur in regions where the strain rate exceeds ~50 nanostrain per year (Elliott et al., 2016; see Figure 5.2). For strike-slip faults, which typically have a locking depth of about 12 km, this strain rate corresponds to an average velocity accuracy of 0.5 mm/yr over the 10 km averaging distance. For volcanic eruptions and landslides, a period of accelerated activity often occurs prior to the event, and so the event timing can be estimated with an accuracy useful for effective evacuation measures (Sigmundsson et al., 2010).
Understanding the seismic moment accumulation rate in the shallow parts of subduction zones is particularly challenging because onshore geodetic measurement techniques such as GNSS, InSAR, tide gauges, and strain gauges are too remote to resolve the degree of shallow coupling (see Figure 5.1). The tools of seafloor geodesy (i.e., GNSS acoustics,2 bottom pressure gauges, seafloor strain gauges, and repeated sonar surveys) can directly measure displacements accumulating offshore in subduction zones. Consequently, their
___________________
2 GNSS acoustics is a method to precisely measure the horizontal displacement of the seafloor. The technique uses a combination of GNSS for accurately positioning a platform on the sea surface (e.g., ship or wave glider) and acoustics for ranging to transponders on the seafloor.
use can greatly improve the spatial and temporal resolution of megathrust coupling and earthquake/slow-slip source characterization with signals ranging from episodic slip, interseismic strain, coseismic motion, and postseismic afterslip and relaxation (Burgmann and Chadwell, 2014). GNSS acoustics and repeated sonar surveys rely on cm-level accuracy GNSS positioning of moving platforms (ship, wave glider, or buoy), which, in turn, depends on the GNSS infrastructure to provide a reference land station and high accuracy GNSS orbit information.
The second step is to map the displacement and surface destruction of the event. In the case of an earthquake, for example, a rapidly determined rupture model can be used to estimate the size of the tsunami (if any) as well as to forecast the size and location of large, potentially damaging aftershocks (Bock and Melgar, 2016). Similarly, the duration of a volcanic event can be forecast through careful geodetic monitoring and modeling (Segall, 2013).
The third step is to use a suite of ground- and space-based measurements to map the areas of greatest destruction to optimally deploy emergency services and other relief efforts.
REQUIRED MEASUREMENTS AND LINKS TO THE TERRESTRIAL REFERENCE FRAME
Because earthquake and volcanic cycles occur on hundred- to thousand-year time scales, global and long-duration observations are needed to capture enough partial cycles to understand and model the underlying physical processes and so advance forecasting. The required measurements include surface deformation, time-variable gravity, surface topography, sea surface tsunami waves, and surface cover and atmospheric changes.
Surface Deformation
Ground-based Global Navigation Satellite System (GNSS) measurements, defined in the International Terrestrial Reference Frame (ITRF; Altamimi et al., 2016), are used to measure the seismic moment rate that is accumulating in the elastic crust surrounding the land portions of subduction zones (e.g., Cascadia; see Figure 5.1) and continental transform faults (e.g., San Andreas). GNSS stations deployed with other ground-based instrumentation also provide important information to forecast the onset and duration of hazardous volcanic eruptions (see Box 5.1). The temporal sampling for an individual GNSS site varies from 1 second to daily, depending on the application. Repeat-pass interferometry has matured as a reliable observational system that provides 6-day snapshots of scalar surface deformation over tectonically active land areas. Requirements for spatial resolution and precision vary with the application. Plate motions and vertical deformations related to hydrologic loading and postglacial rebound need to be measured to an accuracy of better than 1 mm/yr over spatial scales of several thousand km. The spacing of the continuous GNSS stations is as small as 10 km in western North America (Wei et al., 2010) and Japan, but is much greater (50–100 km) along other active continental plate boundaries. Consequently, Interferometric Synthetic Aperture Radar (InSAR) deformation measurements are needed to fill the gaps. Currently the orbits of the InSAR satellites are better than 50 mm in all three components. However, with the new TOPS-mode data from the Sentinel-1 satellites, an emerging requirement is to connect interferograms over the 20-year lifetime of the satellite series to better than 20 mm radially and 60 mm along-track accuracy.3 This accuracy can be achieved only if the global GNSS tracking network has a similar accuracy over the 20-year period through an accurate link to the terrestrial reference frame (TRF).
Time-Variable Gravity
Time-variable gravity measurements can reveal vertical deformation and mass change associated with seismic events having rupture lengths greater than the spatial resolution of Gravity Recovery Climate Experiment-type satellites (~200 km). They also provide the only means for measuring co- and postseismic deformation of offshore major subduction zones globally (Han et al., 2014). The postseismic gravity changes from the largest earthquakes are about 1 microgal at a spatial resolution of 500 km in 2 years after the rupture (Han et al., 2014, 2016). Time-variable gravity can also be measured on the surface of the Earth, and the approach is becoming common because of
___________________
3 Andy Hooper, University of Leeds, personal communication, 2019.
low-cost microelectromechanical systems (Middlemiss et al., 2016).
Global Maps of Bare-Earth Topography
Global maps of bare-earth topography are needed to provide the pre-event (e.g., earthquake, volcanic eruption, and landslide) reference surface as well as to assess areas of potential landslides and volcanic lahars. Bistatic radar interferometry (e.g., Shuttle Radar Topography Mission and TerraSAR-Tandem-X) has provided global topographic reference data at 10–30 m resolution. These methods require TRF accuracies of 0.1 m to achieve accuracy of 1 m vertical topography. The interferometric baselines for the bistatic radar measurements have much more stringent requirements (1 mm).
Tsunami Waves
Real-time measurement of tsunami waves and communication to emergency response officials are vital for warning coastal populations. Direct wave height measurements can be made using ocean bottom pressure sensors and GNSS receivers mounted on buoys or ships of opportunity (Foster et al., 2012; see Figure 5.4). The vertical precision of these measurements should be better than 0.1 m at 1-minute sampling. Because the
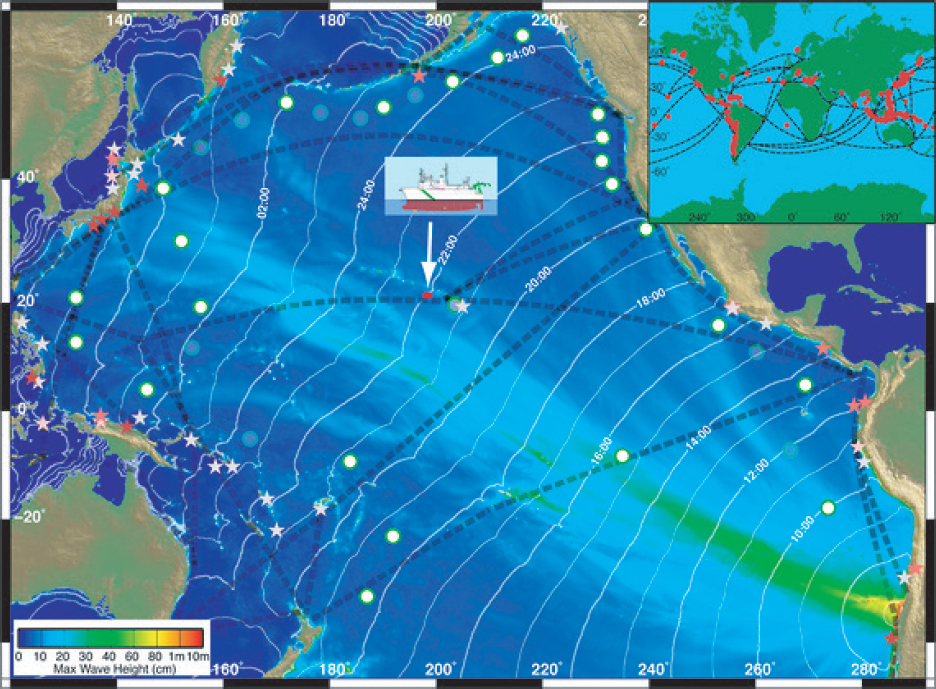
receivers are usually thousands of kilometers from a land-based reference station, the measurement accuracy relies on the International GNSS Service (IGS) to do processing by precise point positioning.
Big Data, Software, and Workforce
Addressing the geological hazards questions framing this chapter will involve the analysis of larger geodetic data sets (InSAR, GNSS, and dense GNSS arrays), higher geodetic accuracy, and lower latency (real-time) delivery than are available today. For example, the National Aeronautics and Space Administration-Indian Space Research Organisation Synthetic Aperture Radar (NISAR) mission will provide systematic global observations and more imagery per day than is available from all of the previous satellite missions (Rosen et al., 2016). Some networks along plate boundaries are now telemetering high-rate GNSS data in real-time for earthquake and tsunami early warning, but lack of computing and telemetry resources has limited this application in many regions of the world (e.g., Asia). Accurate processing of these new data streams will require benchmarking of software and processing methods from two or more groups. Of course, these improvements will rely on a well-trained geodetic workforce working in close collaboration with the high performance computing community (Davis et al., 2016).
SUMMARY
Observing, mitigating, and forecasting the hazards associated with major earthquakes and volcanic eruptions require very accurate geodetic measurement of surface deformation and time-variable gravity. The new generation of InSAR satellites employs a new type of image alignment that requires a geolocation accuracy of
better than 70 mm, which translates to an along-track orbit accuracy of better than 70 mm (Xu et al., 2017). This accuracy must be maintained over the 20-year lifetime of the Sentinel-1 satellite series. Strain-rate mapping over continental scales requires vector GNSS deformation time series having velocities better than 0.5 mm/yr. Monitoring postseismic deformation from megathrust earthquakes requires gravity change accuracy of better than 1 microgal at a 1-month sampling rate or better. Finally, monitoring the propagation of tsunami waves across the oceans requires vertical GNSS accuracy of better than 0.1 m at 1-minute sampling in remote locations. All of these applications need steady improvements in the accuracy of the TRF as well as extremely accurate satellite orbits. The following summarizes needs for maintaining or enhancing the geodetic infrastructure, and related improvements to enhance scientific returns.
Maintenance of the Geodetic Infrastructure
- Maintain the current stability of the TRF for monitoring surface deformation at high accuracy (0.5 mm/yr) globally.
- Track the InSAR satellites at an accuracy of 20 mm radially and 60 mm along-track. The onboard GNSS precise orbit determination measurements should be of IGS quality (i.e., mm-level phases and dm-level pseudoranges at two or more frequencies for all four global GNSSs and with accurately calibrated antennas).
- Similar orbital requirements are needed for global lidar surveys (Abshire et al., 2005) of land motion as well as for spacecraft pointing accuracy of better than 2 microradians.
- Maintain the geodetic infrastructure to support gravity change measurements of 1 microgal accuracy at spatial resolution of 300 km or better, and sampling better than monthly to monitor large subduction zone earthquakes offshore.
- Maintain GNSS station density in areas of high strain rate, such as plate boundaries. GNSS Station spacing of 20 km or better is needed to bring the InSAR measurements into an absolute frame at 0.5 mm/yr accuracy at better than 10 km spatial resolution.
- Maintain free and open access to all data used in the formulation of the TRF.
Enhancements to the Geodetic Infrastructure
- Improve the reference frame formulation to quickly accommodate global-scale motions associated with the very large subduction zone earthquakes that affect GNSS stations over much of the Earth’s surface (e.g., 2004 Sumatra). The specific requirements are 1–10 mm accuracy maintained over 10 years.
- Maintain and enhance a globally distributed set of GNSS sites over a long period to measure large-scale, plate-boundary deformation and plate motions at an accuracy of 0.5 mm/yr. These sites are also needed to correct InSAR displacement time series.
- Develop a GNSS-based, time-dependent TRF, fully aligned to the ITRF, and with frequent updates to accommodate sudden changes in the locations of the fundamental stations.
- Ensure there are at least two open software development efforts for each geodetic method, including GNSS processing, InSAR processing, and lidar processing.
- Transition processing of all geodetic data from human-intensive analysis to automated analysis.
- Develop a geodetic workforce versed in the fundamentals of geodetic methods as well as in advanced automated processing approaches.
- Encourage free and open access to all GNSS and InSAR data.
Related Improvements to the Geodetic Infrastructure to Enhance Scientific Returns
- Improve GNSS station density in selected areas to address relevant science and applications. This may include GNSS buoys and wave gliders in ocean areas.
- The requirement for bare-earth topography at 0.1 m vertical accuracy over selected tectonic areas drives the need for local GNSS ground station positioning of better than 50 mm for differential GNSS aircraft.
REFERENCES
Abshire, J.B., X. Sun, H. Riris, J.M. Sirota, J.F. McGarry, S. Palm, D. Yi, and P. Liiva. 2005. Geoscience laser altimeter system (GLAS) on the ICESat mission: On-orbit measurement performance. Geophysical Research Letters 32(21):L21S02.
Altamimi, Z., P. Rebischung, L. Métivier, and X. Collilieux. 2016. ITRF2014: A new release of the International Terrestrial Reference Frame modeling nonlinear station motions. Journal of Geophysical Research: Solid Earth 121(8):6109-6131.
Bock, Y., and D. Melgar. 2016. Physical applications of GPS geodesy: A review. Reports on Progress in Physics 79(10):106801.
Bürgmann, R., and D. Chadwell. 2014. Seafloor geodesy. Annual Review of Earth and Planetary Sciences 42:509-534.
Davis, J.L., L.H. Kellogg, J.R. Arrowsmith, B.A. Buffett, C.G. Constable, A. Donnellan, E.R. Ivins, G.S. Mattioli, S.E. Owen, M.E. Pritchard, M.E. Purucker, D.T. Sandwell, and J. Sauber. 2016. Challenges and Opportunities for Research in ESI (CORE). Report from the NASA Earth Surface and Interior (ESI) Focus Area Workshop, November 2-3, 2015, Arlington, VA.
Dragert, H., K. Wang, and G. Rogers. 2004. Geodetic and seismic signatures of episodic tremor and slip in the northern Cascadia subduction zone. Earth, Planets and Space 56(12): 1143-1150.
Elliott, J.R., R.J. Walters, and T.J. Wright. 2016. The role of space-based observation in understanding and responding to active tectonics and earthquakes. Nature Communications 7:13844.
Foster, J.H., B.A. Brooks, D. Wang, G.S. Carter, and M.A. Merrifield. 2012. Improving tsunami warning using commercial ships. Geophysical Research Letters 39(9):L09603.
Gill, V. 2010. Iceland volcano: Why a cloud of ash has grounded flights. BBC News. Archived from the original on June 1, 2013. Retrieved from http://news.bbc.co.uk/2/hi/science/nature/8621992.stm on December 1, 2019.
Han, S.C., J. Sauber, and F. Pollitz. 2014. Broadscale postseismic gravity change following the 2011 Tohoku-Oki earthquake and implication for deformation by viscoelastic relaxation and afterslip. Geophysical Research Letters 41(16):5797-5805.
Han, S.-C., J. Sauber, and F. Pollitz. 2016. Postseismic gravity change after the 2006–2007 great earthquake doublet and constraints on the asthenosphere structure in the central Kuril Islands. Geophysical Research Letters 43:3169-3177.
Maurer, J., K. Johnson, and P. Segall. 2018. Bounding the moment deficit rate on crustal faults using geodetic data: Application to Southern California. Journal of Geophysical Research: Solid Earth 122(8):6811-6835.
Middlemiss, R.P., A. Samarelli, D.J. Paul, J. Hough, S. Rowan, and G.D. Hammond. 2016. Measurement of the Earth tides with a MEMS gravimeter. Nature 531:614-617.
NASEM (National Academies of Sciences, Engineering, and Medicine). 2018. Thriving on Our Changing Planet: A Decadal Strategy for Earth Observation from Space. Washington, DC: The National Academies Press.
Neal, C.A., S.R. Brantley, L. Antolik, J.L. Babb, M. Burgess, K. Calles, M. Cappos, J.C. Chang, S. Conway, L. Desmither, P. Do-tray, T. Elias, P. Fukunaga, S. Fuke, I.A. Johanson, K. Kamibayashi, J. Kauahikaua, R.L. Lee, S. Pekalib, A. Miklius, W. Million, C.J. Moniz, P.A. Nadeau, P. Okubo, C. Parcheta, M.R. Patrick, B. Shiro, D.A. Swanson, W. Tollett, F. Trusdell, E.F. Younger, M.H. Zoeller, E.K. Montgomery-Brown, K.R. Anderson, M.P. Poland, J.L. Ball, J. Bard, M. Coombs, H.R. Dietterich, C. Kern, W.A. Thelen, P.F. Cervelli, T. Orr, B.F. Houghton, C. Gansecki, R. Hazlett, P. Lundgren, A.K. Diefenbach, A.H. Lerner, G. Waite, P. Kelly, L. Clor, C. Werner, K. Mulliken, G. Fisher, and D. Damby. 2019. The 2018 rift eruption and summit collapse of Kı ¯lauea Volcano. Science 363(6425):367-374.
NRC (National Research Council). 2014. Lessons Learned from the Fukushima Nuclear Accident for Improving Safety of U.S. Nuclear Plants. Washington, DC: The National Academies Press.
Rosen, P., S. Hensley, S. Shaffer, W. Edelstein, Y. Kim, R. Kumar, T. Misra, R. Bhan, R. Satish, and R. Sagi. 2016. An update on the NASA-ISRO dual-frequency DBF SAR (NISAR) mission. In 2016 IEEE International Geoscience and Remote Sensing Symposium (IGARSS). Pp. 2106-2108.
Schmalzle, G.M., R. McCaffrey, and K.C. Creager. 2014. Central Cascadia subduction zone creep. Geochemistry, Geophysics, Geosystems 15(4):1515-1532.
Segall, P. 2013. Volcano deformation and eruption forecasting. Geological Society, London, Special Publications 380(1):85-106.
Sigmundsson, F., S. Hreinsdóttir, A. Hooper, T. Árnadóttir, R. Pedersen, M.J. Roberts, N. Óskarsson, A. Auriac, J. Decriem, P. Einarsson, H. Geirsson, M Hensch, B.G. Ófeigsson, E. Sturkell, H. Sveinbjörnsson, and K.L. Feigl. 2010. Intrusion triggering of the 2010 Eyjafjallajökull explosive eruption. Nature 468(7322):426-430.
Wei, M., D. Sandwell, and B. Smith-Konter. 2010. Optimal combination of InSAR and GPS for measuring interseismic crustal deformation. Advances in Space Research 46(2):236-249.
World Bank. 2011. East Asia and Pacific economic update. Vol. 1. http://siteresources.worldbank.org/INTEAPHALFYEARLYUPDATE/Resources/550192-1300567391916/EAP_Update_March2011_japan.pdf.
Xu, X., D.T. Sandwell, E. Tymofyeyeva, A. González-Ortega, and X. Tong. 2017. Tectonic and anthropogenic deformation at the Cerro Prieto geothermal step-over revealed by Sentinel-1A InSAR. Transactions on Geoscience and Remote Sensing 55(9):5284-5292.


