
Q&A
1
IS THE CLIMATE WARMING?
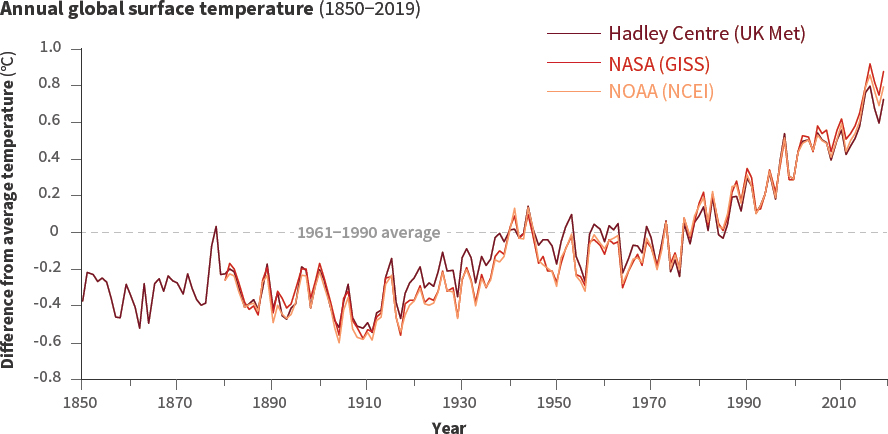
The clearest evidence for surface warming comes from widespread thermometer records that, in some places, extend back to the late 19th century. Today, temperatures are monitored at many thousands of locations, over both the land and ocean surface. Indirect estimates of temperature change from such sources as tree rings and ice cores help to place recent temperature changes in the context of the past. In terms of the average surface temperature of Earth, these indirect estimates show that 1989 to 2019 was very likely the warmest 30-year period in more than 800 years; the most recent decade, 2010-2019, is the warmest decade in the instrumental record so far (since 1850).
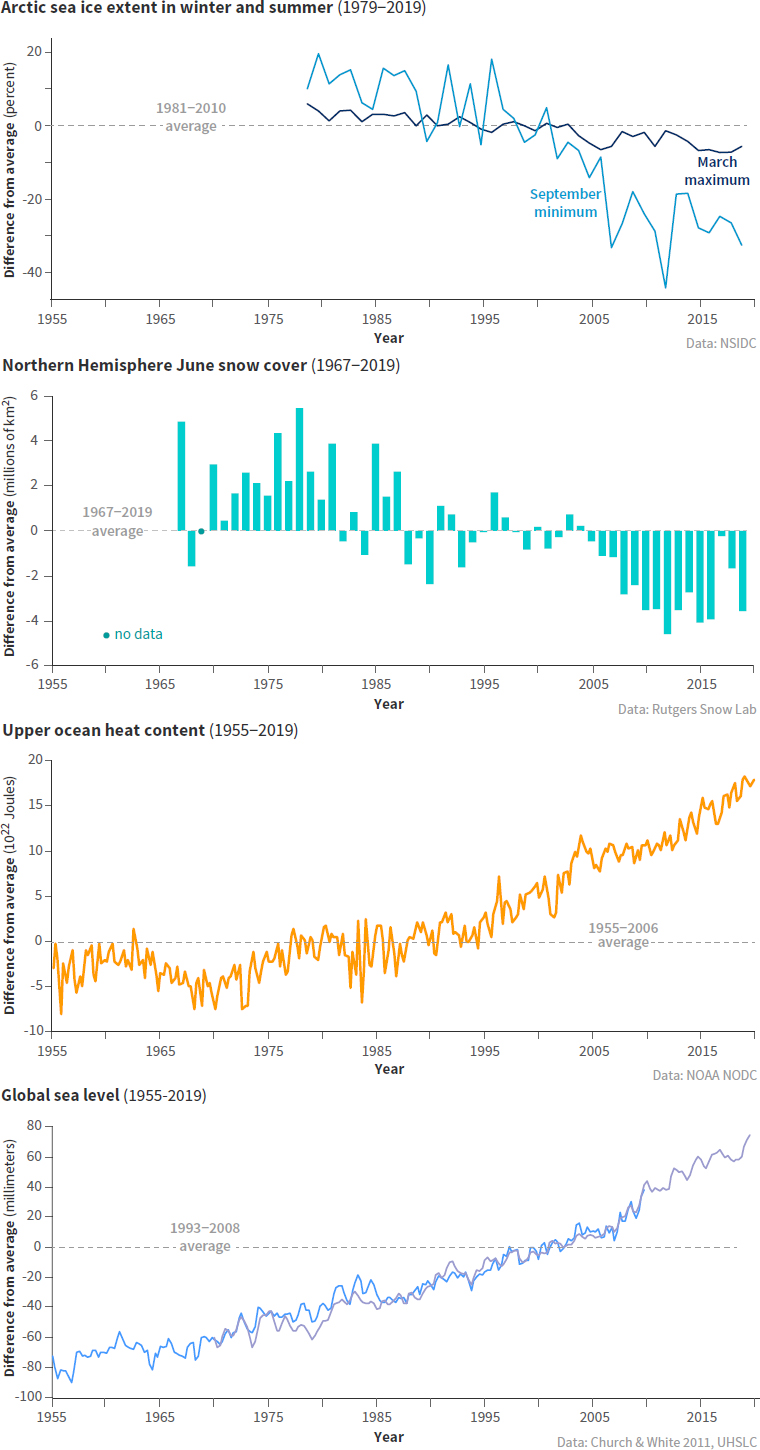
A wide range of other observations provides a more comprehensive picture of warming throughout the climate system. For example, the lower atmosphere and the upper layers of the ocean have also warmed, snow and ice cover are decreasing in the Northern Hemisphere, the Greenland ice sheet is shrinking, and sea level is rising [Figure 1b]. These measurements are made with a variety of land-, ocean-, and space-based monitoring systems, which gives added confidence in the reality of global-scale warming of Earth’s climate.
2
HOW DO SCIENTISTS KNOW THAT RECENT CLIMATE CHANGE IS LARGELY CAUSED BY HUMAN ACTIVITIES?
Since the mid-1800s, scientists have known that CO2 is one of the main greenhouse gases of importance to Earth’s energy balance. Direct measurements of CO2 in the atmosphere and in air trapped in ice show that atmospheric CO2 increased by more than 40% from 1800 to 2019. Measurements of different forms of carbon (isotopes, see Question 3) reveal that this increase is due to human activities. Other greenhouse gases (notably methane and nitrous oxide) are also increasing as a consequence of human activities. The observed global surface temperature rise since 1900 is consistent with detailed calculations of the impacts of the observed increase in atmospheric greenhouse gases (and other human-induced changes) on Earth’s energy balance.
Different influences on climate have different signatures in climate records. These unique fingerprints are easier to see by probing beyond a single number (such as the average temperature of Earth’s surface), and by looking instead at the geographical and seasonal patterns of climate change. The observed patterns of surface warming, temperature changes through the atmosphere, increases in ocean heat content, increases in atmospheric moisture, sea level rise, and increased melting of land and sea ice also match the patterns scientists expect to see due to human activities (see Question 5).
The expected changes in climate are based on our understanding of how greenhouse gases trap heat. Both this fundamental understanding of the physics of greenhouse gases and pattern-based fingerprint studies show that natural causes alone are inadequate to explain the recent observed changes in climate. Natural causes include variations in the Sun’s output and in Earth’s orbit around the Sun, volcanic eruptions, and internal fluctuations in the climate system (such as El Niño and La Niña). Calculations using climate models (see infobox, p. 20) have been used to simulate what would have happened to global temperatures if only natural factors were influencing the climate system. These simulations yield little surface warming, or even a slight cooling, over the 20th century and into the 21st. Only when models include human influences on the composition of the atmosphere are the resulting temperature changes consistent with observed changes.
3
CO2IS ALREADY IN THE ATMOSPHERE NATURALLY, SO WHY ARE EMISSIONS FROM HUMAN ACTIVITY SIGNIFICANT?
In nature, CO2 is exchanged continually between the atmosphere, plants, and animals through photosynthesis, respiration, and decomposition, and between the atmosphere and ocean through gas exchange. A very small amount of CO2 (roughly 1% of the emission rate from fossil fuel combustion) is also emitted in volcanic eruptions. This is balanced by an equivalent amount that is removed by chemical weathering of rocks.
The CO2 level in 2019 was more than 40% higher than it was in the 19th century. Most of this CO2 increase has taken place since 1970, about the time when global energy consumption accelerated. Measured decreases in the fraction of other forms of carbon (the isotopes 14C and 13C) and a small decrease in atmospheric oxygen concentration (observations of which have been available since 1990) show that the rise in CO2 is largely from combustion of fossil fuels (which have low 13C fractions and no 14C). Deforestation and other land use changes have also released carbon from the biosphere (living world) where it normally resides for decades to centuries. The additional CO2 from fossil fuel burning and deforestation has disturbed the balance of the carbon cycle, because the natural processes that could restore the balance are too slow compared to the rates at which human activities are adding CO2 to the atmosphere. As a result, a substantial fraction of the CO2 emitted from human activities accumulates in the atmosphere, where some of it will remain not just for decades or centuries, but for thousands of years. Comparison with the CO2 levels measured in air extracted from ice cores indicates that the current concentrations are substantially higher than they have been in at least 800,000 years (see Question 6).
4
WHAT ROLE HAS THE SUN PLAYED IN CLIMATE CHANGE IN RECENT DECADES?
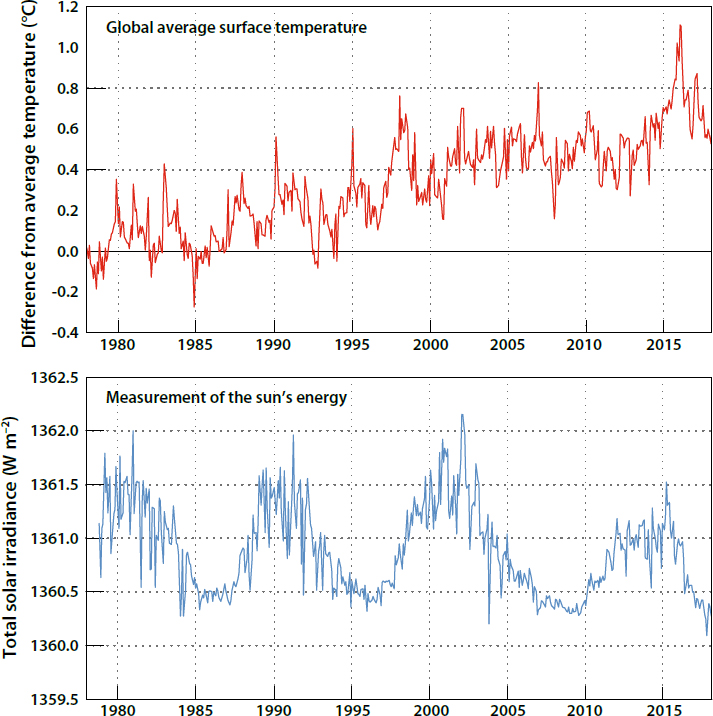
For periods before the onset of satellite measurements, knowledge about solar changes is less certain because the changes are inferred from indirect sources — including the number of sunspots and the abundance of certain forms (isotopes) of carbon or beryllium atoms, whose production rates in Earth’s atmosphere are influenced by variations in the Sun. There is evidence that the 11-year solar cycle, during which the Sun’s energy output varies by roughly 0.1%, can influence ozone concentrations, temperatures, and winds in the stratosphere (the layer in the atmosphere above the troposphere, typically from 12 to 50km above earth’s surface, depending on latitude and season). These stratospheric changes may have a small effect on surface climate over the 11-year cycle. However, the available evidence does not indicate pronounced long-term changes in the Sun’s output over the past century, during which time human-induced increases in CO2 concentrations have been the dominant influence on the long-term global surface temperature increase. Further evidence that current warming is not a result of solar changes can be found in the temperature trends at different altitudes in the atmosphere (see Question 5).
5
WHAT DO CHANGES IN THE VERTICAL STRUCTURE OF ATMOSPHERIC TEMPERATURE —FROM THE SURFACE UP TO THE STRATOSPHERE—TELL US ABOUT THE CAUSES OF RECENT CLIMATE CHANGE?
In the early 1960s, results from mathematical/physical models of the climate system first showed that human-induced increases in CO2 would be expected to lead to gradual warming of the lower atmosphere (the troposphere) and cooling of higher levels of the atmosphere (the stratosphere). In contrast, increases in the Sun’s output would warm both the troposphere and the full vertical extent of the stratosphere. At that time, there was insufficient observational data to test this prediction, but temperature measurements from weather balloons and satellites have since confirmed these early forecasts. It is now known that the observed pattern of tropospheric warming and stratospheric cooling over the past 40 years is broadly consistent with computer model simulations that include increases in CO2 and decreases in stratospheric ozone, each caused by human activities. The observed pattern is not consistent with purely natural changes in the Sun’s energy output, volcanic activity, or natural climate variations such as El Niño and La Niña.
Despite this agreement between the global-scale patterns of modelled and observed atmospheric temperature change, there are still some differences. The most noticeable differences are in the tropics, where models currently show more warming in the troposphere than has been observed, and in the Arctic, where the observed warming of the troposphere is greater than in most models.
6
CLIMATE IS ALWAYS CHANGING. WHY IS CLIMATE CHANGE OF CONCERN NOW?
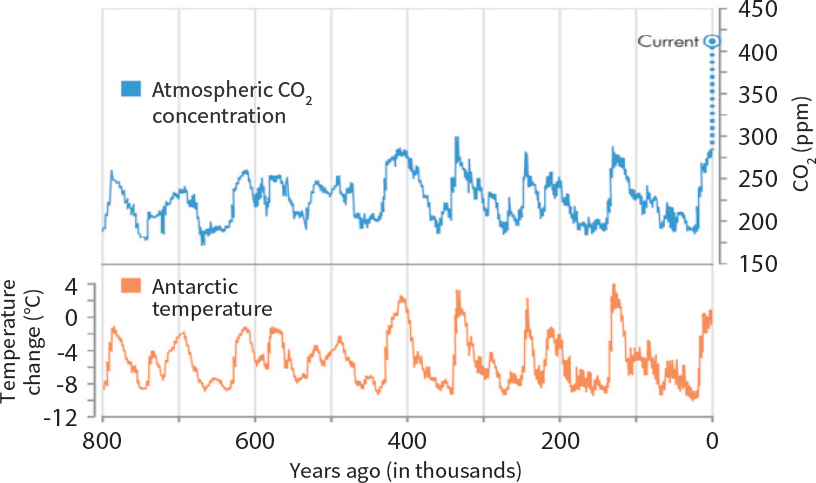
The largest global-scale climate variations in Earth’s recent geological past are the ice age cycles (see infobox, p.B4), which are cold glacial periods followed by shorter warm periods [FIGURE 3]. The last few of these natural cycles have recurred roughly every 100,000 years. They are mainly paced by slow changes in Earth’s orbit, which alter the way the Sun’s energy is distributed with latitude and by season on Earth. These orbital changes are very small over the last several hundred years, and alone are not sufficient to cause the observed magnitude of change in temperature since the Industrial Revolution, nor to act on the whole Earth. On ice-age timescales, these gradual orbital variations have led to changes in the extent of ice sheets and in the abundance of CO2 and other greenhouse gases, which in turn have amplified the initial temperature change.
Recent estimates of the increase in global average temperature since the end of the last ice age are 4 to 5 °C (7 to 9 °F). That change occurred over a period of about 7,000 years, starting 18,000 years ago. CO2 has risen more than 40% in just the past 200 years, much of this since the 1970s, contributing to human alteration of the planet’s energy budget that has so far warmed Earth by about 1 °C (1.8 °F). If the rise in CO2 continues unchecked, warming of the same magnitude as the increase out of the ice age can be expected by the end of this century or soon after. This speed of warming is more than ten times that at the end of an ice age, the fastest known natural sustained change on a global scale.
7
IS THE CURRENT LEVEL OF ATMOSPHERIC CO2CONCENTR ATION UNPRECEDENTED IN EARTH’S HISTORY?
Measurements of air in ice cores show that for the past 800,000 years up until the 20th century, the atmospheric CO2 concentration stayed within the range 170 to 300 parts per million (ppm), making the recent rapid rise to more than 400 ppm over 200 years particularly remarkable [FIGURE 3]. During the glacial cycles of the past 800,000 years both CO2 and methane have acted as important amplifiers of the climate changes triggered by variations in Earth’s orbit around the Sun. As Earth warmed from the last ice age, temperature
and CO2 started to rise at approximately the same time and continued to rise in tandem from about 18,000 to 11,000 years ago. Changes in ocean temperature, circulation, chemistry, and biology caused CO2 to be released to the atmosphere, which combined with other feedbacks to push Earth into an even warmer state.
For earlier geological times, CO2 concentrations and temperatures have been inferred from less direct methods. Those suggest that the concentration of CO2 last approached 400 ppm about 3 to 5 million years ago, a period when global average surface temperature is estimated to have been about 2 to 3.5°C higher than in the pre-industrial period. At 50 million years ago, CO2 may have reached 1000 ppm, and global average temperature was probably about 10°C warmer than today. Under those conditions, Earth had little ice, and sea level was at least 60 metres higher than current levels.
8
IS THERE A POINT AT WHICH ADDING MORE CO2WILL NOT CAUSE FURTHER WARMING?
Our understanding of the physics by which CO2 affects Earth’s energy balance is confirmed by laboratory measurements, as well as by detailed satellite and surface observations of the emission and absorption of infrared energy by the atmosphere. Greenhouse gases absorb some of the infrared energy that Earth emits in so-called bands of stronger absorption that occur at certain wavelengths. Different gases absorb energy at different wavelengths. CO2 has its strongest heat-trapping band centred at a wavelength of 15 micrometres (millionths of a metre), with absorption that spreads out a few micrometres on either side. There are also many weaker absorption bands. As CO2 concentrations increase, the absorption at the centre of the strong band is already so intense that it plays little role in causing additional warming. However, more energy is absorbed in the weaker bands and away from the centre of the strong band, causing the surface and lower atmosphere to warm further.
9
DOES THE RATE OF WARMING VARY FROM ONE DECADE TO ANOTHER?
Even as CO2 is rising steadily in the atmosphere, leading to gradual warming of Earth’s surface, many natural factors are modulating this long-term warming. Large volcanic eruptions increase the number of small particles in the stratosphere. These particles reflect sunlight, leading to short-term surface cooling lasting typically two to three years, followed by a slow recovery. Ocean circulation and mixing vary naturally on many time scales, causing variations in sea surface temperatures as well as changes in the rate at which heat is transported to greater depths. For example, the tropical Pacific swings between warm El Niño and cooler La Niña events on timescales of two to seven years. Scientists study many different types of climate variations, such as those on decadal and multi-decadal timescales in the Pacific and North Atlantic Oceans. Each type of variation has its own unique characteristics. These oceanic variations are associated with significant regional and global shifts in temperature and rainfall patterns that are evident in the observations.
Warming from decade to decade can also be affected by human factors such as variations in emissions of greenhouse gases and aerosols (airborne particles that can have both warming and cooling effects) from coal-fired power plants and other pollution sources.
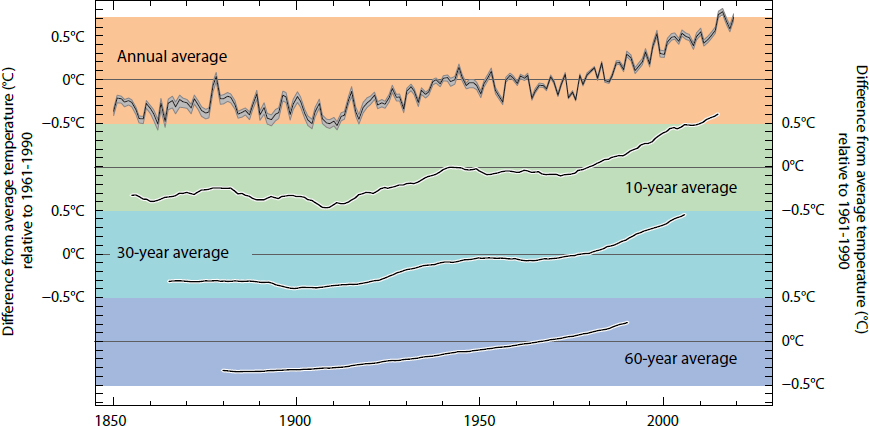
These variations in the temperature trend are clearly evident in the observed temperature record [FIGURE 4]. Short-term natural climate variations could also affect the long-term human-induced climate change signal and vice-versa, because climate variations on different space and timescales can interact with one another. It is partly for this reason that climate change projections are made using climate models (see infobox, p.20) that can account for many different types of climate variations and their interactions. Reliable inferences about human-induced climate change must be made with a longer view, using records that cover many decades.
10
DID THE SLOWDOWN OF WARMING DURING THE 2000S TO EARLY 2010S MEAN THAT CLIMATE CHANGE IS NO LONGER HAPPENING?
Decades of slow warming as well as decades of accelerated warming occur naturally in the climate system. Decades that are cold or warm compared to the long-term trend are seen in the observations of the past 150 years and are also captured by climate models. Because the atmosphere stores very little heat, surface temperatures can be rapidly affected by heat uptake elsewhere in the climate system and by changes in external influences on climate (such as particles formed from material lofted high into the atmosphere from volcanic eruptions).
More than 90% of the heat added to the Earth system in recent decades has been absorbed by the oceans and penetrates only slowly into deep water. A faster rate of heat penetration into the deeper ocean will slow the warming seen at the surface and in the atmosphere, but by itself it will not change the long-term warming that will occur from a given amount of CO2. For example, recent studies show that some heat comes out of the ocean into the atmosphere during warm El Niño events, and more heat penetrates to ocean depths in cold La Niñas. Such changes occur repeatedly over timescales of decades and longer. An example is the major El Niño event in 1997–98 when the globally averaged air temperature soared to the highest level in the 20th century as the ocean lost heat to the atmosphere, mainly by evaporation.
Even during the slowdown in the rise of average surface temperature, a longer-term warming trend was still evident (see Figure 4). Over that period, for example, record heatwaves were documented in Europe (summer 2003), in Russia (summer 2010), in the USA (July 2012), and in Australia (January 2013). Each of the last four decades was warmer than any previous decade since widespread thermometer measurements were introduced in the 1850s. The continuing effects of the warming climate are seen in the increasing trends in ocean heat content and sea level, as well as in the continued melting of Arctic sea ice, glaciers and the Greenland ice sheet.


