
6
Predicting Current and Future Sources of Variation in Quantitative Traits
Early on the workshop’s second day, Patricia Wittkopp of the University of Michigan delivered the workshop’s second keynote speech. It was a fitting transition from the first half of the workshop to the second because Wittkopp’s talk included both a look at the current state of functional genomics, including what has led up to it, and a discussion of what will be required to move effectively into the future and what that future may offer as functional genomics relies more and more on large-scale data and tools. Wittkopp’s talk focused on functional validation and the testing of hypotheses derived from large-scale experiments. The talk acted as a complement to the keynote from Regev (see Chapter 2), who emphasized large-scale studies, computational inference, and pattern identification. The methodologies and research behind identifying patterns in datasets from Regev and the functional validation of genomic information from Wittkopp are both important parts of functional genomics research.
Wittkopp started by explaining the two pieces of her title. “Predicting current sources of variation in quantitative traits” refers to the ability to predict where the genetic basis of a particular variation or trait will lie within the genome—within a certain type of gene, for instance, or inside non-coding sequences. And “predicting future variation” refers to making predictive statements about what types of changes should arise under particular evolutionary scenarios, certain types of selection pressure, and so forth.
“Our way forward toward these things involves three key steps,” she said. The first, which has been happening in the field for quite a while, is carrying out case studies. “I don’t think we’re done with case studies,” she
said. “I think they have a really critical role in generating the information we need to accomplish those broader goals.”
Once enough case studies have been accumulated, the next step will be to develop a framework to integrate them. This will involve modeling that is based on both empirical observations and a theoretical understanding of how the evolutionary process, development, and gene regulation work.
The final step will be testing the predictions that the model makes. Such tests could take many forms, Wittkopp said. They could entail making predictions about where variations should be and then mapping those variations, for instance, or they might involve carrying out experimental evolution studies.
Over the past 10–15 years there has been a tremendous increase in the number of genetic changes that have been associated with trait variations, she said, mentioning in particular the website gephebase.org, which compiles genotype–phenotype relationships from the scientific literature (Martin and Orgogozo, 2013). It is important, Wittkopp said, that funding be available not only for generating data on genotype–phenotype relationships, but also for projects like GePheBase that collect the data in one place.
Furthermore, she reiterated that there is still a need for more case studies because only with a large enough collection of case studies is it possible to ask such questions as whether the genetic basis differs for traits at different timescales or trait functions. In deciding which case studies to carry out, she added, it is important to be strategic about figuring out which traits deserve greater attention and also to be mindful of ascertainment bias, which arises when data are collected not from a random sampling of a population but from a population that has been biased by choices made in the sampling. In this case, existing datasets are heavily biased toward candidate genes and coding sequences, among other things, and so it is important to be cautious when synthesizing those data.
DISCOVERING THE GENETIC BASIS OF A CHANGE: AN EXAMPLE
Having finished her introductory remarks, Wittkopp turned to the first part of her talk in which she described an example from her own lab of looking for the genetic basis of a change in an organism. The story she told echoed many of the themes that emerged in the sessions in the first half of the workshop (i.e., the sessions described in Chapters 2, 3, and 4).
The trait that Wittkopp studied was a pigmentation difference between two members of the Drosophila virlis group, Drosophila americana and Drosophila novamexicana. D. americana has a brown body, while D. novamexicana has a yellow body. These are sister species, and they can be interbred and create fertile offspring. The F1 hybrids are closer in color to D. americana, Wittkopp said, so the dark pigmentation is largely
dominant (see Figure 6-1). When the F1 hybrids are crossed back with D. novamexicana, it creates a population of recombinant individuals that each has a shuffled combination of the two species’ genomes and then one set of chromosomes from D. novamexicana. The distribution of pigmentation phenotypes in this back-crossed population is not continuous, Wittkopp said, but instead the phenotypes fell into about five distinct classes, suggesting that only two, three, or possibly four genes are contributing to the pigmentation patterns (Wittkopp et al., 2003).
When her lab started working on this trait in 2005, Wittkopp said, they did not have genomes for those species, so they did a very sparse quantitative trait locus (QTL) map that was focused on particular candidate genes. They found that two of those genes, tan and ebony, were strongly associated with pigmentation—that is, when the region of the genome that contained tan or ebony was inherited from D. americana, which is the dark species, the flies were darker, and when that region was inherited from D. novamexicana, they were lighter (Wittkopp et al., 2009).
The two genes, tan and ebony, encode enzymes that are involved in the pigment synthesis pathway, Wittkopp said. The tan and ebony genes catalyze a reversible reaction that controls the balance between yellow
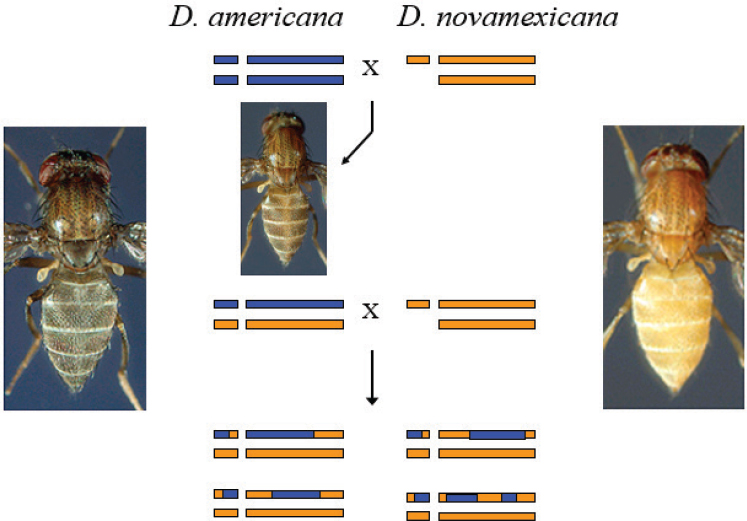
SOURCE: Patricia Wittkopp presentation, slide 7.
and dark black and brown pigments (Cooley et al., 2012). Noting that the gene names in flies are backwards because they are named for the mutant phenotype, Wittkopp explained that the function of the ebony gene is to make yellow pigment and the function of the yellow gene is to make black pigment.
Wittkopp also examined the sources of the differences in gene expression using an allele-specific expression trick that she had developed as a postdoc. By working in the F1 hybrid, she explained, she “put the two different species’ cis-regulatory alleles in the same actual cells so they’re exposed to the same trans-regulatory factors, and any differences in expression between the two alleles must come from cis-regulatory differences between those alleles.” She found that most (in the case of tan) or all (in the case of ebony) of the expression differences between the species were due to cis-regulatory changes (Wittkopp et al., 2004).
At that point she also wanted to locate the nucleotide changes that cause the difference in gene expression, which presumably cause the pigmentation differences. “And this has been a mix of success and failure,” she said, “so that’s what I’ll share here.”
One of the first steps in the effort to find those nucleotide changes was to use a transgenic approach. Her lab cloned the tan genes from D. americana and D. novamexicana along with the flanking noncoding sequences—about 14 kb of genome—and transformed them into D. melanogaster, the fly that has served as a model organism for decades and thus is most convenient to work with. Working with a D. melanogaster with no tan gene and no yellow gene, they added a tan gene from D. novamexicana, the yellow species. As a result they produced the tan phenotype and got some pigmentation. When they added the D. americana tan gene, including its flanking non-coding sequences, they got darker pigmentation which was consistent with what they had seen in the two species. They repeated the work but put the transgenes in D. novamexicana and saw the same difference in pigmentation. Unfortunately, Wittkopp said, they were not able to do the same thing with the ebony gene because it is too large. “We couldn’t get it to clone; we couldn’t get it to transform in [D. melanogaster],” she said. “That’s a technical/biological limitation that we hit in this work.”
To figure out where within tan the functional changes are, Wittkopp said, she next used a fine-scale genetic mapping approach. Her lab had created introgression lines with flies that were mostly D. novamexicana but contained a small region of the genome, including tan, from D. americana. They crossed these with D. novamexicana and screened 10,000 flies, categorizing each one as having either light or dark pigmentation and then genotyping each fly at markers near tan to try to find recombinants within tan. The result was two “very informative recombinants,” Wittkopp said.
They isolated the first intron. There are no sequence differences between species in the first exon, so the first intron seems to be where the functional differences between the two species are located. Flies with the D. novamexicana version have lighter pigmentation, while those with the D. americana version have darker pigmentation.
They actually got lucky in being able to locate the source of the functional difference, Wittkopp said, because recombinants that are informative for fine-scale mapping are rare. Getting enough recombinants and being able to efficiently choose the recombinants that are informative for the trait of interest are major bottlenecks that could benefit from some technological advances, she said. It would be useful, for example, to be able to target recombination to a particular region of the genome. “We have opportunities here to speed up this part of the process with technology,” she said.
With the 14-kb transgene in hand, Wittkopp and her group set out to swap the intron and parts of the intron between the different flies. At the time—about 10 years ago—they had to use restriction enzyme–based cloning, which was difficult. Wittkopp commented that with the technological advances that have occurred in the meantime, however, the process is not as challenging now. Unfortunately, Wittkopp said, by the time they were ready to put these transgenes into the flies, the original line they had been working with had died. Those flies had landing sites that could be targeted so that the transgenes would go in the same spot in the genome, but with a different line of flies the transgenes ended up in another landing site—and no pigmentation difference was produced. “So this was obviously a little heartbreaking and depressing,” she said. This points to another technical barrier, Wittkopp said—that even if a researcher can insert transgenes into a species of interest, it matters where they land, and the exact landing site can affect the results (John et al., 2016).
In response to that result, Wittkopp said, she and her team decided to put the transgenes into a number of landing sites and see what happened in different parts of the genome. In three of the other four sites they tried, they did see the expected differences in pigmentation between the two species, which showed that the relevant factor was the expression level of the transgenes. Some regions were just better able to express the transgene at high levels than others, she said.
When looking more closely, however, they found a pattern they could not explain. A transgene that should have led to darker pigmentation led to lighter, for instance. And the effect depended on how long the transplanted DNA was. “Here we have americana, we put in a little bit of novamexicana, it should lighten it, it does,” she said. “We put in a bigger chunk of novamexicana. Nope, darkens it again.” They stopped pursuing this line, she said, but she believes there are important messages in this result: there must be multiple sites that are affecting pigmentation, they are probably
closely linked, and they have effects in opposite directions. Thus, this region of the genome presents an extremely complex situation.
Other researchers have reported similar findings, she said. When one is doing a broader-scale QTL map, the areas with opposite effects can cancel each other out, which can make it easy to miss them (Bernstein et al., 2019). Wittkopp’s lab has observed the same sort of thing in three different strains of yeast (Metzger and Wittkopp, 2019). In all three cases, she said, the number of regions that increased gene expression were approximately balanced out by those that decreased gene expression. “So we have a lot more variants within the genome that are affecting expression of one gene than we knew about,” she said. “When we just look at the expression level of these strains they’re actually not that different from each other, yet there’s still lots of genetic variation that’s present.”
The presence of these multiple linked variants with opposing effects is, therefore, a major biological challenge in understanding how phenotypic variations arise. She also added a couple of other biological challenges to the list. One is the sheer number of loci that can harbor variation, and another is the fact that many of these variants are relatively rare but collectively can play a major role. For example, she said, a group led by Leonid Kruglyak of the University of California, Los Angeles, examined trait variation in yeast and concluded that rare variants explain much of the variation (Bloom et al., 2019). This is important, Wittkopp said, because such rare variants are missed by genome-wide association studies (GWASs). Other challenges are the presence of epistatic interactions among genes that affect the measurement of allelic differences and trait variation, as well as the fact that many phenotypes are sensitive to fluctuations in the environment. These are parts of biology that make it much harder to understand the relationships between genotypes and phenotypes, especially with the technologies that are available today.
Wrapping up the first part of her presentation, Wittkopp offered the take-home message that the challenges in mapping quantitative trait nucleotides do not end with clearing the transgenic hurdle. There are many more technical and, especially, biological challenges to overcome. And the grand challenge, she said, is how to scale mapping—to speed up the process of finding the nucleotides that matter. Ultimately, she said, the gold standard is functional testing with allele swaps where only one nucleotide in the genome is changed, and her lab has developed a strategy to do that. “We basically swap in a marker, swap it back out, and in the process of the swaps restore the scars that were created the first time in,” she said (Lamb et al., 2017).
EXPLORING THE REGULATION OF GENE EXPRESSION
In the second part of her talk, Wittkopp spoke about the work she has been doing to understand how the regulation of gene expression evolves. In studying that evolution, she said, she has used several approaches, including single-gene strategies, genomic strategies, and single-mutation strategies. Her ultimate goal, she said, is to study the universal rules of life that apply to multiple organisms.
Generally speaking, the people who study the evolution of phenotypic differences believe that these differences are less likely to be caused by changes in coding sequences than by changes in expression. This may be because creating changes in gene expression makes it possible to alter a gene’s function in one part of the organism but not others, while a change in the gene’s coding sequence changes that gene everywhere.
Wittkopp began by discussing some of the single-gene strategies she has used to study the evolution of gene regulation, particularly her studies of enhancers. Much comparative work on enhancers starts by using sequence conservation to find orthologous enhancers (Wittkopp and Kalay, 2011). This works well in certain invertebrates, although not so well in flies.
Researchers in the field take it for granted that if enhancers are in a particular order for one species, they will follow that order in another species, and that assumption is often validated. “People have taken these pieces of DNA from other species and shown that they drive the same patterns,” she said. But when she took a systematic approach to looking at orthologous enhancers, she “got a bit of a surprise.”
They were looking at enhancers of the yellow gene, which had been pretty well characterized, and they found that, depending on which species they were examining, gene activity was driven by different stretches; sometimes the activity was driven primarily by the intron, for instance, while in other cases it was driven mostly by the 5′ region. When they looked at the sequences in the different species, however, they found no evidence that bits of the sequence were jumping between the intron and the 5′ region. “Rather,” she said, “the data suggest it’s a gradual gain and loss of transcription factor binding sites that is changing which parts of this gene’s cis-regulatory region are driving expression in the same tissue between the same species” (Kalay and Wittkopp, 2010).
There was another surprise when they cut up the regions to try to localize the relevant sequences. Instead, they found expression in the same tissue coming from multiple fragments. That is, there was tremendous redundancy in the enhancers. “We also see what I’m considering cryptic or latent enhancer activities, where there’s a fragment of DNA from one species that drives expression in a pattern that doesn’t exist in that species,
but exists in other species,” Wittkopp said. The enhancers seem to have “a lot of potential for future evolution already in place” (Kalay et al., 2019).
Consequently, there is still much to learn about the structure–function relationships for enhancer activity and their evolution. In the future, in vivo functional assays for enhancer activity will remain an essential tool. Wittkopp noted that various strategies, such as barcoding and single-cell RNA-sequencing (RNA-seq), could provide advances that would accelerate progress in this area.
Next Wittkopp turned to a discussion of the second approach—genomic strategies—for studying the evolution of gene regulation. With the development of microarrays and, more recently, of RNA-seq, researchers can carry out genome-wide surveys of gene expression. This research has shown that in virtually every system studied, levels of gene expression often vary among individuals and are divergent among species. Some of this variation is expected to contribute to trait differences, she said, but it is likely that much of it does not. This means that a major challenge for understanding the role of regulatory variation in evolution is determining how much of the variation in gene expression is neutral and how much is not.
Wittkopp said that her lab has done some of this work with RNA-seq in flies and yeast, while others have generated similar datasets comparing genome-wide expression between species in mammals. They were surprised to see that the rate and pattern with which expression is changing at a genomic scale are remarkably similar among widely divergent species. “So it suggests to us,” she said, “that there may be some general properties about how regulatory systems are evolving.”
Her team also saw a second, somewhat mysterious pattern that seems to hold in divergent species. When one characterizes the expression differences between species in terms of whether they are cis- or trans-regulatory changes, over evolutionary timescales the proportion of the expression differences that are cis-regulatory changes steadily increases (Wittkopp et al., 2008; McManus et al., 2010; Coolon et al., 2014; Metzger et al., 2017). This has been seen in yeast and in flies, and there are hints of the pattern in available data on mice. Thus, it seems that this sort of proportional accumulation of cis changes is a general pattern in regulatory evolution. The question, then, is why this pattern or other patterns in regulatory evolution exist.
Finally, Wittkopp turned to the third approach, single-mutation strategies, which she is using to gain an insight into how evolutionary selection acts on gene regulation. She began with an observation: “If you are going to make sense of the variation you see within a species or between species and you are going to say something about the role of selection in generating that variation, it works best if you have an understanding of what happens in the absence of selection.” This is not a new idea, she said.
Indeed, it underlies a classic paradigm concerning the selection of genes: if one understands how genes change due to neutral processes alone—that is, mutations and genetic drift—then that can be compared with the changes seen in natural populations, which also have a component due to natural selection, and one can infer the impact of selection.
A similar process is used to understand the role of natural selection in the regulation of gene expression. However, unlike the case with DNA sequences, for which information on how they change over time in the absence of selection has been collected for decades, models of neutral regulatory evolution have been based on many assumptions, but little empirical data.
This is beginning to change, she said. “We’re starting to get ways to actually survey the mutational space” and generate the empirical data necessary to gain an insight into the role of selection in gene regulation.
Wittkopp explained the basic idea in this way: “If we have the mutational distribution and mutational effects for a quantitative trait and we can compare those to the effects of variants we see in natural populations, which have been subject to the same mutational processes but also selection, then we can separate the roles of neutral and non-neutral processes.” If polymorphisms turn out to be a random subset of the mutational distribution, there is no need to invoke selection—the variation that is seen may be explained by the mutation process alone. If there is a difference, one can assume that this difference is due to selection.
However, Wittkopp continued, getting the empirical data needed to understand what the mutational distribution looks like has been challenging for quantitative traits. Fortunately, she said, there are now new tools for introducing mutations and surveying their effects on a large scale that have made it possible to greatly accelerate the process over the past 3 years.
Wittkopp described work that her lab has done to learn about the effects of mutations in gene promoters in yeast. Working with the TDH3 promoter, they systematically changed 236 of the 241 Gs and Cs in that promoter to As and Ts, respectively, and then measured the effect of each mutation on the gene’s expression (Metzger et al., 2015). “This allowed us to describe the distribution of mutational effects for this promoter,” she said. Next, they examined the natural variation in TDH3 promoters in strains of yeast that had been isolated from a variety of locations. They introduced the natural variant sequences into the same study system in order to have an apples-to-apples comparison, and then compared the effects of the mutation and the polymorphisms to infer whether selection had occurred.
What they found was that the polymorphisms looked like a random sample of the mutations. This was surprising, Wittkopp said. Even though this is an important gene in yeast—it is one of the most highly expressed
genes and is involved in metabolism—variations in the promoter that affect the expression level of the gene do not seem to be acted on by selection.
What they found on further inspection was that few of the mutations changed the gene expression very much—and not enough to have a measurable impact on the distribution of effects. “That’s why we get the signature of neutral evolution,” she said.
They uncovered another layer of complexity as well. Mutations do not just change the average expression of a gene, Wittkopp said, but also change the consistency in that gene’s expression among genetically identical cells in the same environment. This is a property known as expression noise, she said. As an example, she said that her skin cells are all genetically identical and live in about the same environment, but if she used single-cell techniques, she would find slight differences in expression among these cells. This is expression noise, and it is genetically controlled.
In her study of the effects of mutations on gene expression in yeast, Wittkopp found that mutations tended to increase expression noise, while the polymorphisms they found in the natural population did not, which indicated that selection had acted to maintain a particular degree of noise (Metzger et al., 2015). That raised the question of why expression noise matters. Why might there be selection for or against noisier genotypes? And how big are the fitness effects of variation in expression noise? It is challenging to answer that question, because most mutations change both the mean expression level and expression noise.
To look into the role of expression noise more deeply, Wittkopp showed the results of a fitness analysis performed on two genotypes that produce the same mean expression but differ in the noisiness of that expression among cells. The “noisier” genotype had a broader range of expression, with more cells with higher or lower levels of expression.
On average, when the mean expression is close to the optimum, the noisier genotype generates more cells with suboptimal fitness—because they are spread out further away from the optimum—and thus the average fitness of the noisier genotype is lower. However, when the analysis is done with the mean expression far from the optimum, the noisier genotype generates more cells with expression closer to the fitness optimum, which results in the noisier genotype having greater fitness than the less noisy genotype (Duveau et al., 2018).
Why might the mean expression be far from the optimum? One possibility is that the allele was fixed by genetic drift. Another is that there was a change in environment that altered the fitness curve.
For her purposes, Wittkopp said, different environments for yeast are those with different carbon sources, and her group has found that the relationship between the expression of the TDH3 promoter and fitness differs across environments. For example, if a cell that expresses the optimal level
of the gene in a glucose environment is put into a galactose environment and expresses the gene at the same level, that expression will be suboptimal.
If a cell regularly experiences both of two environments, Wittkopp said, there is a better solution than noise, and that is phenotypic plasticity. Indeed, this phenotypic plasticity can be seen in the wild-type allele in that when a cell is moved from glucose to galactose, the expression of the gene goes down. In this case, she said, plasticity seems to be adaptive, although in the other environments they have tested it does not (Duveau et al., 2017). “So, I don’t think we should assume that all the plasticity we see is adaptive,” she said, “but I think it’s an open question about how much of it is or isn’t.”
CONCLUSIONS AND NEXT STEPS
Summing up her results, Wittkopp said that her work has shown that the relationship between genotype and phenotype for gene expression is not just about the average expression level, but also involves the plasticity in that expression level, the noisiness of that expression level, and various other pieces, all of which shape the variation that exists within a species.
In closing, Wittkopp reiterated the technical challenges (gene sizes, hosts for transgenics, landing sites for transgenes, generating recombinants, scaling mapping, and allele swaps) and the biological challenges (many loci, small effects, linked loci, rare variants, epistasis, plasticity, and genome structure, in particular, inversions) that face those who seek to study the genetic basis of trait differences.
Looking forward, she said that a number of technical advances promise to increase and speed up capabilities in this area, and she mentioned specific advances in genotyping and phenotyping, cloning tools, reciprocal hemizygosity testing, and CRISPR/Cas-based tools. “The ability to perturb with targeted mutagenesis on a large scale is also coming on board,” she added. “I’m optimistic about the future of these directions.”
This page intentionally left blank.


