
2
Correctional Facilities and COVID-19: Context and Framing
This chapter provides the conceptual and empirical context that guided the committee’s analysis of how decarceration and enhanced reentry planning and service provision can contribute to a comprehensive COVID-19 mitigation strategy. It begins with a basic description of disease dynamics and then considers how the conditions and operations of the U.S. correctional system are likely to amplify the spread of COVID-19, both within correctional facilities and in surrounding communities. It then draws on emerging data and analysis to describe the scope of the COVID-19 outbreak in U.S. prisons and jails and discusses the data limitations that challenge research efforts necessary to inform ongoing pandemic and public health responses.
THE BASIC EPIDEMIOLOGY OF COVID-19
Epidemiologists study the spread of infectious diseases by dividing the population into distinct categories (or compartments) defined by the progression of a disease and then examining the process by which individuals move between these compartments. In the susceptible-exposed-infected-recovered (SEIR) model presented by Anderson and May (1991), all members of a closed population are in one of four compartments: susceptible to infection (S), exposed to infection but not yet infected (E), infected-infectious (I), or recovered (R). Movement between these compartments depends on the transmission rate (a factor that depends on the nature of the pathogen and the social and institutional structures that shape human interaction, as well as human behavior), the length of time to recovery, and the likelihood that the exposed become infected and the time profile of this process.
As a disease outbreak progresses, the pace and volume of new infections change as the susceptible population shrinks when greater proportions of the population move into the recovered compartment and the susceptible population is reduced through vaccination.
In studying the impact of an infectious disease outbreak, researchers often focus on two key measures and the factors that influence them: the basic and effective reproduction ratio. The basic reproduction ratio, called R0, measures the number of new infections transmitted by an initial infected person. R0 is higher when the infection rate is higher (an individual transmits a large number of new infections each day) and lower when the recovery rate is faster (i.e., individuals recover quickly from the disease). When R0 is greater than 1, infection will spread; when it is less than 1, outbreaks will quickly die out (Anderson and May, 1991).
The second summary measure is the effective reproduction ratio, or Re, which is the number of new infections that result from a new infection at a given point in time after the initial infection. Re depends on R0, but also on the proportion of the population that remains susceptible. As the susceptible proportion shrinks, Re will decline as there are fewer and fewer susceptible individuals that can be infected (Anderson and May, 1991).
While understanding of how SARS-CoV-2 spreads from person to person is evolving, a major route of spread is through respiratory droplets between persons in close proximity to one another (within 6 feet). Moreover, virus-laden aerosols of smaller particles may also cause infection, especially in closed quarters with poor ventilation, where the aerosols can remain in the air and circulate through a closed environment for some time (Klompas, Baker, and Rhee, 2020). Although less likely, transmission of the virus can also occur when contact with contaminated surfaces is followed by contact with the eyes, nose, or mouth. When exposure to the virus causes an infection, it is often followed by a latent period of approximately 5 days but can be as long as 14 days, at which point symptomatic patients begin to present with respiratory and a variety of other physical problems. Asymptomatic infections are not uncommon. Patients are likely at highest risk of spreading the illness before symptoms develop and early in the course of their illness (Joost Wiersinga et al., 2020).
This understanding of COVID-19 informs what has become the standard protocol for minimizing the spread of disease: physical distancing of at least 6 feet; mask wearing; regular hand washing; restricted use of congregate settings, particularly indoors; diagnostic testing of symptomatic and asymptomatic individuals; quarantine for 14 days following contact with an infected person; and contact tracing for infected patients.1
___________________
1 See, for example, steps posted at U.S. Centers for Disease Control and Prevention at https://www.cdc.gov/coronavirus/2019-ncov/prevent-getting-sick/index.html [updated September 11, 2020].
THE CORRECTIONAL SYSTEM AS AN AMPLIFIER OF COVID-19 SPREAD
The adult correctional system includes state and federal prisons, incarcerating 1.47 million men and women in 2018, and local jails that held another 738,000 (Maruschak and Minton, 2020). In 2019, an additional 56,000 people were in immigration detention facilities as a result of either apprehension at the border by U.S. Customs and Border Protection officers or arrests occurring within the United States by U.S. Immigration and Customs Enforcement (ICE) officers (ICE, 2020). According to the most recent data, the adult incarcerated population is held in 2,005 state and federal prisons and 3,163 jail facilities. Prisons employ a total staff of about 480,000, while jails employ another 205,000. The penal system thus includes around 3 million people, counting the incarcerated population and staff, distributed across more than 5,000 facilities.2
Five features of the penal system are particularly important for public health and the transmission of the novel coronavirus. First, the high rate of incarceration has created high rates of admission and release. Second, rapid growth in prison and jail populations has contributed to overcrowding in facilities that are often old and poorly ventilated, with great variation in the physical plant of facilities including use of congregate spaces. Third, admission to and release from incarceration are spatially concentrated in low-income, predominantly Black and Hispanic neighborhoods. Fourth, in addition to their socioeconomic disadvantage, people at greatest risk of incarceration are also in poor health, burdened disproportionately by chronic health conditions. Finally, the correctional health care system is largely siloed from public health and emergency preparedness planning and not resourced to manage pandemic outbreaks. Box 2-1 describes how these five features may have contributed to a COVID-19 outbreak at San Quentin Prison in California.
Admissions to and Releases from Incarceration
Patterns of admission and release are strikingly different for prisons and jails. Prisons are state and federal facilities incarcerating men and women who have been convicted of felony offenses and are typically sen-
___________________
2 Facility counts are from the Bureau of Justice Statistics (BJS) and its census of state and federal adult correctional facilities (latest data available for 2012) and the census of jails (latest data available for 2013). Data on employment in state and federal prisons are from the BJS justice expenditure and employment extracts (latest data available for 2016) and the Bureau of Prisons; see https://www.bop.gov/about/statistics/statistics_staff_ethnicity_race.jsp. Data on jail employment are taken from staff counts of the BJS census of jails (latest data available for 2013).
tenced to incarceration for 1 year or longer. The average length of stay in state prisons is 2.6 years (Kaeble and Cowhig, 2018). Each year, prisons admit and release about 600,000 people. In 2018, 72 percent of all those admitted to prison had been convicted of new crimes, while 28 percent had not come from court but had been sent to prison for violating the conditions of probation or parole (Carson, 2020).
For local jails, roughly two-thirds of their populations are defendants who have not been sentenced and are awaiting court action. The remaining one-third have been convicted and received short sentences, typically less than 1 year of incarceration. About 63 percent of individuals in jail are held for a felony offense and 37 percent for a misdemeanor (Zeng, 2020). Jail stays are relatively brief, an average of about 28 days and as short as 2–3 days in some jurisdictions (Cunniff, 2002). Short jail stays produce very high rates of admission and release. A total of 10.7 million people were admitted to jails in 2018 (Zeng, 2020).
In the early phase of the pandemic, the virus spread “outside in” from the community into the facility from people who were newly admitted, staff, or visitors. Because of high rates of admission, the ongoing appearance of newly susceptible entrants to prisons and jails, in particular, can sustain outbreaks beyond the usual life cycle of a disease in a closed population.3 As noted above, jail stays are usually very short, with many people moving in and out in a matter of days, often making quarantine infeasible. Even testing may not be practical in many cases, given the lag time on many COVID-19 tests. Jails in urban areas, too, often lack outdoor space for recreation, so that many more people are interacting in close quarters before release back to their communities.
In federal immigration detention facilities, high rates of infection are also associated with high rates of admission. In fiscal year 2019, the number of new book-ins (defined as the first time a person is taken into custody by ICE, and most akin to admissions in other correctional systems) was 510,854, up from 396,448 in the previous fiscal year. The average length of stay in an immigrant detention facility in fiscal year 2019 was 34.3 days and was substantially higher for individuals arrested internally by ICE (54.5 days) relative to those apprehended at the border (26.6 days) (ICE, 2019).
While yearly prison admissions are fewer than those to jails and the average length of stay is longer (2.6 years; median time served was 1.3 years) (Carson, 2020; Kaeble, 2018), movement within and between prison facilities is still concerning under pandemic conditions. Movement throughout all correctional facilities is common as staff and incarcerated people move in and out of housing, dining, recreation, and programming areas.
___________________
3 The SEIR model discussed above by Anderson and May (1991) does not account for high throughput.
The rounds of staff, visitors, and incarcerated people can become a means for spreading the virus throughout a facility and between facilities. Once introduced into a correctional facility, the virus finds an environment in which staff and incarcerated people work and live in close quarters and are frequently inside for long periods each day. Some prisons and jails have responded by locking down and restricting movement. If people cannot interact with others outside their cells or dorms, then even if the virus does appear in one place in a facility, it will be contained in that unit and not spread to other parts of the prison or jail. Yet these measures may still fail where staff move around, bringing meals, medications, and other necessities to those who are locked in.
Overcrowding and Physical Plant of Facilities
Overcrowding is often measured by the ratio of incarcerated population in a facility to a measure of the facility’s capacity. Capacity can be measured in different ways according, for example, to the design of the prison or its operational use. Typically, higher rates of infection have been found in overcrowded facilities whose population exceeds capacity (see Chapter 3).
Each year the Bureau of Justice Statistics (BJS) reports year-end prison populations, by state, relative to three measures of prison capacity. At the highest measure of capacity, 12 states and the federal system were overcrowded in the sense that population exceeded capacity. Because the BJS figures are provided at the state level, even states that are rated under capacity may have some overcrowded prisons. Using the lowest measure of capacity, 25 states and the federal system were overcrowded. Between 26 and 44 percent of people incarcerated were held in an overcrowded jurisdiction.4
Applying similar measures to jails, the average daily incarcerated population exceeds capacity in all but two states, Virginia and West Virginia (Minton and Zeng, 2015). Data on jail overcrowding is available at the facility level from the BJS Census of Jails. The latest census in 2013 contained information on 2,931 facilities, covering most jails and temporary detention centers in the country. According to these data, 17 percent of jails reported average daily populations in excess of rated capacity. Roughly 31 percent of people incarcerated in jails are housed in overcrowded facilities.
Overcrowding presents a significant challenge to preventing and mitigating viral spread. Overcrowding may impede the flexibility that correc-
___________________
4 Note that even in systems where the total population falls short of design capacity, there may be crowding in specific facilities. For example, California’s correctional reforms greatly reduced overcrowding in lower-security institutions but had much smaller effects on higher-security facilities.
tional health care leaders need to quickly move large numbers of residents into quarantine units in response to possible COVID-19 exposures or create medical isolation units once individuals are likely exposed or sick. With overcrowding, people who are infected are often relegated to the same housing units as those who are not infected, possibly sustaining the risk of further transmission (Cloud et al., 2020).
Double or triple bunks in dormitory-style units are common in overcrowded facilities. Such units make greater use of a fixed number of sinks, toilets, and showers or congregate areas where people gather, increasing the risks of transmission. Double celling has also become common, particularly for facilities built in the 1980s and 1990s that were designed with cells for single occupancy. With as little as 20 square feet of free floor space in a cell (subtracting space for bedding, sink, and toilet) for two occupants, physical distancing is impossible.
Overcrowding not only impedes physical distancing but also makes it difficult to keep surfaces properly clean and disinfected. In some cases—as with bathrooms in crowded dorms—the number of people alone obstructs such efforts. In addition, distribution of the cleansers and other products required to keep surfaces clean is often limited. Likewise, a lack of soap, hand sanitizer (which, because of its high alcohol content, is contraband in many facilities), and even clean towels can thwart efforts at adequate hand hygiene. Moreover, correctional leaders also expressed concerns about the age of facilities, with attendant poor ventilation.
Spatial Concentration
Admissions to and releases from prisons and jails tend to be concentrated in low-income communities of color (Clear et al., 2003; Sampson, 2012; Simes, 2018b). For example, Sampson and Loeffler (2010) analyze the spatial pattern of prison incarceration in the city of Chicago and find the highest rates of incarceration in neighborhoods with the highest rates of concentrated disadvantage, measured by the local-area level of poverty, unemployment, welfare receipt, and single parenthood. The close association between incarceration and socioeconomic disadvantage persists even after accounting for neighborhood crime rates. Simes (2018b) analyzes statewide imprisonment data in Massachusetts and finds a similar concentration of incarceration in Black neighborhoods with high levels of poverty. She also finds significant pockets of incarceration outside of major urban areas, in small towns. This latter finding is consistent with other recent reports of rising jail populations in small towns and rural areas (Vera Institute of Justice, 2017).
The spatial concentration of incarceration suggests that disease may also flow from “inside out.” In this case, people who are exposed to SARS-CoV-2
in correctional facilities are returning to disadvantaged communities that are themselves struggling to respond to COVID-19 without adequate health care and social support. Previous research has examined such disease transmission from incarceration to community and found high rates of sexually transmitted diseases and mortality in local communities with high incarceration rates (Kajeepeta et al., 2020; Nowotny et al., 2020). One recent study has linked jail incarceration to COVID-19 case rates at the ZIP Code level in Chicago and across Illinois more broadly (Reinhart and Chen, 2020).
Correctional staff also provide a path for community transmission. In rural communities where many residents work in a local prison, the mechanisms for transmission from incarceration to community may be similar to those for incarcerated people who are cycling through local jails. As noted, staff move throughout a facility while at work, and they then return each day to their households and communities, potentially bringing the virus with them. With staff shortages due to illness, leaves, and vacancies, it can be difficult to implement consistent staff assignments that limit movement throughout the facility as advised by the U.S. Centers for Disease Control and Prevention (CDC) (CDC, 2020; CLA, 2020).
Health of Individuals in Prisons and Jails
Socioeconomic disadvantage, often compounded by life histories of substance use and untreated illness, form the social context for the poor health of the incarcerated population. Incarcerated people contend with high levels of chronic disease (Massoglia and Remster, 2019; Wildeman and Wang, 2017; Wildeman, Schnittker, and Turney, 2012): see Table 2-1. After controlling for other risk factors, incarcerated people have been found to have higher rates of many chronic conditions than the general population—including hypertension, asthma (Binswanger, Krueger, and Steiner, 2009; Maruschak, Berzofsky, and Unangst, 2016), and certain types of cancer (Binswanger, Krueger, and Steiner, 2009)—all of which are risk factors for COVID-19. Another risk factor is pregnancy: recent guidance from the CDC suggests that pregnant people might be at an increased risk of severe illness from COVID-19 compared to non-pregnant people.5 While systematic data are not available, Surfin and colleagues examined admissions to a geographically diverse sample of 22 state prison systems and the Federal Bureau of Prisons between 2016 and 2017 and found that an estimated 1,396 pregnant individuals were admitted (Surfin et al., 2019). An analysis of female admissions to a sample of six jails found that 1,622 individuals, or approximately 3 percent of all women admitted to the jails,
___________________
5 See https://www.cdc.gov/coronavirus/2019-ncov/need-extra-precautions/pregnancy-breastfeeding.html.
TABLE 2-1 Percentage of People Incarcerated in Prisons and Jails Who Have Ever Had a Chronic Condition, by Chronic Condition, 2011–2012
| Chronic Condition | Prison Population (%) | General Population (%)a | Jail Population (%) | General Population (%)b |
|---|---|---|---|---|
| Cancer | 3.5 | - | 3.6 | - |
| High Blood Pressure/Hypertension | 30.2 | 18.1 | 26.3 | - |
| Stroke-related Problems | 1.8 | 0.7 | 2.3 | 13.9 |
| Diabetes/High Blood Sugar | 9 | 6.5 | 7.2 | 4.5 |
| Heart-related Problems | 9.8 | 2.9 | 10.4 | 1.9 |
| Kidney-related Problems | 6.1 | - | 6.7 | - |
| Asthma | 14.9 | 10.2 | 20.1 | 11.4 |
aGeneral population estimates were standardized to match the prison population by age, sex, race, and Hispanic origin.
bGeneral population estimates were standardized to match the jail population by age, sex, race, and Hispanic origin.
SOURCE: Adapted from Maruschak, Berzofsky, and Unangst (2016, pp. 3–4).
were pregnant (Surfin et al., 2020). Extrapolating this rate to the national female jail population, the authors conclude that as many as 55,000 pregnant individuals are admitted to jails annually (Surfin et al., 2020).
A recent study of COVID-19 patients at two Michigan hospitals illustrated the additional vulnerability of those entering from the prisons compared with those from the general public (Altibi et al., 2020). This study examined clinical outcomes and mortality among 706 COVID-19 patients (108 of them were from local prisons) from March 10 to May 10, 2020. Compared to the patients from the general public, they were more likely to arrive at the hospital with severe symptoms and markers of infection, such as tachypnea, hypoxemia, and elevated inflammatory markers. The higher clinical severity among incarcerated people could reflect late reporting of symptoms or a higher threshold for or difficulties referring COVID-19 patients from a correctional facility to the hospital than that from the community. Either way, these data indicate unique issues for managing COVID-19 in correctional facilities. Furthermore, compared with the patients from the general public, larger percentages of incarcerated individuals were admitted to the intensive care unit (27% vs. 19%), required vasopressors (24% vs. 10%), and required intubation (25% vs. 15%). The incarcerated individuals
were also at approximately twice the risk of death than other patients. In this study sample, the incarcerated individuals “were younger in age, predominantly males, and had higher prevalence of chronic obstructive pulmonary disease, diabetes mellitus, underlying malignancies, and [greater comorbidity burden]” (Altibi et al., 2020, p. 13).
The aging of the incarcerated population further increases the risk of COVID-19 complications in prisons and jails. Elderly people are a relatively small fraction of the incarcerated population but because of the increase in the length of stay in prison, their proportion has grown in the period of the prison boom. From 1993 to 2013, the proportion of the population over age 55 has grown from 3.1 to 9.9 percent (Carson and Sabol, 2016). Figure 2-1 compares the age distribution of the 2018 prison population to the U.S. general population in the 2010 census. By 2018, 13 percent of men in prison and 8 percent of women were over age 55.
There is also evidence of aging in the jail population. From 1996 to 2008, the number of people incarcerated in jail aged 55 or older increased by 278 percent, compared with a 53 percent increase in the overall jail population (Beck and Berzofsky, 2010; Darrell and Beck, 1997; Greene et
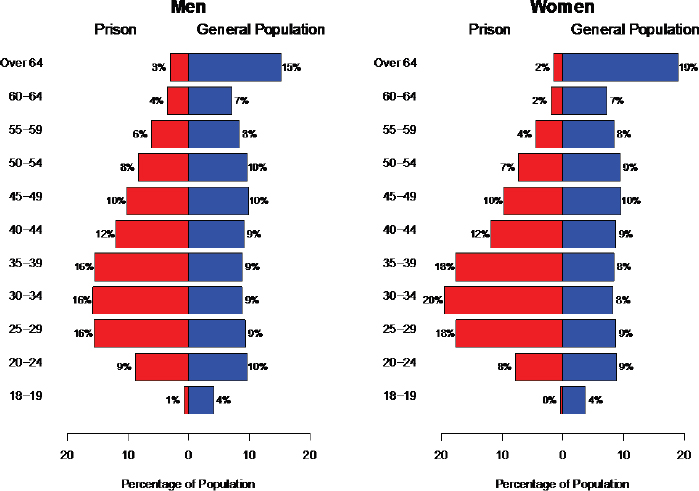
SOURCE: Data from Bureau of Justice Statistics (Carson, 2018) and 2018 population estimates from the U.S. Census Bureau.
al., 2018). An estimated 500,000 older adults are arrested and pass through jails each year (Snyder, 2012).
Correctional Health Care
All states have a constitutional obligation to provide adequate health care to incarcerated people. Regardless of size, facilities must provide means for incarcerated individuals to request medical care and be able to respond to emergencies (Rold, 2008). The nature of correctional health, and the extent to which medical care is provided on-site within the facility or off-site in the community, varies across facilities and correctional systems (NRC, 2014; Redemske, 2018). Since correctional health services fall outside of the public health infrastructure and few systems have voluntarily chosen to be accredited by existing bodies (e.g., National Commission on Correctional Health Care), the state and quality of care in correctional facilities across the nation is difficult to monitor (NRC, 2014; Rich, Allen, and Williams, 2015).
Most state prison systems handle routine medical and mental health services within the correctional facilities, and many also provide care for chronic conditions on site. Jails, which have smaller budgets and range in size, either directly employ medical staff, contract with an outside agency to provide on-site services, or partner with local public health professionals. However, incarcerated individuals are usually transported to community hospitals for emergency or specialized care (Chari et al., 2016). When incarcerated individuals are sent to local hospitals for medical care, they are accompanied by a corrections officer for security purposes (Smith, 2016).
Before the added health care demands of the pandemic, correctional health care services faced financial challenges. Recent figures indicated that health care costs accounted for up to 20 percent of correctional system budgets (Huh et al., 2017; Sridhar, Cornish, and Fazel, 2018), although per person spending varies dramatically across states. In addition to finances, other issues, such as security protocols, overcrowding, and workforce understaffing, can further limit the level of health care that a correctional system is able to provide. Delivery of care can be affected and at times constrained by security protocols (Redemske, 2018), and prison and jail overcrowding often overwhelms limited health care resources (for California, see Brown v. Plata 2010; Venters, 2019). Nonetheless, correctional health care often provides much needed medical attention to those who have been unable to seek care in their communities (NRC, 2014; Rich, Allen, and Williams, 2015).
During the COVID-19 pandemic, correctional heath care providers have been asked to do even more—screening incarcerated persons and staff, administering tests on a regular basis, and responding quickly and safely to those with symptoms. While correctional health care tends to have access to emergency medical equipment to treat a few patients in
respiratory distress, widespread outbreaks can overwhelm the resources available in a facility. Facilities may lack enough emergency medical supplies to treat large numbers of incarcerated people, and understaffing complicates the ability to care for people in corrections as well as to transport them to outside hospitals for more intensive care (Williams et al., 2020). Moreover, some correctional systems rely on outside vendors or community health systems for SARS-CoV-2 diagnostic testing, and incarcerated people are not prioritized. Some facilities do not have sufficient budgetary resources needed for additional testing equipment or personal protective equipment. Many correctional health systems rely on paper medical records, which slows identification of those who are at high medical risk for COVID-19 (Goldstein, 2014; Williams et al., 2020). Furthermore, copayments required to seek medical care may deter some incarcerated people from reporting symptoms (Montoya-Barthelemy et al., 2020; Wyant and Harner, 2018).
The net result of these dynamics is that while correctional facilities are in a position to provide medical care to those incarcerated there are many challenges to doing so, even under normal operations. When COVID-19 outbreaks occur, many correctional facilities will likely turn to community-based health resources and hospitals for assistance and treatment of those infected, which in turn will further stress these community health systems during the pandemic.
THE SCOPE OF THE OUTBREAK
To accurately describe the full extent of the COVID-19 pandemic in correctional facilities is difficult given the large variability in testing practices, testing rates, and data reporting and transparency across the country. Comprehensive data on testing rates have not been available, and testing rates in both correctional facilities and the overall population have been uneven, with some facilities early in the pandemic testing no one or only symptomatic persons. For instance, testing rates can only be calculated for states that provide data relevant to the number of people tested, and only a handful of states provide such data. Other states only give data on the total number of tests completed, and others do not provide enough detail to interpret their testing numbers. The reporting of testing data has not been standardized, and testing efforts have been uneven, with some states engaging in robust mass testing and others testing very little. Community testing practices and data reporting were also variable, making comparisons all the more challenging.
The data we present here are from the COVID Prison Project (CPP), which scraped public-facing websites of correctional facilities for data on 53 prison systems (50 states, Puerto Rico, the Federal Bureau of Prisons, and ICE) and select jails with regular reporting. Research staff at CPP con-
firmed the quality of the data and their interpretation, and tracked how reporting changed daily. CPP relied on officially reported data from correctional systems, which may be subject to inaccuracies and reporting delays.
With these caveats, higher transmission rates in prison appear to be reflected in the COVID-19 case rates among incarcerated people and staff compared to the general population: see Figure 2-2. (The case rate is the number of people testing positive for the SARS-CoV-2 virus that causes COVID-19 divided by the total population in question, such as the prison population, the staff population, or the general population.) At the end of April 2020, people incarcerated in prisons and prison staff had similar case rates. During the first week of May, as testing increased after multiple outbreaks, case rates among people incarcerated in prisons began to grow at much higher rates relative to staff. While we are unable to appropriately adjust for testing in prison and in the community with the available data, the cumulative case rate among incarcerated persons was about five times higher than in the general population by the end of August 2020, and the rate for staff was about three times higher. Similar incarceration-community differences have also been reported for Massachusetts and at the national level (Jiménez et al., 2020; Saloner et al., 2020).
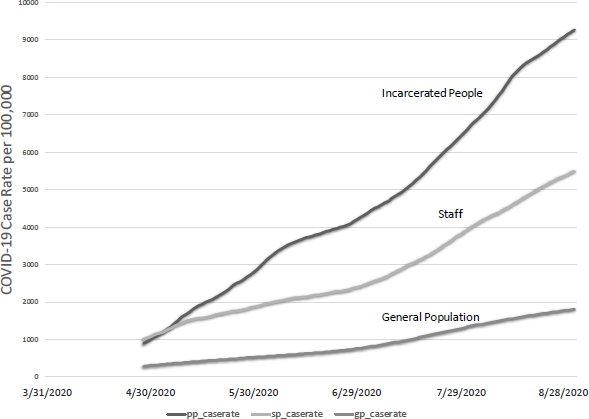
NOTES: Case rates: pp, incarcerated people; sp, staff; gp, general population. Testing capabilities and frequency vary across states and facilities.
SOURCE: Data from COVID Prison Project (2020).
As of August 31, 2020, there is large variation in case rates across state jurisdictions: see Figure 2-3 and Table 2-2.6 Compared to a national case rate in the general population of under 2 percent, the highest COVID-19
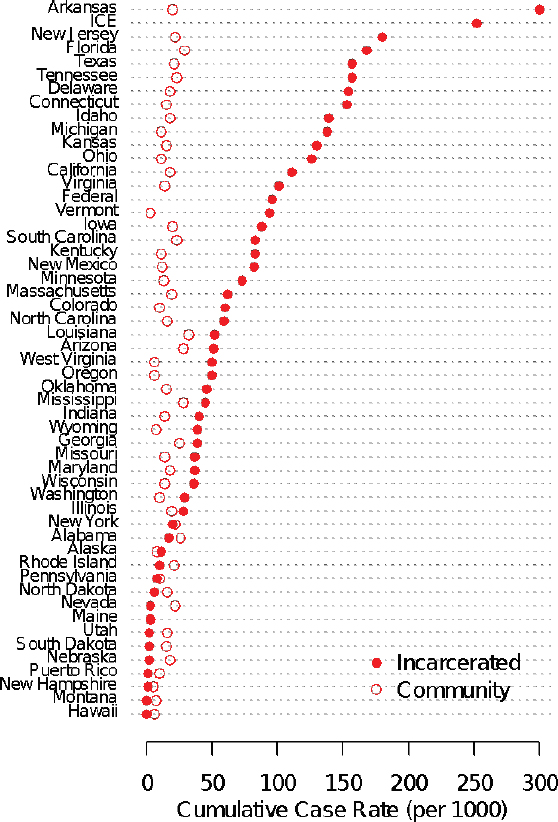
NOTE: Testing capabilities and frequency vary across states and facilities.
SOURCE: Data from COVID Prison Project (2020).
___________________
6 For the state data, we examined whether the cumulative rate was related to the extent of testing, but the correlation between the case rate and the testing rate was not significant and only modestly positive, r = 0.26.
case rate in prisons was found in Arkansas, where 30 percent of the prison population tested positive. During this time, Arkansas used molecular testing for COVID-19 and underwent mass testing in facilities that were in outbreak status. Another seven states reported case rates of around 15 percent or higher. A few state correctional systems (Alaska, Hawaii, Montana, Nebraska, Nevada, Maine, and Vermont) kept infection levels below 10 per 100,000. Among larger states, only Pennsylvania kept infection at a similarly low level. Pennsylvania used molecular testing for COVID-19 and has also engaged in mass testing across many facilities. Like the national figures, we have not adjusted for differences in testing between prison and community at the state level. Improving the quality and availability of data on COVID-19 testing and cases, as well as information on facilities’ mitigation strategies, is a significant research priority for understanding the different outcomes across correctional facilities during the pandemic.
TABLE 2-2 COVID-19 Cumulative Prevalence, Test Positivity Rate, and Mortality Rate of Incarcerated People, by State and Federal Jurisdiction, as of August 31, 2020
| Jurisdiction | Cumulative Prevalence (per 1,000) | Test Positivity Rate (%) | Mortality Rate (per 10,000) | Case Fatality Rate (%) |
|---|---|---|---|---|
| BOP | 96 | 24.99 | 9 | 0.96 |
| ICE | 252 | 20.01 | 2 | 0.09 |
| Alabama | 17 | 21.56 | 10 | 5.85 |
| Alaska | 11 | 1.06 | - | - |
| Arizona | 51 | 9.55 | 7 | 1.35 |
| Arkansas | 300 | 32.17 | - | - |
| California | 111 | 12.20 | 6 | 0.54 |
| Colorado | 60 | 3.02 | 2 | 0.34 |
| Connecticut | 153 | - | 7 | 0.47 |
| Delaware | 154 | - | 29 | 1.89 |
| Florida | 168 | 19.77 | 10 | 0.57 |
| Georgia | 39 | - | 11 | 2.76 |
| Hawaii | 0 | 1.06 | 0 | 0.00 |
| Idaho | 139 | 19.96 | 2 | 0.16 |
| Illinois | 28 | - | 4 | 1.44 |
| Indiana | 40 | 26.19 | 8 | 2.06 |
| Iowa | 88 | 6.78 | 4 | 0.46 |
| Kansas | 130 | - | 4 | 0.28 |
continued
TABLE 2-2 Continued
| Jurisdiction | Cumulative Prevalence (per 1,000) | Test Positivity Rate (%) | Mortality Rate (per 10,000) | Case Fatality Rate (%) |
|---|---|---|---|---|
| Kentucky | 83 | - | 11 | 1.37 |
| Louisiana | 52 | 29.37 | 8 | 1.51 |
| Maine | 3 | 0.29 | - | - |
| Maryland | 37 | 3.53 | 4 | 1.01 |
| Massachusetts | 62 | 5.00 | 11 | 1.85 |
| Michigan | 138 | 13.59 | 19 | 1.35 |
| Minnesota | 73 | 1.62 | 3 | 0.36 |
| Mississippi | 45 | 34.97 | 1 | 0.19 |
| Missouri | 37 | 3.52 | 0 | 0.11 |
| Montana | 0 | 0.09 | - | - |
| Nebraska | 2 | 1.15 | - | - |
| Nevada | 3 | - | - | - |
| New Hampshire | 1 | 1.32 | - | - |
| New Jersey | 180 | 23.06 | 30 | 1.66 |
| New Mexico | 82 | 4.32 | 6 | 0.78 |
| New York | 20 | 8.83 | 5 | 2.25 |
| North Carolina | 59 | 5.61 | 3 | 0.54 |
| North Dakota | 6 | - | 0 | 0.00 |
| Ohio | 126 | 23.53 | 19 | 1.53 |
| Oklahoma | 46 | 8.17 | - | - |
| Oregon | 50 | 19.43 | 3 | 0.70 |
| Pennsylvania | 8 | 2.76 | 3 | 3.61 |
| Puerto Rico | 1 | - | 1 | 14.29 |
| Rhode Island | 10 | 1.37 | - | - |
| South Carolina | 83 | - | 2 | 0.27 |
| South Dakota | 2 | 2.58 | 0 | 0.00 |
| Tennessee | 157 | 13.99 | 4 | 0.26 |
| Texas | 157 | 10.64 | 14 | 0.87 |
| Utah | 2 | 1.14 | 0 | 0.00 |
| Vermont | 94 | 8.10 | - | - |
| Virginia | 101 | - | 5 | 0.52 |
| Washington | 29 | 9.99 | 1 | 0.45 |
| West Virginia | 50 | 4.33 | 0 | 0.00 |
| Wisconsin | 36 | 2.50 | - | - |
| Wyoming | 39 | 3.30 | - | - |
NOTES: BOP, Federal Bureau of Prisons; ICE, U.S. Immigration and Customs Enforcement. Testing capabilities and frequency vary across states and facilities.
SOURCE: Data from COVID Prison Project (2020).
Similar data on the crude case rates of COVID-19 infection among prison staff are available for nearly all states: see Table 2-3. States with high rates of COVID-19 infection among the incarcerated population have tended to have high rates of COVID-19 infection among staff; this includes jurisdictions such as Texas, New Jersey, and Florida. Across all 50 jurisdictions for which data are available (including Puerto Rico, the federal system, and ICE detention), the staff infection rate correlates at r = 0.5 with the infection rate for the incarcerated population. By this measure, the health of prison staff is closely related to the well-being of the incarcerated population (COVID Prison Project, 2020).
TABLE 2-3 COVID-19 Cumulative Prevalence and Mortality Rate for Correctional Staff by State and Federal Jurisdiction, as of August 31, 2020
| Jurisdiction | Cumulative Prevalence (Per 1,000) | Mortality Rate (Per 10,000) |
|---|---|---|
| BOP | 41 | 0 |
| ICE | - | - |
| Alabama | 103 | 6 |
| Alaska | 0 | - |
| Arizona | 71 | - |
| Arkansas | 86 | - |
| California | 47 | 2 |
| Colorado | 21 | - |
| Connecticut | 63 | - |
| Delaware | 80 | - |
| Florida | 101 | - |
| Georgia | 85 | 2 |
| Hawaii | - | - |
| Idaho | 46 | - |
| Illinois | 51 | - |
| Indiana | 63 | 3 |
| Iowa | 43 | - |
| Kansas | 53 | 8 |
| Kentucky | 52 | 3 |
| Louisiana | 102 | 13 |
continued
TABLE 2-3 Continued
| Jurisdiction | Cumulative Prevalence (Per 1,000) | Mortality Rate (Per 10,000) |
|---|---|---|
| Maine | 0 | - |
| Maryland | 54 | 1 |
| Massachusetts | 21 | - |
| Michigan | 34 | 2 |
| Minnesota | 26 | 0 |
| Mississippi | 40 | - |
| Missouri | 27 | 0 |
| Montana | 2 | - |
| Nebraska | 26 | - |
| Nevada | 40 | 4 |
| New Hampshire | 8 | - |
| New Jersey | 122 | - |
| New Mexico | 2 | 0 |
| New York | 69 | 3 |
| North Carolina | 4 | 1 |
| North Dakota | 28 | 0 |
| Ohio | 86 | 4 |
| Oklahoma | 29 | - |
| Oregon | 42 | - |
| Pennsylvania | 16 | 1 |
| Puerto Rico | 4 | - |
| Rhode Island | 16 | - |
| South Carolina | 77 | 2 |
| South Dakota | 12 | 0 |
| Tennessee | 55 | 2 |
| Texas | 147 | 7 |
| Utah | 2 | - |
| Vermont | 21 | - |
| Virginia | 7 | - |
| Washington | 97 | 7 |
| West Virginia | 20 | 0 |
| Wisconsin | 18 | - |
| Wyoming | 20 | - |
NOTES: BOP, Federal Bureau of Prisons; ICE, U.S. Immigration and Customs Enforcement. Testing capabilities and frequency vary across states and facilities.
SOURCE: Data from COVID Prison Project, 2020.
Data on COVID-19 infections in jails are more limited than the comparable data for prisons. Each individual jail has made its own decisions about whether to test for COVID-19 and the collection and reporting of data on COVID-19 testing, infection rates, and deaths. Data on county and jail cumulative case rates are reported by CPP. From the limited information on cases in 41 jails, there is a correlation between the size of the jail population and the COVID-19 case rate per 1,000 (r = 0.41, p = 0.008). The five largest jails in the CPP dataset are in Los Angeles County, Harris County, Dallas County, Cook County, and Maricopa County. Each of these large jails has a higher reported case rate relative to the surrounding county, although this difference varies from 7 to 343 per 1,000. Overall, data from the available jails show a similar pattern to prisons, where COVID-19 crude case rates are often higher than in the surrounding county (see Figure 2-4).
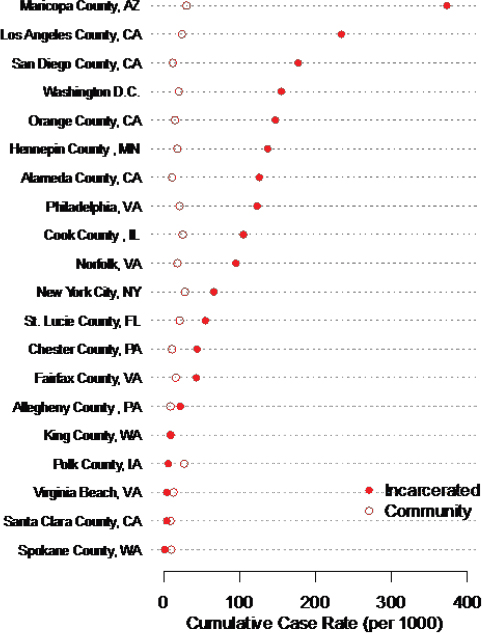
NOTE: Testing capabilities and frequency vary across counties and facilities.
SOURCE: Data from COVID Prison Project (2020).
Data on COVID-19 infection in ICE facilities are also reported less consistently relative to prison data. Based on available data, there appears to be a high level of COVID-19 infection in ICE facilities. The cumulative case rate indicates that nearly a quarter of all immigration detainees had tested positive as of August 31, 2020. This case rate is more than three times higher than the average case rate in state prison systems.
Another indicator of the extent of the pandemic in correctional facilities is given by the death rate. The adjusted COVID-19–related death rate in the prison population was three times higher than would be expected if the age and sex distributions of the U.S. and prison populations were equal (Saloner et al., 2020). By the end of September 2020, there were 1,170 reported deaths among people in prison or ICE detention as a result of COVID-19 and 83 reported COVID-19–related deaths among prison staff across 19 prison systems (COVID Prison Project, 2020; UCLA Law COVID Behind Bars Data Project7). The highest staff mortality rate has been reported by Louisiana, although Texas has reported the highest number of deaths. However, there is much unknown about deaths among staff and incarcerated people. Most states do not report demographic information, the circumstances that led to death, or where the death occurred. For instance, when someone dies in the hospital versus in the correctional facility, it is unclear how this death is counted. In addition, there are no available data tracking the number of excess deaths that could be attributed to avoiding care within correctional facilities.
Notably, there is also no systematic collection of data on racial and ethnic differences in the COVID-19 case rates, testing, or deaths in jails and prisons and among released cohorts. Only four states—Vermont, Tennessee, Massachusetts, and Washington—are proactively reporting any demographic data on their COVID-19 testing or case counts among incarcerated people. As COVID-19 cases among incarcerated people continue to climb, racial and ethnic differences in disease prevalence remain unclear (see, e.g., Guo, 2020). See Chapter 5 for a detailed discussion of data and research needs.
Given the movement of those incarcerated as well as staff between correctional facilities and local communities, the committee believes the COVID-19 risk in communities may be tied to the COVID-19 risk in correctional facilities. Drawing from past research on transmission of infectious diseases, transmission from correctional facilities may be spatially concentrated in the small number of communities from which prison and jail populations are disproportionately drawn (Ndeffo-Mbah et al., 2018). Few studies have examined COVID-19 disease transmission dynamics be-
___________________
7 See https://law.ucla.edu/academics/centers/criminal-justice-program/ucla-covid-19-behindbars-data-project.
tween communities and correctional facilities, although one paper on a Cook County Jail in Chicago, Illinois, reports that jail population churn was a significant predictor of COVID-19 cases at the ZIP Code level, accounting for 55 percent of the variance across ZIP Codes in Chicago and 37 percent of the variance in all of Illinois. Moreover, jail population turnover was the most significant predictor of variance in COVID-19 infection, exceeding race, poverty, public transit use, and population density (Reinhart and Chen, 2020).
Although the data limitations are formidable, the available figures reported by public health authorities and penal facilities have three main implications: (1) there is great heterogeneity in COVID-19 case rates across states; (2) in some jurisdictions, the extent of infection among the incarcerated population appears to be significantly greater than that in the community; and (3) better data on testing and methods are needed in order to accurately monitor the relative risk of incarcerated populations compared with the general population.
MITIGATING TRANSMISSION IN CORRECTIONAL FACILITIES
There have to date been very few studies on how to best mitigate COVID-19 transmission in correctional facilities, although a number of papers have examined similar settings, such as homeless shelters, or how prisons have managed highly infectious respiratory diseases in the past (Beaudry et al., 2020; Mosites et al., 2020). A recent systematic review (Beaudry et al., 2020) identifies nine main themes for managing past infectious disease outbreaks in correctional settings, which are relevant to the COVID-19 pandemic: multi-agency collaboration, health communication, screening for contagious diseases, isolation and quarantine, contact tracing, immunization programs, surveillance, prison-specific guidelines, and population restriction. We discuss some these strategies in greater detail in Chapter 5. The review also identifies depopulation as an important strategy (part of population restriction) to be considered as part of pandemic management.
In one of the few studies of a COVID-19 outbreak in a penal facility, Malloy and colleagues (2020) analyze data from a large urban jail system to estimate the effect of certain mitigation strategies in reducing COVID-19 transmission during an ongoing outbreak. The authors draw upon data provided by the jail during a large outbreak on the infection rates of incarcerated people and staff, as well as drawing point-estimate ranges of parameters from extant research (Puglisi et al., 2020). Using a calibrated SEIR model (see above), they estimate Re at this particular local facility during four phases coinciding with differences in facility policy. These phases included (1) the start of the pandemic, (2) a period following a reduction in the jail popula-
tion following a decline in admissions, (3) a period following the greater use of single-celling to house incarcerated people, and (4) a period after the jail began to implement testing for asymptomatic infection. During phase 2 (days 12–17), the jail population started to decrease by 1.41 percent each day through a combination of measures that included a marked decrease in new detentions given changes in the court and judicial system procedures and large community organized bail payments. During phase 3 (days 18–36), the jail began increasing the portion of the population in single-occupancy cells from 26 percent on day 18 to 54 percent on day 36; and during phase 4, asymptomatic testing began and 18 percent of the reported daily incidence of positive COVID-19 tests among the incarcerated population was asymptomatic.
The authors estimate that between the start of the pandemic and the final period corresponding to the implementation of the four policy options, in addition to CDC recommendations that included masking, staff training, and sanitary procedures, Re declined from the high level of 8.23 to only 0.45. Depopulation enabled the jail to move nearly 70 percent of residents in single cells, rather than the 5 percent at the beginning of the outbreak, which reduced infections and hospitalizations by more than 60 percent. Another observational study of Massachusetts jails and prisons supports that depopulation is associated with lower facility case rates and found that facilities with smaller reductions in incarcerated populations demonstrated higher rates of confirmed cases (Jiménez et al., 2020).
Recent research has also explored how correctional facility characteristics, specifically facility capacity and staffing, influence COVID-19 transmission and deaths. Vest and colleagues used data from 103 state prisons of the Texas Department of Corrections to identify “latent class profiles,” or groups of facilities which are similar based on the outcomes of incarcerated resident COVID-19 cases, staff COVID-19 cases, and incarcerated resident COVID-19 deaths. Three distinct groups of Texas prisons were identified: a low outbreak profile, a high outbreak profile, and a high death profile. Low outbreak prisons were, on average, at 85 percent of capacity, while the high death and high outbreak profiles averaged 94 percent and 102 percent capacity, respectively. In addition, the current number of employees significantly predicted membership in the high outbreak and high death profiles compared to the low outbreak profile. Age of operation for a prison was no different among the three profiles. Vest et al. (2020) conclude that housing persons at 85 percent of prison capacity may reduce the risk of infection and death related to COVID-19.
While limited in scope, these studies suggest that decarceration may facilitate other important prevention and mitigation strategies, especially single-celling, and cohorting, where confirmed COVID-19 cases are housed together and isolated. The legal, epidemiological, and ethical arguments for decarceration are described in Box 2-2.
CONCLUSION
This chapter has reviewed five features of the correctional system that limit the ability of jails and prisons to protect those incarcerated and correctional staff during the pandemic and likely amplify virus transmission within these settings and to local communities. These features include high rates of admissions and releases (particularly in jails), overcrowding (particularly in older facilities), the spatial concentration of incarceration predominantly in low-income communities of color, the health vulnerabilities of the incarcerated population, and the underresourced correctional health system. While the data from jails, prisons, and other facilities are far from complete, the available information points to cumulative COVID-19 cases and mortality rates among incarcerated people that are significantly higher than in the general population.
Prison and jail staff also have experienced substantially higher rates of COVID-19 infection relative to surrounding communities. These rates coupled with the current conditions of most correctional facilities create significant demands on correctional staff and correctional and community health resources. Emerging research suggests that decarceration can be an effective strategy for mitigating transmission inside correctional facilities. Decarceration is likely to reduce the impacts of overcrowding, facilitate other mitigation strategies (e.g., physical distancing, quarantines), and reduce demands on limited health care resources. The next chapter reviews existing legal mechanisms for decarceration and efforts made by jurisdictions to depopulate jails and prisons during the pandemic.


