Table of Contents
Table of Contents
Estimating Baseline Material Technology
Opportunities for Polymer Composites
Material Mass Reduction Percentages used in this Study
Understanding the Cost of Lightweighting
Cost of Materials and Manufacturing
Factors Affecting Automaker Lightweighting Targets
Method for Estimating Material Distribution
Material Roadmap and Incremental Cost ($/kg) – Unibody Vehicles
Material Roadmap and Incremental Cost ($/kg) – Body-on-Frame Vehicles
List of Figures
Figure 1: Generic Mass-Reduction Cost Curve
Figure 2: Hot-Rolled Steel Price Trend
Figure 3: Aluminum Price Trend
Figure 4: Factors affecting CF and CFRP Cost or Price
Figure 5: 2020 Baseline vehicle material distribution - Unibody
Figure 6: 2020 Baseline vehicle material distribution - Body-on-Frame
Figure 7: Material Penetration for each Scenario - Unibody Vehicles
Figure 8: Technology Pathway and Relative Cost for Unibody Cars and SUVs
Figure 9: Technology Pathway and Relative Cost for Body-on-Frame Vehicles
List of Tables
Table 1: Vehicles studied for baseline material analysis
Table 2: Materials in MY2020 versus MY2016
Table 3: Curb weight and Footprint Comparison: current model year 2020 vs previous model year 2016
Table 4: Drivers that will govern the importance of ligthweighting in the 2025-2035 timeframe
Table 5: Mass Reduction Potential of Materials
Table 6: Mass Reduction percentages of each material used for this project
Table 7: High and Low-Cost Scenarios for Materials 2025-2035
Table 8: Manufacturing cost and learning
Table 9: Manufacturing Cost with Learning ($/kg) for key years
Table 10: LOW Total Cost $/kg range (material + processing)
Table 11: HIGH Total Cost $/kg range (material + processing)
Table 12: High and Low Definitions for Selected Variables
Table 13: Expected Variable Value for Select Years
Table 14: Scenarios for Unibody Vehicles
Table 15: Cost and Mass Reduction Analysis for Unibody Vehicle Scenarios
Table 16: Scenarios for Body-on-Frame vehicles
Table 17: Cost and Mass Reduction Analysis for Body-on-Frame Vehicle Scenarios
Glossary
Steel Grades
| Category | Acronym | Description | Ultimate Tensile Strength (MPa) Range |
|---|---|---|---|
| Low Strength (LSS) | Mild | Mild Steel | Less than 270 |
| High Strength Steels (HSS) | IF | Intersitial Free | 410-420 |
| BH | Bake Hardenable | 340-400 | |
| HSLA | High-Strength Low Alloy | 450-780 | |
| Advanced High Strength Steels (AHSS) | DP | Dual Phase | 440-1270 |
| FB | Ferritic-bainitic (SF - stretch flangeable) | 450-600 | |
| CP | Complex Phase | 800-1470 | |
| MS | Martensitic | 1200-1500 | |
| Ultra High Strength Steels (UHSS) | TRIP | Transformation-induced plasticity | 600-980 |
| HF | Hot-formed (boron) | 480-1900 | |
| TWIP | Twinning-induced plasticity | 900-1200 |
Aluminum Grades
| Category | Series | Acronym |
|---|---|---|
| Commercially Pure Aluminum | 1xxx | Al |
| Heat-Treatable Alloys | 2xxx, 6xxx, 7xxx | Al |
| Non Heat-Treatable Alloys | 3xxx, 4xxx, 5xxx | Al |
Acknowledgments
The authors of this report thank the industry experts from various companies that provided data for this research. Our special thanks to the National Academies of Sciences, Engineering, and Medicine (NASEM) Committee to entrust CAR to conduct this research.
Companies which contributed data to this study include:
- American Chemistry Council
- American Iron and Steel Institute
- ArcelorMittal
- Automotive Aluminum Advisors
- BASF
- Ducker Worldwide
- Fiat Chrysler Automobiles
- Ford Motor Company
- General Motors
- Hexion
- Nissan
- Novelis
- The Aluminum Association
- U.S. Steel
Sincerely
Bailo, Modi, Schultz, Fiorelli, Smith, Snell
For citations and reference to this publication, please use the following:
Bailo, C., Modi, S., Schultz, M., Fiorelli, T., Smith, B., & Snell, N. (2020). (publication). Vehicle Mass Reduction Roadmap Study 2025-2035. Ann Arbor, MI: Center for Automotive Research.
Background and Objective
The National Academies of Sciences, Engineering, and Medicine (NASEM) Committee on Assessment of Technologies for Improving Fuel Economy of Light-Duty Vehicles, Phase 3 is tasked by The National Highway Traffic Safety Administration (NHTSA) with providing estimates of the potential cost, fuel economy improvements, and barriers to deployment of technologies for improving fuel economy in 2025-2035 light-duty vehicles. The National Academies Committee is currently investigating the state of vehicle mass reduction technology readiness and the impact of mass reduction on fuel economy while maintaining vehicle performance and safety requirements.
The reduction of in-use GHG emissions from light-duty passenger vehicles presents a vital opportunity to minimize motor vehicles’ environmental impact. Vehicle mass reduction is one pathway to reduce vehicle emissions while improving performance. Considerable resources have been expended by the regulators trying to estimate the lowest cost feasible for the mass reduction of light-duty vehicles. Detailed teardown and cost studies performed by reputable engineering firms have aggressively approached lightweighting on a handful of vehicles, producing several innovative ideas. However, automakers respond by pointing out that there are risks, business constraints, and customer requirements that these studies do not address. Further, extrapolating the results from one or a few teardown studies to over 1,000 vehicle models for sale in the U.S. market is inappropriate. The task of assessing mass reduction trends is critical and challenging.
The Center for Automotive Research (CAR) was hired under contract by NASEM to study vehicle mass reduction for model years 2025-2035. Over the past decade, CAR has been a leader in light-duty vehicle mass reduction research. CAR has done work on assessing the real-world barriers to implementing mass reduction technologies (J. Baron, 2016). CAR also worked with nine global vehicle manufacturers to examine material trends over the next decade (Baron & Modi, 2016). The project still stands as one of the most cooperative and thorough analyses done to date. CAR collected data on 42 vehicles from 4 segments representing 50 percent of the U.S. light-duty fleet. Most recently, CAR has published a Materials and Manufacturing Technology Roadmap (Modi & Vadhavkar, 2019) that examined the likely penetration of materials for the automotive body-in-white.
The objective of this Study is as below:
- Describe the available opportunities for shifts in vehicle body-in-white and closure material application in vehicle model years (MY) 2025-2035.
- Estimate mass-reduction opportunity by each segment in MY2025, MY2030, MY2035, keeping in mind technology readiness, automaker development plans, SME opinion, and CAFE/GHG regulations.
- Based on mass reduction opportunities, create scenarios for possible material penetration by each vehicle type.
- Use the scenarios to estimate the incremental costs for mass reduction opportunities.
Research Approach
The project’s research relies on CAR material and manufacturing roadmaps, publications by other organizations, and information collected through several automaker and supplier interviews. Data sources include, but are not limited to:
- Vehicle repair manuals
- Conference presentations
- NHTSA and EPA sponsored vehicle lighweighting studies
- SAFE Rule: Final Regulatory Impact Analysis
- Automaker and supplier interviews
The research focuses on vehicle body-in-white and closures for primary mass reduction opportunities. Powertrain mass-reduction is considered only for calculating mass decompounding opportunities. The baseline for this project is the U.S. MY2020 light-duty vehicle fleet.
Estimating Baseline Material Technology
The baseline model year for this research is 2020. There are hundreds of different vehicles (nameplates) in the U.S. fleet. Studying the material technology of every vehicle is not practical. Moreover, material information is not readily available in public databases. Therefore, CAR researchers decided to investigate the top-selling vehicles in the U.S. fleet. Table 1 lists the vehicles studied to establish the baseline material technology. The segments are the same as defined by NHTSA.1 These 33 vehicles represent greater than 50 percent of the U.S. vehicle sales in 2019. This reports refer to these vehicles as the baseline fleet.
Table 1: Vehicles studied for baseline material analysis
| Small Car | Mid-Size Car | Small SUV | Mid-Size SUV | Pickup |
|---|---|---|---|---|
| Honda Civic Honda Accord Hyundai Elantra Nissan Altima Nissan Sentra Toyota Camry Toyota Corolla |
Ford Fusion Tesla Model 3 |
Jeep Wrangler Chevy Equinox Ford Escape Edge CR-V Tucson Cherokee Compass CX-5 Rogue Outback Forester Rav4 |
Traverse Pacifica Explorer Pilot Grand Cherokee Highlander |
Silverado Ram Pickup F Series Sierra Tacoma |
___________________
1 NHTSA further categorizes vehicles in mass market and performance for each segment.
Analysis of the baseline fleet (the 33 vehicles) revealed that 73 percent of the vehicles were redesigned (generation change) after MY2016. According to vehicle production forecasts by IHS Markit Inc., 40 percent of the baseline fleet vehicles are expected to be redesigned by MY2025.
CAR researchers referred to the vehicle repair manuals to study the materials used in the baseline fleet. The repair manuals are published for the collision repair shops to inform them about the vehicles’ materials used in the critical structural components. Most repair manuals contain information on safety-critical body-in-white (BIW) and closure parts. In a 2016 CAR study (Baron & Modi, 2016), the researchers identified key components essential to understand mass-reduction (M.R.) initiatives. The research team studied the materials used in these components for the baseline fleet vehicles (using repair manuals). Table 2 shows the materials used in the MY2020 baseline fleet versus the materials identified for the same components for the five percent mass-reduction level in the 2016 CAR study.2
Table 2: Materials in MY2020 versus MY2016
| Components | MY2020 baseline fleet | 2016 study: 5% M.R. level |
|---|---|---|
| Fender | BH Steel and Aluminum (50:50) | HSS/BH Steel |
| A-pillar | UHSS 1500 Hot Formed | UHSS HF Steel |
| Floor | HSS 440-590 with UHSS Reinforce. | Mild with AHSS |
| Front Bumper Structure | Mostly Aluminum with some Steel | Aluminum |
| Roof Panel | Mild/B.H. Steel | Mild Steel |
| Door Outer | LSS And Aluminum | B.H. Steel and Aluminum |
| Hood | 95% Aluminum | Aluminum |
| Decklid | LSS, Al, Mag, Comp. | B.H. Steel and Aluminum |
| Engine Cradle/Front frame | LSS 400-600 | HSLA |
| Steering Knuckle | HSS 400-500 And Aluminum | Aluminum |
| IP Beam | HSS And Two Magnesium | AHSS |
Source: CAR Research, Vehicle repair manuals
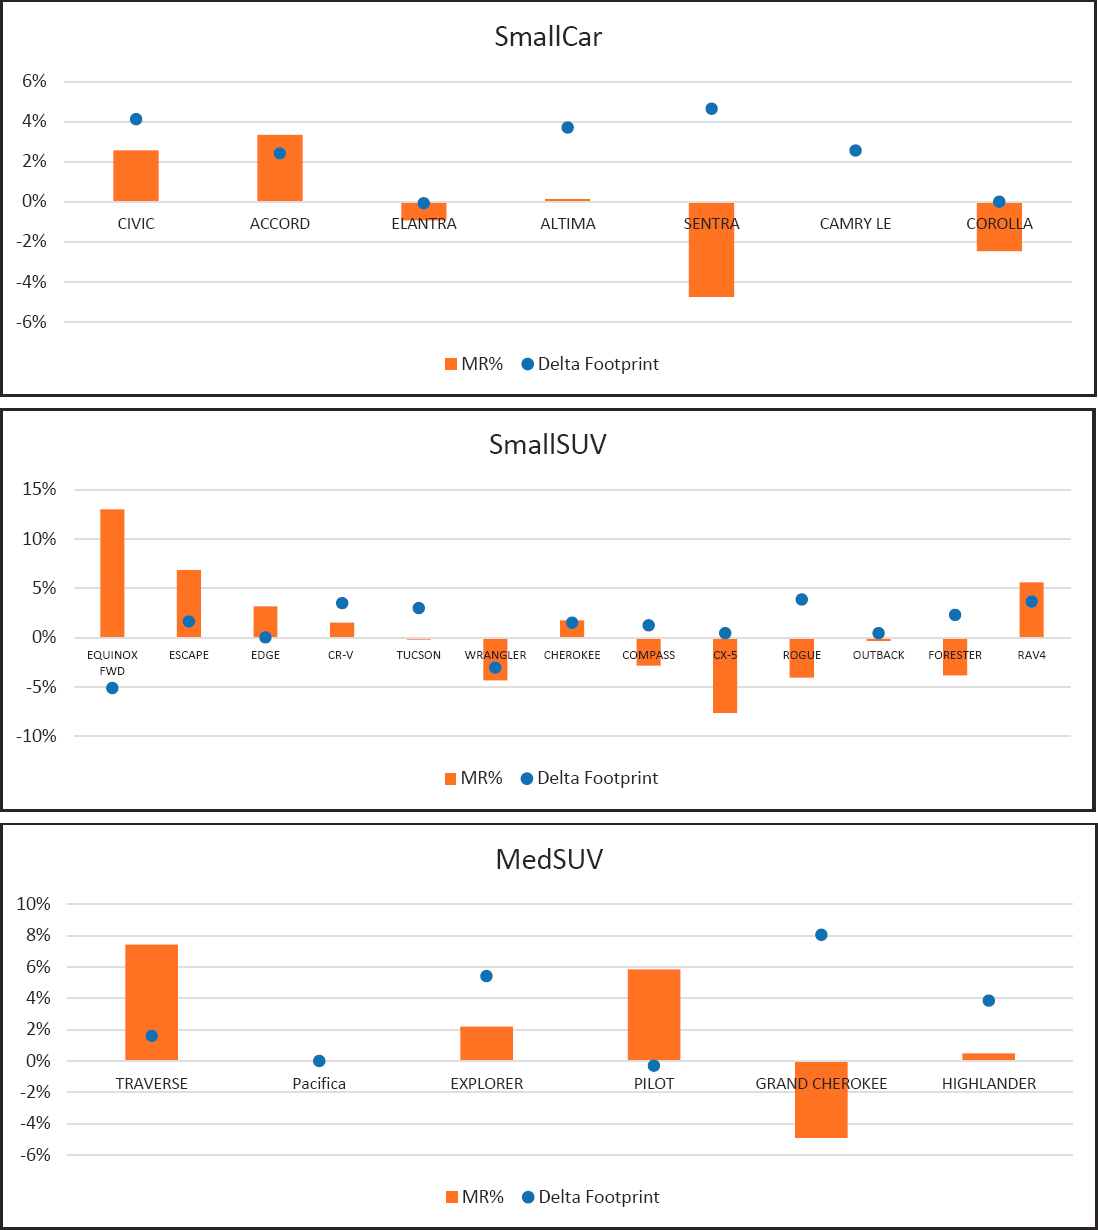
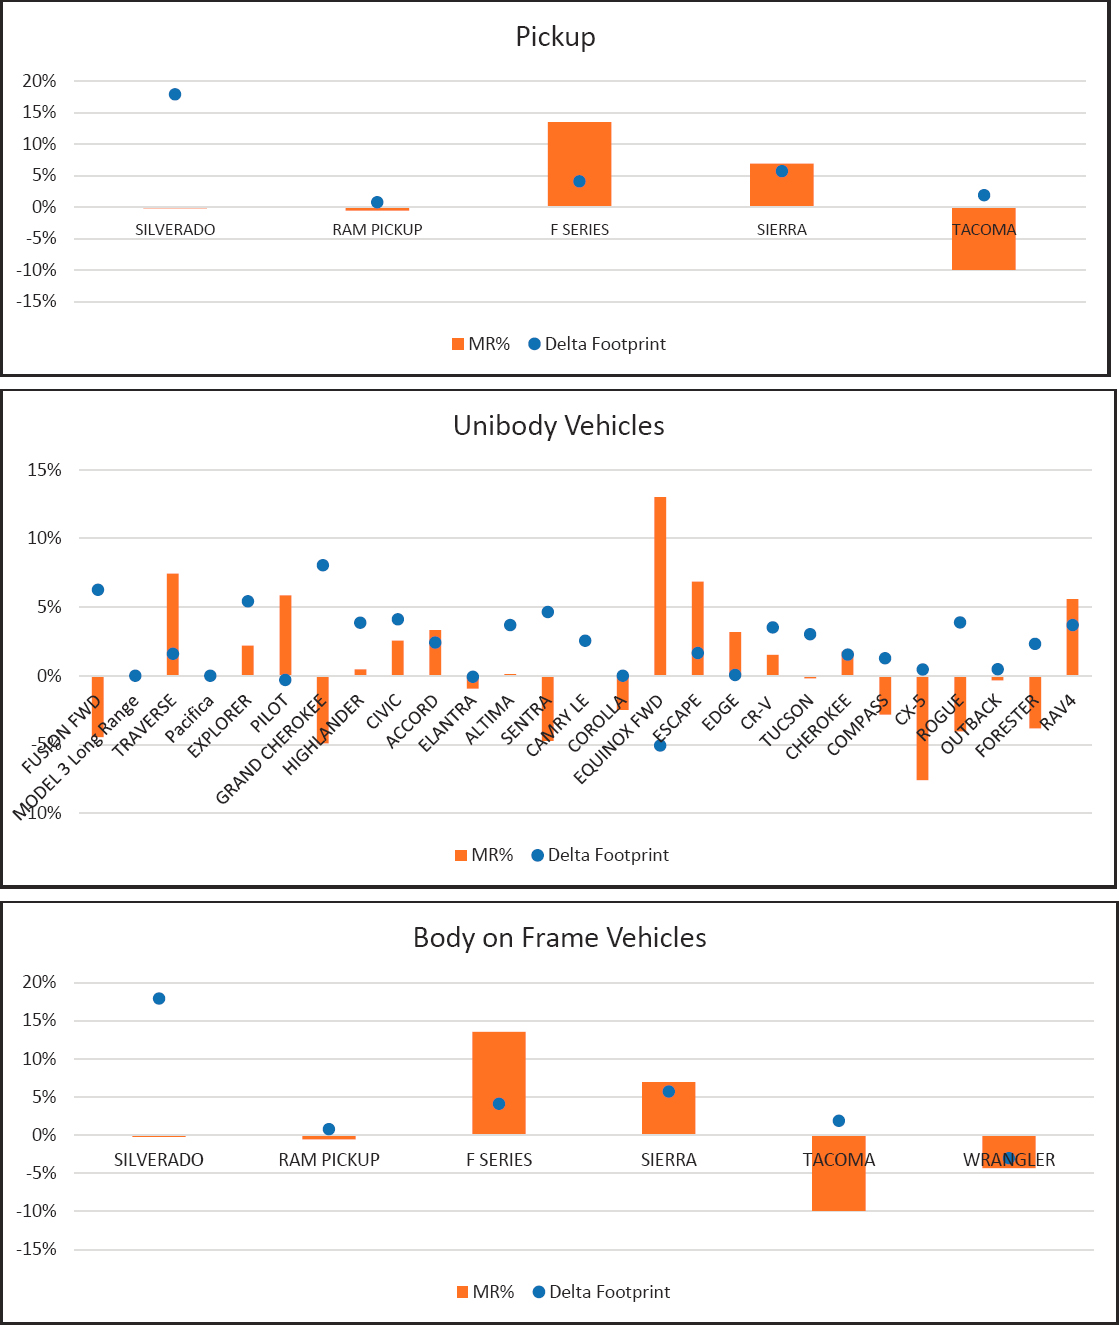
Material analysis suggests that the MY2020 fleet has advanced material technologies that should result in around five percent lighter curb weight than the MY2016 baseline. However, this does not tell the entire story. CAR researchers compared the actual curb weights and footprints of the MY2020 to the MY2016 vehicles (see Appendix A). As shown in Table 3, the finding confirms that the real world curb weight reduction is much lower than five percent. Also, the average footprint has increased for all vehicle segments.
___________________
2 The 2016 study asked automakers the material roadmap (for key components) for 5%, 10%, and 15% target curb weight reduction over the 2016 fleet.
Table 3: Curb weight and Footprint Comparison: current model year 2020 vs previous model year 20163
| SmallCar | SmallSUV | MidSUV | Pickup | |
|---|---|---|---|---|
| Avg. Curb Weight Decrease | 0% | 2% | 1% | 4% |
| Avg. Footprint Increase | 2% | 1% | 4% | 6% |
| Unibody | Body on Frame | |||
| Avg. Curb Weight Decrease | 1% | 3% | ||
| Avg. Footprint Increase | 2% | 6% | ||
Source: CAR Research
The real-world mass reduction achievements do NOT match the mass reduction potential of the material technologies already implemented in the baseline MY2020 fleet. CAR research found two primary reasons for this discrepancy:
Q1. Mass Add-Back: automakers often need to add weight to improve vehicles’ safety, performance, and customer expectations. Mass for safety is required for crashworthiness and electronic devices such as cameras, sensors, computers, etc. Mass for performance might be added for attributes such as improvements in stiffness, the quietness of the ride, lowering the center of gravity, equalizing the load distribution, unsprung mass reduction, etc. Automakers also add mass to satisfy customer demand for better comfort. In the 2016 CAR study, automakers indicated that the total mass add-back (safety plus performance) expected for cars today averaged 4.9 percent for cars and 4.6 percent for light-duty trucks.
Q2. Footprint Increase: vehicles, in general, have increased in size because of customer demands. The baseline fleet has a 2-6 percent larger footprint than the MY2016 fleet. This increase takes away the real-world curb weight reduction.
Therefore, we conclude that the MY2020 baseline fleet has advanced material technology but is not significantly lighter than the MY2016 fleet.
___________________
3 Analysis includes only the top selling baseline fleet vehicles (33 nameplates). Analysis of the entire US fleet might produce different results. MidCar segment has only two vehicles in top selling 1)Ford Fusion 2)Tesla Model 3. Ford Fusion footprint increased by 6% and mass increased by 4%. Tesla Model 3 has no previous generation for comparison.
To avoid model year and production year confusion, the comparisons were made for two model years before and after the latest generation change model year. For example,
Ford F150 redesign in MY2015
MR = (MY2013 CW) – (MY2017 CW),
MR is positive if the vehicle got lighter.
Jeep Cherokee redesign in MY2020
Delta footprint = (MY2020 CW) – (MY2018 CW) [since 2022 does not exist)
Footprint is positive if the vehicle got bigger.
Automaker Interview Summary
CAR researchers interviewed several automakers to understand future mass-reduction opportunities. Below are the questions and key points from the conversations.
Q1. Is lightweighting an important decision factor for material selection in MY2025-2035 vehicles? What factors will affect its increase or decrease in importance?
Almost all interviewees said lightweighting would be an essential factor for material selection in MY2025-2035 vehicles. However, the importance will depend on multiple variables such as cost, system integration, supply base/chain, sustainability, vehicle program targets and timing, and production volume. Vehicle performance requirements must be met regardless of lightweighting importance. Table 4 lists positive, negative, and uncertain drivers that will govern lightweighting’s importance in the 2025-2035 timeframe.
Table 4: Drivers that will govern the importance of ligthweighting in the 2025-2035 timeframe
| Positive Drivers | Negative Drivers | Uncertain |
|---|---|---|
|
|
|
Source: CAR Research
Q2. Are the criteria for lightweighting different for battery electric vehicles than internal combustion vehicles? Will increases in energy density and battery cost reduction alter the selection criterion for lightweighting of the electric vehicles?
Most respondents said that the primary purpose of mass-reduction for fossil fuel vehicles is controlling fuel economy and greenhouse gas emissions. For electric vehicles, the primary goal is to increase the range. However, the material strategies for lightweighting may not differ much for BEVs versus ICE once batteries are lightweight and inexpensive.
Both battery energy density and battery costs are critical decision factors in the mass-reduction targets and materials qualification criterias to achieve the targets. Energy density, if it drives a lighter battery pack (as opposed to, for example, driving up consumer range expectations), will lower the lightweighting targets. Also, as the cost of battery storage decreases, the value of lightweighting decreases because the automakers can put a less expensive, bigger battery to match the range, compared to more expensive lightweighting. An opposing argument is that lower battery costs may free up material cost budgets to spend on lightweighting. However, respondents indicate that the former scenario is more likely than the latter. Thus, CAR researchers assume that higher battery energy density
and lower battery cost will lower lightweighting targets and automakers’ appetite to pay for material technology for this analysis.
Q3. What are the critical material and manufacturing technologies on which the committee should focus its attention for MY2025-2035? Comment on cost, supply chain, design optimization, capital investment, after-sales service, etc.
An overwhelming response to this question was that the committee should focus on low cost, high volume material, and manufacturing technologies. The primary reason for such a response is that the automotive industry is very cost-sensitive and produces large volumes of vehicles. As automakers are stressed to develop many new technologies based on global demand, there are limited resources to develop unless the production volume is large. New-age technologies frequently mentioned in the interviews include:
Materials Systems: novel low-cost, high-performance composite sandwich construction with honeycomb cores, next-generation low-cost carbon fibers, 7xxx series aluminum, gen-3 steels, graphene, and nano-based composites.
Manufacturing: significantly lower-cost high-volume fully-automated polymeric composite manufacturing methods (e.g., HP-RTM, Spray Transfer Molding (STM), straight and curved pultrusion, toolless manufacturing, and high-volume additive manufacturing.
Enablers: multi-material (dissimilar material) joining for assembly and disassembly, and predictive computational and design optimization tools.
CAR research found ongoing research and development efforts in the technologies mentioned above. The timeline for high-volume commercial production varies significantly by technology, and the uncertainty is high.
Since most automakers are global companies with standard vehicle platforms that share parts, the supply chain is critical in the material selection decision process. Experts admitted that the supply base is limited for carbon fiber and natural fibers.
Q4. How important is sustainability in material qualification? What role does life cycle assessment (LCA) play in material qualification?
All automakers and suppliers said that sustainability is becoming increasingly important in their companies. Many automakers have specific sustainability goals, the progress of which they report annually to the investors. Suppliers are getting a greater push from the automakers to have a more sustainable supply chain. Life cycle analysis (LCA) was also frequently mentioned in the interviews. LCA is an important tool for selecting sustainable materials; However, quantifiable metrics and long-term targets are not well defined. Also, there is a lack of standardization for LCA in the automotive industry.
Q5. With regard to lightweighting, what is fundamentally important for the NAS committee to understand and consider when writing the report?
Automakers said that the market forces value per kilogram, as driven by the consumers (price point) and regulatory requirements (additional heavy content). It is paramount for the committee to understand the dollar value consumers put on higher performance, higher range, and more features. Furthermore, the effects of the market forces on the amount of lightweighting automakers can do.
Another factor is manufacturing costs, especially for complex designs (geometry and/or materials). Manufacturing costs can be higher than material costs. In such a situation, focusing on low-cost raw materials does not significantly impact the overall cost (or piece cost). Therefore, because of the
manufacturing process (not material costs), a lightweighting concept or lightweighting innovation may not be considered until the industry develops a lower-cost manufacturing method.
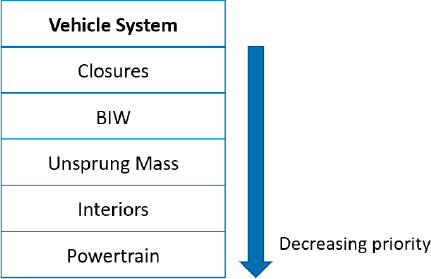
Q6. What vehicle systems do you target for lightweighting?
CAR researchers found that closures are the top priority because they are mostly large, flat panels which can be a bolt-on to the body-in-white. The body-in-white (BIW) is the second priority as it adds significant weight to the vehicle. Next in line is unsprung mass, interior components, and powertrain.
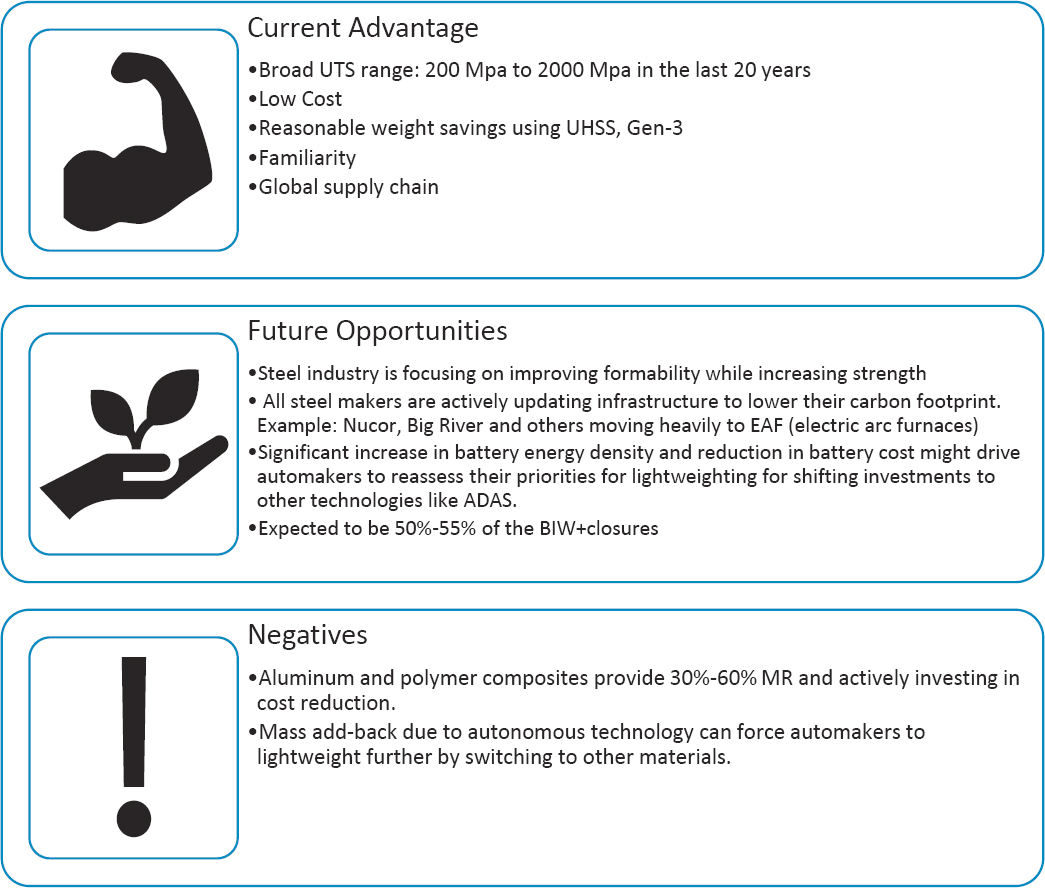
Opportunities for Steel
Steel is a known commodity and has been utilized and continues to be optimized. Therefore, automakers are familiar with the material for high-volume production. With economies of scale and a millennium of efficiency improvements, steel costs are lower than other materials. The steel industry is continuously improving and launching better grades of steel. Push for higher lightweighting targets will take few vehicle parts away from steel, but steel will remain a dominant material for BIW at least till 2035 for mass-market vehicles.
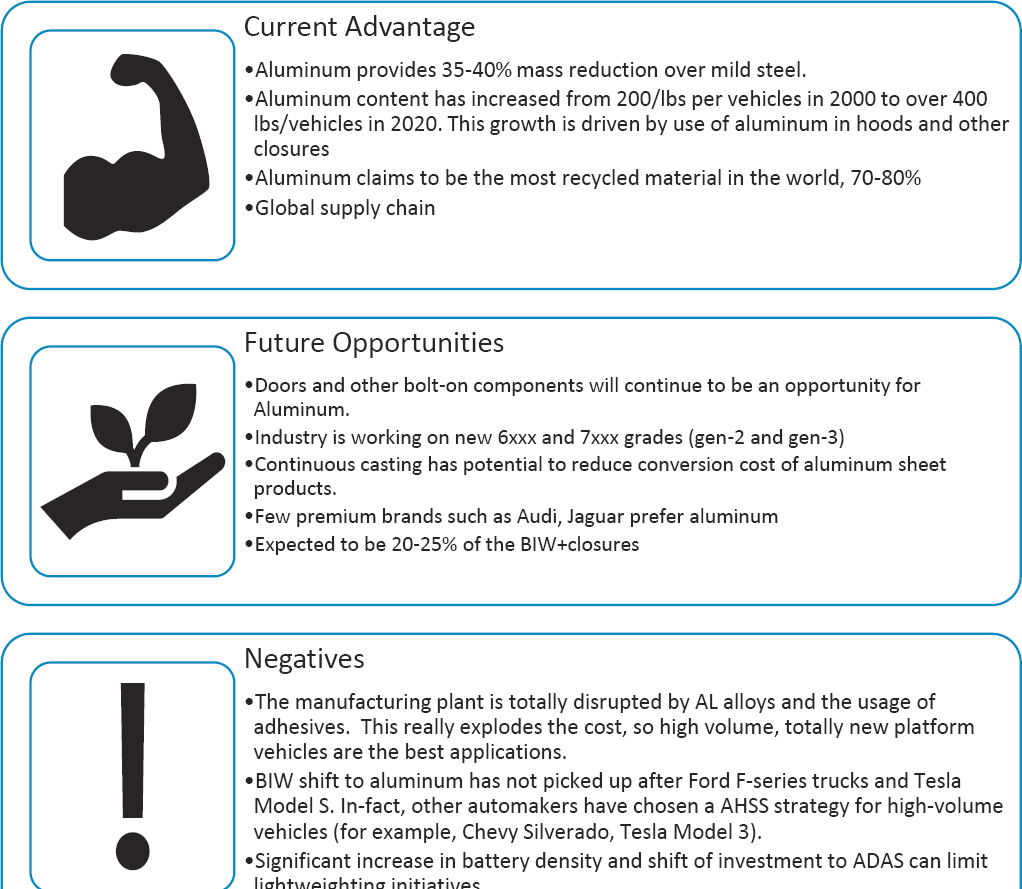
Opportunities for Aluminum
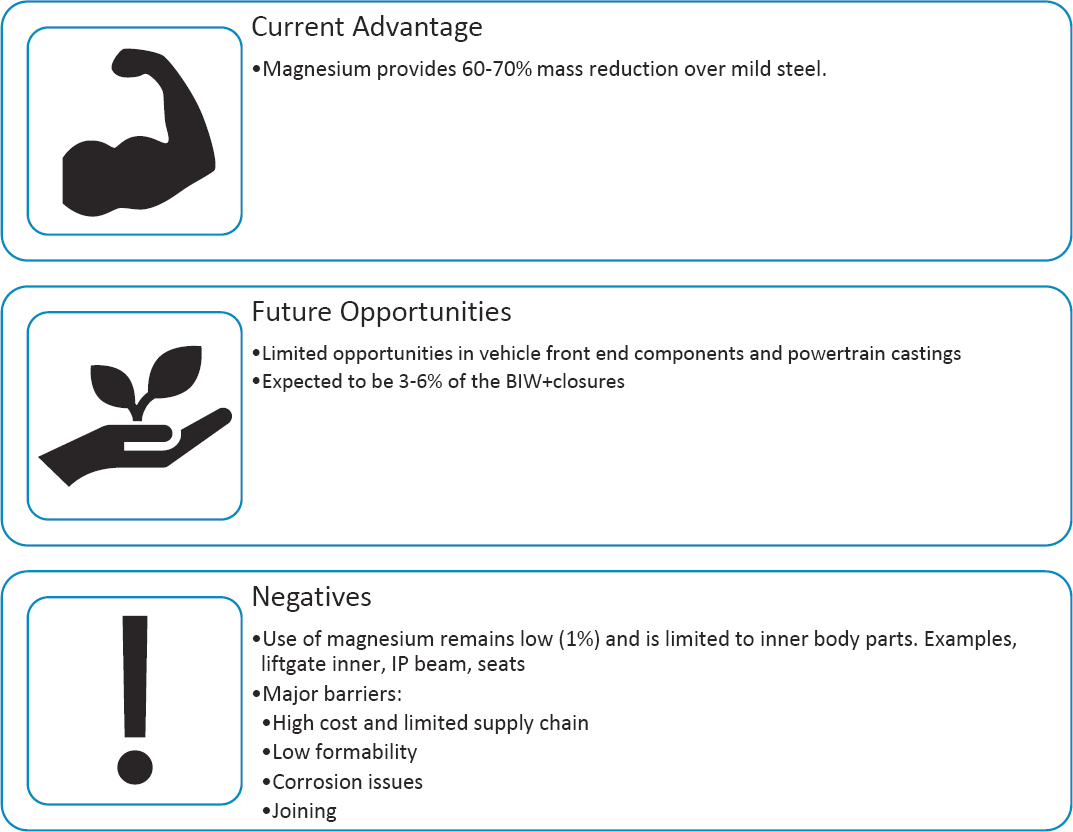
Aluminum is the prime competitor of steel. It provides a 35-40 percent mass reduction over lower grade steels. Like steel, aluminum is a known commodity with a well-established global supply chain. CAR research found aluminum to become a prime material for use in closures and outer body panels. Aluminum will increase from the current 10-13 percent to 20-22 percent of the BIW and closures subsystem.
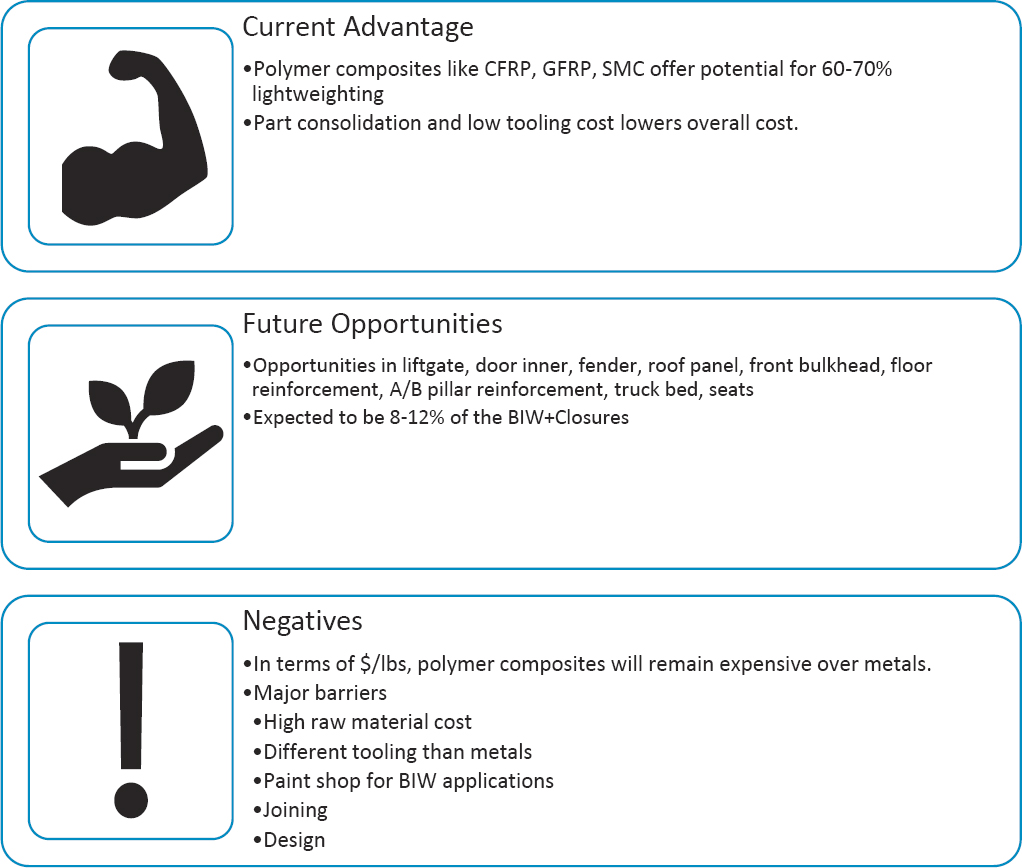
Opportunities for Polymer Composites
Polymer composites offer significant lightweighting over steel and aluminum. They also simplify the design and reduce the number of parts. Polymers will play a significant role in achieving higher lightweighting requirements. For premium, performance-driven vehicles, they might be a dominant material. Since polymer composites are application-specific and not a commodity product, the cost will remain a challenge for high-volume production. With the increasing push towards sustainability, recyclability and reusability of polymers also remain a concern. Interviews with experts reveal that suppliers are diligently working to find sustainable plastics and polymer composites.
Opportunities for Magnesium
Magnesium is at par with polymer composites in mass reduction opportunities. However, magnesium suffers from galvanic corrosion issues when used with other materials, and the supply chain is not well established. Also, there are issues with forming and brittleness in magnesium parts. Therefore, magnesium will have limited use in the non-exposed parts of BIW and closures.
Material Mass Reduction Percentages used in this Study
The weight reduction opportunity for materials depends on the design of the part and the manufacturing processes. However, there is a general understanding of the expected range of mass reduction each material can provide. Table 5 from the U.S. Department of Energy lists the range of mass-reduction estimates for each material.
Table 5: Mass Reduction Potential of Materials
| Lightweight Material | Mass Reduction Opportunity |
|---|---|
| Magnesium | 30-70% |
| Carbon fiber composites | 50-70% |
| Aluminum and Al matrix composites | 30-60% |
| Titanium | 40-55% |
| Glass fiber composites | 25-35% |
| Advanced high strength steel | 15-25% |
| High strength steel | 10-28% |
Source: U.S. Department of Energy
Based on the interviews conducted for this project and the literature survey, the authors decided to use the mass reduction percentages listed in Table 6.
Table 6: Mass Reduction percentages of each material used for this project
| Material | MR% (relative to mild steel) |
|---|---|
| AHSS | 10% |
| UHSS | 25% |
| Aluminum | 45% |
| Magnesium | 50% |
| Polymer Composite | 60% |
Source: CAR Research
Secondary Mass Reduction
The 2015 NASEM report suggested that a powertrain downsizing opportunity exists when the glider mass is lightweighted by at least 10 percent (Cost, Effectiveness, and Deployment of Fuel Economy Technologies for Light-Duty Vehicles, 2015). The committee found that a reduced mass vehicle would allow an additional 40 percent of the primary mass removed from cars (unibody) and an additional 25 percent of the primary mass removed for trucks (body-on-frame).
Automakers’ interviews confirmed the NASEM committee findings. Therefore, we have used the same approach to calculate secondary mass reduction opportunities in this report.
Understanding the Cost of Lightweighting
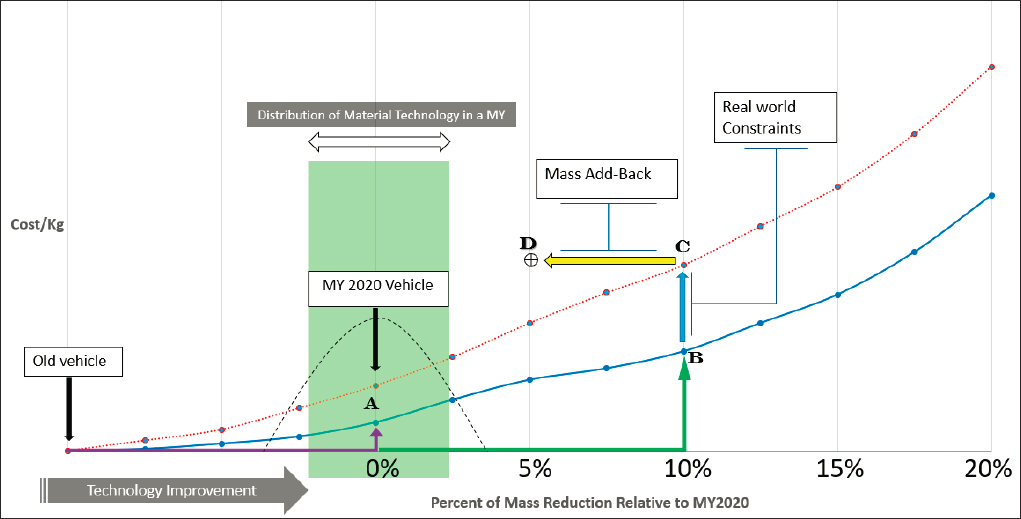
The cost of lightweighting may seem like a simple material replacement cost. However, many factors influence the real-world lightweighting cost, including part complexity, part size, manufacturing process, annual volume, capital investment, additional labor, factory location, and reengineering effort. Moreover, mass add-back takes away a large portion of the mass-reduction achieved. Figure 1 shows a generic mass-reduction cost curve for an automaker. Please note:
- The model year 2020 baseline vehicle has advanced material technology and, therefore, already ahead in the curve.
- There is a distribution of material technology in the U.S. fleet with vehicles more and less advanced than the average vehicle.
- Mass reduction becomes expensive with real-world constraints (curve shifts upwards).
- Mass add-back reduces the actual curb weight reduction even after implementing lightweight material technology.
Source: CAR Research
Cost of Materials and Manufacturing
For understanding the cost of lightweighting, it is vital to understand the raw material and manufacturing costs. Vehicle teardown studies sponsored by the NHTSA and EPA have used detailed cost models to account for raw material, equipment, labor, energy, scrap, engineering, overhead, etc. Creating such a model is out-of-scope of this project. To arrive at a reasonable range of estimates for different levels of mass-reduction, CAR researchers performed an extensive literature survey and interviewed material suppliers to understand the raw material and manufacturing costs.
Raw Material Prices
Below is the discussion on individual raw material prices. The information presented below refers to multiple sources. Please refer to the bibliography for citations.
Statistical forecasting models’ performance degrades rapidly as the forecast horizon expands. A review of the commodity price forecasting literature indicates that forecasts are, at best, accurate to a time horizon of three months. Given a fifteen-year forecast horizon, statistical methods are inappropriate. Thus, we rely on long-term historical patterns in the data for steel and aluminum prices.
Steel Prices
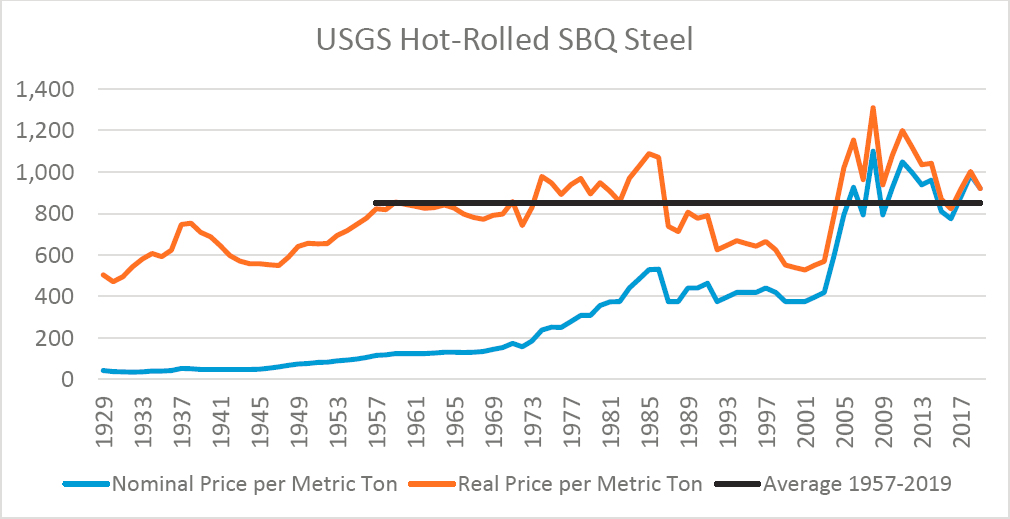
For steels, long-run inflation-adjusted (using the implicit GDP deflator, base year 2019) prices are relatively constant, with deviations driven by demand shocks and geopolitical events (collapse of the USSR, the industrialization of China). Given this stability of real prices, we assume steel will remain at roughly its long-term real price throughout the forecast period. The United States Geological Survey (USGS) historical data on steel prices, which uses hot-rolled special bar quality carbon steel as its benchmark, has averaged $0.85 per kg since the late 1950s. At current cost deltas across steel grades, this implies a long-run, inflation-adjusted average price between $0.70 and $0.75 per kg for cold-rolled mild steel.
Discussion with industry participants and available data indicate that cold-rolled steel is almost always more expensive than hot-rolled special bar quality (SBQ). The $0.70 per kg figure is definitively a lower bound and may result from idiosyncrasies in the limited data available for translating the USGS SBQ data to cold-rolled prices. To account for uncertainties, we use a range of $0.70-$1.00 per kg for cold-rolled mild steel.
Source: United States Geological Survey
Aluminum Prices
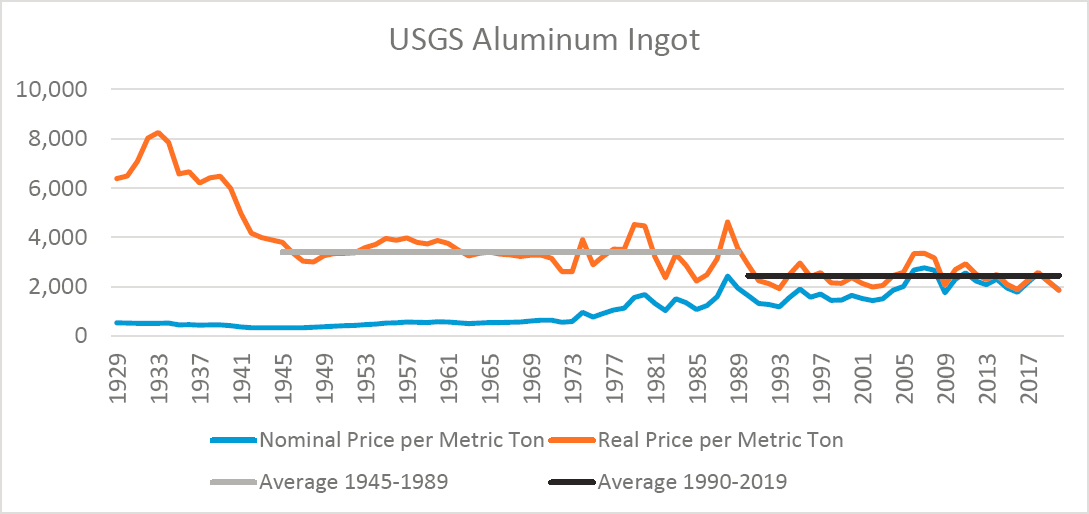
Inflation-adjusted aluminum prices are less stable than steel prices, with a pronounced and rapid decline in the pre-WWII period. Since 1990, real prices for aluminum ingot have averaged and remained relatively steady near $2.44 per kg. To reflect uncertainty, we report a high and low around this figure, based upon the price volatility since 1990. Our low-cost aluminum scenario sees the real price per kg at $2.135, while the high real price scenario indicates prices at $2.745 per kg.
Source: United States Geological Survey
Carbon Fiber Prices
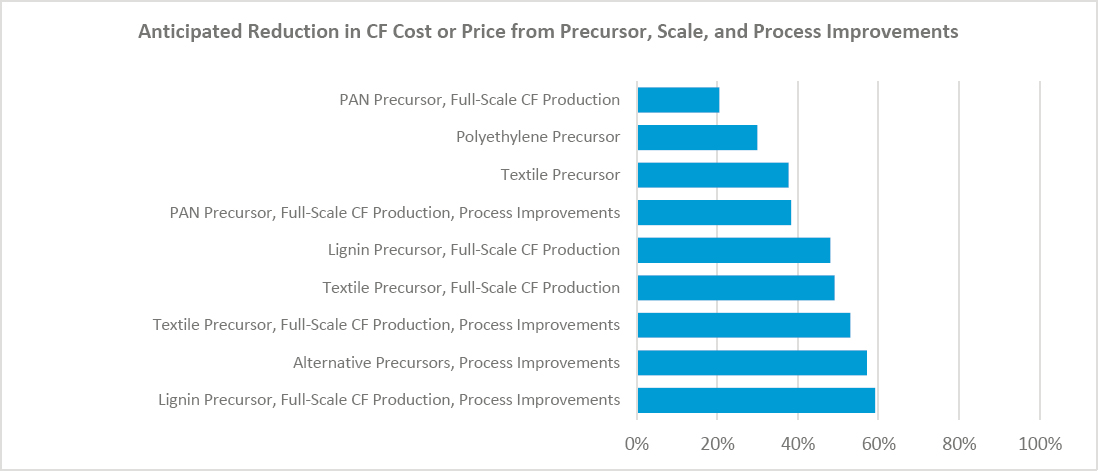
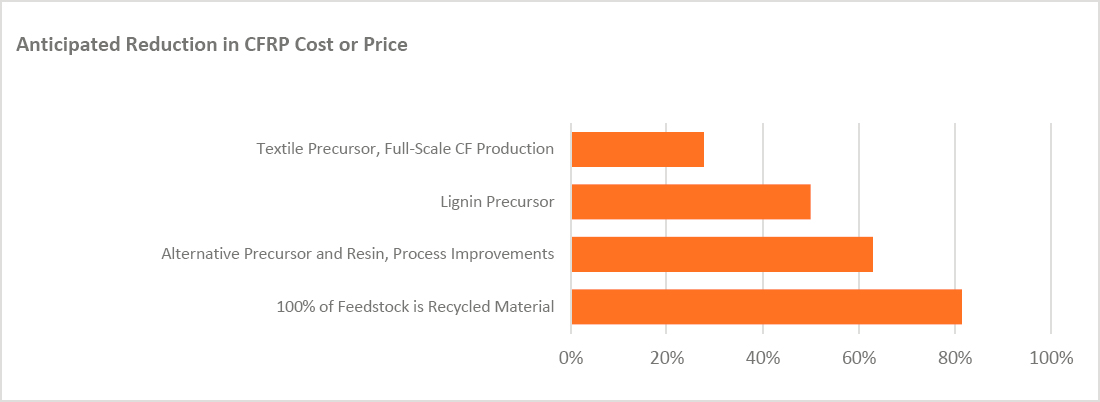
Little information is available for the cost of carbon fiber (C.F.), whether C.F. itself or for carbon fiber composites (CFC). Those documents and reports that are available are inconsistent as to materials discussed and often do not clearly specify what is being referenced.4 As baselines are inconsistent and seldom fully defined, we focus on each document’s anticipated percent change from its own baseline. Overall, documents discussing cost-reduction pathways for C.F. and CFC expect that the development of alternative precursors will lower the cost of approximately 35 percent for CFC. Process improvements and fully-scaled production are anticipated to each provide a further 20 percent cost reduction. These cost reductions are multiplicative, not additive. The expected combined effect of full-scale production wholly implemented process improvements, and an alternative precursor is approximately a 50 percent cost reduction for CFC.
___________________
4 Documents and reports are inconsistent with the materials discussed and often do not specify what is being referenced. Critical information missing includes:
- Differing tow sizes (large tow size CF is significantly lower cost than low tow size CF)
- Inconsistent performance characteristics/material qualities
- Does “carbon fiber” refer to…
- Carbon Fiber (CF),
- Carbon Fiber Reinforced Polymer / Carbon Fiber Composite (CFRP/CFC), or
- A product manufactured from CFRP (e.g., CFRP-based door inner)?
- Are figures the direct cost of material manufacture or the price paid by a purchaser of the material? CF price roughly = CF Production Cost x 1.45*
- As a result, even reports citing similar data and time periods provide meaningfully different cost figures for CF, CFRP, and parts made from CFRP
- Quoted baseline costs/prices vary dramatically across sources, even for consistent materials, e.g. 50k tow CF (roughly $12 - $24 / kg)
Source: Warren, 2011; Ennis et al., 2019; Bregar, 2014; Vehicles Technology Office, 2013; Heuss et al., 2012
Our future cost scenarios for CFC follow the same technology pathway, but at different time horizons. The low-cost CFC scenario assumes that, by 2025, sufficient scale and/or sufficient process improvements will be implemented to achieve a 20 percent reduction in CFC cost. Further improvements will occur sufficient for an additional 20 percent cost reduction by 2030, and an alternative precursor will be available and in-use by 2035. In the high-cost scenario, we did not consider any improvements to scale or process until 2030, and the experts do not expect an alternate precursor until after 2035.
Available information on C.F. and CFC costs and prices suggest that per kg nominal costs have remained roughly constant over the past decade; thus, real costs have fallen. We assume this will continue, and the effects of general inflation will further reduce CFC’s real cost throughout the 15-year forecast horizon.
Given the full range of baseline cost estimates and anticipated cost reduction pathways, the range of costs per kg for C.F. and CFRP achievable after full implementation of fully-scaled production, process improvements, and alternate precursors are:
- CF: $5 – 11 per kg (typical $7 per kg)
- CFC: $9 – 15 per kg (typical $12 per kg)
These figures do not incorporate general inflation. Incorporating inflation and assuming all cost reduction possibilities are implemented by 2035, CAR estimates CFRP prices could be $8.74 in 2035.
Magnesium Prices
Magnesium is the eighth-most abundant element in the earth’s crust, but raw magnesium’s price instability inhibits broader use. The magnesium price is impacted by the demand for aluminum, titanium, and steel because magnesium is used to make these metals. The Platts Metals Week U.S. spot Western magnesium price range was $2.10 to $2.20 per pound ($4.62 to $4.85 per kg) throughout the entire year for an annual average price of $2.15 per pound in 2017, unchanged from the average price since the beginning of 2014. Global consumption of magnesium is expected to increase by a compound annual growth rate of about five percent per year from 2017 through 2027 (2017 Minerals Yearbook, 2017). The price of magnesium is unstable and depends on geopolitical factors. For this research, we have assumed magnesium prices to reduce going forward.
Material Costs used for this research
For this analysis, CAR researchers created high and low-cost scenarios for 2025-2035. Based on the research described above, steel prices are kept constant. Aluminum, CFRP, and Magnesium costs are assumed to decrease over the years. Table 7 shows the cost in dollars per kilogram for each material.
Table 7: High and Low-Cost Scenarios for Materials 2025-2035
| LOW Material Cost $/kg range | ||||
|---|---|---|---|---|
| Material | 2020 | 2025 | 2030 | 2035 |
| Mild | 0.70 | 0.70 | 0.70 | 0.70 |
| HSS | 0.83 | 0.83 | 0.83 | 0.83 |
| AHSS | 1.10 | 1.10 | 1.10 | 1.10 |
| UHSS | 1.15 | 1.15 | 1.15 | 1.15 |
| Al | 2.13 | 2.13 | 2.13 | 2.13 |
| Mag | 4.50 | 4.00 | 3.50 | 3.00 |
| CFRP | 24.00 | 19.71 | 16.41 | 8.74 |
| HIGH Material Cost $/kg range | ||||
|---|---|---|---|---|
| Material | 2020 | 2025 | 2030 | 2035 |
| Mild | 1.00 | 1.00 | 1.00 | 1.00 |
| HSS | 1.13 | 1.13 | 1.13 | 1.13 |
| AHSS | 1.40 | 1.40 | 1.40 | 1.40 |
| UHSS | 1.45 | 1.45 | 1.45 | 1.45 |
| Al | 2.74 | 2.74 | 2.74 | 2.74 |
| Mag | 4.80 | 4.30 | 4.00 | 3.50 |
| CFRP | 24.00 | 24.00 | 19.71 | 16.41 |
Source: CAR Research
Manufacturing Cost
Manufacturing cost is more difficult to estimate since it depends on many factors such as part complexity, part size, manufacturing process, the volume of production, and manufacturer’s “tribal” knowledge. CAR researchers interviewed material suppliers and consortiums to understand the manufacturing cost part of the total part cost. Most respondents gave CAR a range of estimates. To control the complexity of manufacturing cost, we used averages of the estimates provided to CAR.
In a 2016 CAR study (Baron & Modi, 2016), the authors estimated manufacturing cost reduction due to time and volume-based learning for different materials5. These learning percentages are used in this analysis to estimate manufacturing cost reduction through 2035. See Table 8 and Table 9.
___________________
5 There are two different types of learning curves:
Time-Based – Over time, plant operations adapt to using new material and new techniques for processing and handling of these materials. This enables the procedure to increase process speed and efficiency, resulting in lower overall cost.
Volume-Based – Higher volume bring opportunities for economies of scale. It can lead to a reduction in the cost of production per part. Higher volume demands drive more rigorous processing, which can create additional opportunities to improve overall process times.
Table 8: Manufacturing cost and learning
| Material | Manufacturing cost as part of total cost % | Manufacturing cost % Reduction/year (learning) |
|---|---|---|
| Mild | 47% | 0.00% |
| HSS | 41% | 0.00% |
| AHSS | 41% | 0.56% |
| UHSS (HF) | 41% | 0.56% |
| AL | 40% | 1.26% |
| Mag | 24% | 0.88% |
| Comp | 58% | 2.36% |
Source: CAR Research
Table 9: Manufacturing Cost with Learning ($/kg) for key years
| Material | 2020 | 2025 | 2030 | 2035 |
|---|---|---|---|---|
| Mild | 0.75 | 0.75 | 0.75 | 0.75 |
| HSS | 0.68 | 0.68 | 0.68 | 0.68 |
| AHSS | 0.87 | 0.84 | 0.82 | 0.80 |
| UHSS | 0.90 | 0.88 | 0.85 | 0.83 |
| Al | 1.63 | 1.53 | 1.43 | 1.34 |
| Mag | 1.47 | 1.40 | 1.34 | 1.29 |
| Comp | 33.14 | 29.41 | 26.10 | 23.16 |
Source: CAR Research
Total Cost
To calculate the total cost for material changes, the team added the low and high material costs and each material’s manufacturing cost. This exercise resulted in Table 10 and Table 11.
Table 10: LOW Total Cost $/kg range (material + processing)
| Material | 2020 | 2025 | 2030 | 2035 |
|---|---|---|---|---|
| Mild | 1.45 | 1.45 | 1.45 | 1.45 |
| HSS | 1.51 | 1.51 | 1.51 | 1.51 |
| AHSS | 1.97 | 1.94 | 1.92 | 1.90 |
| UHSS | 2.05 | 2.03 | 2.00 | 1.98 |
| Al | 3.76 | 3.66 | 3.57 | 3.48 |
| Mag | 5.97 | 5.40 | 4.84 | 4.29 |
| Comp | 57.14 | 49.13 | 42.51 | 31.90 |
Source: CAR Research
Table 11: HIGH Total Cost $/kg range (material + processing)
| Material | 2020 | 2025 | 2030 | 2035 |
|---|---|---|---|---|
| Mild | 1.75 | 1.75 | 1.75 | 1.75 |
| HSS | 1.81 | 1.81 | 1.81 | 1.81 |
| AHSS | 2.27 | 2.24 | 2.22 | 2.20 |
| UHSS | 2.35 | 2.33 | 2.30 | 2.28 |
| Al | 4.37 | 4.27 | 4.18 | 4.09 |
| Mag | 6.27 | 5.70 | 5.34 | 4.79 |
| Comp | 57.14 | 53.41 | 45.81 | 39.57 |
Source: CAR Research
Factors Affecting Automaker Lightweighting Targets
Automaker interviews revealed that lightweighting targets would depend on four primary factors 1) fuel economy and GHG regulations, 2) electrification volume, 3) battery cell energy density (weight of the battery pack) and, 4) battery pack cost.
Fuel Economy and GHG regulations – the government regulations on fuel economy and greenhouse gases affect automakers’ mass-reduction target the most. Since most automakers sell in multiple countries and have common vehicle platforms, worldwide government regulations affect material strategies, not just the U.S. regulations.
An industry estimate is that a 10 percent reduction in vehicle’s mass will produce approximately six to seven percent reduction in fuel consumption for passenger cars and four to five percent reduction for light-duty trucks (Cost, Effectiveness, and Deployment of Fuel Economy Technologies for Light-Duty Vehicles, 2015). Therefore, lightweighting is an essential tool for automakers to achieve fleet fuel economy targets.
Fuel economy and GHG regulations also affect electrification volume in the fleet. Since electric vehicles’ fuel economy (miles per gallon equivalent) is higher than internal combustion engines, automakers can positively impact their CAFE targets by adding electric vehicles to the fleet. For this research, we have assumed electrification volume as a proxy variable for fuel economy and GHG regulations.
Battery Cell Energy Density – Assuming similar performance, a battery-electric vehicle usually has a higher curb weight than an internal combustion engine vehicle. The primary reason for the weight difference is because the current batteries have lower energy density than gasoline. A vehicle with 10 gallons of onboard fuel (337 kWh energy) weighs an additional 27-30 kg, and the vehicle gradually drops that weight as the fuel is combusted. On the other hand, a battery-electric vehicle’s (BEV) battery pack may contain 100 kWh of energy but weigh 385-544 kg. Automakers need a higher battery capacity to meet range targets, which means adding significant weight to the vehicle with the current battery density. Therefore, battery weight is an essential factor affecting lightweighting targets.
Battery Pack Cost – Achieving long-range is paramount for selling electric vehicles in high volume. The range can be increased by adding battery capacity or reducing the weight of the vehicle. Since batteries are expensive, adding battery capacity adds a high cost to the vehicle. However, if the battery pack’s cost decreases significantly, adding battery capacity becomes a cheaper option than lightweighting.
Automaker interview reveals that decreasing battery pack cost might negatively impact lightweighting targets.
For each of the above variables, high and low values were defined (see Table 12). Table 13 shows the expected values of the selected variables for the study years.
Table 12: High and Low Definitions for Selected Variables
| High | Low | |
|---|---|---|
| Electrification Volume (CAFE/GHG proxy) | >25% BEV, 30-50% Hybrids | <15% BEV, 20-25% Hybrids |
| Battery Pack cost | $145-$160 per kWh | <$100 per kWh (2030+ projected) |
| Battery Cell Energy Density | 900 Wh/Liter | 700 Wh/Liter |
Source: CAR Research
Table 13: Expected Variable Value for Select Years
| Year/Variable | Electrification Volume | Battery Pack Cost | Battery Cell Energy Density |
|---|---|---|---|
| 2020-2025 | Low | High | Low |
| 2025-2030 | Mass Market: Low Premium - High | High | Low |
| 2030-2035 | High | Low | Low |
Source: CAR Research
Method for Estimating Material Distribution
Generalizing material penetration in the U.S. fleet is challenging because of the wide distribution of technology and vehicle-specific lightweighting targets. Furthermore, the data on vehicles’ material, weight, and manufacturing technology is not public information.
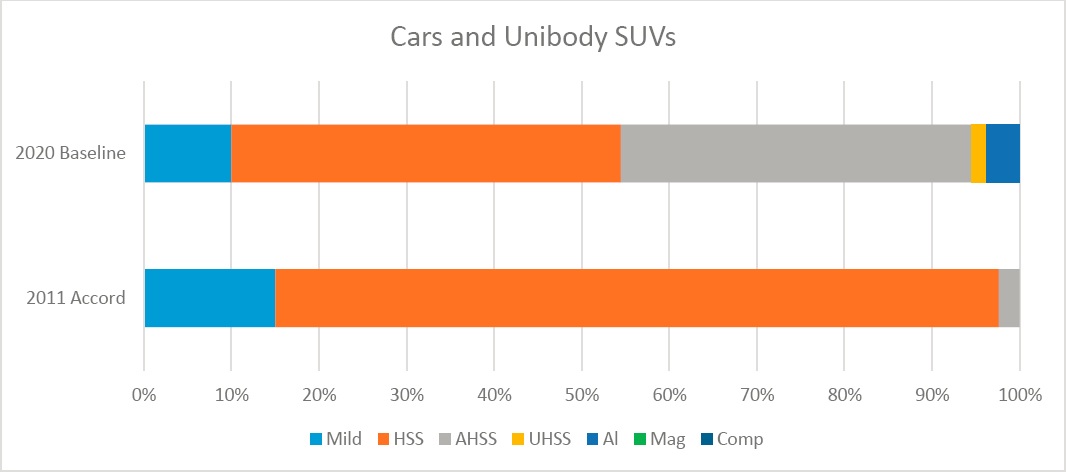
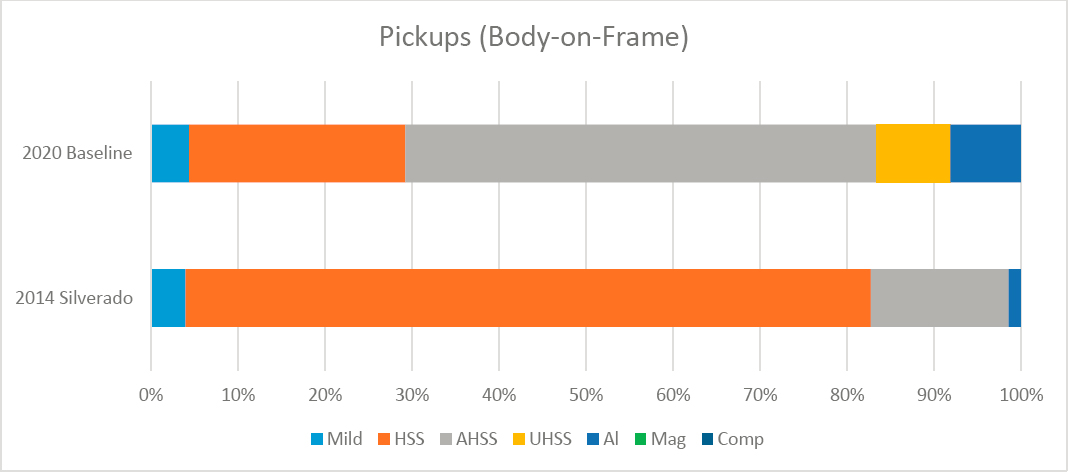
CAR research shows that material choices heavily depend on the vehicle’s price than the vehicle’s segment. Therefore, material distribution in future vehicles will differ more for premium versus mass-market vehicles. However, there are structural differences between unibody and body-on-frame vehicles, which affects material choices. Body-on-frame vehicles are also, in general, more expensive than unibody vehicles. After considering these points and in the spirit of using publicly available information, CAR researchers decided to use the vehicles studied by the regulating agencies – the 2011 Honda Accord as a reference for unibody vehicles, and the 2014 Chevy Silverado for body-on-frame vehicles.
The two vehicles were updated to represent a generic mass-produced unibody and body-on-frame vehicles based on the data collected from 2020 repair manuals, the material forecast information from the 2016 CAR study, and engineering judgment.6Figure 5 and Figure 6 show the material distribution in the original and updated vehicles.
___________________
6 The analysis considers the two vehicles updated to MY2020 materials to represent the unibody and body-on-frame vehicles in the current US fleet. In reality, vehicle material technology has a wide distribution in a given model year.
Source: CAR Research
As discussed in the previous section, future vehicle material distribution will depend in part on electrification volume, battery pack cost, and battery cell energy density. CAR researchers created scenarios using the three variables for the study years 2020-2025, 2025-2030, and 2030-2035. For each scenario, we created a material roadmap for unibody and body-on-frame vehicles. The following sections will discuss these scenarios and corresponding material trends.
Material Roadmap and Incremental Cost ($/kg) – Unibody Vehicles
The updated Honda Accord was used to study material distribution scenarios for unibody vehicles.
Table 14 lists the unibody scenarios, expected material trends, and the expected year range. We have based these estimates on the information collected through automaker interviews and literature surveys, including the 2019 CAR technology roadmaps (Modi & Vadhavkar, 2019).
Table 14: Scenarios for Unibody Vehicles
| Scenario | Electrification Volume (CAFE/GHG proxy) | Battery Pack cost | Battery Density | Expected Material Trend | Expected Year |
|---|---|---|---|---|---|
| Baseline 2020 | Low | High | Low | Body: HSS, AHSS, UHSS Closures: HSS, low Al | NA |
| Scenario One | Low | High | Low | Body: HSS, AHSS, UHSS Closures: HSS, Al | Mass Market 2025-2030 |
| Scenario Two | High | High | Low | Body: Aluminum, AHSS, UHSS Closures: Al, comp, Mag | Premium Vehicles 2025-2030 |
| Scenario Three | High | Low | Low | Body: AHSS, UHSS, low Al Closures: Al | Mass Market 2030-35 |
| Scenario Four | High | Low | High | AHSS intensive | Low |
Source: CAR Research
Scenario one is where electrification volume remains low, and battery technology and cost remain at 2020 levels. In this case, automakers may continue to use predominantly high strength steel BIW and a mix of steel and aluminum in the closures. This scenario may apply for the 2025-2030 timeframe.
In scenario two, electrification volume becomes high for performance and customer demand, but the battery technology does not progress. In this case, automakers will likely have higher lightweighting targets. They may use aluminum and high strength steel in BIW and a mix of aluminum, magnesium, and polymer composites in the closures. Scenario two may apply for premium vehicles in the 2025-2030 timeframe.
In scenario three, the electrification volume is high, and the battery pack cost has come down significantly to support mass-market electric vehicles. In this case, there is medium pressure for lightweighting since automakers can increase vehicle range at lower costs by adding batteries. Thus, in scenario three, automakers will likely use high strength steel and aluminum in BIW, and aluminum for closures.
Scenario four is unlikely in the timeframe because experts do not expect battery density to fall into the high-value range before 2035.
Based on the material trends for unibody vehicles listed in Table 14, CAR researchers upgraded the materials for each of the BIW and closure component in a spreadsheet. The team upgraded each component’s material based on CAR’s internal material databases and the research team’s collective engineering judgment. The spreadsheet automatically calculates the components’ new weights using the data from Table 6 when the materials are changed, thereby giving the expected mass reduction for each scenario. The team repeated the exercise for the three unibody scenarios from Table 14.
Once the materials and weights of BIW and closure components were known, it became possible to create a graph of each scenario’s material distribution (see Figure 7).
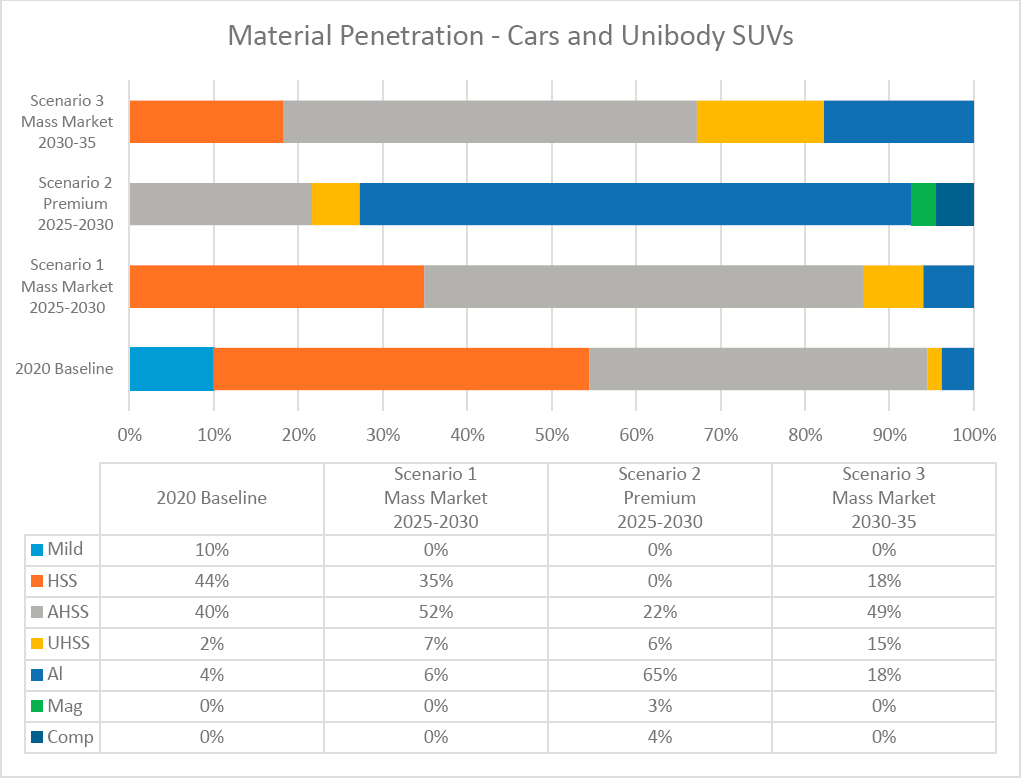
Source: CAR Research
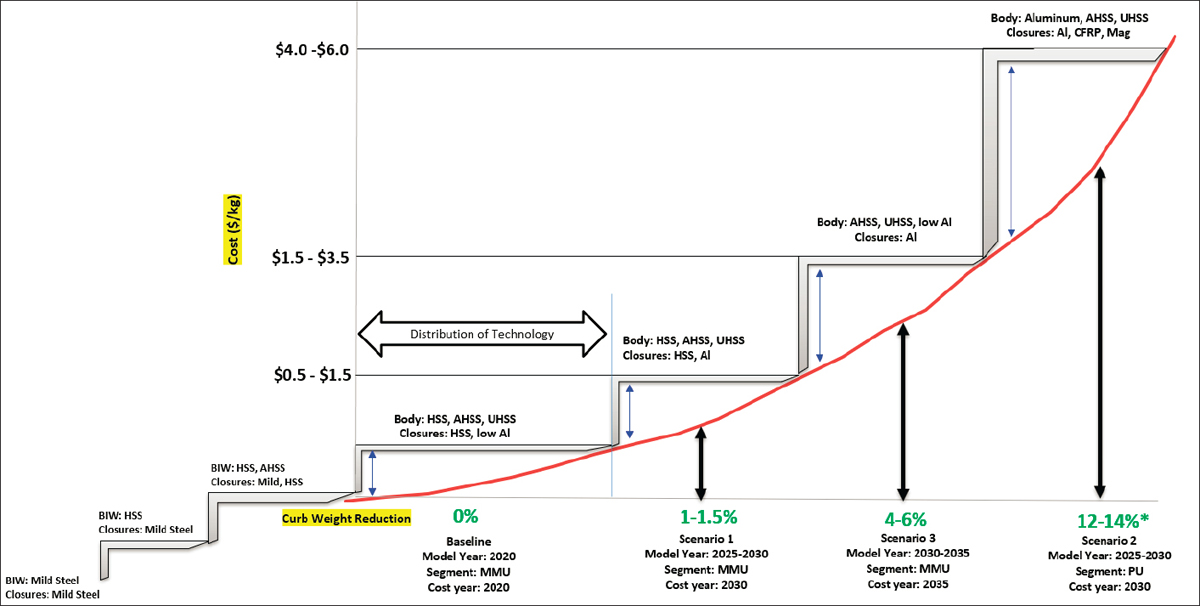
To understand the cost penalty for ligthweighting, the team multiplied each component mass with the high and low cost of material change from Table 10 and Table 11 to understand the incremental cost range. We then divided these costs by each scenario’s mass reduction (in kilograms) to get to the dollars per kilogram figure. Wherever the cost penalty range was too broad, we consulted with subject-matter-experts to narrow down the range. Table 15 shows the cost penalty and expected mass reduction for each of the unibody scenarios. Figure 8 is the expected material roadmap for unibody vehicles with cost penalties.
Table 15: Cost and Mass Reduction Analysis for Unibody Vehicle Scenarios
| Scenario | Electrification Volume (CAFE/GHG proxy) | Battery Pack cost | Battery Density | Cost penalty per kg of weight saved | Expected Material Trend | BIW+Closures Weight Reduction (2020 baseline) | Curb Weight Reduction (2020 baseline) | Expected Year |
|---|---|---|---|---|---|---|---|---|
| Baseline | Low | High | Low | NA | Body: HSS, AHSS, UHSS Closures: HSS, low Al | NA | NA | NA |
| Scenario One | Low | High | Low | $0.5- $1.5 CY: 2030 | Body: HSS, AHSS, UHSS Closures: HSS, Al | ~4% | 1.0% - 1.5% | Mass Market 2025-2030 |
| Scenario Two | High | High | Low | $4.0 -$6.0 C.Y.: 2030 | Body: Aluminum, AHSS, UHSS Closures: Al, CFRP, Mag | ~37% | 12 - 14% (with secondary) | Premium Vehicles 2025-2030 |
| Scenario Three | High | Low | Low | $1.5 - $3.5 CY: 2035 | Body: AHSS, UHSS, low Al Closures: Al | ~12% | 4 - 6% | Mass Market 2030-35 |
| Scenario Four | High | Low | High* | - | AHSS intensive | not in scope | Low |
Source: CAR Research
Real-world mass reduction might be less due to mass add-back
*High battery density is unlikely in the timeframe
2020 baseline costs used for incremental cost calculations are shown in Table 10: LOW Total Cost $/kg range (material + processing).
Source: CAR Research
MMU – Mass Market Unibody
PU – Premium Unibody
Cost Year – projected material and manufacturing cost for analysis in the year
*with secondary mass reduction
Real world cost curve will be higher than the shown curve due to real-world constraints and mass add-back.
Unibody Cost Curve Discussion
Most of the unibody vehicles in the MY2020 fleet use advanced steels for the BIW and a mix of steel and aluminum for the closures. Examples of aluminum use in closures include hoods, door inner, liftgate, and roof panel. Polymer composites find some use in the BIW, mostly in higher priced vehicles such as the Audi A8, Cadillac CT6, and BMW 7 series. However, polymer composites can be found in closure applications for mass-market vehicles, for example, the Nissan Rogue liftgate.
Automaker interviews reveal a strategy to use mixed-material solutions for lightweighting. Future vehicle structures might use a mix of materials, including high-strength steel, high-strength aluminum, magnesium, plastics, and polymer composites. There will be an increase in the number of steel grades with new generation steels replacing lower grade steels. Aluminum is the primary candidate to replace mild steel closures (doors, hoods, liftgate, and fenders), roof panels, and bodysides.
The cost penalty increases exponentially for achieving higher levels of mass reduction. In general, carbon fiber composites’ use makes lightweighting very expensive because of the high raw material and manufacturing cost. Therefore, new generation steels and aluminum will remain the material of choice for lightweighting of unibody vehicles until polymer composites become affordable for high-volume vehicles. However, for premium performance-oriented vehicles, like the Chevy Corvette, polymer composites could remain the material of choice.
As shown in Figure 1, mass reduction’s real cost is much higher than a simple material replacement. The roadmap showed in Figure 8 is the general trend identified through CAR research. In the real world, the lightweighting targets, choice of materials, and cost penalty depends on the specific vehicle program and the advancements in materials, battery technology, and government regulations.
Material Roadmap and Incremental Cost ($/kg) – Body-on-Frame Vehicles
For studying body-on-frame (BoF) vehicles, the team updated the 2014 Chevy Silverado to represent a generic MY2020 body-on-frame vehicle. Silverado is a good representation of BoF vehicles since most BoF vehicles in the U.S. fleet are pickups. In general, SUVs in the 2020 fleet have unibody construction, except for a few like the Jeep Wrangler. Table 16 lists the scenarios, material trends, and the year range for BoF vehicles. Similar to the unibody scenarios, the estimates for BoF vehicles are based on automaker interviews and literature surveys.
Table 16: Scenarios for Body-on-Frame vehicles
| Scenario | Electrification Volume (CAFE/GHG proxy) | Battery Pack cost | Battery Density | Expected Material Trend | Expected Year |
|---|---|---|---|---|---|
| Baseline 2020 | Low | High | Low | Body: AHSS, UHSS Frame: AHSS, UHSS Closures: HSS, Al | NA |
| Scenario One | Low | High | Low | Body: AHSS, UHSS, Al Frame: AHSS, UHSS Closures: Al | Mass Market 2025-2030 |
| Scenario Two | High | High | Low | Body: Aluminum Frame: AHSS, UHSS Closures: Al OR Body: Aluminum, CFRP Frame: AHSS, UHSS Closures: Al, CFRP, Mag | Premium Vehicles 2025-2030 |
| Scenario Three | High | Low | Low | Body: AHSS, UHSS, Al Frame: AHSS, UHSS Closures: Al | Mass Market 2030-35 |
Source: CAR Research
The baseline MY2020 BoF vehicles use more advanced materials than mass-market unibody vehicles. The primary reason for this difference is the higher price of pickups and performance loving customers, which allow automakers to pay a higher dollar per kg penalties for lightweighting of pickups. In the past, automakers have used lightweighting primarily to improve the pickups’ performance and increase the footprint to satisfy customer demand. However, pickups are very high volume vehicles that affect automakers’ fleet average CAFE and GHG significantly. Therefore, small improvements in the pickup fuel economy can have an enormous impact on the fleet average. The paragraphs below discuss future material scenarios for BoF vehicles.
In scenario one, electrification volume remains low, and battery technology and cost remain at 2020 levels. In this case, automakers might continue using advanced steels for BIW and frame with higher aluminum use in the closures due to lower lightweighting targets. Scenario one may apply to mass-market BoF vehicles in the 2025-2030 timeframe.
In scenario two, where electrification is high, but battery technology and cost are not low enough, interesting material decisions may happen. Due to range anxiety in electric vehicles and heavy battery, automakers will need to increase their lightweighting targets. To achieve these, vehicle manufacturers may use aluminum for the BIW, advanced steels for the frame, and aluminum for the closures. Another
option is to use carbon fiber composites to achieve higher mass-reduction; however, this will substantially increase the cost penalty. Scenario two may apply to premium vehicles in the 2025-2030 timeframe.
Scenario three, where electrification is high, but battery costs have come down below the $100 per kWh, mass-reduction may not be a priority for automakers because they can increase the range by adding low-cost batteries. Thus, material choices for scenario three will be similar to scenario one. Scenario three may apply to the mass-market vehicles in the 2030-2035 timeframe.
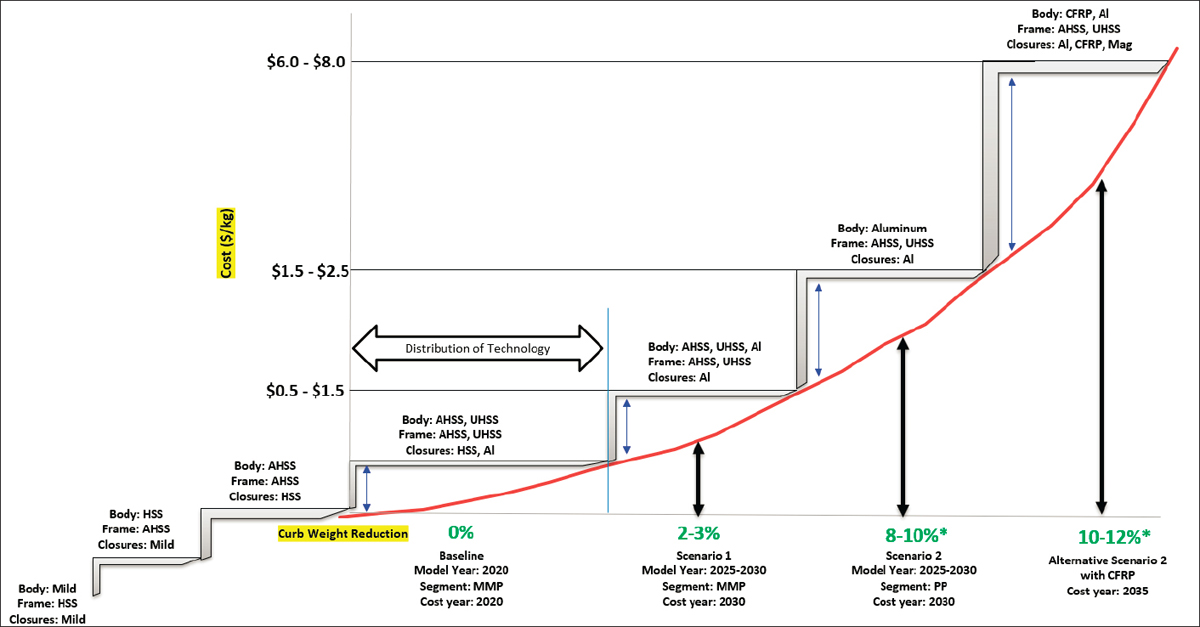
CAR researchers upgraded the materials for each BIW, frame, and closure component as per the identified material trends. We divided the costs of each scenario to its mass reduction opportunity (in kilograms) to get to the dollars per kilogram figure. Wherever the cost penalty range was too broad, we consulted with subject-matter-experts to narrow down the range. Table 17 shows the cost penalty range and mass reduction for each of the BoF scenarios. Figure 9 is the material roadmap for BoF vehicles with cost penalties.
Table 17: Cost and Mass Reduction Analysis for Body-on-Frame Vehicle Scenarios
| Scenario | Electrification Volume (CAFE/GHG proxy) | Battery Pack cost | Battery Density | Cost penalty per kg of weight saved | Expected Material Trend | Body+Frame Weight Reduction (2020 baseline) | Curb Weight Reduction (2020 baseline) |
|---|---|---|---|---|---|---|---|
| Baseline | Low | High | Low | NA | Body: AHSS, UHSS Frame: AHSS, UHSS Closures: HSS, Al | NA | NA |
| Scenario One | Low | High | Low | $0.5- $1.5 CY: 2030 | Body: AHSS, UHSS, Al Frame: AHSS, UHSS Closures: Al | 5% | 2-3% |
| Scenario Two | High | High | Low | $1.5 - $2.5 C.Y.: 2030 | Body: Aluminum Frame: AHSS, UHSS Closures: Al | 21% | 8-10% (with secondary) |
| Scenario Two (alternative) | High | High | Low | $6.0 - $8.0 CY: 2035 | Body: Aluminum, CFRP Frame: AHSS, UHSS Closures: Al, CFRP, Mag | 23% | 10-12% (with secondary) |
| Scenario Three | High | Low | Low | $0.0 - $1.0 CY: 2035 | Body: AHSS, UHSS, Al Frame: AHSS, UHSS Closures: Al | 5% | 2-3% |
Source: CAR Research
Real world mass reduction might be less due to mass add-back
For scenario two alternative, CFRP is used for Fender, Pickup box floor, and tailgate. Magnesium for I.P. beam and Radiator
Scenario one and three have similar materials but have different cost penalties due to different cost years.
Source: CAR Research
MMP – Mass Market Pickup
P.P. – Premium Pickups, for example GMC Sierra Denali
Cost Year – projected material and manufacturing cost year for analysis
*with secondary mass-reduction
Real world cost curve will be higher than the shown curve due to real-world constraints and mass add-back.
Body-on-Frame Cost Curve Discussion
Body-on-frame vehicles, which mostly comprise of pickups, currently use advanced material and manufacturing technologies. Two good examples are the Chevy Silverado, which primarily uses advanced steel grades to achieve lightweighting and performance targets, and the Ford F-150, which has an all-aluminum body with a high strength steel frame. Polymer composites are also currently used for applications such as pickup beds. Pickups in the U.S. are high volume, high price, performance-driven vehicles, which allow automakers to use advanced lightweight materials.
Similar to unibody vehicles, automakers may use a mixed-material strategy for BoF lightweighting. BIW likely be a mix of steel and aluminum. The frame will continue to use advanced steels with further design optimization. Aluminum will also play a key role in mass-reduction of closures. Polymer composites will see limited use in truck beds, tailgates, and inner closure components.
The cost penalty for using advanced materials increases when switching parts from steel or aluminum, but it increases exponentially when carbon fiber composites are introduced. Since the industry is very cost-sensitive, automakers will likely choose steel or aluminum as primary materials for high-volume pickups.
The roadmap showed in Figure 9 is the general trend identified through CAR research. The lightweighting targets, choice of materials, and cost penalty will depend on the specific vehicle program and the advancements in materials, battery technology, and government regulations.
Real-World Challenges
There are several real-world constraints and manufacturing challenges that automakers face when looking to include a new material into production. Examples of some of these challenges include the following (J. Baron, 2016):
- Global Platforms – Automakers develop common parts for use across global platforms to share engineering costs. The part sharing inhibits the individual design and mass optimization of vehicle models due to the use of these parts across various locations worldwide.
- Material availability – Vehicle manufacturing requires assembling thousands of parts built around the world. The sales volumes are very high. Therefore, automakers look for materials with a robust supply chain. Preference is given to materials with at least two suppliers to manage risks. Supply chains for new materials are not well established, making them difficult to use in high-volume vehicles.
- Material Qualification – When automakers redesign parts to optimize mass, they test them virtually and physically to ensure performance. Every automaker designs cars and trucks using internal design standards and best practices. The time and development process to qualify new materials and derive appropriate product specifications is extensive. The process can take as long as 3 to 4 years (Modi, n.d.).
- Manufacturing Technologies – manufacturing technology is different for almost every new material used in the automotive industry. Different materials also require different equipment and tooling. The assembly and handling processes also differ in few cases; for example, magnesium requires special handling and care to avoid chipping and the special care taken to avoid sanding and grinding, which produce potentially flammable dust. Mixed material vehicles can require mechanical fasteners, adhesives, and welding, all in the same assembly. Mixing materials involves isolation of the various materials to avoid corrosion.
- Cost versus Benefit - A material change may improve the product’s performance, but the cost may far exceed the real-life benefits. The car companies are constrained by cost and are forced to make practical decisions on material choices to make sure that the vehicle’s cost does not increase by an unprecedented amount. For example, carbon fiber composite materials provide strength to the vehicles’ structure while reducing weight by almost 50-60 percent compared to mild steel but are very expensive. On the other hand, aluminum can provide 20-30 percent mass-reduction at less cost than carbon fiber composites. Automakers balance cost versus benefit depending on vehicle programs.
- Stranded Capital – The established infrastructure with its sunk costs limits the speed of introducing new materials. For example, equipment for metal parts production is very different from equipment for polymer composites. Automakers often invest and commit to technologies for at least two redesign cycles before investing in equipment.
- Risk of part failure: New materials used in new ways can behave in unexpected ways. Part failure is constant risk companies have when new materials are introduced into the vehicles. These disruptions can drive recall costs or increase incidents of rework.
- Consumer Demand - Ride and handling quality are highly competitive differentiators in the market. While lighter cars generally handle better, other tradeoffs arise from lightweighting, such as transmitted noise and vibrations introduced by lightweight materials. Solving these issues adds weight back, taking away some of the lightweighting achieved. As discussed in the previous sections, automakers strive to continuously improve performance and safety driven by regulations and the competitive market. These improvements often add mass to the vehicles.
- Sustainability – Sustainability is becoming a crucial factor in the automotive industry. Many automakers and suppliers have begun to set high-level sustainability targets over the next decade and beyond. With the gamut of environmental laws and ethical reasons, the industry needs to ensure that the materials are not detrimental to the environment or general public health.
- Noise, vibration, and harshness (NVH) - As the customer has expectations to utilize their phone, laptops, etc. in their vehicles, the NVH demands have grown exponentially. Electric vehicles will further this need for sound deadening. Thin sheets of lightweight materials reduce mass but aggravate NVH. Solutions to counter the effect typically means a mass increase. Automakers struggle to balance lightweighting versus NVH requirements.
Bibliography
Automotive Plastics & Polymer Composites: A Roadmap for Future Mobility—Automotive Plastics. (n.d.). Automotive Plastics. Retrieved September 29, 2020, from https://www.automotiveplastics.com/roadmap-for-future-mobility/
Baron, J. (2016). Identifying Real World Barriers to Implementing Lightweighting Technologies and Challenges in Estimating the Increase in Costs. https://www.cargroup.org/publication/identifying-real-world-barriers-to-implementing-lightweighting-technologies-and-challenges-in-estimating-the-increase-in-costs/
Baron, J. S., & Modi, S. (2016). Assessing the Fleet-wide Material Technology and Costs to Lightweight Vehicles. http://www.cargroup.org/wp-content/uploads/2017/02/Assessing-the-Fleet-wide.pdf
Bernard, J., Khalaf, L., Kichian, M., & Mcmahon, S. (2008). Forecasting commodity prices: GARCH, jumps, and mean reversion. Journal of Forecasting, 27(4), 279–291. https://doi.org/10.1002/for.1061
Bregar, B. (2014, August 5). Price keeping carbon fiber from mass adoption. Plastic News. https://www.plasticsnews.com/article/20140805/NEWS/140809971/price-keeping-carbon-fiber-from-mass-adoption
Breitung, J., & Knuppel, M. (2018). How far can we forecast? Statistical tests of the predictive content. Deutsche Bundesbank Discussion Paper. https://www.econstor.eu/bitstream/10419/178500/1/1020157062.pdf
Brosius, D., & Das, S. (2017). IACMI Baseline Cost and Energy Metrics. IACMI. https://iacmi.org/wp-content/uploads/2017/12/IACMI-Baseline-Cost-and-Energy-Metrics-March-2017.pdf
Center for Automotive Research. (2020). Communications with industry stakeholders, companies and trade associations.
Chen, S.-L., Jackson, J. D., Kim, H., & Resiandini, P. (2014). What Drives Commodity Prices? American Journal of Agricultural Economics, 96(5), 1455–1468. https://doi.org/10.1093/ajae/aau014
Cook, J. J., & Booth, S. (2017a). Carbon Fiber Manufacturing Facility Siting and Policy Considerations: International Comparison. Clean Energy Manufacturing Analysis Center. https://www.nrel.gov/docs/fy17osti/66875.pdf
Cook, J. J., & Booth, S. (2017b). Carbon Fiber Manufacturing Facility Siting and Policy Considerations: International Comparison (NREL/TP--6A20-66875, 1365711; p. NREL/TP--6A20-66875, 1365711). https://doi.org/10.2172/1365711
Cost, Effectiveness, and Deployment of Fuel Economy Technologies for Light-Duty Vehicles (p. 21744). (2015). National Academies Press. https://doi.org/10.17226/21744
Das, S., Warren, J., West, D., & Laboratory, O. R. N. (2016). Global Carbon Fiber Composites Supply Chain Competitiveness Analysis. Technical Report, 116.
Das, S., Warren, J., West, D., & Schexnayder, S. M. (2016). Global Carbon Fiber Composites Supply Chain Competitiveness Analysis. Clean Energy Manufacturing Analysis Center. https://www.nrel.gov/docs/fy16osti/66071.pdf
DuckerFrontier North American Light Vehicle Aluminum Content and Outlook (August 2020). (n.d.). Retrieved September 29, 2020, from https://www.drivealuminum.org/researchresources/duckerfrontier-north-american-light-vehicle-aluminum-content-and-outlook-august-2020/
Ennis, B. L., Kelley, C. L., Naughton, B. T., Norris, R. E., Das, S., Lee, D., & Miller, D. A. (2019). Optimized Carbon Fiber Composites in Wind Turbine Blade Design. Sandia National Laboratories. https://www.energy.gov/sites/prod/files/2019/12/f69/SAND2019-14173-Optimized.pdf
Fuchs, E. R. H., Field, F. R., Roth, R., & Kirchain, R. E. (2008). Strategic materials selection in the automobile body: Economic opportunities for polymer composite design. Composites Science and Technology, 68(9), 1989–2002. https://doi.org/10.1016/j.compscitech.2008.01.015
Gargano, A., & Timmermann, A. (2014). Forecasting commodity price indexes using macroeconomic and financial predictors. International Journal of Forecasting, 30(3), 825–843. https://doi.org/10.1016/j.ijforecast.2013.09.003
Groen, J. J. J., & Pesenti, P. (2011, June 27). How Easy Is It to Forecast Commodity Prices? -Liberty Street Economics. Federal Reserve Bank of New York, Liberty Street Economics. https://libertystreeteconomics.newyorkfed.org/2011/06/how-easy-is-it-to-forecast-commodityprices.html
Groen, J. J. J., & Pesenti, P. A. (2010). Commodity prices, commodity currencies, and global economic developments (Working Paper No. 15743; Working Paper Series). National Bureau of Economic Research. https://doi.org/10.3386/w15743
Harper International. (2020, April 13). How to Turn Pitch into Carbon Fiber for Automotive Applications. AZO Materials. https://www.azom.com/article.aspx?ArticleID=19200
Heuss, R., Müller, N., van Sintern, W., Starke, A., & Tschiesner, A. (2012). Lightweight, heavy impact. McKinsey & Company. https://www.mckinsey.com/~/media/mckinsey/dotcom/client_service/automotive%20and%20assembly/pdfs/lightweight_heavy_impact.ashx
Husain, A. M., & Bowman, C. (2004). Forecasting Commodity Prices: Futures Versus Judgment. IMF Working Papers, 04(41), 1. https://doi.org/10.5089/9781451846133.001
Issler, J. V., Rodrigues, C. F., & Burjack, R. (2013). Using common features to understand the behavior of metal-commodity prices and forecast them at different horizons [Working Paper]. Fundação Getulio Vargas. Escola de Pós-graduação em Economia. http://bibliotecadigital.fgv.br/dspace/handle/10438/10351
Jacks, D. S., & Stuermer, M. (2018). What Drives Commodity Price Booms and Busts? (SSRN Scholarly Paper ID 3265115). Social Science Research Network. https://doi.org/10.2139/ssrn.3265115
Kelly, T. D., & Matos, G. R. (2015). Historical Statistics for Mineral and Material Commodities in the United States. U.S. Geological Survey. https://www.usgs.gov/centers/nmic/historical-statistics-mineral-and-material-commodities-united-states
Krupitzer, R. (2012). A Steel Industry Perspective on Advanced High-Strength Steels. Steel Market Development Institute. https://www.nist.gov/system/files/documents/mml/acmd/structural_materials/2012_FEB-9-10Krupitzer_AHSS-Workshop-FINALFINAL.pdf
Labys, W. C. (2003). New Directions in the Modeling and Forecasting of Commodity Markets. Mondes en developpement, no 122(2), 3–19. https://www.cairn.info/revue-mondes-en-developpement-2003-2-page-3.htm
Matos, G. R. (2015). Historical Global Statistics for Mineral and Material Commodities. U.S. Geological Survey. https://www.usgs.gov/centers/nmic/historical-global-statistics-mineral-and-material-commodities
Mazumdar, S. (2016). How to Succeed in the Automotive Market with Composites. Lucintel presentation to Composites Europe. https://www.composites-europe.com/dl/71/download/pdf/CE2016-Vortrag_01-12-2016_Lucintel.pdf
Modi, S. (2016). Material Qualification in the Automotive Industry. https://www.cargroup.org/publication/material-qualification-in-the-automotive-industry-2/
Modi, S., & Vadhavkar, A. (2019). Technology Roadmap: Materials and Manufacturing. Center for Automotive Research. https://www.cargroup.org/wp-content/uploads/2019/10/Technology-Roadmap_Materials-and-Manufacturing.pdf
Nunna, S., Blanchard, P., Buckmaster, D., Davis, S., & Naebe, M. (2019). Development of a cost model for the production of carbon fibres. Heliyon, 5(10). https://doi.org/10.1016/j.heliyon.2019.e02698
Papp, J. F., Bray, E. L., Edelstein, D. L., Fenton, M. D., Guberman, D. E., Hedrick, J. B., Jorgenson, J. D., Kuck, P. H., Shedd, K. B., & Tolcin, A. C. (2008). Factors that influence the price of Al, Cd, Co, Cu, Fe, Ni, Pb, Rare Earth Elements, and Zn. https://pubs.usgs.gov/of/2008/1356/
Pincheira, P., & Hardy, N. (n.d.). Forecasting Aluminum Prices with Commodity Currencies. November 2019. https://doi.org/10.13140/RG.2.2.32843.95525
Reinhart, C., & Borensztein, E. (1994, June). The Macroeconomic Determinants of Commodity Prices [MPRA Paper]. https://mpra.ub.uni-muenchen.de/6979/
Rocky Mountain Institute. (2013). Kickstarting the Widespread Adoption of Automotive Carbon Fiber Composites. Rocky Mountain Institute. https://rmi.org/wpcontent/uploads/2017/05/RMI_Document_Repository_Public-Reprts_201301_AutocompositesFinalReport.pdf
Singh, H. (2016). Draft Final Report Mass Reduction for Light-Duty Vehicles for Model Years 2017-2025. EDAG, Inc. https://www.nhtsa.gov/staticfiles/rulemaking/pdf/cafe/Mass-Reduction-Feasibility-2014-Silverado.zip
Sloan, J. (2017). Autocomposites and the myth of $5/lb carbon fiber. CompositesWorld. https://www.compositesworld.com/articles/autocomposites-and-the-myth-of-5lb-carbon-fiber
United Nations. (2020, August). U.N. Comtrade Database. https://comtrade.un.org/data
U.S. Bureau of Economic Analysis. (2020a). Gross domestic product (implicit price deflator) [A191RD3A086NBEA] (Annual, 1929-2019). retrieved from FRED, Federal Reserve Bank of St. Louis. https://fred.stlouisfed.org/series/A191RD3A086NBEA
U.S. Bureau of Economic Analysis. (2020b). Gross Domestic Product: Implicit Price Deflator [GDPDEF] (Quarterly, 1947-2020:Q2). retrieved from FRED, Federal Reserve Bank of St. Louis. https://fred.stlouisfed.org/series/GDPDEF
U.S. Bureau of Labor Statistics. (2020). Producer Price Index by Commodity for Metals and Metal Products: Iron and Steel [WPU101]. retrieved from FRED, Federal Reserve Bank of St. Louis. https://fred.stlouisfed.org/series/WPU101
U.S. Geological Survey. (2012). Mineral Commodity Summaries: Aluminum. U.S. Geological Survey. https://s3-us-west-2.amazonaws.com/prd-wret/assets/palladium/production/mineralpubs/aluminum/mcs-2012-alumi.pdf
U.S. Geological Survey. (2013). Metal Prices in the United States Through 2010. U.S. Geological Survey Scientific Investigations Report 2012–5188. https://pubs.usgs.gov/sir/2012/5188/
U.S. Geological Survey. (2016). Mineral Commodity Summaries: Aluminum. U.S. Geological Survey. https://s3-us-west-2.amazonaws.com/prd-wret/assets/palladium/production/mineralpubs/aluminum/mcs-2016-alumi.pdf
U.S. Geological Survey. (2020). Mineral Commodity Summaries: Aluminum. U.S. Geological Survey. https://pubs.usgs.gov/periodicals/mcs2020/mcs2020-aluminum.pdf
Vehicle Technologies Office. (2013). WORKSHOP REPORT: Trucks and Heavy-Duty Vehicles Technical Requirements and Gaps for Lightweight and Propulsion Materials. Department of Energy, Energy Efficiency & Renewable Energy. https://www.energy.gov/sites/prod/files/2014/03/f13/wr_trucks_hdvehicles.pdf
Vehicle Technologies Office. (2019). Vehicle Lightweighting Program Progress Status – 2019. U.S. Department of Energy. https://www.energy.gov/sites/prod/files/2020/06/f75/DOR_Vehicle_Lightweighting_FINAL_DRAFT.pdf
Vehicles Technology Office. (2013). WORKSHOP REPORT: Light-Duty Vehicles Technical Requirements and Gaps for Lightweight and Propulsion Materials. Department of Energy, Energy Efficiency & Renewable Energy. https://www.energy.gov/sites/prod/files/2014/03/f13/wr_ldvehicles.pdf
Warren, C. D. (2011). Lower Cost, Higher Performance Carbon Fiber. Oak Ridge National Laboratory. https://www.energy.gov/sites/prod/files/2014/03/f11/compressed_hydrogen2011_4_warren.pdf
Winter, D. (n.d.). Lightweighting vs. Bigger Batteries in Electric Vehicles. 23.
WorldAutoSteel. (n.d.). Advanced High-Strength Steel (AHSS) Definitions. WorldAutoSteel. https://www.worldautosteel.org/steel-basics/automotive-advanced-high-strength-steel-ahss-definitions/
Appendix A: Curb Weight and Footprint Comparison
The charts below compare the baseline fleet’s (33 top-selling vehicles in the MY2020 fleet) curb weight and footprints of vehicles with their previous generation.