
2
Plastic Production and Global Trade
Plastic production operates at a global scale. As described in subsequent chapters, the United States contributes to the problem of global ocean plastic waste as a result of plastics produced and used in this country or exported to other nations, as well as from imported plastics manufactured elsewhere that enter the U.S. waste stream. This chapter describes the production of materials that may become plastic waste: feedstocks for plastic resins, the production process, biodegradability of plastics, the types of products generated from plastics, and characteristics that create challenges for the waste stream and our environment. The vast majority of plastics are produced from natural gas or petroleum feedstocks, with a small portion from biobased (renewable) feedstocks, resulting in implications for plastic production trends, potential impacts of production, and waste management.
PROPERTIES OF PLASTICS
Chemical Structure of Plastics
Of the world’s thermoplastics (plastic polymers forming long, one-dimensional [linear] chains that can be melted by heating and reformed), 76.7% are hydrocarbon plastics (Law and Narayan 2022). Hydrocarbon plastics are polymers made from monomers composed of carbon and hydrogen (ISO 472:2013). They are carbon-carbon backbone polymers as shown in Figure 2.1. Examples of hydrocarbon plastics include linear
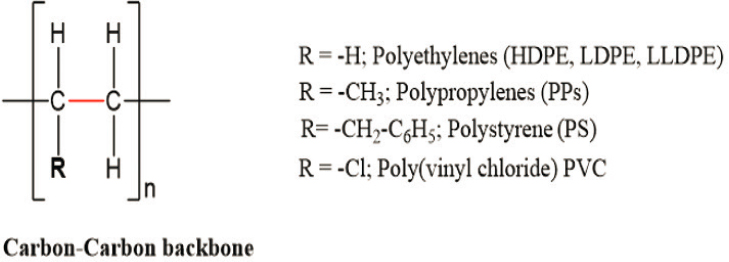
low-density polyethylene (LLDPE), low-density polyethylene (LDPE), high-density polyethylene (HDPE), polypropylene (PP), polystyrene (PS), and polyvinyl chloride (PVC) (Agamuthu et al. 2019, Law and Narayan 2022). The strong carbon-carbon bond makes these plastics resistant to biodegradation at a rate incompatible with timely removal from the environment. This resistance to biodegradation, together with plastics’ lightweight and ubiquitous nature, results in persistence and accumulation of hydrocarbon plastics in natural environments.
Plastic Feedstocks
Synthetic plastics can be produced from fossil feedstocks or renewable biomass. Globally, more than 99% of plastics are produced from fossil feedstocks—petroleum (crude oil) or natural gas (British Plastics Federation 2019, CIEL 2017, 2020, Skoczinski et al. 2021).
Biobased plastics are plastics in which the carbon originates, in whole or in part, from renewable biomass feedstock such as sugar cane, canola, and corn. Biobased plastics are less than 1% of all plastics produced globally (European Bioplastics 2020). Biobased carbon content of a product is measured as the amount (mass) of biobased carbon as a percentage of total organic carbon (ASTM D6866, ISO 16620 series, USDA BioPreferred program).
Biodegradability of Plastics
Degradation, and specifically biodegradation, depends on the chemical and physical structure of the plastics and the characteristics of the receiving environment (e.g., industrial composting, soil, ocean, backyard
composting), not from where the carbon originates. For example, hydrocarbon plastics (i.e., plastics with a carbon-carbon backbone) can be manufactured from biomass carbon feedstocks. These plastics are biobased, but they will have identical chemical structure as those manufactured using fossil carbon feedstocks and exhibit the same non-biodegradable, persistent characteristics.
The complex relationship between biobased plastics and biodegradability contributes to consumer and labeling confusion (IEA Bioenergy 2018, U.S. EPA 2020). Biobased refers to the plastic feedstock and does not relate to how biodegradable the plastic is (Closed Loop Partners 2020, Law and Narayan 2022). Several, but not all, biobased plastics are biodegradable and industrially compostable at end of life.
PLASTIC PRODUCTION
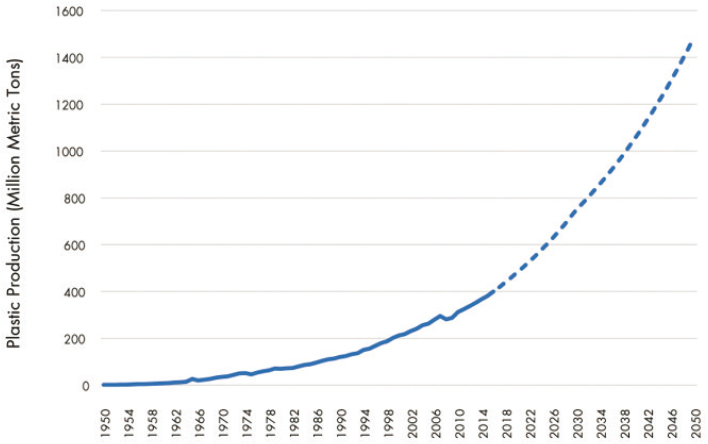
Over a 50-year period, global plastic production increased nearly 20-fold, from 20 million metric tons (MMT) in 1966 to 381 MMT in 2015 (Geyer, Jambeck, and Law 2017). Table 2.1 summarizes recent estimates of annual and cumulative production of plastics in the United States and globally. Approximately one-fifth (19%) of 2019 global plastic production occurred in North America, second to Asia (Plastics Europe 2020). Plastic production is projected to increase by 200% and 350% by 2035 and 2050, respectively (Geyer, Jambeck, and Law 2017, Lebreton and Andrady 2019, World Economic Forum, Ellen MacArthur Foundation, and McKinsey & Company 2016). More than 90% of plastics are made from virgin fossil feedstocks, which utilize roughly 6% of global oil consumption (World Economic Forum, Ellen MacArthur Foundation, and McKinsey & Company 2016).
With an estimated 3.5–3.8% annual growth rate (World Economic Forum, Ellen MacArthur Foundation, and McKinsey & Company 2016), plastics are projected to make up approximately one-third of oil demand growth in 2030 and almost half by 2050 (IEA 2018). The World Economic Forum and International Energy Agency recognize petrochemical, and particularly plastic, growth as an essential component in oil demand growth through 2050 (CIEL 2020). The fracking boom produced a surplus of cheap natural gas (CIEL 2020), and oil companies are strengthening and integrating petrochemical production and markets into their business models (IEA 2018). Oil and gas companies have invested more than $200 billion in plastic production (CIEL 2020) and intend to invest another $400 billion in virgin plastic production in the next 5 years (Bond et al. 2020, Brock 2020). By contrast, oil and gas companies will dedicate $2 billion to reducing plastic waste in the same period (Brock 2020).
TABLE 2.1 Recent Estimates of Annual and Cumulative Production of Plastics in the United States and Globally
| Data Source | Annual Production | Cumulative Production Since ~1950 | ||
|---|---|---|---|---|
| USA | Global | USA | Global | |
| American Chemistry Council 2021b Includes HDPE, PVC, LDPE, LLDPE, PP, PS, EPS, TPU Excludes PET, thermosets, resin fibers |
41 MMT in 2020a | – | [1,500–2,000] MMT | – |
| Plastics Europe 2020 Includes thermoplastics, thermosets, polyurethanes, elastomers, adhesives, coatings, sealants, PP fibers Excludes PET, PA, and polyacryl fibers |
70 MMT in 2019b | 368 MMT in 2019 | – | – |
| Geyer, Jambeck, and Law 2017 Includes thermoplastics, thermosets, polyurethanes, elastomers, coatings, and sealants; polyester, polyamide, and acrylic fibers; additives |
– | 407 MMT in 2015 | – | 8,300 MMT in 2015 |
NOTE: Information about what is included and excluded from each estimate is taken directly from each data source. Square brackets indicate “on the order of” or “approximately.” EPS = expanded polystyrene, HDPE = high-density polyethylene, LDPE = low-density polyethylene, LLDPE = linear low-density polyethylene, NAFTA = North American Free Trade Agreement, PA = polyamide, PET = polyethylene terephthalate, PP = polypropylene, PS = polystyrene, PVC = polyvinyl chloride, TPU = thermoplastic polyurethane.
a See Table 2.2 for definition of “domestic production,” which may also include Canada and Mexico.
b Annual USA production is for NAFTA countries.
Importantly, the fossil fuel industry has benefited from continued tax subsidies for the past century. Historically, tax subsidies were necessary to incentivize new energy sources in the United States (Coleman and Dietz 2019). In 2015, the International Monetary Fund calculated U.S. energy subsidies to amount to $649 billion (IMF 2019), with 80% going to natural gas and crude oil (Coleman and Dietz 2019). Because plastics are made from fossil fuels, these tax subsidies greatly reduce the cost of fossil fuel feedstocks, making it a more profitable option for plastic production (CIEL 2018).
North American Plastic Production Trends
Data on U.S. plastic production was provided by the American Chemistry Council (ACC) (American Chemistry Council 2021b). ACC notes that the “data for all years may not truly be comparable, affecting the validity of growth rate calculations.” In addition, there are variations within the data on what is considered “domestic” for each resin. No data for any resin used in this report are based only on U.S. production data. Instead, they include Canada or represent all of North America (United States, Canada, Mexico). ACC’s methodology indicates that its reports cover 95–100% of total production in the United States/Canada. Furthermore, data are not available to show plastic usages by sector for the United States or North America. The data from ACC do not distinguish between fossil-based or biobased plastics.
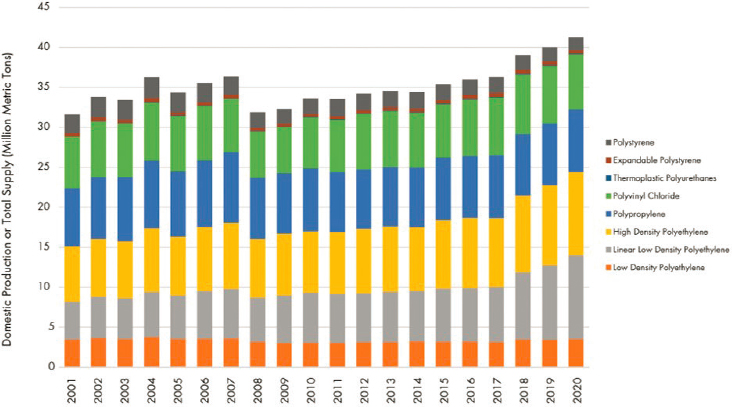
Although individual thermoplastic resin production trends vary, data provided by ACC show that the overall trend for resin supply and production in North America has been increasing over the past 20 years (Figure 2.2). ACC does not report data on polyethylene terephthalate (PET), thermoset, and resin fibers, and the committee was unable to identify data for these materials. In 2019, Plastics Europe estimated 70 MMT
TABLE 2.2 Definition of “Domestic” for a Variety of Thermoplastic Production Data Provided by the American Chemistry Council (ACC)
| Plastic Polymer (Abbreviation) | Definition of “Domestic” |
|---|---|
| Polyethylene terephthalate (PET) | ACC does not collect data on PET |
| High-density polyethylene (HDPE) | United States and Canada |
| Polyvinyl chloride (PVC or Vinyl) | United States and Canada |
| Low-density polyethylene (LDPE) | United States and Canada |
| Linear low-density polyethylene (LLDPE) | United States and Canada |
| Polypropylene (PP) | For 2001–2006: United States and Canada |
| For 2007–2020: North American Free Trade Agreement (NAFTA) | |
| Polystyrene (PS) | For 2001–2010: United States and Canada |
| For 2011–2020: NAFTA | |
| Expanded polystyrene (EPS) | United States and Canada |
| Thermoplastic polyurethane (TPU) | United States and Canada |
SOURCE: American Chemistry Council (2021b).
of plastic resins for North America, which accounts for 19% of global production (Plastics Europe 2020). Using ACC’s data for eight types of resin, the committee estimates that a total of 41.1 MMT of plastic resins was produced in North America (Table 2.3). The PET Resin Association reports 2.8 MMT of PET production in North America and no specific year is noted (Heller, Mazor, and Keoleian 2020, PET Resin Association 2015).
For the eight groups of resin illustrated in Table 2.2, 41.1 MMT of plastics were produced in 2020 in North America. In 2020, both LLDPE and HDPE had production values at 10.4 MMT (Table 2.2). Plastic production trends in North America over the past two decades have varied for different plastic resins (Figure 2.3). LLDPE has been steadily increasing in domestic production over the past 20 years to reach 10.4 MMT in 2020 (Figure 2.3). For PVC, other than a dip in domestic production in 2008 and the following few years (likely due to a period of recession), production has remained consistent over the past 10 years. Around the same time period as the dip in production (2008), domestic sales decreased, but exports increased, keeping production relatively consistent (Figure 2.3). Total supply of PS has had an overall decreasing trend since
TABLE 2.3 Common Thermoplastic Resin Types, Associated Resin Codes, Their Predominant Uses, and Quantity of Resin Supply/Production by Weight in Fiscal Year 2020 in North America as Reported by the American Chemistry Council by Plastic Type
| Plastic Polymer (Abbreviation) | Resin Code | Uses | Million Metric Tons (MMT) |
|---|---|---|---|
| Polyethylene terephthalate (PET) | 1 | Single-use beverage bottles, food containers, textiles, etc. | Data not available |
| High-density polyethylene (HDPE) | 2 | Milk bottles, detergent bottles | 10.4 |
| Polyvinyl chloride (PVC) | 3 | Window frames, profiles, floor and wall coverings, pipes, cable insulation, garden hoses, inflatable pools, etc. | 6.9 |
| Low-density polyethylene (LDPE) | 4 | Single-use plastic bags, reusable bags, trays and containers, agricultural film, food packaging film, etc. | 3.5 |
| Linear low-density polyethylene (LLDPE) | 4 | Single-use plastic bags, reusable bags, trays and containers, agricultural film, food packaging film, etc. | 10.4 |
| Polypropylene (PP) | 5 | Food packaging, candy and snack wrappers, microwave containers/dishware, pipes, automotive parts, non-woven textiles, personal protective equipment/masks, fishing gear and nets, etc. | 7.8 |
| Polystyrene (PS) | 6 | Food packaging (e.g., cups, utensils), electrical and electronic equipment, etc. | 1.6 |
| Expanded polystyrene (EPS) | 6 | Food packaging (to-go containers, coolers), building insulation, electrical and electronic equipment, inner liner for fridges, etc. | 0.4 |
| Thermoplastic polyurethane (TPU) | 7 “other category” | Clothing (Spandex), home building, automotive, industrial products | 0.1 |
| Total (2020) | 41.1 |
NOTE: All of these plastics have carbon-carbon backbones except for PET and TPU.
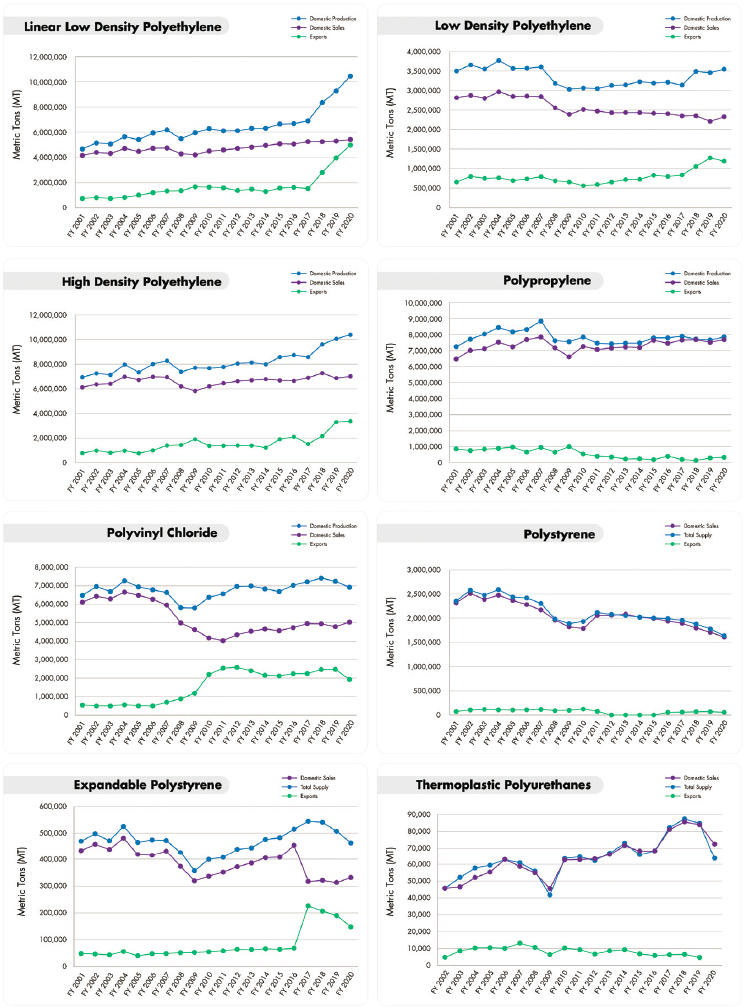
2005, with a consistent decrease over the past 10 years. Most of the supply is used domestically, with exports of PS being consistently relatively low (Figure 2.3).
COVID-19 Impacts on Plastic Use
While the COVID-19 pandemic has highlighted the importance of and the heavy reliance on single-use plastics in the medical field, the pandemic has significantly increased plastic usage—single-use plastics in particular—and associated waste across many aspects of daily life. This is in large part due to the unprecedented demand for personal protective equipment (PPE) for both healthcare workers and the average citizen, safety screens, and single-use plastics, such as shipping plastics, plastic bags, and restaurant takeout containers (De Blasio and Fallon 2022).
PPE is largely made from plastics. Surgical and N95 masks are commonly made of PP or PS (Henneberry 2020, Patrício Silva et al. 2021), although polycarbonate, polyethylene, polyester, polyurethane, and polyacrylonitrile are also used (Chellamani, Veerasubramanian, and Vignesh Balaji 2013). Polycarbonate is normally used for the production of visors (Roberge 2016), goggles, and glasses (Edwards 2020). Disposable medical gowns are made up of different synthetic fibers—including PP, polyester, and polyethylene—while reusable gowns are made from 100% cotton, 100% polyester, or a polyester/cotton blend (Kilinc 2015). As such, plastics have become an essential tool to protect against transmission of the COVID-19 virus (De Blasio and Fallon 2022, Dharmaraj et al. 2021).
PLASTIC TRADE
To assess U.S. exports and imports of plastics and plastic-containing goods, the U.S. Census Bureau Comtrade database was queried for the category “39. Plastics and articles thereof” (U.S. Census Bureau 2021). This classification system is based on coding for all commodities trading around the world. “Plastics and articles thereof” includes plastic polymers in primary forms, tubes, self-adhesive plates, baths, sinks, packaging goods, tableware, builders’ plastics, and scrap waste, among other options (Comtrade 2020). This category does not include apparel and other clothing accessories (Codes 59–63) or toys and games (Code 95), which may also have plastic components.
Two data measures were downloaded—the customs value (gen), which is the average price paid per unit; and the card count, which is the number of individual import line items. This information was used to create Figures 2.4 and 2.5.

U.S. Exports
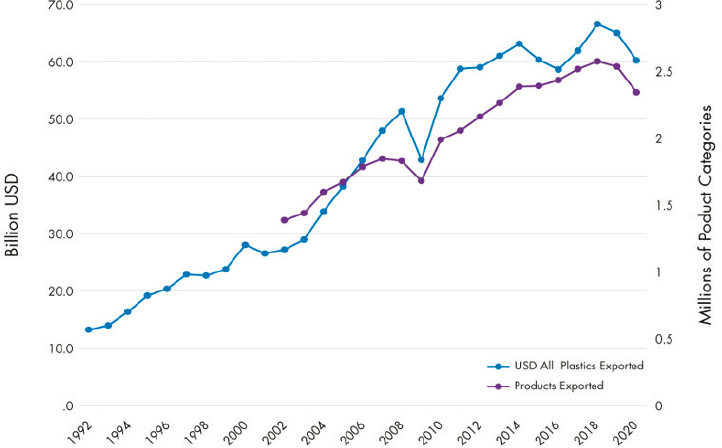
According to the U.S. Census Trade data, in 2020, the United States exported 2,342,368 categories of plastic products (“the number of individual export line items”) at a value of $60.2 billion. This was a decrease from 2019 when 2,534,738 categories of plastic products were exported at a value of $65 billion. The trend of the USD value of plastic product exports and number of categories over the past nearly three decades have been increasing overall (Figure 2.4).
Although some domestic production of plastics is intended for export, it is unclear how increased plastic regulation around the globe will impact exports/imports (CIEL 2020). A UNEP (2018) report noted that 127 out of 192 countries studied have implemented some form of regulations to reduce plastic waste, including limiting plastic use. In particular, 61 countries, predominantly in Africa, have adopted manufacturing and import bans. As such, it is unclear if foreign markets can completely absorb the surplus supply of U.S. plastic production.
U.S. Imports
According to the U.S. Census Trade data, in 2020, the United States imported 5,747,472 categories of plastic products (“the number of individual import line items”) at a value of $58.9 billion. This was an increase from 2019 when 5,390,001 categories of plastic products were imported at a value of $57.4 billion. In both years, the imports were a larger number of categories (more than double the categories that were exported), but the total value of imports was less than exports. The trend of the USD value of plastic product imports and number of categories over the past nearly three decades has been overall increasing (Figure 2.5).
These export and import data suggest that the United States plastic imports comprise more lesser value items and plastic exports comprise more higher value items.
Overview of Plastic Economics
The market price of plastics reflects their production cost, referred to in economics as a “direct cost.” But it does not reflect indirect costs or benefits, such as the environmental and ecological costs (e.g., leakage of plastic waste into the environment, cost of proper disposal) or benefits (e.g., ecosystem services). Indirect effects, which impose costs or benefits on society and/or the environment that are not reflected in market prices, are referred to as “externalities” in economics. Failure to include those externalities in the price consumers pay for plastics may lead to greater reliance on plastics than is socially optimal. In order to account
for externalities, market prices and benefit-cost analyses should expand and include more sources of valuation.
Kemp-Benedict and Kartha (2019) define value systems, value, and valuation:
Value systems are normative and moral frameworks that guide action. Within their value systems, people assign value to actions or objects in the degree to which they meet user-specified goals, objectives, or conditions. Valuation is then the process by which values are assigned to actions and objects.
Historically, economic theory distinguishes between “use value” and “exchange value.” Use value is the value of a commodity in use, such that it satisfies some human or societal need or desire. Exchange value is the value of a commodity in exchange, such that a commodity can be exchanged for something else. While classical economists would agree that ecosystem services have a high use value, their theory suggests that a commodity’s exchange value is derived from the cost of labor to produce it. Because natural capital and ecosystem services are taken from nature at no cost, their exchange value is assumed to be zero (Kemp-Benedict and Kartha 2019). When natural capital is not clearly incorporated into economic decision making, ecosystem services are uncounted benefits (positive externalities), and the harms done to an ecosystem and its services are uncounted costs (negative externalities) (Kemp-Benedict and Kartha 2019). Environmental economic theory suggests a more complete accounting of values into a total economic value (Goulder and Kennedy 1997). Total economic value is the sum of market and nonmarket values, direct use value and indirect use value, option value, existence value, and bequest value.1
When all costs and benefits of using plastic products are taken into account, the net benefits of using plastics (i.e., the private value to people of using plastics, minus private production and waste disposal costs) are considered together with the environmental and human health externalities
___________________
1 While exchange value and use value are the most commonly used distinctions of value, environmental economists recognize further distinctions among value, including market and nonmarket values; direct use value and indirect use value; option value; existence value; and bequest value. Market value is defined as the “balance between production costs and what people are willing to pay [while] non-market value is something that is not bought or sold directly” (GreenFacts 2021). Direct use value is consumptive and indirect use value is the “value of leaving something alone” (Kemp-Benedict and Kartha 2019). Option value is the value of postponing use to an indeterminate future. Existence value is the benefit people receive from knowing that a particular natural resource exists (e.g., Antarctica). Bequest value is the value of satisfaction people experience when natural resources are preserved or conserved.
of plastic production and plastic waste (Baumol and Oates 1988). The environmental costs of plastic waste are related to the amount and impacts of plastics that “leak” into the environment, including the ocean, related to total plastic production and plastic waste management (see Chapter 3). If economic assessments focus only on market value or private cost and do not consider externalities (positive or negative), it results in an incomplete understanding of marine plastic waste’s economic impacts (Jambeck et al. 2020) and incomplete, distorted price information for consumers.
In terms of private production costs and benefits, plastics remain one of the world’s most efficient and cost-effective classes of materials. Their properties can be modified to meet specific needs, and they can be molded into a variety of shapes and products (Hopewell, Dvorak, and Kosior 2009, OECD 2018, UNEP 2014). Because 99% of plastics are made from fossil-based feedstocks and the fossil fuel industry is subsidized, plastics are an artificially cheap commodity (CIEL 2018). This means that substitution with alternative, often more expensive materials such as concrete, wood, metal, and glass usually comes at a private cost (cost paid by the consumer or producer), and can lead to externalities (uncompensated social or environmental benefits or costs) (Abbott and Sumaila 2019, Franklin Associates 2014, Pilz, Brandt, and Fehringer 2010). For example, glass bottle substitutions would reduce the external cost of marine plastic waste. At the same time, replacing plastic beverage bottles with glass would increase private costs due to higher raw material prices and increased transportation costs due to the increase in weight. The increase in weight would also increase carbon emitted in transport, an external environmental cost.
This type of benefit-cost analysis that considers all values could be a powerful tool to reach sustainability goals. By including the value of ecosystem goods and services into the total economic value, reducing plastic waste can be used to preserve the oceanic natural capital and its services. Additionally, benefit-cost analyses can assist in reaching economic and welfare objectives. Currently, as negative externalized costs rise, the positive relationship between gross domestic product growth and welfare decreases, vanishes, or even becomes negative (Daly 2019). Importantly, environmental justice must be considered because the benefits and costs are not distributed equally—socially, geographically, or ecologically (see Box 1.3 for a more complete discussion of the unequal impacts of plastics). While internalizing externalities will increase direct costs, the benefit-cost analysis can assess whether something is economically wise (e.g., internal costs are lower than external costs). To make this assessment, natural capital must be valued.
While circular economic principles attempt to internalize externalities by significantly increasing the recycling of materials, lengthening product lifetimes, and primarily using renewable resources (Daly 2019,
World Economic Forum, Ellen MacArthur Foundation, and McKinsey & Company 2016), the net plastic production is projected to increase over time (Figure 2.6). The plastic industry expects growing populations and rising household incomes in much of the world to create new markets for the increased global plastic production capacity (CIEL 2018, UNEP 2014), which will ultimately result in increased plastic waste. However, it is unclear whether it is the consumers who want plastics or producers using plastic packaging as a cheap material to ensure their product’s longevity and safety. Unless efforts are undertaken to more effectively manage the increased waste, an increase in environmental contamination by plastic waste will likely result (Borrelle et al. 2020). Given the important role of economics as a driver of both plastic production and consumption as well as recycling (Issifu, Deffor, and Sumaila 2021), the use of economic instruments to reduce plastic pollution is one of the levers available to both governments and private actors (Abbott and Sumaila 2019). Steps to internalize externalities of plastics, whether by adopting circular economy principles or by other means, can reduce plastic consumption, production, and waste streams.
CHAPTER SYNOPSIS
The United States plays a major role in global plastic production by producing, importing, and exporting plastic resins and plastic products. The vast majority of plastics are made from fossil sources. The economics of plastic production, which are linked closely with the fossil-based energy industry, have created barriers to adopting new “circular economy” concepts designed to conserve resources and reduce waste—from recycling to creating innovative reuse systems and developing new materials with end-of-life management as a primary design principle. In addition, it is important, but challenging, to communicate to consumers, policy makers, and others the nuances associated with material biodegradability and compostability, including appropriate use and management at end of life. While such new materials must play a role going forward, they are not a panacea. Furthermore, the natural environment should not be considered a large-scale, viable option for waste treatment.
As discussed in the next chapter, when plastic resins or products become plastic waste, those responsible for achieving an effective “end of life” for that plastic waste (reuse, recycle, dispose, compost)—from consumers and communities to local and state governments—face major systemic, economic, and policy barriers. Some of these barriers are “baked in” at the plastic production stage. There is a major economic and societal need and opportunity for the sectors involved in plastic production to formulate and design plastics and plastic products with a viable and safe end of life in mind. Some of this work is beginning or continuing, but an increase in scale is needed to meet the plastic waste challenges associated with current and forecasted plastic production and use.
PRIORITIZED KNOWLEDGE GAPS
A major data gap for plastic production is having transparent and accessible data on plastic production. As seen in this chapter, data on a wide array of plastic resin types could not be found and utilized. Without having access to plastic production data, it can be difficult to anticipate and react to production changes or to determine effective strategies to bolster plastic waste management.
FINDINGS AND CONCLUSION
Finding 1: Virgin plastic prices are artificially low due to fossil fuel subsidies; therefore, virgin plastics are more profitable to produce.
Finding 2: Approximately one-fifth (19%) of 2019 global plastic production occurred in North America, second to Asia. U.S. production
of virgin plastics continues to increase, in part due to low costs of production for fossil-based feedstocks and rising production capacity.
Finding 3: The complex international system of plastic production, trade, and use complicates efforts to fully quantify the role of the United States in plastic production, export, import, use, and the country’s contribution to plastic pollution.
Conclusion 1: Because the vast majority of plastics are carbon-carbon backbone polymers and have strong resistance to biodegradation, plastics accumulate in natural environments, including the ocean, as pervasive and persistent environmental contaminants.


