
4
Physical Transport and Pathways to the Ocean
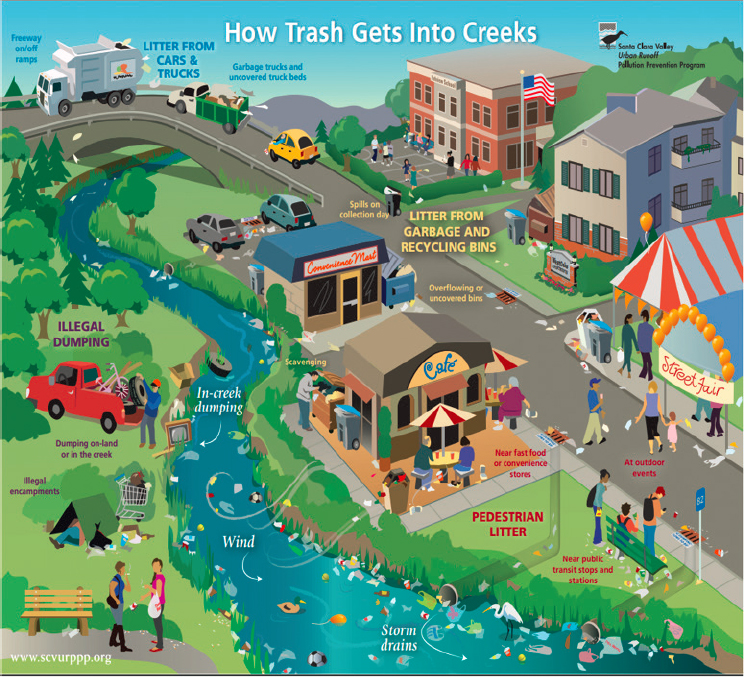
Plastic waste has a complex life cycle, moving from waste sources along a variety of long or short, direct or convoluted paths (Alimi et al. 2018, Bank and Hansson 2019, Eriksen et al. 2014, Hoellein and Rochman 2021). The ocean is Earth’s ultimate sink, lying downstream of all activities. Almost any plastic waste on land has the potential to eventually reach the ocean or the Laurentian Great Lakes. Major paths of plastics to the ocean are summarized in Figure 4.1. These include urban, coastal, and inland stormwater outfalls; treated wastewater discharges; atmospheric deposition; direct deposits from boats and ships; beach and shoreline wastes; and transport from inland areas by rivers and streams (Dris, Gasperi, and Tassin 2018). This chapter reviews the many pathways that plastic waste can take from land to enter the ocean.
In the course of transport, plastic waste may encounter mechanisms that sort particles by density, size, and other characteristics that, in turn, affect their subsequent transport, physical and chemical characteristics, and ultimate fate in the environment. These processes affect the storage, availability, and impact of plastic waste at locations in shoreline, nearshore, and offshore environments. Processes that sort particles and influence their transport along various pathways are described in this chapter. Transformations that affect their size, number, shape, chemical composition, and biological and physical reactivity are discussed further in Chapter 5.
Figure 4.1 lists major pathways and mechanisms that move plastic waste to the ocean. The pathways are broadly categorized as waterborne,

airborne, and direct deposit of plastic waste into the ocean. While the contributions of each pathway to the amount of plastic waste in the ocean are difficult to quantify, the following describes the state of knowledge about modes and patterns of transport, as well as examples of measurements or models of plastic waste transport along each pathway.
WATERBORNE PATHWAYS
Waterborne pathways of plastic waste include river flows, stormwater discharge, wastewater treatment plant effluent, and beach and shoreline wastes (see Figure 4.2). In the absence of a comprehensive U.S. national study, the presumptive pathway transporting the highest mass of plastic waste from both inland and coastal regions to the ocean is rivers and waterways. The mobilization of plastic waste along these pathways surges with floods and streamflow, as greater inundation gathers plastics from larger and more varied geographic areas and propels them seaward more energetically. These pathways also often bring about important transformations, delays, and barriers to the plastic waste they transport. Plastic particles’ size, shape, and bulk density affect their waterborne transport (Haberstroh et al. 2021).
River Flow
Rivers and smaller waterways (e.g., streams, canals, channels) are major pathways for plastic waste entering the ocean from a variety of sources including littering (intentional or accidental), illegal dumping, and landfill leakage, as well as stormwater outfalls, combined sewer overflows, wastewater treatment plant effluent, and atmospheric deposition, which are described as pathways in more detail in subsequent sections (Williams and Simmons 1997, Windsor et al. 2019, Woodward et al. 2021). Once considered direct pipelines to the sea, rivers are dynamic drivers of plastic waste retention, burial, resuspension, and degradation as debris is transported downstream (Barrows et al. 2018, Hurley, Woodward, and Rothwell 2018, Nizzetto et al. 2016). Rivers, tributaries, and their floodplains are often “hotspots” of plastic accumulation (areas with the most
marked and dramatic accumulation), with river and stream outlets also creating local hotspots in coastal marine areas (Windsor et al. 2019).
Plastic transport depends on the size, shape, and buoyancy of plastic items or particles, as well as river characteristics such as flow rate, velocity, and shoreline and waterway morphology (e.g., vegetation, rocks), which affect the time dependence of transport, including debris stranding and erosion (Balas et al. 2001, Hoellein and Rochman 2021). Variations in river discharge of plastics occur on a variety of time scales (Watkins et al. 2019), including those related to weather or climate variations (e.g., storm events, precipitation patterns) and source input (e.g., wastewater outflows or seasonal littering variability). For example, studies in the Los Angeles River (Moore, Lattin, and Zellers 2011) and the Chesapeake Bay (Yonkos et al. 2014) found debris concentrations increased sharply after major rainstorms. In Delaware Bay, local concentrations of floating plastics were driven by ocean tides and winds (Cohen et al. 2019), and in the River Seine (France), the mass of floating plastics increased with river flow (Gasperi et al. 2014, Tramoy et al. 2019).
Robust estimation of spatially and temporally variable transport (or flux) of plastic debris is rare. Across the globe, including in locations across the United States, the abundance of large plastic and microplastic debris in river water and sediments has been measured using a variety of methods (e.g., Adomat and Grischek 2021, Campanale et al. 2020, González-Fernández and Hanke 2017, González-Fernández et al. 2021). However, most studies report abundance at discrete sampling stations in one-time or short-term studies, potentially underestimating variability in time. For example, McCormick et al. (2016) measured the accumulation and export of anthropogenic litter from the riparian zone (up to 10 m from the water’s edge) of rivers near Chicago, Illinois at biweekly and seasonal scales (McCormick et al. 2016). This riparian litter was highly mobile, a factor not captured in one-time “snapshot” sampling. Net accumulation rates depended on sampling frequency, where more frequent sampling gave higher accumulation rates. Also, they found that mobility varies with different debris characteristics. For example, because of their pliability, lightweight plastic films (wrappers and bags) were more likely to be retained on natural debris or vegetation than heavier, but more rigid, metal cans and glass bottles, which were transported farther. In some studies, microplastic loads increased after storm events (Yonkos et al. 2014) or periods of increased river discharge, and in one case the increase was attributed to combined sewer overflows (Wagner et al. 2019).
Quantitative global estimates of transport of plastic debris by rivers to the ocean come from modeling studies that use proxies including population density and mismanaged plastic waste generation rates to predict debris fluxes, which were then evaluated against available published data from a small number of individual rivers (Lebreton et al. 2017,
Schmidt, Krauth, and Wagner 2017). At least one field study found poor agreement between estimates based on field measurements and the previously modeled predicted outflow of plastics, in this case in six Chinese rivers (Mai et al. 2020). Meijer et al. (2021) added probabilistic modeling to account for the likelihood of land debris to enter a waterway as a function of distance from the shoreline, land use, wind, and precipitation. This study estimated that 0.8–2.7 million metric tons (MMT) of plastic waste enter the ocean globally per year from riverine sources, with 80% entering from more than 1,000 rivers. However, another study taking a similar modeling approach, but with slightly different model construction and calibration methods, estimated much smaller global plastic outflows from rivers (0.057–0.265 MMT [Mai et al. 2020]). There continue to be large uncertainties in the global estimation of riverine transport of plastic waste to the ocean, highlighting the importance of local field studies to more directly measure these fluxes and their variability. Such information will be valuable not only to better understand local sources and transport dynamics but also to build and validate models used for process studies and for regional or global budgeting studies.
Stormwater Runoff
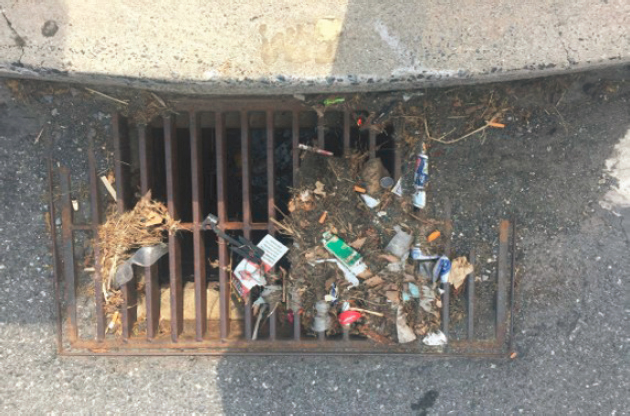
Urban and suburban stormwater can be substantial and important contributors of plastic waste, especially microplastics from land to rivers and nearshore areas (Sutton et al. 2019). Stormwater runoff occurs when precipitation (e.g., rain and snowmelt) “flows over land or impervious surfaces, such as paved streets, parking lots, and building rooftops, and is not absorbed into the ground”(U.S. EPA 2021h). This runoff gathers debris and chemical pollutants, including plastic waste, from the land and streambanks (see Figure 4.3) and propels them to rivers, streams, lakes, and coastal waters, where they can harm humans and ecosystems (U.S. EPA 2020b).
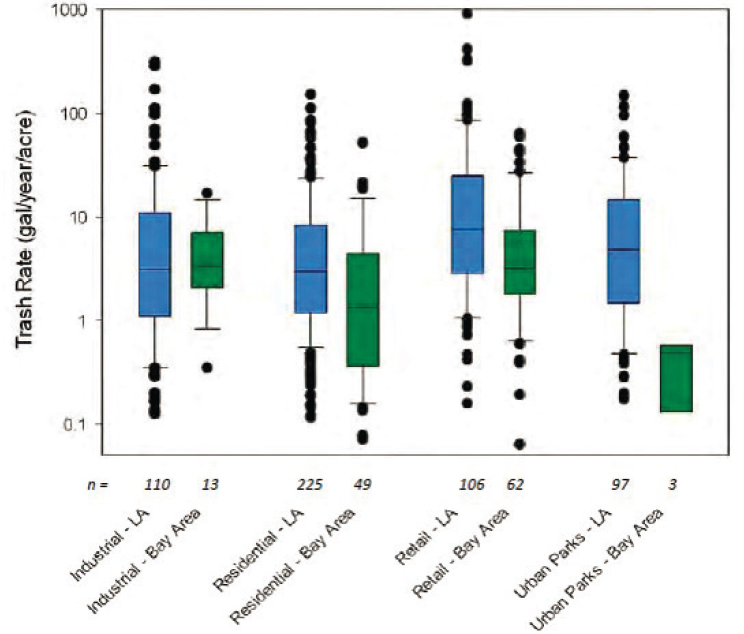
Recent regulations on the amount of trash allowed in receiving water bodies in California have resulted in initial studies that estimate the total amount of trash, including plastic waste, generated and loaded in California’s San Francisco Bay Area stormwater system (Werbowski et al. 2021). This study (discussed in greater detail later in the chapter) confirmed the findings of an earlier study in Los Angeles County, California, showing that trash loads could be roughly estimated by land use in the drainage area (EOA 2014). Researchers typically use land use as a proxy for stormwater trash loading in urban areas (Marais, Armitage, and Wise 2004).
The highest rates of plastic waste generation and loading found in California were from industrial, retail, and residential areas, as well as highways and expressways (EOA 2014). Other factors associated with higher plastic loading from urban areas include combinations of lower
income, higher population density, and other demographic factors. However, significant correlations were not observed between generation rates and any individual factor. These results are similar to those for a study completed near Leipzig, Germany (Wagner et al. 2019).
Wastewater Discharges
Wastewater entering treatment plants can be highly contaminated with quantities of mostly fine microplastics, particularly fibers shed from clothing and other textiles (Carr, Liu, and Tesoro 2016). In wastewater treatment plants, most microplastics are removed and concentrated in wastewater sludges (Carr, Liu, and Tesoro 2016, Werbowski et al. 2021). These wastewater sludges are usually landfilled (buried), but some are applied to forest or agricultural land or are incinerated. Primary, secondary, and tertiary wastewater treatment removes cumulatively higher proportions and smaller sizes of plastic particles, with the remaining plastics discharged in liquid effluent, which may enter estuaries or the ocean directly, or rivers and streams leading to the ocean. Most microplastic removal occurs in primary treatment by surface skimming and sludge settling (Carr, Liu, and Tesoro 2016). Plastics in treated wastewater effluent tend to be much smaller in size and density and tend to be textile fibers or fiber fragments (Carr, Liu, and Tesoro 2016, Werbowski et al. 2021). Small amounts of these plastics can escape the wastewater collection system before they can arrive at wastewater treatment plants (e.g., during big storms which cause sewer overflows).
The role of onsite sewage disposal systems (e.g., septic tanks and cesspools) in the transport of microplastics to groundwater, and possibly to the ocean via groundwater discharge, is little studied. There is some preliminary evidence of the presence of microplastics in groundwater (Panno et al. 2019). Waterborne pollution delivery via submarine groundwater discharge to the ocean from onsite sewage disposal systems is known for other pollutants (e.g., Amato et al. 2020, and see Mezzacapo et al. 2021 for a state of Hawaii review). Coastal inundation events from storms, tides, or related to climate-induced sea level rise are expected to increase with attendant vulnerabilities to coastal- or waterway-adjacent onsite sewage disposal systems (Habel et al. 2017), potentially increasing the frequency of this type of microplastic transport. The importance of onsite sewage disposal systems as microplastic sources, and associated groundwater discharge of microplastics to waterways and the ocean, is presently uncertain.
Beach and Shoreline Waste
Beach and shoreline waste may be deposited as locally generated litter (accidental or intentional), or may be waste that was generated elsewhere and washed ashore (i.e., “beached”). The hydrodynamic processes that transport shoreline debris and determine its residence time before entering or returning to the ocean are complex. These processes are largely determined by local winds, waves, and tides, which are influenced by the shape of the coastline and seafloor bathymetry (van Sebille et al. 2015). The turbulence generated by wave breaking, especially in shallow areas such as the surf zone, can cause particles on the seabed or in sediments to be resuspended, and interaction of plastic waste with beach or seafloor sediments creates stresses that may enhance their fragmentation into smaller particles (Chubarenko et al. 2020, Efimova et al. 2018).
Delays and Barriers on the Way to the Ocean
Whether plastic waste entering inland streams is likely to arrive at the ocean depends on interceptions or transformations that occur along the way. This section examines processes that filter, sort, and delay plastics on the way to the ocean. Chapter 5 expands the discussion of chemical, physical, and biological transformations to plastic particles.
Sortings
Plastic particles transported by waterborne pathways often become sorted by density and size, much like natural sediments (Lenaker et al. 2019). Denser waterborne plastics tend to settle to the bottom, where they
are transported as bedload sediment by river, storm, and tidal currents, and tend to deposit in bays, canyons, and nearshore areas (Barnes et al. 2009, Galgani, Souplet, and Cadiou 1996, Schwarz et al. 2019). Larger, denser particles tend to accumulate locally near river and stormwater outfalls, because stream velocities diminish in open water. However, very tiny (micron-sized) and more fibrous plastics tend to remain in suspension by fluid turbulence (Carr, Liu, and Tesoro 2016), causing them to move more readily in water flows (Liro et al. 2020, van Emmerik et al. 2018). For an individual plastic item or particle, this might lead to a cycle of transport, settling, and flood remobilization that prolongs its path to the sea for years (Liro et al. 2020).
In the nearshore region, highly periodic tidal currents are important in moving and sorting plastic particles. Plastic particles denser than seawater, such as tire particles, tend to settle but may continue to move under the influence of tidal and flood currents and may become resuspended by waves in shallower water (Chubarenko and Stepanova 2017, Sutton et al. 2019). Floating plastic particles, which are less dense than seawater, will tend to accumulate near the water surface and be moved by tidal and wind-driven currents. Particles near the density of seawater are expected to be suspended more evenly throughout the water column and be carried by ambient three-dimensional currents. The processes that affect the sorting, transport, and retention of plastic particles in coastal areas are complex and, thus far, little-studied (Sutton et al. 2019, van Sebille et al. 2015).
Filtration and Adsorption
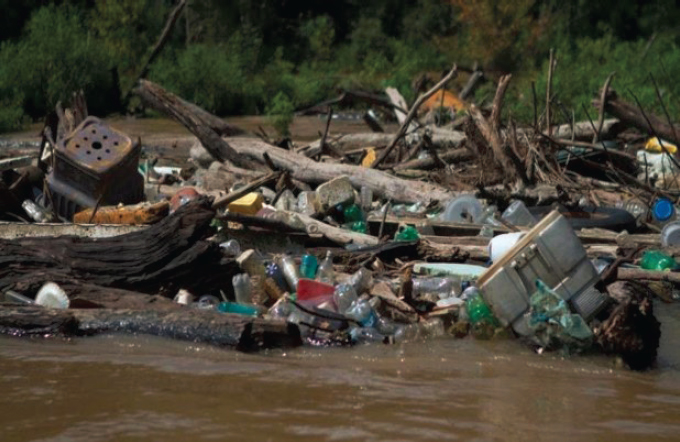
Plastics can become stuck or filtered in ways that detain or retain them before reaching the ocean (see Figure 4.4). In particular, plastics are subject to contact with stream and river banks or floodplains, including vegetation, where they can become attached or deposited for a time or quasi-permanently (Ivar do Sul et al. 2014).
Biological Transport
Biological transport of inland plastic waste to the ocean or lakes, and vice versa, occurs via birds, fish, and other animals. Although the amount of transport by these means is likely small relative to the overall transport of ocean plastic waste, it can be meaningful from an ecological, community, or individual organism’s perspective. The interaction of plastic waste and living organisms can result in negative impacts on organisms or ecosystems (Bucci, Tulio, and Rochman 2020). The nexus between biological transport of plastic waste and its distribution and fate is addressed in Chapter 5.
Microbial and other colonization of plastic waste in aquatic environments, also known as biofouling, can lead to the vertical transport of plastic waste in the water column (Tibbetts et al. 2018). Biofouling may alter the bulk density of plastic items, causing them to sink and affecting their settling.
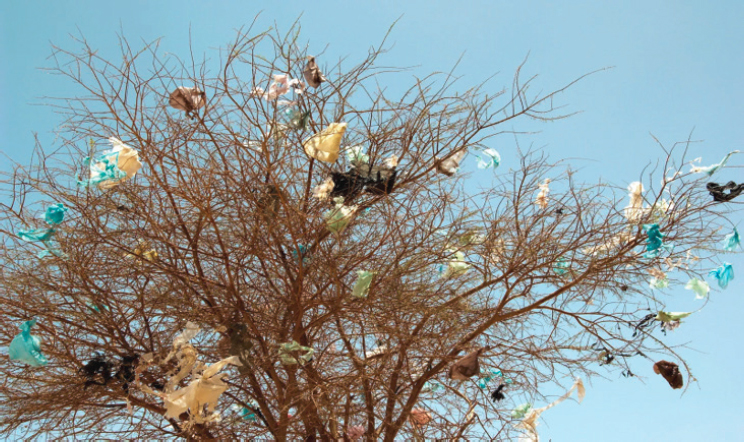
AIRBORNE PATHWAYS: WIND
As with waterways, the atmosphere is both a transport mechanism and a reservoir for environmental plastics. Plastic waste from shed microplastics, to everyday litter (e.g., bags and wrappers), to large debris mobilized in severe windstorms can be suspended in the atmosphere and transported as a function of item size, density, and aerodynamic shape, as well as wind strength, turbulence, wind duration, and pathway obstructions. Figure 4.5 illustrates the familiar “Christmas tree effect” resulting from the snagging of plastic bags borne by wind in tree branches. Microplastics in soil, on roads, and at the ocean surface that are large enough to be entrained into the atmosphere and small enough to be elevated into the atmospheric planetary boundary layer can be subject to long-range transport and may have residence times up to 1 week (Brahney et al. 2021). Cycles of suspension, deposition, and resuspension (or emission and
re-emission) of microplastics result in sizable reservoirs of atmospheric plastics. For example, the estimated average atmospheric load of microplastics (4–250 µm in size) over the land regions of the western United States is 0.001 MMT (Brahney et al. 2021). In analyses of particle pathways, research has demonstrated that microplastic transport can occur on regional scales (>100 km; see Allen et al. 2019) or can be dominated by large-scale (1,000 km) atmospheric patterns, resulting in deposition far from the emissions source (Brahney et al. 2021). Airborne pathways also carry a small proportion of microplastics resuspended from the ocean by sea spray for deposition on land (Allen et al. 2020, Brahney et al. 2021).
DIRECT INPUT
Plastic waste is also disposed of, either intentionally or unintentionally, directly into the ocean. These discharges include losses of fishing and aquaculture gear, recreational gear (e.g., during boating or scuba diving), over-board litter or intentional dumping, and cargo lost from ships and barges. Additionally, major storm events such as floods, hurricanes, and tsunamis can deposit massive amounts of debris of all types from land into the ocean in a relatively short time period. For example, the 2011 Tohoku earthquake and tsunami in Japan deposited an estimated 5 MMT of debris into the ocean (Murray, Maximenko, and Lippiatt 2018).
Finally, plastic particles that are shed during normal product use can directly enter the ocean. Examples include marine paints, coatings, and anti-fouling systems (International Maritime Organization 2019); shedding of textile fibers from synthetic clothing worn at sea; and shedding of particles from fishing gear (e.g., lines, nets).
CASE STUDY ON SAN FRANCISCO BAY AREA
San Francisco Bay is one of the most well-studied environments in the United States in regards to the transport and loading of plastic waste. Work discussed earlier on microplastic transport in the San Francisco Bay area provides some insight into quantification of flows into the ocean, in this case, from stormwater runoff and wastewater outflows (Sutton et al. 2019). The San Francisco Bay region also has a lengthy history of collecting trash data from beaches and inland shorelines during volunteer beach cleanups. An overview of the takeaways from these studies is provided below.
Despite being well investigated relative to other areas of the United States, the San Francisco Bay has important gaps in understanding of plastic waste transport and loading. Specifically, atmospheric deposition of microplastics has not been well studied.
Trash (All Types) Loading
A study focusing on the San Francisco Bay Area and Los Angeles examined debris that is captured in stormwater systems. The vast majority of collected debris was composed of organic material (e.g., vegetation), sand, and sediment. Trash (the debris composed of human-made materials) was 17% by volume and 4% by weight of all debris collected. Of the trash, plastics were roughly 70% by volume and 50% by weight (EOA 2014).
This study examined annual trash generation (all materials, not just plastics) and how loading to stormwater systems varies with land use, population density, and income (Figure 4.6; EOA 2014). As illustrated in Figure 4.6, trash loading rates vary up to three orders of magnitude between land-use classes, indicating that other factors must also be considered (EOA 2014). The reported units (gallons/year/acre) also illustrate the difficulty of standardizing units for reporting and analysis in this field.
The San Francisco Bay Region study was prompted by efforts to regulate trash in stormwater systems in California. These efforts are now being promulgated across the state due to recent amendments to statewide stormwater permits that require municipalities and other entities to achieve zero discharge of trash into receiving water bodies. Recognizing
that achieving this goal will require effective monitoring methods by which to measure progress, the California State Water Resources Control Board and San Francisco Estuary Institute recently published the California Trash Monitoring Playbook in an attempt to help standardize data collection (S. Moore et al. 2021).
Microplastic Loading
Stormwater runoff of microplastics and microfibers is also an important contributor of plastic waste to coastal and near-coastal environments (Werbowski et al. 2021). While the volume or mass input may not be large due to the inherently small nature of the particles, the number of particles
entering the marine ecosystem each year is extremely high. According to a recent study conducted by the San Francisco Estuary Institute and 5 Gyres, more than 7 trillion plastic microparticles and fibers enter the San Francisco Bay each year via stormwater runoff, which was approximately 300 times greater than the number of particles discharged by wastewater treatment facilities around San Francisco Bay (Sutton et al. 2019). Tire and road wear particles are a substantial component of synthetic microparticles to San Francisco Bay. This work can be used as a guide for interventions that target these sources.
Shoreline Debris from Community Science
In addition to the studies discussed above, the San Francisco Bay region has a decades-long record of community science efforts to capture data on beach and inland shoreline debris through volunteer beach cleanup efforts. Although the volunteer cleanups do not identify the ultimate paths of individual trash items, they indicate the types of items most frequently found in the environment, especially given the long-term data consistency. During the most recent year in which cleanups were held (e.g., not disrupted by COVID-19), 8 of the top 10 items found during cleanup activities were identified as plastics, comprising 67.3% of the total amount of debris collected (International Coastal Cleanup 2019). These beach cleanups identify common litter items (plastic and non-plastic) and can be used to inform litter prevention or mitigation efforts.
THE CHALLENGE OF ESTIMATING FLOWS OF PLASTICS ENTERING THE OCEAN
Although there is some understanding of the major mechanisms that transport plastic waste to the ocean, it is difficult to make quantitative estimates. Plastic waste inflows from each transport mechanism are very difficult to measure in the field. Inflows involve many large and small pathways and transport a very wide range of particle sizes, shapes, and densities, the smallest of which are often difficult to distinguish from natural fibers and materials. Furthermore, the fluxes vary over orders of magnitude with seasons, weather conditions, and location.
Another important challenge in assessing major paths and quantitative transport of plastic waste to the ocean is the lack of standard methods and data reporting within the scientific community. Each research team must decide what size debris to measure (micro–macro), the number of samples to collect and sampling area, the number of replicate samples to collect, and the time span between repeated sampling campaigns (if any) at the same site. In addition, studies report findings in variable units
including mass (kilograms), particle counts (number of particles), and volume (gallons). For analysis of microplastics, specifically, one must select an extraction protocol to remove particles from tissues, organic matter, or sediment, as well as a method for chemical identification of some or all suspected plastic particles (Hidalgo-Ruz et al. 2012). Ideally, researchers make these decisions to best address their research objective, but cost, available resources, and other practical considerations are important. Researchers routinely call for standardization or harmonization of methods to ensure high-quality data and reproducibility between studies, and for reporting standards to allow robust comparability across local, regional, and global scales (Cowger et al. 2020, Rochman, Regan, and Thompson 2017). This is a priority for hypothesis-driven research and also for assessment and monitoring objectives. This lack of standardization in plastic waste studies has hindered the effective synthesis of current knowledge and is also discussed in Chapter 6 on Tracking and Monitoring.
KNOWLEDGE GAPS
A comprehensive understanding of the contribution of various transport pathways to plastic waste in the ocean is hindered by the complexity of the transport processes and thus the data needed to measure and model variability in fluxes over space and time. Improved understanding of the absolute and relative contributions of each pathway to plastic waste in the ocean could inform and prioritize actions to reduce the transport of plastics to the ocean. The committee identified the following research gaps needed to better understand transport of plastic waste to the ocean:
- A lack of standardized or harmonized methods for measuring plastic and microplastic concentrations and fluxes hinders comparisons between data sets that are needed to make robust estimates at regional or global scales.
- Without systematic field, laboratory, and modeling studies on processes influencing plastic and microplastic transport in water, in air, and on shorelines, flux estimates are necessarily crude, based upon limited field data that cannot fully capture variability associated with these complex processes. Such flux estimates are critical to both designing and implementing measures to reduce these fluxes, and to understanding the impacts of these fluxes. For example, identifying large mass inputs of plastic waste is important to inform the design of interventions to prevent transport into the ocean, whereas quantifying the abundance and potential toxicity of different microplastics transported to the ocean is critical to understanding the risk to marine organisms.
FINDINGS AND CONCLUSION
Finding 8: Although the transport of plastic waste to the ocean in the United States cannot be comprehensively estimated from available data, individual studies show a sizeable transport of microplastics and macroplastic wastes along a variety of waterborne and airborne paths as well as direct inputs from shorelines and maritime activities.
Finding 9: Plastic waste discharge to the ocean varies greatly with location and over time, reflecting variability in plastic waste generation by source, effectiveness of waste collection, and variability in transport processes such as river and stream flows; ocean waves, currents, and tides; and winds.
Conclusion 6: Regular, standardized, and systematic data collection is critical to understanding the extent and patterns of plastic waste inputs to the environment, including the ocean, and how they change over time.
This page intentionally left blank.


