
6
Age Discrimination, One Source of Inequality
INTRODUCTION
Ageism contributes to disparities for older workers. This chapter describes the measurement and impact of ageist treatment in the workplace and the labor market. It moves from the micro (interpersonal-level) view to the macro (society-level) view, beginning with face-to-face workplace issues. It then examines aggregated experiences within the workplace. Finally, it looks at the labor market.
Interpersonal or face-to-face workplace issues are those in which societal images and expectations about older workers (both explicit and implicit assumptions about their performance or behavior) are reflected in what these workers report regarding their experiences of workplace discrimination. These experiences of discrimination are associated with their mental and physical well-being. Universally beneficial remedies to such discrimination—the type of remedies most likely to be widely acceptable—aim to develop inclusive workplace climates, adopt realistic assessments of workers’ cognitive capacity, and focus on measuring their actual job performance. Although age-based analyses find no consistent performance differences across workers, older workers consistently report experiencing discrimination. However, beyond well-documented ageism in hiring processes, proof of discrimination within workplace settings is elusive. Even less is known about how these age-related work experiences and their personal correlates vary as age intersects with other marginalized categories, such as those based on gender or race-ethnicity.
When individuals are aggregated at the workplace level, analyses of plant and office age-related productivity also find no clear performance differences, suggesting that assumptions about age-related performance differences are not supported by evidence. Finally, anticipating the next chapter, the current chapter also examines the labor market—older workers’ aggregate productivity and employers’ aggregate age discrimination. Analyses of direct and indirect evidence, and especially audit studies of job applications, show that stereotypes about older workers affect labor-market demand for their work, constraining their work opportunities as they age. This discussion paves the way to the next chapter, which examines age-related labor market supply and demand.
All three levels of analysis—interpersonal, workplace, and labor market—reveal sources of inequality based on age.
DISTINCT FEATURES OF AGEISM
Most workforce variables apply in some form to all workers. For example, individuals’ career paths always depend on their training, on having other breadwinners or caregivers in the household, on organizational climate,
and on job characteristics and the labor market. As the prior chapters show, personal (individual and household) factors, as well as organizational (workplace and job) characteristics, shape the pathways of older workers as well.
In addition, older workers, as a group, have the distinct potential to experience age discrimination, which overlaps somewhat but also differs from other forms of discrimination (see Fiske and Taylor, 2021). For example, the old-age category is permeable, and people generally hope to join it someday (but just not yet, as the boundary always recedes). Compared with other characteristics, age more often appears as a continuous variable, sometimes categorized into life stages (“old”), relative standing (“older than me”), cut-offs (“eligible for discount”), or changing roles (“grandparent”).
Another distinctive feature of age as an identity group membership is that, as with gender, people have older and younger people within their own families, something that is less often true for some other categories (e.g., race, religion). This means that older and younger people are often interdependent in the home. Nevertheless, families can treat older members (interpersonally; North and Fiske, 2012) based on age-related preferences, expectations, and constraints. Older individuals can internalize ageism; they may prefer, expect, and constrain themselves to act stereotypically (intra-personally; Levy, 2009). Ageism and age discrimination demonstrably operate at these intrapersonal, interpersonal, and structural levels (Chang et al., 2020); the workforce review here emphasizes the latter two levels, moving from workplace encounters to aggregated workplace profiles to labor-market outcomes.
Each of these distinctive features of age—a continuous variable often treated categorically, with permeable and moving boundaries; self-relevant; involving family relations—altogether complicates measurement. The meaning of “older” age depends on perspective, context, and purpose: who is asking about it, where, and why. As Chapter 5 noted, even within a single organization, a person’s chronological age is associated with other factors that are related to their treatment, such as birth generation, employee tenure, and work experience, each of which may have different effects. Where possible, this review aims to be clear about what a given study means by “older.”
FACE-TO-FACE AGEISM: HOW PEOPLE VIEW OLDER WORKERS
Ageism theoretically has a variety of plausible origins, each of which implies a different workplace intervention (though this is not our focus here; see Box 6-1). In describing the work-related manifestations of ageism, this chapter relies on some theories already introduced, including rational choice and human capital, but also introduces new ones: implicit bias, stereotype content, and prescriptive ageism (see Table 6-1).
The evidence presented throughout this chapter shows that, as with race and gender, people treat older workers as a category. Responses range from explicit and overt bias (regular, reportable attitudes) to implicit, latent bias (subtle, modern, covert incivilities; Cortina, 2008). Social psychology distinguishes among key indicators of both explicit and implicit bias: simple evaluative attitudes (preferences), cognitive stereotypes (beliefs, expectations), emotional prejudices (specific affect, such as pity or resentment), and discriminatory behavior (constraining action) (Fiske, 1998). The evidence for ageism, reviewed here, includes perceivers’ explicit and implicit attitudes, cognitive beliefs and stereotypes, and emotional prejudices about older workers, as well as older workers’ own reports of behavioral discrimination. Hence, the review begins with the individual perceiver’s explicit attitudes and then moves to define and discuss implicit ones.
Explicit Attitudes and Preferences
Simple evaluative-preference judgments stigmatize older adults more than they stigmatize some societal groups and less than others. The Project Implicit website collects data from visitors who take implicit and explicit attitude measures on a variety of demographic targets (https://implicit.Harvard.edu). After nearly 15 years of data collection, the results show that Americans who volunteered their explicit attitudes toward older people (online respondents, N = 588,230) display moderate negativity (Figure 6-1; Charlesworth and Banaji, 2019). But this masks a gradual change in attitudes over time. Overall, 4.4 million online volunteers expressed their explicit attitudes toward at least some of six social groups: age, race, sexuality, disability, skin tone, and body weight (Charlesworth and Banaji, 2019). In just over a decade, all these self-reported attitudes moved toward neutral on seven-point scales, away from expressing preferences for or against specific groups (e.g., young over old versus old over young). Anti-old, pro-young bias changed less than did sexuality and racial biases, but more than disability, skin-tone, and weight biases (see bottom
TABLE 6-1 Theories Applied to Ageism in the Workforce*
| Ageist Preferences, Evaluations, Attitudes | |
| Explicit bias | Not a theory, but a measurement method assuming the veracity of self-reported answers to attitude questions. |
| Implicit bias | Immediate associations favoring ingroups and devaluing outgroups. |
| Ageist Expectations, Beliefs, Stereotypes and Emotional Prejudices | |
| Stereotype Content Model | Stereotypes focus on warmth (trustworthy, friendly) and competence (capability, confidence). Warmth x competence interaction predicts distinct prejudices (contempt, envy, pity, pride). |
| Ageism as a Prescriptive Constraint | |
| Succession, Consumption, Identity | Elders should cede power, forfeit resources, defer. |
| Perceived Age Discrimination | |
| Selective Incivility | People perceive unusual, ambiguous, exclusionary behavior as potential discrimination. |
| Links to Well-Being and Exit Decisions | |
| Stereotype Embodiment | Targets internalize others’ stereotypes, tending to confirm. |
| Intersectionality | |
| Double Jeopardy | Two marginalized identities multiply the risks of each. |
| Invisibility | Two marginalized identities exclude the target from both. |
* See text for references.
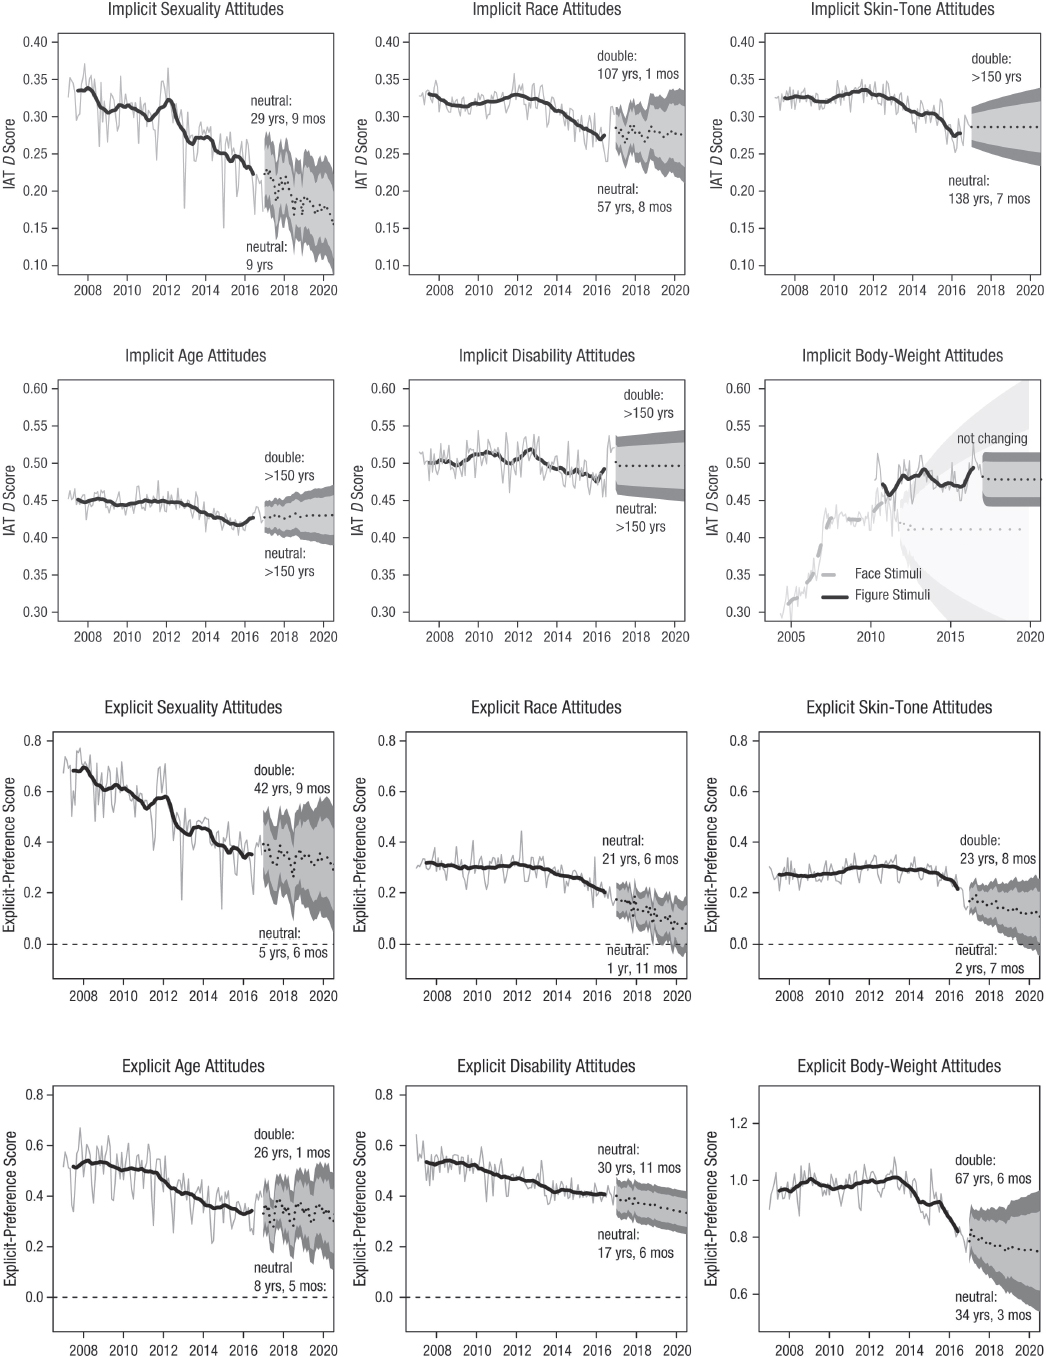
half of Figure 6-1). Overt ageism, like all self-reported intergroup prejudices, is becoming less acceptable, at least in some public arenas.
A note of caution, because this online sample of respondents is not representative but tilts younger, female, liberal, and educated, compared to the general population, the responders might have adjusted their responses to reflect civility norms, downplaying their own biases. Their socially desirable responses promote equity but also create challenges for accurate measurement. Among researchers, debates center on defining the “true” attitude, as previous biases may co-exist with reconsidered updates (Wilson et al., 2000); if this is true, then rejected attitude habits can leak out in unguarded moments.
One conclusion for research follows: Whether and when the original, unfiltered attitude or the newer, socially desirable, revised attitude guides age-related workplace behavior, including discrimination, remains an empirical question. But measurement is not straightforward and requires development.
Furthermore, contrary to popular intuition, reported ageism is worse in modern East Asia than in the West (across 23 countries, N = 21,090; North and Fiske [2015b] meta-analysis).1 Ageism appears to be a function of intergenerational resource tensions. That is, when younger people are expected to provide greater support for their elders, they are more biased against them. These cross-cultural findings merit greater elaboration in workplace data.
Implicit Attitudes and Preferences
Less direct measures focus on people’s implicit evaluative associations (latent preferences) about societal groups. Implicit biases are unconscious attitudes and associations that individuals hold about specific groups. Indirect measures of these attitudes about older adults assess the degree to which when the concept of older person comes to mind, negative associations also come to mind. The most common measure assesses speed of pairing in-group or outgroup (e.g., young, old) with other positive or negative concepts (e.g., good or bad; sunny or cloudy). On some trials, participants sort words or images of old people on the same side of the screen as negative concepts not relevant to age; simultaneously, they sort young people and positive concepts together. Then, on other trials, by instruction, they sort together old and good, young and bad. The logic is that if negative associations have faster response times (old and bad go together) than do positive associations, this reflects some evaluative tendency stored in the mind. Implicit associations are detectable, but relatively automatic and unexamined, in this view. (For examples, see the Project Implicit website, below; for theory, see Greenwald and Lai, 2020.) The Implicit Association Test (IAT) has its critics (e.g., Fiedler et al., 2006), but recent comprehensive meta-analyses provide convincing evidence of its validity, as follows.
Compared with explicit reports of in-group favoritism and out-group derogation, implicit preferences reduce the biases in measurement that stem from social desirability, that is, from people protecting their reputation when surveyed. For controversial attitudes such as prejudice, implicit and explicit evaluations may not correlate because people report no bias but show faster negative associations with outgroups than ingroups. The correlation of the IAT with explicit self-reports was .24 in one meta-analysis of 126 studies (Hofmann et al., 2005), .36 in another (57 object pairs; Nosek, 2005), and .36 in another (184 samples; Greenwald et al., 2009). A meta-analysis of the IAT with behavior (217 research reports) found that the correlations vary depending on study focus, methods, and attitude polarity; higher-quality studies report bigger effects, but most studies are statistically underpowered (Kurdi et al., 2019; see also Greenwald et al., 2009).
The widespread use of these measures attests to their intuitive appeal. The theory holds that most people have positive associations concerning themselves and associate themselves with certain in-groups (e.g., their age cohort), so they also have positive associations attached to their in-groups—and less positive associations with out-groups (Greenwald and Lai, 2020). Overall, implicit in-group positivity (and relative outgroup negativity) predicts a range of behavior toward a range of out-groups. Applying these measures to ageism therefore seems useful.
Implicit associations with the concept “old” are, along with obesity and disability, the most negative associations among six out-groups (Figure 6-1). These negative age implicit-association results were also stable over the preceding 15 years, even as other implicit attitudes were becoming more neutral (see top half of Figure 6-1;
___________________
1 In the United States, the exceptions—samples where young people do reportedly admire their elders—include African Americans (Fiske et al., 2009) and Native Americans (Burkley et al., 2017).
Charlesworth and Banaji, 2019). The correlation between implicit and explicit ageism is only r = 0.12, meaning the two forms of ageism are effectively independent. To the extent respondents might want to conceal their ageist bias—an understudied assumption—measuring both implicit and explicit responses would be useful.
In conclusion: to supplement existing research on explicit attitudes, the impact of implicit ageism on workplace behavior specifically could use rigorous, high-powered investigation. From a practical perspective, if the attitudes are implicit, people cannot individually track their effects on, for example, their own hiring or promotion decisions. Workplace research should therefore monitor patterns that might show unexamined bias.
Stereotypes: Mixed Expectations
Stereotypes, which are generalized beliefs based on group membership, underlie evaluative attitudes. Some stereotypes describe default expectations of a group and are openly reportable cognitions; these are explicit, descriptive stereotypes. As organizational psychology shows, stereotypes about older workers are mostly negative (Ng and Feldman, 2012), though not entirely; they are often ambivalent or mixed (Burn et al., 2020; North and Fiske, 2015b). Starting with the general content of older-adult stereotypes provides context to the older-worker stereotypes.
Historically, stereotypes of elders were probably more positive, according to a text analysis of five million books published between 1880 and 2020 (Mason et al., 2015). However, these older stereotypes were based predominantly on those for men, because younger and older women appeared less frequently in the database of texts. This is consistent with other research that finds that male members of a category often serve as the default (e.g., that a generic “American” refers to a male citizen; Eagly and Kite, 1987). Adjectives associated with (male) older people began to shift in the early 1900s, a change that researchers have speculated was due to society devaluing older people as their roles changed: (1) widespread literacy and mass media replaced a reliance on elders’ wisdom; (2) industrialization required nimble adaptation to changeable modern skill sets, rather than traditional practices; (3) families became more nuclear and had less need for multigenerational contributions (Butler, 2009; Nelson, 2005).
Currently, ambivalence toward older people is the most common stereotype, not just within the United States, but globally (Table 6-2). Across a variety of countries, older people are universally viewed as well-intentioned
TABLE 6-2 Mixed Stereotypes about Older Adults and Older Workers
| Source | (Not) Competent | Warm-Trustworthy | Other |
|---|---|---|---|
| Fiske et al., 2002 | |||
| less competent | warm | ||
| less skilled | friendly | ||
| less intelligent | trustworthy | ||
| less confident | sincere | ||
| Ng and Feldman, 2012 | |||
| less motivated | less trusting | less healthy | |
| less willing to train and develop | |||
| more resistant and less willing to change | |||
| more vulnerable to work-family imbalance | |||
| Marcus et al., 2016 | |||
| incompetent | warm | not adaptable | |
| Burn et al., 2020 | |||
| lower ability to learn | dependable | less attractive | |
| less adaptable | careful | hard of hearing | |
| worse communication skills | better communication skills | less physically able | |
| less (more) productive | warm personality | ||
| worse with technology | negative personality | ||
| less creative | |||
| worse memory | |||
| more experienced | |||
but incompetent, “doddering but dear.”2 Older people are supposedly warm and friendly, but less ambitious, less responsible, and less intelligent (Andreoletti et al., 2001; Rubin and Brown, 1975). Ambivalent stereotypes are often unexamined and harder to detect, because they mix both positive and negative attributes (Fiske et al., 2002), but a reliable and valid scale has proven able to establish ambivalent ageism (Fiske and North, 2014). This ambivalence is reflected in mixed behavior. For example, during the COVID-19 pandemic, because elders are especially vulnerable to severe infections, protective measures such as senior shopping hours and early vaccine access were provided to offer support to this population; however, at the same time, public discourse reflected a resentment of older people’s priority for health care (Monahan et al., 2020).
The Work-related Age-based Stereotypes Scale (WAS; Marcus et al., 2016) builds on these concepts to show that stereotypes of older workers are multidimensional, incorporating both negative (incompetent, not adaptable) and positive (warm) aspects. WAS has demonstrated validity in measuring stereotypes about older workers across lab and field settings (N = 1,245; see Table 6-2). The older-worker stereotypes considered suggest similar ambivalence: incompetent but trustworthy, if also unhealthy.
A meta-analysis (Ng and Feldman, 2012) of 418 nonlaboratory empirical studies (representing a total sample size of 208,204 participants) examined whether empirical evidence supports six common stereotypes of older workers, namely, that they are less motivated, less willing to participate in training and career development, more resistant and less willing to change, less trusting, less healthy, and more vulnerable to work-family imbalance. All these alleged attributes relate to workplace competence, except perhaps being less trusting, which reflects the interpersonal dimension of warmth and communion, though it is not equivalent to one’s own trustworthiness. The meta-analysis finds support for the incompetence stereotype, but only for the belief that older workers are less willing to participate in training or development (see Table 6-2); it is uninformative about the warmth dimension.
In a more recent study that used language processing techniques to examine the use of age-related stereotypes in job applications, Burn and colleagues (2020) reviewed literature in industrial psychology and related disciplines to identify 17 stereotypes related to health, personality, and skills that are commonly associated with workers in their 50s and 60s. Although more of these stereotypes were negative than positive,3 when they are sorted according to their relationship to the two validated dimensions of age stereotypes discussed above (warmth and competence), they yield a more coherent picture that is consistent with previous findings across countries: one of ambivalence.
It is notable that these 17 stereotypes include several contradictory pairs (both worse and better communication skills, both less and more productive, and both negative and warm personality) and “less attractive” (as low warmth), which may reflect individual heterogeneity of beliefs, with different individuals subscribing to each. Alternatively, the contradictions may reflect construal by subtypes of older targets, as occurs in subtypes for gender (Eckes, 2002), race (Fiske et al., 2009), and sexuality (Clausell and Fiske, 2005). For example, subtypes of older people have included grandmother (all warmth), elder statesman (all competence), and senior citizen (neither warm nor competent; Brewer, Dull, and Lui, 1981), though these are not exhaustive.
In addition, this most recent meta-analysis of older-worker stereotypes included the dimension of being unhealthy (see Table 6-3). The mixture of positive (warmth) and negative (incompetent, unhealthy) stereotype dimensions regarding the older worker—and older adults generally—has costs to both individuals and society, as later sections indicate.
Conclusion: The measurement of older-worker stereotypes could benefit from more systematic investigation of the warmth dimension (being trustworthy as well as friendly). Also, closer description of elder subtypes might increase the accuracy of predicting their effects.
Prescriptive Stereotypes: Beliefs as Constraints
In addition to descriptive stereotypes, which affect expectations about older workers’ characteristics (e.g., doddering, health issues), some stereotypes are prescriptive constraints, seeking to control older adults so they will “cooperate” (e.g., “be a dear”). People of different ages depend on each other’s resource allocations, whether
___________________
2 Based on data from six countries in Cuddy et al., (2005) and Fiske (2017); see also North and Fiske (2015b) for a meta-analysis of 23 countries.
3 11 are negative (lower ability to learn, less adaptable, less attractive, worse communication skills, less physically able, less productive, worse with technology, less creative, worse memory, hard of hearing, and negative personality), and six are positive (more productive, dependable, careful, more experienced, better communication skills, and warm personality).
TABLE 6-3 Stereotypes about Older Workers’ Health
| Aggregate Stereotype | Phrasing | Source |
|---|---|---|
| Less Attractive | “wrinkled,” “unattractive,” “not neat” | Kite et al. (1991) |
| “less attractive” | Levin (1988) | |
| “worse-looking when older” | Zepelin et al. (1987) | |
| Hard of Hearing | “hard of hearing” | Kite et al. (1991) |
| “worse hearing,” “think people speak too softly,” | Ryan et al. (1992) | |
| “frustrated when not hearing,” “think other people | ||
| speak too fast,” “often ask others to repeat” | ||
| “worse hearing” | Hummert et al. (1995) | |
| Worse Memory | “worse memory” | Hendrick et al. (1988) |
| “worse memory” | Ryan et al. (1992) | |
| “worse memory” | Ryan and See (1993) | |
| “worse memory” | Hummert et al. (1995) | |
| Less Physically Able | “lower physical capacity” | Kroon et al. (2016) (p. 16) |
| “[worse] physical capability and health” | van Dalen et al. (2009) (p. 21) | |
| “sedentary,” “physically handicapped,” “slow moving,” | Schmidt and Boland (1986) | |
| “sick,” “shaky hands,” “fragile,” “poor posture” | ||
| “less qualified for a physically demanding job” | Finkelstein et al. (1995) | |
| “tired,” “scared of becoming sick or incompetent” | Hummert et al. (1994) | |
| “[lower] activity,” “[less] energy,” “[worse] health,” | Levin (1988) (p. 142) | |
| “[less] speed” | ||
| “less physically active,” “unhealthy,” “moves slowly” | Kite et al. (1991) | |
| “worse psychomotor speed” | Hendrick et al. (1988) | |
this concerns sharing money, handling tasks, or sharing information or time. Ageism’s roots in intergenerational tensions lead younger and middle-aged people to endorse constraints for elders (North and Fiske, 2012, 2015a). These stereotypes highlight competition over (1) resources controlled by elders (e.g., orderly succession of power), (2) resources shared by everyone (e.g., unequal consumption of healthcare), and (3) resources identified with youth (e.g., social media savvy). In six studies (N = 1,022) using vignettes and simulated interactions, younger people (compared with middle-aged and older) liked older adults who stepped aside—who ceded power, passed up shared resources, and avoided youth culture—but did not respect them. Older adults who refused to comply with these behaviors were respected but disliked (North and Fiske, 2013). These prescriptive prejudices differentiate stereotypic warmth and competence, but go farther; for example, the most common result of an online search for “old people shouldn’t” comes out with the top choice as “drive”: literally constraining them to get out of the way.
Prescriptive stereotypes’ constraints operate in the workforce as well. For example, succession plans may pressure older workers to retire promptly, ceding power and resource control (a later section returns to this point).
ASSESSING THE ACCURACY OF AGEIST STEREOTYPES: COGNITIVE CAPABILITIES IN LATER LIFE
Despite stability in ageist attitudes and stereotypes (and, as discussed in a later section, stability in older worker reports of discrimination), a critic might ask whether these stereotypes about older workers’ ability are grounded in evidence. This section explores current evidence of age-related cognitive capacity. Longstanding stereotypes of older workers as ineffective (Avolio and Barrett, 1987; Singer, 1986; Rosen and Jerdee, 1976a, b) have confronted equally longstanding and contradictory evidence of their validity (for a review, see McCann and Giles, 2002). The newer evidence is even more comprehensive.
To be sure, individuals do experience physical and psychological changes as they age. This is a natural part of everyone’s development process, as a result of transitions and experiences that impact what they learn and how they develop. As the field of cognitive aging agrees, declines in healthy aging are exaggerated; rather, variability
in these processes is the rule (Tucker-Drob, 2019). For an aging workforce, the central questions about cognitive decline over time are, for any given occupation: when and whether declines start to occur, with perhaps few if any effects on performance; when such declines might affect performance, but can diminish with training or by changing the work context; and when such declines become irreparably detrimental to performance (see, for example, Rizzuto et al., 2012).
Answers to these questions are complicated by methods used to investigate them, including whether the research is lab-based or field-based, whether data is longitudinal or cross-sectional, and which types of cognition it assesses (whether memory, processing speed, executive functioning, verbal skills, spatial skills, or reasoning). In longitudinal studies of cognitive performance, two categories of intelligence are relevant: fluid intelligence (identifying patterns and relationships, working memory, information processing speed) tends to decline, but crystallized intelligence (knowledge acquired over time, vocabulary, experience) remains stable, perhaps even increasing over time (Salthouse, 2019). Thus, the data support two lifespan trends: steady growth in wise intelligence (accumulated knowledge) until older old age, along with declining speed over time starting in early adulthood (Salthouse, 2018; cf. Wang et al., 2013). For the most part, these latter fluid abilities are largely preserved through the typical working years (Schaie, 2013). If and when they occur, declines are not precipitous and might even be imperceptible to colleagues up until the 70s. Moreover, these changes may not have a negative (or positive) impact on actual job performance in older adults (Peng et al., 2018; Wang et al., 2013; Charness and Czaja, 2006). Most of the cognitive tests used to assess older adults were in fact designed for children and adolescents, not intended to test real-world behavioral outcomes such as job performance.
Various moderators further complicate cognitive performance. Individual differences affect whether and how cognitive decline manifests, especially among educated older adults (Bosma et al., 2003), and how older adults adapt to such changes, such as by optimizing their strengths and minimizing their weaknesses (e.g., Niessen et al., 2010; Baltes and Lindenberger, 1997). The organizational context can also be noteworthy by offering policies and practices that can minimize the impact of declines, such as providing supervisor support, flexible work arrangements, and other inclusive efforts (Veth et al., 2019).
In addition, the effect of age-related declines can vary depending on the type of decline, the type of job, and the age juncture; for example, declines may affect performance earlier in life for baseball players, later for air traffic controllers, and still later for professors and judges (Ackerman and Kanfer, 2020). Finally, current tests do not assess many job-dependent cognitive skills, such as employees’ domain knowledge of job requirements, critical thinking, reading and writing skills, and individual motivation for engaging the work.
Overall, the elder stereotypes seem mostly inaccurate and certainly lack nuance. Nevertheless, they likely trigger prejudices and discrimination, as the next sections review.
Emotional Prejudices: Missing Link between Stereotypes and Discrimination?
If stereotypes are cognitive beliefs and expectations, prejudices are affective responses, as noted earlier. Affect includes both good-bad evaluation (attitudes, preferences) and more complex emotions (pity, disgust, pride). Targeted emotions (differentiated prejudices) matter because they reliably predict differentiated discriminatory behavior. The default old-age stereotype of doddering-but-dear evokes pity and active helping in response to older people’s warmth, but neglect and disrespect in response to perceived incompetence (Cuddy et al., 2005; Fiske et al., 2002). The opposite stereotype of “greedy geezer”—not warm but competent and assertive—violates ageist prescriptions to step aside, so the key emotion is resentful envy. Envy predicts both associating (because they have resources) and harming (because they violate prescriptions to yield the resources). The stereotype combinations of warmth and competence predict distinct emotional prejudices, which are more specific than simple valenced preferences; these in turn predict differentiated discrimination.
The default older-adult stereotype—well-intentioned but inept—predicts pity, along with ambivalent protection and neglect. The ambivalent stereotype is well supported in many countries, as noted above. U.S. participants report the same stereotypes, associated emotions, and behaviors, as well as supporting that causal sequence (Cuddy et al., 2007; a correlational study from a representative U.S. sample and three experiments with undergraduates).
Research to date has not pursued measurement of these emotions in workplaces; such research would be useful to predict specific patterns of discrimination.
Another neglected source of emotional prejudices against elders is mortality salience. Ageism includes aversion to reminders of death (Martens et al., 2005). Evidence is scant so far: ageism correlates with death anxiety and risk-seeking behavior in one study of undergraduates (Popham et al., 2011). Aversion predicts avoidance (Cuddy et al., 2007). This pattern is plausible in the workplace, but it remains to be studied.
In conclusion, because emotional prejudices predict discrimination even better than stereotypes do (Fiske and Taylor, 2021), the neglected role of emotional prejudices in discrimination needs to be examined through evidence from the workplace. The interpersonal-level phenomena continue at the labor-market level, which is discussed later.
Conclusions about Ageist Attitudes, Stereotypes, and Prejudices at Work
Attitudes toward older people are generally and stably negative, but only moderately so. Whether and when the original, unfiltered attitude (moderate negativity) or the socially desirable, revised attitude guides age-related workplace behavior, including discrimination, remains an empirical question. But measurement is not straightforward and requires development.
Implicit attitudes also need clearer links to workplace behavior. A favorite of diversity, equity, and inclusion training, they may create a teachable moment, but the workplace dynamics of implicit, unexamined biases await more thorough investigation.
Ageist attitudes’ slight overall negativity masks a mixed stereotype: the default attitude expects an older person to be incompetent but well-meaning. Assuming an attitude-behavior or stereotype-behavior linkage in the workplace, one implication is that monitoring ageist biases does not translate directly into monitoring a single attitude, such as purely negative reactions. Biases are not uniform, one-size-fits-all phenomena. Older workers are not typically hated or feared—they may even be liked—but they are often disrespected. Interventions, too, would differ, based on the ageist configuration of stereotype components. Workplace research needs to verify these robust basic research results: Ambivalent ageist stereotypes likely predict ambivalent discriminatory behavior (e.g., protect but also exclude).
Even the simple ageism-discrimination link (the unambivalent default that a negative attitude toward older people predicts discriminatory behavior) remains understudied as an individual dynamic. Meta-analysis identifies few estimates of the link between ageism and discrimination (10 effect sizes, as of Jones et al., 2017), compared with links between sexism (43) or racism and discrimination (30). And in that overall prejudice-discrimination literature, most targets are hypothetical (46), not real people (10), and the raters are students (56), not other adults (27). Ageism’s link to discriminatory hiring selection (five studies) averages ~r = .21, small but higher than ageism’s link to biased performance evaluation ~r = .09 (three studies). Ageism’s effects are rarely tested.
The ageism literature contains an odd anomaly in testing the prejudice-discrimination link: different people report different parts of the causal chain, with targets reporting perceived discrimination, but the possible discriminators reporting only their prejudices and stereotypes. Research thus needs to link these other people’s (supervisors’ and coworkers’) self-reported age-related preferences (attitudes, prejudices) and expectations (stereotypes) with the constraints (discriminatory behavior) that older workers report. Perhaps those other people’s (coworkers’ and managers’) self-reported behavior toward older people is missing because such reports of discrimination could not be trusted, for social and legal reasons. Instead, usually in “the lab,” student respondents encounter hypothetical scenarios that explore attitudes or stereotypes regarding older workers, rarely tying them to discriminatory, possibly adverse decisions about older workers (Kite et al., 2005; Gordon and Arvey, 2004). This leaves the causal chain that produces discrimination incomplete, because while these observers report their beliefs and stereotypes, their emotions, and their prejudices, only the targets report discrimination.
Altogether, more complete mapping of the psychology would yield insight into leverage points for intervention. The measurable causal chain can go from the potential discriminators’ predispositions to their behavior and then to the target perceiving that behavior as discrimination. The science of social perception informs measurement of potential biases and their mechanisms (process mediators and situational or personal moderators), all candidates for intervention.
WORKPLACE AGE DISCRIMINATION AND EXCLUSION: OLDER WORKERS’ REPORTED EXPERIENCE
Having summed up how observers view older workers, we turn to look at how these workers themselves report experiencing ageism, including links to health and well-being, and we look at experiences of inclusion. Older workers do report perceived discriminatory behavior toward themselves—as well as describing their response and well-being—but rarely report their view of the putative causes (others’ attitudes, stereotypes, and prejudices about themselves). Admittedly, all these perceptions are subjective, but people’s perceptions drive their behavior and well-being, so measuring both causal and outcome variables would be useful. As a later section indicates, the most reliable indicators of age-related discrimination are audit studies (e.g., examining correspondence and resumés) and hiring studies (as in other types of discrimination; National Research Council, 2004).
Older Adults’ Experiences of Work-Related Stereotypes of Aging
Aging stereotypes are culturally shared and absorbed; as just reviewed, they prominently include cognitive incompetence. Many older people eventually apply age stereotypes to self (Levy, 2009). As people age, they worry that they actually might be, or might be seen as, losing their memory and general cognitive ability (Barber, 2017). Older people also worry too much about other people’s stereotypes, which are more positive than they think (Finkelstein et al., 2015). Worrying not only about their individual performance, other people’s stereotypes about their performance, but also about fulfilling the stereotype is termed stereotype threat. When the situation makes their age salient, stereotype threat does undermine older people’s performance on cognitive tests, relative to their individual potential (Lamont et al., 2015). When self-stereotyping and stereotype threat combine with perceived discrimination, all this could affect mental health and well-being, topics considered next.
Scales of Perceived Age Discrimination in the Workplace
Only recently have social scientists validated instruments to measure targets’ reported experiences of age discrimination. Four examples of psychometrically sound instruments are:
- The Nordic Age Discrimination Scale (NADS; Furunes and Mykletun, 2010);
- The Workplace Age Discrimination Scale (WADS; Marchiondo et al., 2016);
- The Work-related Age-based Stereotypes Scale (WAS; Marcus et al., 2016); and
- Workplace Intergenerational Climate Scale (WICS; King and Bryant, 2016).
These few examples of sound instruments aim to measure modern forms of age discrimination in the workplace, as reported by older workers themselves (Lagacé et al., 2020). Among the less obvious forms is incivility—“low-intensity deviant behavior with ambiguous intent to harm the target” (Cortina, 2008; p. 56).
Whether age discrimination is routine or “deviant” is an empirical question answerable by several methods. One approach compares the average perceived discrimination to the scale endpoints (no discrimination, much discrimination) or to the presumably neutral-scale midpoint. This allows comparing different subgroups on the same scale. Even the within-scale comparisons are not absolute in any sense, but they do show degrees of perceived discrimination. Unfortunately, only rarely does research address perceived age discrimination at work from large and population-representative samples.
For example, WADS, validated in the United States, assesses perceived age-based discrimination among individuals ages 18 and up. Respondents indicate the frequency of experiencing nine incidents of discrimination (on a scale from 1 = never to 5 = very often; see Table 6-4; Marchiondo et al., 2016). Average perceptions of workplace age discrimination from three online samples revealed perceived discrimination overall between 1 and 2, well below the scale neutral point of 3, closer to “never” than at least sometimes. But within this range, perceived discrimination was higher at both ends of the age distribution. For two online samples of older workers (ages 50 or older, N = 338 and 390) mean scores were 1.68 and 1.69. For two online samples of younger workers
TABLE 6-4 Workplace Age Discrimination Scale (WADS)
| Respondents report how often they have experienced nine items (1 = never, 5 = very often): |
|---|
|
SOURCE: Adapted from Marchiondo et al., 2016.
(ages 18–30, N = 294 and 403), the mean scores were close: 1.75 and 1.92. For middle-aged workers (ages 31–49, N = 407), the mean score was lower, 1.42. Combining the samples suggests a curvilinear relationship between age groups and perceived age discrimination at work. Across these separate samples, a U-shaped distribution of perceived discrimination across the working lifespan was evident, in which young and older workers reported experiences of age discrimination to be more frequent than did middle-aged workers (see Table 6-4; Marchiondo et al., 2016). All of the age groups averaged well below the scale midpoint, at least in this online sample (which is likely slightly more liberal and more educated than the average worker).
Another mean estimate comes from nationally representative data (N = 3,957) on Americans ages 51 years and older, collected in the 2010, 2012, and 2014 waves of the Health and Retirement Study (HRS). On a 4-point Likert scale (higher scores representing greater perceived age discrimination at work), the estimated mean score for perceived age discrimination at work was 2.02 in 2010 (Marchiondo et al., 2019), below the scale’s neutral point (i.e., 2.5). The estimated change coefficient over time is quite small (estimate = 0.01), indicating that perceived age discrimination at work is relatively stable.
In conclusion, the consistent reporting of low-grade but enduring discrimination is consistent with the stable, moderately negative expression of implicit and explicit attitudes reported earlier. But current data are limited. More research could address perceived age discrimination at work from large and population-representative samples.
Links among Perceived Discrimination, Health, and Work
Both overt and covert forms of age-based discrimination are correlated with health as well as with labor force attachment. Perceived age discrimination has been associated with mental health, stress, job satisfaction, turnover intentions, and retirement intentions in the expected directions (Marchiondo et al., 2016). Such correlational evidence makes a plausible argument that ageism is bad for the heath of older people. Showing these linkages is a first step, necessary but not yet sufficient for inferring causality.
Adding time to the correlation strengthens the argument for causality. Another investigation utilized latent growth modeling based on Health and Retirement Study 2010–2014 data to establish this relationship between age discrimination and health (Marchiondo et al., 2019). In this study, workplace age discrimination measures were direct (e.g., “In decisions about promotion, my employer gives younger people preference over older people,” and “My co-workers make older workers feel they ought to retire before age 65”) and associated over the long term with mental health, self-rated health, and occupational health, but not with retirement intentions. Health might mediate the relationship between perceived discrimination and retirement age.
Subsequently, analysis of a representative sample of older adults in the United States from the Health and Retirement Study (2006–2014) revealed that (1) mental health only partially mediated the relationships
between major lifetime, work-related discrimination and retirement, whereas (2) mental health fully mediated the relationship between everyday discrimination (outside of work) and retirement age. Individuals who reported high levels of daily-life discrimination retired earlier than individuals who did not experience discrimination (controlling for demographics, marital status, household income and assets, and health insurance; Gonzales, Lee et al., 2019).
A meta-analysis of studies conducted throughout the world found 27 that addressed workplace ageism (e.g., perceived hiring and training discrimination) and its association with worse mental health, such as depressive symptomology, and physical health, such as long-term illness (Chang et al., 2020). People reporting ageism were also more likely to retire early. These findings from 17 countries support selective incivility and stereotype embodiment theories (Levy, 2009; Cortina, 2008), which suggests ageism could impact health through three separate but interrelated components: “age discrimination (i.e., detrimental treatment of older persons); negative age stereotypes (i.e., beliefs about older persons in general); and negative self-perceptions of aging (e.g., beliefs held by older persons about their own aging)” (Chang et al., 2020, p. 2). These external and internal experiences relate to decreased self-efficacy, perceived control, and purpose in life, which may moderate the relationship between ageism and health.
A small but growing body of research suggests that discrimination within the workplace may also cause distress at home (Ferguson, 2012; Cortina et al., 2001). Analyses of 299 couples in the Health and Retirement Study revealed that workplace incivility was associated with targets’ well-being, which was subsequently associated with life dissatisfaction, interference with work, and lower overall health (Marchiondo et al., 2020), confirming previous findings. In a novel finding, workplace incivility perceived by the target was associated with declines in their partners’ well-being.4
Discrimination and incivility at work are stressful. This stress likely permeates the targets’ social network, affecting the health of partners at home. More research is needed to discern how retirement decisions made by couples are influenced by these spillover effects. Future research could also clarify whether these experiences are tied to ageism, racism, sexism, or a combination of marginalized identities; this evidence could inform workplace interventions.
Overall, perceived workplace discrimination is associated with various aspects of health, such as hypertension, depression, anxiety, self-esteem, and global health (Marchiondo et al., 2019; Pascoe and Smart Richman, 2009; Lim et al., 2008; Garstka et al., 2004), as well as lower levels of job satisfaction (Taylor at al., 2013) and turnover intentions (Lim et al., 2008). Granted, the direction of causality is not established because these findings are based on necessarily correlational designs.
The relationship between workplace discrimination and health also depends on employees’ inner resources and how they can cope with discrimination (Charles, 2010; Holland, 1997). Perceived control, Big Five personality traits, optimism, and coworker/supervisor support may all moderate the relationship (Tett et al., 2013; Tett and Burnett, 2003). For example, employees with high neuroticism, high extraversion, and high agreeableness have more negative responses to perceived workplace discrimination (Xu and Chopik, 2020). Perceived control was a protective factor for health within the context of workplace discrimination. Similarly, employees high in negative affect (e.g., chronically resentful) were more likely to perceive age discrimination, especially when they reflected on their experiences over five years, as opposed to the past year (Marchiondo et al., 2017). Irritable people might (mis) perceive more discrimination; without disrespecting individual experience, research should probe this possibility.
In conclusion, reported experiences of discrimination occur along with a constellation of signs of lower health and well-being and along with a higher likelihood of work exit. Studies deploying longitudinal designs could help unpack the causal directions of these relationships. Also, assessing the role of additional covariates (e.g., optimism, personality, and support) may clarify and isolate the relationships among perceived workplace discrimination, health, and labor force participation.
___________________
4 This crossover effect of stress at work to health outcomes at home varied by gender. After men experienced incivility, their affective wellbeing was associated with their female partners’ overall life satisfaction. Women’s experiences of workplace incivility were directly associated with the affective well-being of their male partners.
A Note Regarding the COVID-19 Pandemic
With the data arriving as we write, the COVID-19 pandemic’s effects on older workers appear mixed. As other chapters indicate, COVID-19 evidently disrupted many older workers’ pathways to retirement, accelerating the transition in many cases. Workers’ age, ethnicity, gender, and education interact to predict COVID-19’s economic hit to at least some older workers, but other evidence indicates that younger workers—in various combinations with the same factors—may have been at least as vulnerable (Moen et al., 2020). The COVID-19-related unemployment pattern could be curvilinear by age, but it might not represent discrimination in any case.
Intersection with Other Forms of Discrimination
Depending on their race and ethnicity, older adults report experiencing varying levels of lifetime discrimination at work and in their everyday lives. Recent analyses of the Health and Retirement Study (Gonzales, Lee et al., 2021) suggest that 20 percent of older Black workers report being unfairly dismissed from a job, a rate similar to that reported by older White workers (19%), and slightly higher than Hispanic workers (15%). Approximately 13 percent of older Black people reported unfairly not being hired for a job, a rate significantly higher than those reported by White people (7%) and Hispanic people (5%). Older Black workers were nearly twice as likely to not be promoted at work (15%) as White workers and Hispanic workers (9% in each case) were. Respondents also reported everyday incivilities, such as being unfairly treated with less courtesy or respect, being threatened, or being harassed. Older Black people again reported the highest rates (21%) of experiencing two or more of these everyday incivilities, followed by older Hispanic people (13%), and White people (12%).
Respondents also reported why they believed they were the targets of everyday discrimination. Age discrimination is a common experience among older adults—White, Black, and Hispanic workers—yet their meaning-making attributions to these experiences differ somewhat. Racial and ethnic minorities tie these experiences to their race, nativity, age, and gender, whereas older White people mostly attribute these experiences to age and gender. Ageism and age discrimination are a shared experience across racial and ethnic membership groups, yet various attributions underscore the need for an intersectional lens to understand discrimination in later life.
Multiple marginalized characteristics—including older age, racial/ethnic minority status, and less education—increase the risk for discrimination (Chang et al., 2020). For example, older applicants were sorted into lower-paid employment vacancies, when compared to their younger counterparts, yet older racial/ethnic minority applicants were less likely to be interviewed than White older applicants (Drydakis et al., 2018). Also, older targets with less education faced higher risks of age discrimination, compared to the more educated group (Chang et al., 2020). These findings inform double- and triple-jeopardy hypotheses (Sidanius and Veniegas, 2000), as well as intersectionality theory (Purdie-Vaughns and Eibach, 2008), which posit that those at the intersection of multiple disadvantages (e.g., older Black women) have compounded experiences of disadvantage and seek to understand the complexity of identities and vulnerability within workplace settings. More systematic work is needed.
Experiences of Organizational Inclusion
Organizational climate can offset tendencies toward age discrimination and its likely effects. The U.S. Office of Personnel Management (2011, p. 5) describes organizational inclusion as a collective commitment to connection, collaboration, flexibility, fairness, diversity, and opportunity. Similarly, “in inclusive organizations and societies, people of all identities and many styles can be fully themselves while also contributing to the larger collective, as valued and full members” (Ferdman, 2017, p. 235). With an inclusive climate, organizational practices aim to welcome, accept, and treat all workers fairly, rather than excluding as a result of stereotypes, prejudice, or discrimination (Parker and Andrei, 2020).
Two general practices are critical components of a climate of organizational inclusion aiming to prevent discrimination and bias at work (Janssens and Zanoni, 2008). Specifically, organizations need to ensure the same treatment across employees, while simultaneously acknowledging employees’ individual differences. The effective organizational practices often include recruitment of diverse workers based on both their individual capabilities
and their demographic group membership, building diverse teams with equal-status jobs, and designing task-interdependent teams, allowing for frequent interaction and communication among diverse team members (Janssens and Zanoni, 2008).
A climate of organizational inclusion demonstrably promotes employees’ psychological safety, offering a place where diverse workers can behave authentically (Shore et al., 2018). Such safety can allow employees in different identity groups to comfortably express views that differ from others at work. An inclusion climate moderates the relationship between workplace diversity and relationship conflict (Nishii, 2013). In particular, workplace diversity correlates with employee conflict in low-inclusion work units, but diversity negatively associates with conflict in high-inclusion work units.
More specific to workplace age discrimination, an organization’s age diversity could enable an age-discrimination climate, which collectively undermines affective commitment (attachment, belonging) and damages the organization’s performance (N = 8,651 in 128 organizations; Kunze et al., 2011). In contrast, older workers experienced less age discrimination when they worked in an inclusive climate and when they were included in the manager’s in-group (Nishii and Langevin, 2009). Although a culture of respect, inclusion, and empathy relates to job satisfaction for workers of all ages (Pitt-Catsouphes et al., 2015), older women especially are likely to say that such a culture is important to them (Pitts, 2009).
Conclusions about Self-reported Experiences of Workplace Age Discrimination
Psychometrically validated scales document older workers’ reports of discrimination, which covary with job dissatisfaction and poor health, though the evidence establishing causality awaits better designs. Other forms of discrimination intersect with ageism, but more work is needed to understand these relationships. Some intersections may amplify stigma (e.g., an older person who uses a wheelchair); others may eliminate it (e.g., an “elder statesman;” a Black grandmother); still others may make the person invisible (older White women). An inclusive climate benefits all workers, offsetting the risks of friction that may occur with age diversity.
Having addressed face-to-face ageism (attitudes, stereotypes, prejudice, discrimination, and inclusion), the review moves up a level to age-related performance in the aggregate.
AGE AND JOB PERFORMANCE
On the job, older people’s actual performance matters. What some older workers report as age discrimination, employers might justify, hypothetically, based on older workers’ stereotypically expected inadequate job performance on average. However, not much evidence shows a consistent relationship between age and performance.
The first meta-analysis (based on 13 studies) shows age to be positively correlated with job performance and productivity: Older workers were objectively more productive than their younger counterparts (Waldman and Avolio, 1986). Peer ratings also favored older workers. However, supervisor ratings of job performance declined with employee age. Taken together, these results suggest supervisor biases against older workers. This bias appeared to be stronger for nonprofessional positions than for professional positions—perhaps related to the physical demands of nonprofessional jobs. Still, ratings of older professional (knowledge-based) workers were still lower than ratings of their younger counterparts, indicating supervisors’ potential age bias. Supporting this finding of rater bias, some individuals are indeed predisposed to rely on negative stereotypes of older workers and evaluate their performance more negatively (Perry et al., 1996).
Yet another meta-analysis (based on 65 studies) shows no relationship between age and job performance (McEvoy and Cascio, 1989). A subsequent narrative review of 117 publications focused on age stereotypes (Posthuma and Campion, 2009) also found little evidence that performance declines with age. Consistent with the earlier meta-analysis results for peer and objective measures, this last review demonstrated job performance improving with age; any declines in performance were quite small. In fact, health status and individual skill levels were more predictive of performance than age was.
On the other hand, in a set of three meta-analyses by Sturman (2003), the heterogeneity of the results depended on performance measures (objective vs. supervisor) and job complexity. Sturman investigated job experience and
TABLE 6-5 Age and Job Performance Factors
| Unrelated to Age (Competence) | Positively Related to Age (Warmth) |
|---|---|
| core task performance | organizational citizenship behaviors |
| creativity | safety performance |
| performance in training programs | (avoid) general counterproductive work behavior |
| (avoid) self-rated workplace aggression | |
| (avoid) self-rated on-the-job substance use | |
| (avoid) tardiness | |
| (avoid) absenteeism | |
NOTE: An earlier meta-analysis did find age-related decline in training performance (Kubeck et al., 1996), but the more recent Ng and Feldman (2008) does not.
SOURCE: Data from Ng and Feldman, 2008.
performance (on 58 studies, N = 87,189), organizational tenure and performance (on 74 studies, N = 59,444), and age and performance (115 studies, N = 96,866). All three indicators of worker “age”—experience, tenure, and actual age—showed inverted U-shaped relationships with performance in low-complexity jobs. High-complexity jobs also showed nonlinear (but not curvilinear) patterns. Measures of worker “age” need to be compared, as do features of the job itself.
Given such widely disparate and inconsistent results, the range of performance measures could matter (Ng and Feldman, 2008). Prior meta-analyses had measured performance by core tasks, that is, by job account-abilities and activities. The expanded definition of job performance used by Ng and Feldman includes 10 factors related to employee actions and behaviors, all of which impact the work context and, therefore, performance measurement (see Table 6-5). Using this approach, age is found to be unrelated to performance on core task performance, creativity, and training-program performance. However, a positive relationship emerged between age and organizational citizenship behaviors: actively upholding organizational norms, helping coworkers who needed assistance, and avoiding negative behaviors such as gossiping and complaining. This split between performance and being a good person fits the universal elder stereotype split between disputed competence and presumed warmth, described earlier.
Throughout, the literature fails to agree on what to measure, how to measure it, and whom to ask. In psychological research, lack of agreement on how to measure the concept of age is a final reason for the different outcomes among studies designed to measure the relationship between age and job performance. Specifically, multiple ways of defining age go beyond simple chronological age (Cleveland and Lim, 2007; see Sturman, 2003, just noted). These include person-based measures of age, such as subjective, personal, or perceived age (i.e., how old or young individuals perceive themselves to be), as well as functional or biological age. In addition, within organizations, context-based age measures include psychosocial measures (e.g., self-perceived or other perceived age) and organizational measures (e.g., self-perceived or other perceived age in relation to other work group members).
How one defines the concept of age can impact how age relates to performance, management, training, and leadership. One attempt to systematize the age variable, as noted, defines age in different ways based on the purpose of the measure—as generation, chronological age, tenure in the job, and experience (North, 2019)—and some seemingly inconsistent results become clearer when they distinguished by these measures of age. As noted earlier, the predominant age stereotype concerns incompetence, but the simple conclusion regarding its accuracy is a lack of consistent evidence, and some contrary evidence, especially regarding older people’s advantage in knowledge and experience. Although cognitive speed may decline with chronological age, experienced older workers create work-arounds to compensate for this. But only older workers with more job-specific experience would have the knowledge to develop these compensation techniques. In this way, job experience would moderate the negative effects of chronological age on productivity.
The other likely dimension of age stereotypes, benign intentions, suggests some basis for accuracy, when measured in organizational citizenship behaviors. Measures of worker “age,” worker character, job factors, and performance measures all matter to the analysis of stereotype accuracy, performance, and discrimination. New research needs to acknowledge these complexities.
Aggregating Age-Productivity Profiles: Workplace-Level Analyses
The widely presumed age-productivity profiles are also hard to evaluate because performance itself is hard to measure, hard to isolate, and may depend on the level of aggregation. Even so, moving from individual to the workplace (factory or firm) level of analyses still fails to find productivity declining with age.
Assessment Issues
The impression that human productivity rises quickly until it reaches a peak at a relatively young age and then declines is widespread and implicit in many discussions about aging. Macroeconomics usually assumes an increasing and then decreasing profile, with a peak somewhere between ages 30 and 45 (e.g., Altig et al., 2001). Often regarded as an established fact, the hypothetical age-productivity profile matters to countries’ retirement policy (Lahey, 2008), employers’ expectations, and employees’ choices. From a macroeconomic point of view, if the impression were true, as the population’s share of older workers rises aggregate productivity should fall, a result that has some support (Maestas et al., 2016). This more or less implicit assumption creates the pessimistic undertone in the debate about stagnation due to aging populations (Gordon, 2016; Lee, 2014; Summers, 2014; Lee and Mason, 2010; Feyrer, 2007) despite some contradicting micro- and macroeconomic evidence (Acemoglu and Restrepo, 2017; Kluge et al., 2014; Mokyr, 2014; Kwon et al., 2010).
Labor economists have long estimated age-productivity profiles in numerous empirical studies (early reviews are Kutscher and Walker, 1960; Mark, 1957; more recent reviews are Gelderblom, 2006; Skirbekk, 2004). However, they face a host of methodological challenges (Börsch-Supan and Weiss, 2016; Göbel and Zwick, 2012), including measurement, selectivity/endogeneity, and aggregation that make results difficult to interpret.
First Challenge: Measuring Productivity
Productivity resists direct measurement, as noted earlier. Although biophysical markers deteriorate with age, social experience increases; that is, people learn to work well with others, on average. But wisdom is more difficult to measure than speed, for example. Since the easily measured abilities peak early, the focus of research on these abilities may contribute to the age-productivity myth (Börsch-Supan, 2013). A similar argument holds for cognition. While fluid intelligence, often associated with the speed with which new tasks are learned, is relatively easy to measure, crystalized intelligence, associated with knowledge and experience, is much harder to measure (Salthouse, 2012).
On-the-job measures might seem reasonable, and early studies used wages as a measure of productivity (e.g., Kotlikoff and Gokhale, 1992; Kotlikoff and Wise, 1989). But independent of productivity, age and seniority tend to increase wages, and wages rarely decrease, which limits their usefulness as a measure (e.g., Laitner and Stolyarov, 2005; Salthouse and Maurer, 1996; McEvoy and Cascio, 1989; Medoff and Abraham, 1980). Finally, as the previous sections suggest, managers, whose evaluations determine wages, may themselves be biased about the age-productivity profile.
Second Challenge: Causal Ambiguity
Age composition of the labor force has a potential endogeneity problem, making it causally ambiguous as an indicator, due to selection processes (Börch-Supan, 2013). Working is both a predictor variable and an outcome variable, because productive workers are more likely than unproductive workers to keep their jobs. When plants close or firms reduce positions, and some employees must retire early, employers prefer to keep productive workers,
creating positive selection. Age structure at the company level has a related endogeneity problem. Productive firms are profitable firms, and they tend to hire more people. Expanding their workforce leads them to favor younger hires (Ouimet and Zarutskie, 2013). When this occurs, company productivity would show a spurious negative correlation linking youth and productivity.
Third Challenge: Finding the Right Level of Aggregation
Aggregation takes account of productivity associated with teamwork, allowing workers’ productivity to be interdependent. Teammates influence the work climate. Older workers are more likely to spend time helping others, so an individual-level analysis would underestimate their contribution and overestimate the contribution of the younger workers they helped. The aggregate productivity measure would better capture this dynamic.
However, a company view also falls short because it collapses over heterogenous jobs, motivations, and productivity. That is, some jobs offer continuing advancements, keeping motivation at older ages (e.g., management), whereas other jobs top earlier (e.g., shop floor). Age-productivity profiles would differ accordingly, and averaging over them, as in company-level aggregation, could be misleading.
Most age-productivity studies correlate workplace productivity with the age composition of its employees (e.g., Daveri and Maliranta, 2007; Haltiwanger et al., 1999; Hellerstein et al., 1999; Hellerstein and Neumark, 1995). Workplace productivity is easy to measure reliably, and it offers a compromise between individual productivity and the productivity of the entire company. Nevertheless, workplace age structure is probably not exogenous (a straightforward predictor), as noted above. New econometric methods have solved many problems but sacrificed precision. The best estimates show that productivity increases until a worker is 50–55 years old, and then it levels out (Göbel and Zwick, 2012; Malmberg et al., 2008; Aubert and Crépon, 2007; Aubert, 2003). The more sophisticated the methods, the more productivity increases with age (although confidence intervals, and thus the precision of these estimates, also widen).
Finally, many studies measure individual productivity directly (Börsch-Supan et al., 2021): by the number of peer-reviewed publications (Oster and Hamermesh, 1998) or Nobel Prizes (Jones, 2010), by the prices obtained for paintings (Galenson and Weinberg, 2001), by sports records (Fair, 1994), or by completed court cases (Backes-Gellner et al., 2011). Although precise, these measures apply only to some occupations and then only to top performers, whose work is often achieved earlier and recognized later. Ordinarily, workflow is set up for average performance (Börsch-Supan, 2013), which does not decline with age, despite the common expectation.
Aggregating Productivity as a Function of Age
Workplace-level analyses of productivity offer the use of big data sets and econometric methods, thereby avoiding labor-market selection effects (Börsch-Supan et al., 2021; Börsch-Supan and Weiss, 2016). Two cases illustrate the principles in quite different industries: a truck factory and an insurance office.
In a truck factory, assembling a standardized product, the ability to simply avoid errors is a precise measure of productivity: here, the inverse of the number mistakes made in a given time (Börsch-Supan and Weiss, 2016). Given the sheer physical demands of these jobs, productivity in such a plant might best detect age-related decline. Nevertheless, an evaluation of more than 1.2 million observations in this plant find no decline in productivity within the relevant age range. Instead, individual worker productivity increases monotonically until age 65, when everyone retires. Any age-related declines in strength are offset by harder-to-measure outcomes, including experience, teamwork, and coping with emergencies, all of which apparently improve with age.
Analysis of a large international company in the service industry (insurance, Börsch-Supan et al., 2021) shows the importance of job type. Routine, undemanding jobs show age-related productivity decline for ages 30–55. More complex professional jobs (most employees) show no age-performance relationship. However, the most challenging jobs, those of advanced specialists, show a reliable, steady increase in productivity across all ages.
Conclusions about Age Profiles and Workplace Productivity
The current literature on workplace productivity finds no solid evidence that productivity generally declines with age. Hence, any claim that stagnation over time is due to population aging rests on weak evidence. Some traction results from distinguishing between the productivity of top performers and productivity in ordinary jobs. More specific differences between jobs may determine the age-productivity profile: Performance of purely physical work may decline with age, and performance of boring jobs may decline with age (or tenure). More challenging jobs that profit from experience, teamwork, and insights into human nature—as well as sustained interest—may increase performance with age (or experience).
Many of the studies in this area are flawed, due to the difficulties in measuring productivity and in avoiding selection and aggregation biases. New research is needed to provide unbiased data and to filter the age effect out of many other determinants of day-to-day productivity. There are no up-to-date company studies in the United States.
AGE DISCRIMINATION IN THE LABOR MARKET FOR OLDER WORKERS
As a nation, Americans apparently believe that if older people, specifically those past the traditional retirement age of 65, want to work, discrimination (on any basis) should not prevent them from doing so. This is evident in the passage of the Equal Pay Act (1964), Title VII the Civil Rights Act (1964), the Age Discrimination in Employment Act (ADEA, 1967), and the Americans with Disabilities Act (1991). Moreover, labor market participation at older ages could reduce the budgetary impact of an aging population on public programs such as Social Security. Ageist discrimination therefore deserves attention as a constraint that limits individual preferences and societal expectations.
In individual and interpersonal settings seen earlier, ageism manifested in attitudes, implicit and explicit bias, stereotypic beliefs, and emotional prejudices—all psychological antecedents to the discrimination sometimes reported by older workers.
Nature of Evidence for Employer Discrimination
These considerations raise a central question: is age discrimination a significant problem for older workers? (Chapter 8 discusses policy responses.) Research that attempts to provide an aggregate, quantitative answer to this question focuses on the market-level outcomes that can be measured in the available data sources, for example, in household surveys, employer surveys, or hiring data collected by researchers. The kinds of interpersonal experiences related to age discrimination discussed earlier in this chapter have typically been quantified with psychometrically valid measures of individuals’ interpretations of their lived experiences.
Economists and other social scientists typically are cautious about interpreting differences between groups as evidence of discrimination. Observing differential outcomes by age (e.g., longer times to find a job) does not necessarily imply age discrimination, though it is consistent with it. Instead, other explanations, such as chronic illness, must be eliminated. Rarely does blatant, direct evidence of intentional discrimination appear in the current era, partly because age discrimination is no longer legal. (Before the ADEA, job ads explicitly set age restrictions, but this is no longer the case; U.S. Department of Labor, 1965.) More often, evidence is indirect and by itself inconclusive, because alternative explanations for the findings cannot be excluded. As a result, researchers have turned to experimental and other methods to produce more rigorous evidence on age discrimination.
Indirect Evidence of Employer Discrimination
Evidence of discrimination is considered indirect if it is based on differences in the observed behavior of older worker relative to that of younger workers or on the differential treatment of older workers by other agents. A prominent example is the consistently longer unemployment durations experienced by older job seekers in their 50s and early 60s compared with younger ones. This difference suggests that employers exhibit age bias in hiring, although it does not show it conclusively (Neumark and Button, 2014). For example, older workers could be more selective when pursuing new opportunities because they reject some types of work or expect higher pay based on their experience at their previous job.
Indirect evidence includes identifiable patterns of worker behavior. When workers report age discrimination, these reports are often associated with other subsequent adverse work experiences, including separating from jobs, longer periods of unemployment, slow wage growth, and earlier expectations for retirement (Adams, 2002; Johnson and Neumark, 1997). This constellation of adverse experiences is consistent with age discrimination, but it could also be due to contemporaneous changes in health, such as an increase in chronic pain, high standards, or depression. Or, when asked, older workers may just attribute many negative outcomes to age discrimination.
Changes in labor market outcomes of older workers that occur after new laws that protect them from employment discrimination are passed can also provide indirect evidence of age discrimination. Indeed, passage of both state and federal legislation protecting older workers has preceded their higher employment rates (Adams, 2004) and increased longer-term attachments of older workers to firms, benefiting firms and older workers alike (Neumark and Stock, 1999). Of course, alternative explanations remain possible: places becoming more hospitable to older workers for other reasons (e.g., due to population shifts) might change both their laws and their employer-employee norms.
More recently (2003–2008), changes in Social Security decreased benefits for early retirees (age 62) and gradually increased the retirement age from 65–67. Older workers responded by working longer and claiming benefits later in states with better age-discrimination laws (increased damages in age-discrimination suits; expanded coverage to include smaller firms; Neumark and Song, 2013). (See Chapter 8 for more discussion of Social Security.)
Although evidence of the effectiveness of age-discrimination laws can suggest that age discrimination had been present, this evidence is considered indirect, because age discrimination laws are not perfect. In theory, for example, workers could use the laws simply to contest a disliked outcome, such as being fired, paid less, or passed over. That, in turn, might lead employers to terminate fewer older workers, or increase their pay, even in the absence of actual discrimination. Though this is unlikely (especially given the evidence discussed below), this possibility cannot be dismissed. Additionally, antidiscrimination laws could, in theory, reduce hiring of older workers by making employers more cautious about hiring these workers; these effects would depend on the laws’ content and enforcement.
Direct Evidence of Discrimination: Audit and Correspondence Studies
Audit and correspondence studies are the gold standard for inferring discrimination in the labor market (e.g., National Research Council, 2004; Fix and Struyk, 1993). In contrast to observational studies from which evidence of discrimination can only be inferred, audit and correspondence studies allow researchers to manipulate age (or race, gender, etc.) in ways that are unrelated to other worker characteristics, and thus directly measure discrimination. Audit studies use actual job applicants coached to act alike and measure discrimination as differences in job-offer rates. Correspondence studies create fake applicants (on paper or electronically) and capture callbacks for job interviews. Both kinds of studies’ artificial applicants have resumés indicating equal qualifications, except for their belonging to a demographic group protected by law (e.g., being older or younger, often indicated by graduation year). Absent any average differences between groups, employers should treat them identically, unless they prefer one group over the other, which is known as having a “taste for discrimination.” (Taste discrimination occurs because of having animus against, or a distaste for, the group in question.) Alternatively, employers might be making inferences based on group membership (see the earlier discussion of stereotypes), unjustified by individuating information. (Statistical discrimination uses actual or perceived group differences—such as stereotypes—to make inferences about an individual from the group and hence treat that individual differently.) Either way, group disparities generate a strong inference of discrimination.
Audit studies take more time because they entail interviews, so they have samples of a few hundred observations at most. Also, they risk experimenter expectancy effects because the actors can easily infer the hypotheses and inadvertently behave accordingly (Heckman and Siegelman, 1993). Correspondence studies, because they entail “paper people,” can collect far larger samples of job-application outcomes. Though correspondence studies capture only callbacks and not actual job offers, callbacks seem to capture most of the relevant discrimination. For example, 90 percent of the discrimination detected in International Labour Organization studies occurs at the selection-for-interview stage (Riach and Rich, 2002; see also Neumark, 1996).
This type of experimental research provides stronger demonstration that age can drive the labor market decisions of employers. Although these types of studies are focused on hiring choices and, therefore, might not seem relevant to extending the work lives of older adults, these audit or correspondence studies are directly related
to older adults’ ability to transition to new jobs. Age discrimination in hiring can prevent them from moving to a new employer, acquiring a part-time or less-demanding job that provides them with a bridge to retirement, or unretiring and returning to the labor force. Many older workers extend their work lives in these ways (Johnson, 2014; Maestas, 2010; Cahill et al., 2006). Additionally, employers who engage in discriminatory hiring practices may be more likely to also engage in other forms of workplace age discrimination. Thus, understanding these easier-to-measure forms of discrimination could provide insights into how those same employers treat older adults in their employ.
As an illustration of what can and should be done with appropriate resources: A recent large-scale study of age discrimination in hiring (Neumark et al., 2019) focused on ages near retirement, precisely when policy incentives aim to encourage people to work longer. The authors identified advertisements for jobs in occupations that hire low-skilled workers from all adult age groups, such as administrative assistants and secretaries (female applicants’ resumés), janitors and security guards (male applicants), and retail sales (both genders). They designed realistic resumés for fictitious applicants for these positions that differed only by age of the applicant. Each resumé was assigned to one of three age groups: young (ages 29–31), middle-aged (ages 49–51), and older (ages 64–66). Three otherwise identical resumés (one from each age group) were sent to apply for each of more than 13,000 open positions they had identified, which were located in 12 cities within 11 states.
Across the board, callbacks were higher for younger applicants than for older applicants, consistent with age discrimination in hiring, in every job category. And discrimination was worse just before retirement age. Moreover, women experienced more age discrimination than men: female applicants to administrative and sales jobs showed a large and steadily decreasing decline in callbacks with age. For men, the young-old difference was substantial but smaller, and middle-aged men in sales and janitorial services got a break, getting called back as often as younger men.
Two additional points are key. First, although methods have improved over time, findings are consistent (Farber et al., 2017; Lahey, 2008; Riach and Rich, 2010, 2006; Bendick et al., 1999; Bendick et al., 1997); a sizable body of work indicates age discrimination.
Second, age discrimination against older women is consistently higher than that for older men (Farber et al., 2017; Lahey, 2008). Several factors might contribute. Judgments based on appearance favor the young, for both genders, but women pay a higher price for an aging appearance (e.g., Deutsch et al., 1986), and gender roles emphasize appearance more for women (Jackson, 1992) than for men. In job descriptions posted on Internet job boards in China and Mexico, employers often expressed preferences for workers based on age and sex (Hellester et al., 2020; Kuhn and Shen, 2013). This research found a twist: greater preference toward women in job descriptions seeking young workers, and for men in job descriptions seeking older workers.
Generally, older women are in a bind regarding employment discrimination, because age discrimination is worse for them (Lahey and Oxley, 2021; Burn et al., 2020), but they cannot generally have straightforward recourse to both age and sex discrimination laws at once. Age discrimination laws do less to protect older women than older men (McLaughlin, 2020).
A parallel dilemma faces older Black Americans, who have worse economic outcomes than older White Americans; part of this gap reflects current job prospects. To the extent that racial and age discrimination combine, the ADEA limits enforcement where age is one of multiple factors (Delaney and Lahey, 2019). Clearly, more work needs to examine the intersections of gender and race with age, given the stronger age discrimination experienced by older women and by older minorities.
Stereotypes about Older Workers Affect Demand
Older workers may be targets of stereotypes about their skills or abilities on average (reviewed earlier), or what labor economists might refer to instead as statistical discrimination, which in this case refers to assumptions about the average abilities of older workers that are applied to all older workers.
What we do not know from this literature, however, is how these stereotypes affect demand for older workers in the actual labor market. A large-scale correspondence study of age discrimination, which provided experimental measures of discrimination across thousands of employers, was combined with a computational linguistics analysis of the text of the job ads from this study (Burn et al., 2020). The aim was to ask whether employers who use more
age-related stereotypes in their job ads—especially negative stereotypes about older workers—are more likely to discriminate against older workers in hiring.
This could happen for two reasons, both consistent with lower demand for older workers. Employers who are predisposed to discriminate could signal their preference for younger workers by using job-description language that conveys positive young-person stereotypes. This might then discourage older workers from applying in the first place, concealing any age bias in the hiring process. This process could reflect taste-for-discrimination (employer animosity) or statistical discrimination (stereotypical belief about the group average). Another possibility is that employers could assume, based on their belief in stereotypes about older workers, that older workers will be less able to meet the advertised job requirements. In that case, these beliefs would clearly reflect statistical discrimination and could shape not only the job-description language and pool of applicants, but also the probability that older workers would receive a callback when they apply.
Job ads’ age stereotypic language (see section above on Stereotype Content) is related to fewer callbacks for older applicants—across both jobs and genders (Burn et al., 2020). The ageist language about both men and women describes the required (youthful) personality for the job. For men, the ageist descriptions also refer to robust health and cutting-edge skills. Research needs to extend these findings across race and cultures to better understand how cultural understandings of age may affect these outcomes.
Conclusions about Labor Market Demand
Stereotypes about older workers do affect employment decisions and the demand for older workers. Not only do these results need replication, but more detail is needed about the processes involved in order to document mediators, moderators, and possible points of intervention.
CONCLUSION
Summary
This chapter reviewed evidence of discrimination against older workers on three levels, going from the micro to macro: age-related interpersonal interactions at work, workplace aggregated age profiles of performance, and labor markets manifestations of age-related productivity and discrimination.
Starting with interpersonal face-to-face workplace issues: societal images of older workers (explicit and implicit) align with their reported experiences of workplace discrimination; these experiences have associations with their mental and physical well-being. Universally beneficial—and therefore more likely to be widely acceptable—remedies aim for inclusive climates, realistic assessment of workers’ cognitive capacity, and measuring their actual job performance. Age-based analyses find no generalized performance differences but consistent reports of discrimination. However, beyond well-documented ageism in hiring processes, proof of discrimination is elusive. Even less is known about how these age-related work experiences, and their personal correlates, vary as age intersects with other marginalized categories.
Aggregating over individuals, at the workplace, analyses of age-related productivity also find no performance differences. Finally, anticipating the following chapter, the current review examined the labor market—older workers’ aggregate productivity and employers’ aggregate age discrimination. Analyses of direct and indirect evidence, and especially audit studies of job applications, show that stereotypes about older workers affect labor market demand—paving the way to the next chapter on age-related labor market supply and demand.
Research Implications
Research agendas need to address how societal expectations about aging workers (e.g., stereotypes) affect employers and managers’ preferences (e.g., attitudes) and how these in turn constrain older workers’ options (e.g., discrimination), despite scant evidence of age-related performance issues. Research implications go from workplace interactions to firm-level productivity to labor market outcomes.
Ageist Attitudes and Stereotypes at Work
The science of social perception informs measurement of potential age-related biases, their mechanisms (process mediators and situational or personal moderators), and points of leverage for intervention. This raises several issues for understanding how ageism occurs.
Research needs to address the relationship between implicit and more explicit workplace attitudes and behavior, although measurement is not straightforward and requires additional development. For example, as ageism becomes less acceptable, research could address whether and when the original, old-fashioned, unfiltered attitudes or newer, more socially desirable, revised attitude guides age-related workplace behavior, including discrimination. Implicit attitudes also need clearer links to workplace behavior. Knowledge about the workplace dynamics of implicit, unexamined biases await more thorough investigation regarding on-the-ground behavior.
Another form of unexamined bias is mixed beliefs that include both positive and negative valence. Workplace research needs to verify basic research results: many ageist stereotypes are mixed (e.g., “doddering but dear”) and likely predict ambivalent and ambiguous behavior (e.g., liking but disrespecting). Since this is harder to detect, but identifies a form of ambivalent discrimination that is distinctive to older people, good measurement is essential.
Finally, other forms of discrimination intersect with ageism, but more work is needed to measure and understand this phenomenon.
The Broken Causal Chain: From Observer Expectations and Preferences to Older Workers’ Reports of Discriminatory Constraints
The link between employers’, supervisors’, and co-workers’ self-reported age-related preferences (attitudes, prejudices) and expectations (stereotypes) and their behaviors (discrimination) that constrain outcomes for older workers. The causal chain that produces discrimination is incomplete because these observers report their thoughts and feelings (their beliefs, stereotypes, emotions, and prejudices), but only the targets report behavior (discrimination). All of the links in the chain need to be documented: from reports of the evaluators to those of the evaluated, as well as differences in the treatment or evaluation of older workers that are not viewable to the target of discrimination.
Self-reported Experiences of Workplace Age Discrimination and Well-Being
Psychometrically validated scales have documented older workers’ reports of discrimination, showing that they covary with job dissatisfaction and poor health; however, the evidence of causality awaits better research designs. Longitudinal studies would help; converging reports and data collected in the same workplace would help.
Stereotype Accuracy
Measures of worker “age,” worker character, job factors, and performance measures all matter to the analysis of the accuracy of stereotypes regarding older worker performance. New research needs to acknowledge these complex relationships.
Age Profiles and Firm-level Productivity
Measuring productivity is complicated and new work needs to create unbiased data and to filter the age effect out of many other determinants of day-to-day productivity. Most of the existing research has occurred within other countries; there are no up-to-date company studies conducted within the United States.
Stereotypes about Older Workers Affect Demand
The best evidence establishing age discrimination comes from the rarely conducted audit study, which shows discrimination against older workers. Not only do these results need replication, but more detail is needed to outline the processes that are involved in generating these discriminatory practices, in order to document mediators, moderators, and possible points of intervention.
This page intentionally left blank.


