
3
Existing Recreational Fisheries Surveys and ACL-Based Fisheries Management
The aim of this chapter is to provide background on the network of the Marine Recreational Information Program (MRIP) and state-sponsored recreational fishing surveys and data collection programs, and how the combination of these data-gathering efforts is currently used at the regional and state levels to support in-season management. Chapter 4 explores potential improvements to the data collection designs and methods and extensions to current statistical methods that could enhance MRIP’s contribution to in-season management.
CRITERIA FOR RECREATIONAL FISHING SAMPLE SURVEYS OR CENSUSES
Four key criteria are highly relevant when considering the use of MRIP and other recreational fishing sample surveys or censuses for in-season management of fisheries with annual catch limits (ACLs): (1) the total error of the estimates; (2) timeliness, or the time lapse between the actual fishing activity and availability of estimates; (3) the flexibility of design, methods, and processes to adapt a survey’s or census’s data for uses outside of its initial intent; and (4) the direct and indirect costs of expanding or changing the data collection program.
Total Error of Estimate
The total error of an estimate is defined as the difference between the value of the estimate and the “true” population value of the statistic (e.g., total catch for a particular MRIP domain). Total error of an MRIP catch estimate or other survey estimate is a function of the variance (precision) and bias of the estimate, which are inherent in the sampling design, the sampling frame, the data collection method, the data processing method, and the estimation procedure (Biemer, 2010; Groves et al., 2009). In theory, the total error of an estimate is quantified as the mean squared error (MSE): MSE(![]() ) = Var(
) = Var(![]() ) = Bias(
) = Bias(![]() ). In practice, the “measurable” probability sample survey designs employed in MRIP and other, MRIP-certified programs enable estimation of the variance component of the MSE directly from the sample data. However, except in extremely rare cases where true population values are known or can be derived from external sources, the bias component of total
). In practice, the “measurable” probability sample survey designs employed in MRIP and other, MRIP-certified programs enable estimation of the variance component of the MSE directly from the sample data. However, except in extremely rare cases where true population values are known or can be derived from external sources, the bias component of total
error for a survey cannot be measured directly. Furthermore, although statistics computed from a complete census of the target population (i.e., mandatory logbook program) should in theory be free of sampling errors, they are still subject to nonsampling errors (i.e., response variance, coverage bias, nonresponse bias, and reported errors).
For MRIP, the variability of an estimate is indicated by percent standard error (PSE):
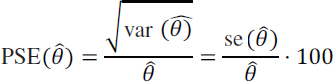
where:
θ = the true value of a population statistic
![]() = an estimate of θ obtained from a single sample of data
= an estimate of θ obtained from a single sample of data
var(![]() ) = the variance of (
) = the variance of (![]() )
)
se(![]() ) = the standard error of (
) = the standard error of (![]() )
)
Throughout this chapter and the balance of this report, the term “precision” is also used to describe the variability of the sample estimates. PSE and precision are inversely related: an estimate with large variability has a large PSE but low precision. The precision of MRIP estimates is a function of a number of “controllable” features of the sample design and sample selection: the survey sample size; the complexity of the sample design (i.e., multiple-stage, clustering of observations); and the efficiency of the sample stratification. The choice of the estimator for a population statistic such as total recreational catch of a species (see below) also determines the precision of estimates. In addition to sample design features and estimator choice, the precision of sample estimates is influenced by variability in the weighting factors used in estimation to compensate for potential bias due to sample noncoverage, nonresponse, or reporting errors (see below).
MRIP sample design and variance estimation methodology are described in detail by Papacostas and Foster (2018). A review of that document, as well as the National Academies report on the MRIP program and methods (NASEM, 2017) confirms that MRIP is using robust, scientifically correct methods to estimate the precision of estimates generated from data collected in its multiple survey and logbook inputs. The 2017 National Academies report does include the recommendation that MRIP explore the use of replicated variance estimators that better capture the impacts of nonresponse weighting and poststratification or calibration on the precision of estimates. That remains a valid but not essential recommendation for the program.
The general term “accuracy” refers to the degree to which bias is absent from a statistical estimate (i.e., low bias indicates high accuracy). The bias of a survey estimate or census value is the difference between the expected value of the survey estimate and the true value of the statistic in the target population.
![]()
where:
θ = the true value of a population statistic
![]() = an estimate of θ obtained from a single sample of data
= an estimate of θ obtained from a single sample of data
E(![]() ) = the statistical expectation (mean value) of the estimate over the sampling design (i.e., the long-term average of the estimate of θ when the sampling process is repeated a large number of times based on the sampling design)
) = the statistical expectation (mean value) of the estimate over the sampling design (i.e., the long-term average of the estimate of θ when the sampling process is repeated a large number of times based on the sampling design)
Throughout this chapter and the balance of the report, this definition of bias is used in discussing accuracy, keeping in mind that low bias indicates high accuracy. Under MRIP’s design-based approach to estimation, the statistical expectation or expected value of an estimate, E(![]() ), is the mean value that would be obtained if the exact same sample design, data collection, data processing, and estimation procedures were independently replicated an infinite number of times. E(
), is the mean value that would be obtained if the exact same sample design, data collection, data processing, and estimation procedures were independently replicated an infinite number of times. E(![]() ) would be the average of the individual estimates,
) would be the average of the individual estimates, ![]() , from each sample in that infinite series. Given that the true population value to be estimated, θ, is not known, and few if any surveys (including MRIP) have the luxury of employing large numbers of simultaneous independent replications even to estimate E(
, from each sample in that infinite series. Given that the true population value to be estimated, θ, is not known, and few if any surveys (including MRIP) have the luxury of employing large numbers of simultaneous independent replications even to estimate E(![]() ), the true bias of estimates can rarely be exactly quantified. Instead, MRIP, MRIP-certified survey programs, and scientifically sound survey programs in general strive to employ statistical methods and procedures that are designed to minimize or eliminate bias in estimates. At the sample design stage, MRIP employs probability sampling to eliminate bias in sample selection and model-based calibration along with other weighting adjustments to minimize estimation bias due to frame undercoverage and survey nonresponse.
), the true bias of estimates can rarely be exactly quantified. Instead, MRIP, MRIP-certified survey programs, and scientifically sound survey programs in general strive to employ statistical methods and procedures that are designed to minimize or eliminate bias in estimates. At the sample design stage, MRIP employs probability sampling to eliminate bias in sample selection and model-based calibration along with other weighting adjustments to minimize estimation bias due to frame undercoverage and survey nonresponse.
Under the total survey error model (Groves, 1989), potential sources of bias in MRIP estimates may arise from three major sources: sample frame coverage bias, nonresponse or noncooperation bias, and measurement error. Most sources of potential bias in the MRIP data that are recognized by the MRIP program (Papacostas and Foster, 2018) and the 2017 National Academies peer review of the MRIP program (NASEM, 2017) are listed in Table 3.1 along with a brief description of any current methods used by MRIP to attenuate or eliminate the potential bias.
From reviewing the entries in Table 3.1, it is clear that, like all major statistical programs, MRIP faces many challenges in its efforts to eliminate or attenuate potential biases in its data that could result in bias for final estimates. While MRIP employs many best practices in its attempts to compensate for coverage, nonresponse, and measurement error, the potential for some bias remains. The most important of these concerns are identified in the National Academies report (NASEM, 2017). The January 2021 advent of the mandatory Southeast Region For-Hire Electronic Reporting (SEFHIER) program in the South Atlantic and Gulf Regions and the almost complete transition to electronic reporting for all major for-hire logbook programs (Vessel Trip Reporting [VTR], South Carolina Logbook program, Southeast Region Headboat Survey, SEFHIER—see below) has certainly improved the sample coverage of the for-hire sector and reduced reporting delays and increased reporting accuracy for this MRIP “fishing mode” domain. Likewise, introduction of electronic recording in the MRIP Access Point Angler Intercept Survey (APAIS) should reduce the potential for biases that can enter the data capture and data processing phases of the survey process. From the many entries listed in Table 3.1, there are two areas of bias reduction that warrant continuing high priority in MRIP methodological research:
- validation of measurement strategy to better quantify the rate of discarded fish by all angling modes; and
- continued research on the potential for nonignorable nonresponse bias in the Fishing Effort Survey (FES), both that which can be corrected through the use of auxiliary variables (i.e., MAR [missing at random]) and that which cannot be corrected (i.e., MNAR [missing not at random]) through weighting and calibration using fully measured covariates, an example being nonrepsonse bias, in which anglers with a greater number of trips report at a higher rate relative to occasional or infrequent anglers.
TABLE 3.1 Potential Sources of Bias in MRIP’s Data and Methods for Attenuating or Eliminating Major Biases in Its Estimates of Catch per Unit Effort, Effort, and Total Catch
| Type of Bias | Source | MRIP Components Impacted | MRIP Compensation Strategy |
|---|---|---|---|
| Sample frame coverage | Noncovered public-access and shore fishing sites | APAIS | MRIP works with its regional and state partners to continuously update the sample frame of public-access points. |
| Noncovered private marinas, launches, and fishing sites. | APAIS | MRIP assumes that catch per unit effort (CPUE) for fishing trips from private-access sites is equal to that for covered public-access sites on the sample frame. | |
| Noncovered for-hire vessels | FHS (in combination with logbook programs VTR, SEFHIER, and Southeast Region Headboat Survey) | APAIS intercept sampling provides data to adjust estimates for trips by for-hire vessels not covered by FHS, SEFHIER, or VTR. | |
| Noncovered trips by out-of-state anglers (noncoastal states) | FES | APAIS intercept sampling provides data with which to adjust FES survey estimates for trips by residents of noncoastal states. | |
| Nonresponse, noncooperation | Dockside intercept non-observation due to refusal,a high traffic volume, or staff scheduling issues | APAIS | APAIS staff record the number of nonsampled trips in the count of total trips at a survey site. Adjustment is made using weights based on inverse of local completion rates at the PSU and sample trip levels. |
| Mail survey nonresponse | FES | MRIP uses Dillman Tailored Design Method mail survey nonresponse follow-up (Dillman et al., 2014). | |
| Model-based nonresponse weighting adjustment is used to adjust for final nonresponse. | |||
| The National Academies report (NASEM, 2017) proposes special annual nonresponse followup studies focused on selective nonresponse due to angler avidity and other characteristics.b |
| Type of Bias | Source | MRIP Components Impacted | MRIP Compensation Strategy |
|---|---|---|---|
| Telephone survey nonresponse | FHS | MRIP uses nonresponse follow-up of initial nonrespondents, model-based nonresponse weighting adjustment for final nonresponse, and dockside validation samples. | |
| Logbook noncooperation, delayed reporting | VTR, SEFHIER, Southeast Region Headboat Survey | MRIP uses follow-up of noncompliant vessel operators and permit holders, and adjustment to estimation weights to account for residual nonresponse. | |
| Structural missing data on fishing location for reported trips | FES | Data from the APAIS intercept survey are used to allocate FES trips to three categories of fishing location. | |
| Measurement error | Misclassification of species, fishing location | APAIS | MRIP uses training and certification of MRIP intercept survey field staff. |
| Underreporting of released/discarded fish | APAIS | MRIP uses on-board observation for a special APAIS sample of for-hire vessels. There are no current validation data for private boat and shore anglers. | |
| Recall bias—incorrect recall of numbers, dates, locations, and modes of angler trips by household members | FES | Research is conducted on the effect of the length of the recall period. Measurement issues are recognized in design of survey materials and question items. | |
| Recall bias, incorrect reporting | FHS | MRIP uses an FHS dockside validation survey for a subsample of each week’s sample of for-hire vessels. VTR or SEFHIER logbook reports are used for FHS vessels covered under one of these logbook programs. |
NOTE: APAIS = Access Point Angler Intercept Survey; CPUE = catch per unit of effort; FES = Fishing Effort Survey; FHS = For-Hire Survey; LPS = Large Pelagic Survey (LPS); MRIP = Marine Recreational Information Program; SEFHIER = Southeast Region For-Hire Electronic Reporting Program; VTR = Northeast Vessel Trip Reporting (VTR) program.
a In APAIS, “unsampled fishing trips occur … when anglers refuse to be interviewed” (Papacostas and Foster, 2018, p. 15). Non-random refusal (e.g., response propensity correlated with CPUE) is a possible source of nonresponse bias in APAIS estimates of CPUE (Bethlehem et al., 2011, pp. 43–45).
b For example, nonresponse bias in FES estimates of total trips could occur due to correlation between an angler’s response propensity and the angler’s number of fishing trips (Bethlehem et al., 2011, pp. 43–45).
Timeliness
Timeliness refers to the length of time between an event of interest (in the present context, actual fishing activity) and the availability of survey estimates related to the event (e.g., estimates of total catch). The shorter the length of time between the event and the estimate, the better is the timeliness. Timeliness is governed by the primary aims of the survey program, the complexity of the survey design, and the procedures and time required for data cleaning, data processing, estimation, and quality assurance/quality control functions that must occur after the survey data are collected.
Timeliness is of key importance if recreational fishing survey estimates are to be used effectively for in-season management. MRIP currently targets the release of preliminary estimates 45 days after the close of each 2-month data collection wave (e.g., estimates are released on August 15 for the May–June data collection wave).
Although none of the current survey or mandatory logbook programs that contribute to the bi-monthly MRIP estimates can deliver the required data inputs in real time, it may be possible to reduce the time lapse between actual fishing activity and access to data needed for estimation to less than a month, maybe less than 2–3 weeks, through the use of weekly sampling/reporting and electronic data capture and transfer. Presently, a primary factor limiting significant improvement in the timeliness of release of MRIP estimates is the bi-monthly FES (see below) which is the source of MRIP fishing effort (E) data for private boat and shoreline anglers.
In a report by Saltz et al. (2011), the MRIP team addressed the issue of more timely release of MRIP recreational fishery data. The findings of that report and any new developments that might lead to more timely release of MRIP estimates and data for purposes of in-season management are covered in more detail in Chapter 4 of this report.
Flexibility
The flexibility of a survey design denotes its ability to be adapted for uses outside of its initial intent. Given the charge to the committee, a key question is whether the current MRIP design and procedures are flexible enough to support, directly or indirectly, existing needs for in-season management of recreational fisheries. Chapter 4 examines how MRIP in combination with external data sources and new statistical methodology can better adapt to the specialized needs of fisheries scientists and managers charged with the responsibility for in-season management under ACLs.
Cost
The committee’s charge does not explicitly include assessment of the costs of the current MRIP program or how financial support for the program might be allocated to improve MRIP’s contribution to meeting the data challenges of in-season management. Nevertheless, it is not possible to evaluate new procedures or alternative statistical methods without some consideration of the financial cost involved. For example, one clear solution for achieving greater substate spatial resolution for bi-monthly survey estimates would be to substantially increase the size of the weekly APAIS intercept samples. In fact, states can use state funds to increase the basic APAIS sample size to improve the precision of catch per unit effort (CPUE) estimates for locations and time periods of high fishing intensity or special management interest.
MRIP OVERVIEW
As described below, the data collection, statistical aggregation, and reporting of marine recreational survey data and estimates of total catch vary across regions and even by state within a
region. MRIP is the direct source of the National Oceanic and Atmospheric Administration (NOAA) National Fisheries Management Service’s (NOAA Fisheries’) recreational marine fishery catch estimates for federally managed species in four of the seven regions established under the Magnuson-Stevens Fishery Conservation and Management Act (MSA): North Atlantic (Connecticut, Maine, Massachusetts, New Hampshire, and Rhode Island); Mid-Atlantic (Delaware, Maryland, New Jersey, New York, and Virginia); South Atlantic (East Florida, Georgia, North Carolina, and South Carolina), and Gulf of Mexico (Alabama, Mississippi, and West Florida) (Papacostas and Foster, 2018). In the Gulf region, the Louisiana state-managed, MRIP-certified LA Creel survey program receives MRIP support but has delegated direct responsibility for collecting the necessary catch and effort data and producing bi-monthly and annual estimates of total catch. Texas runs its own program of recreational marine fisheries data collection and estimation that is independent of MRIP (NOAA Fisheries, 2014; Papacostas and Foster, 2018).
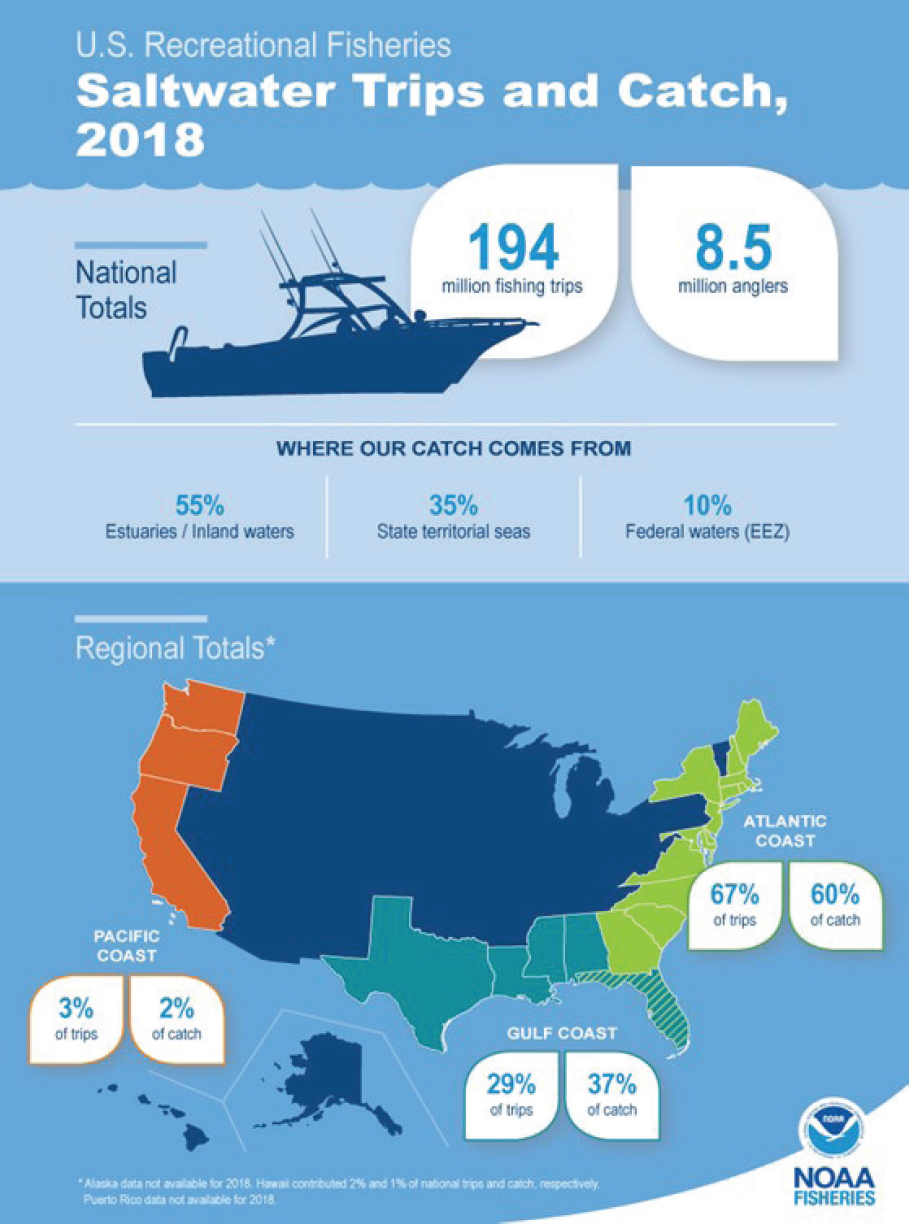
If measured by miles of coastline for U.S. states and territories, the fraction of fishable marine water that is covered by the MRIP surveys and catch estimates is far from complete. However, in terms of total numbers of recreational fishing trips or total recreational catch, the MRIP surveys and the data they generate cover more than 95 percent of all U.S. marine recreational fishing trips and catch (see Figure 3.1). Of the estimated 194,000,000 angler trips in 2018, the Atlantic Coast and Gulf Coast accounted for an estimated 96 percent (97 percent of catch in number of fish landed) (NMFS, 2020).
Recreational catch data and estimates for the Pacific (California, Oregon, and Washington) are the responsibility of the states and the Recreational Fisheries Information Network (RecFIN) program of the Pacific States Marine Fisheries Commission (PSMFC). These surveys are included in this study because they receive annual funding from MRIP, and the data are used for PSMFC management. The Alaska Department of Fish and Game (ADF&G) manages its own survey data collection programs and disseminates estimates through the Alaska Fisheries Information Network. The data collection and estimation methodologies employed by these four mainland Pacific states are in various stages of MRIP certification and consequently are eligible for MRIP financial and technical support. MRIP regional partners in Hawaii are in the process of transitioning to a revised survey design, and MRIP certification is part of the plan for the new survey program that will cover the recreational fishery in Hawaiian waters. In the Western Pacific, regional partners in the U.S. territories (American Samoa, Guam, and the Commonwealth of the Northern Mariana Islands) are working with MRIP consultants to review their current recreational fishery survey designs.
MRIP is a state–regional–federal partnership that develops, improves, and coordinates a network of regional recreational fishing data programs (NASEM, 2017). MRIP is a NOAA program that is charged with producing the recreational harvest data mandated by the MSA (discussed further in Chapter 2). The program supports science-based decision making in fisheries management that is part of the larger, general call of the Information Quality Act1 to maximize the quality, objectivity, utility, and integrity of information (including statistical information) disseminated by federal agencies. As required under the MFA, the MRIP program also funds research projects designed to evaluate new technologies and methods (e.g., electronic reporting methods) and supports the evolving data needs of fisheries managers.
MRIP is a network or collection of surveys including the APAIS and the FES. The precision of MRIP surveys is indicated by PSE, discussed earlier, and is generally influenced by such factors as sample size, spatiotemporal scale, and rare-event versus common species. For instance, in a presentation to this committee, MRIP staff showed estimates of catch and associated PSEs at different spatiotemporal scales to make the point that annual estimates produced by MRIP are typically better than those derived from single waves, and regional estimates are better than state estimates.
___________________
1 Pub. L. No. 106-554 § 515(a).
SOURCE: NOAA Fisheries, 2020; see https://www.fisheries.noaa.gov/feature-story/fisheries-united-states-2018.
MRIP Organization and Regional Partnerships
Figure 3.2 illustrates the organizational structure of MRIP, including its Executive Steering Committee; senior leadership (Program and Business Management); and technical/operational teams that support federal-level survey operations, research and evaluation, and education/communications. Key features of the third tier in this organizational chart are the MRIP Regional Implementation Teams and the Regional Implementation Team Council (NOAA Fisheries, 2021). MRIP established the Regional Implementation Teams to develop MRIP Regional Implementation Plans that identify regional needs for catch and effort data, and to identify, prioritize, and provide cost estimates for desired additions and improvements to regional data collection programs. The established regional Fishery Information Networks (FINs) host the MRIP Regional Implementation Teams for the Atlantic, Pacific, and Gulf of Mexico regions via the Atlantic Coastal Cooperative Statistics Program (ACCSP), the Gulf Fisheries Information Network (GulfFIN), and the Pacific RecFIN, respectively. Ad hoc Regional Implementation Teams have been established to develop MRIP Regional Implementation Plans for the Caribbean, the Pacific Islands, and Alaska and for Atlantic highly migratory species. In all cases, the teams are set up to include representatives from, at a minimum, the NOAA Fisheries Office of Science and Technology; the applicable NOAA Fisheries Regional Office and Fisheries Science Center; and the applicable Interstate Marine Fisheries
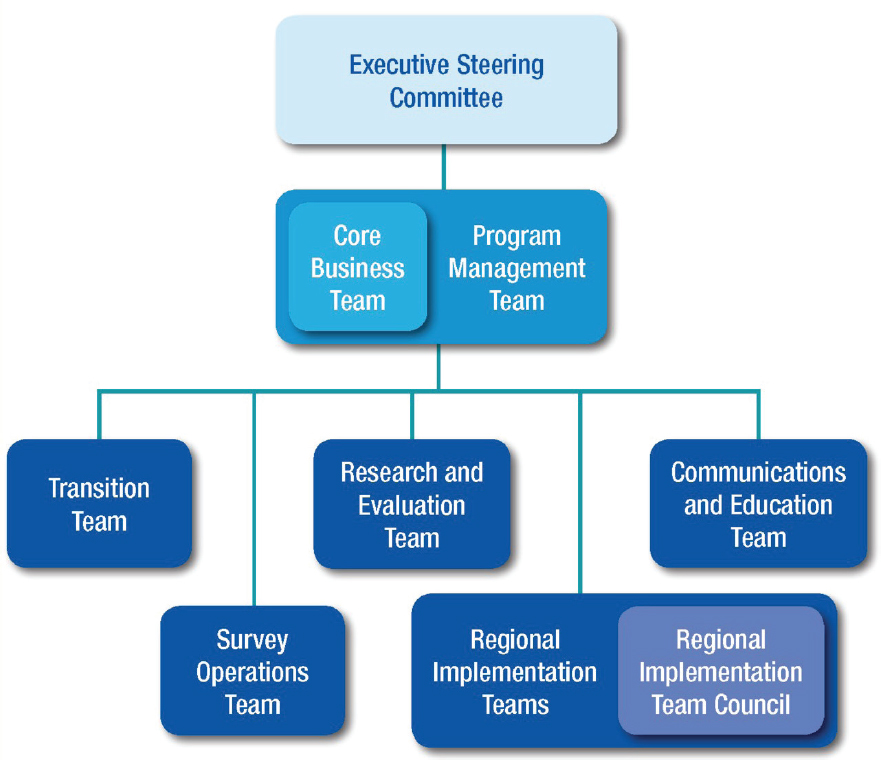
SOURCE: NOAA Fisheries, 2021.
Commission and members or, in the absence of an Interstate Commission, representatives of state and territorial governments; the applicable Regional Fishery Management Council (Council). To support the Regional Implementation Teams and to facilitate their communications with the MRIP Executive Steering Committee and Program Management Team, an MRIP Regional Implementation Council is established, composed of representatives of each Regional Implementation Team, usually the FIN program manager or the chair of the Ad Hoc Team.
From an operational, survey implementation perspective, these regionally oriented teams reflect the fact that primary responsibility for many (but not all) MRIP-sponsored data collection activities has been transitioned to its regional partners. These regional partners can in turn assign actual data collections (often APAIS) to state agencies. MRIP has also established a certification process in which individual states, such as Louisiana (LA Creel), receive MRIP funds to support a state-run recreational fishing survey that conforms to MRIP-approved methodological standards but also permits the state to adapt the data collections to unique aspects of the relevant recreational fishery within that state.
MRIP’s collection, processing, and statistical integration of recreational fishery catch and effort data require coordinated contributions from its NOAA Fisheries professional staff, its federal contractors, and its regional and state partners (NASEM, 2017). To understand how this MRIP network of data producers and integrators can contribute to the aims of in-season management of recreational fisheries, one can turn to a description of features of the individual survey programs—the management, scope, sample design, and precision of estimates, and the timeliness of access to the raw data and statistical estimates based on those data.
MRIP Recreational Fishing Survey Coverage
Figure 3.3 illustrates the geographic coverage of the various MRIP and partner survey programs. The survey programs that are managed directly by MRIP through its contractors or NOAA Regional Science Centers include the FES, the For-Hire Survey (FHS), the Northeast VTR program, the Southeast Region Headboat Survey, the SEFHIER program, and the Large Pelagics Survey (LPS). MRIP survey operations staff also maintain the sample frame and sample selection for the APAIS program; however, for most of the Atlantic Coast and Gulf regions, the APAIS data collection is performed by state agency personnel, and the initial data processing is coordinated by Regional Fishery Commission information networks. In the Gulf region, LA Creel is an MRIP-certified state-run survey that substitutes for FES and APAIS data collection for Louisiana recreational fisheries.
Three Gulf states—Mississippi (Tails n’ Scales), Alabama (Snapper Check), and Florida (State Reef Fish Survey)—conduct specialized recreational surveys designed to improve estimation of catch of Red Snapper and other marine reef species. The Texas Parks & Wildlife Department conducts its own recreational Creel Survey, which is not part of MRIP. Puerto Rico recreational marine fisheries are covered by the FES and APAIS programs, but data collection has been suspended since Hurricane Maria, which occurred in September 2017.
On the continental Pacific coast, the MRIP-affiliated RecFIN program coordinates final processing and dissemination of catch estimates for California, Oregon, and Washington. With partial MRIP support, each of these states fields its own recreational fishing survey programs: California Recreational Fisheries Surveys, Oregon Ocean Recreational Boat and Shore/Estuary Boat Surveys, and Washington Ocean and Puget Sound Sampling Programs. The State of Alaska manages its own Saltwater Logbook program, an annual Statewide Harvest Survey, and special Southeast Alaska dockside intercept surveys each August and September to support its data needs for fishery stock assessment and limited in-season management (Chinook Salmon in Southeast Alaska). Though the State of Alaska currently receives no MRIP funding for its surveys, associated data are used for North Pacific Fishery Management Council management.
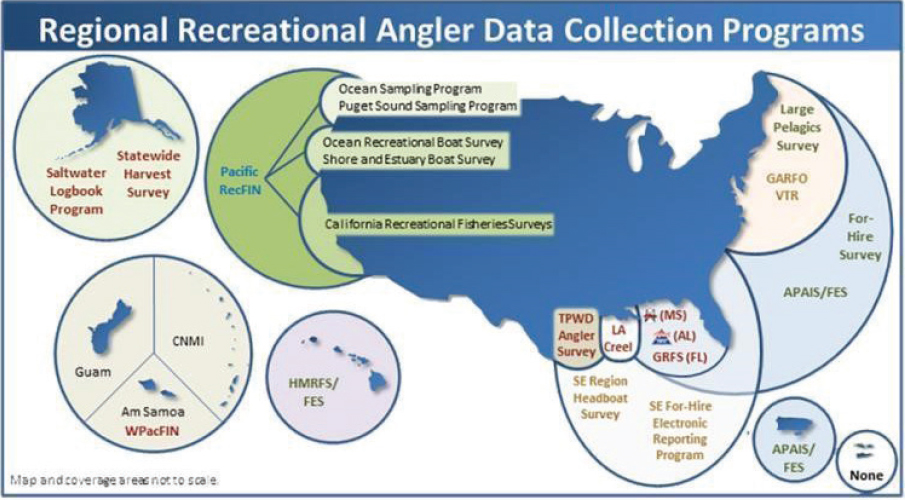
NOTE: Hawai’i Marine Recreational Fishing Survey (HMRFS). Commonwealth of the Northern Mariana Islands (CNMI). NOAA Fisheries Greater Atlantic Regional Fisheries Office (GARFO). Mississippi (MS). Louisiana (LA). Alabama (AL). Gulf Reef Fish Survey (GRFS). Access Point Angler Intercept Survey (APAIS). Fishing Effort Survey (FES). Vessel Trip Reporting Program (VTR). Pacific Recreational Fisheries Information Network (Pacific RecFIN). Western Pacific Fishery Information Network (WPacFIN).
SOURCE: NOAA Fisheries, 2014.
In Hawaii, recreational catch and effort data are collected through the Hawaii Marine Recreational Fishing Survey angler intercepts and the MRIP FES programs. The Western Pacific Fisheries Information Network (WPacFIN) assembles and distributes data for the U.S. territories of American Samoa, Guam, and the Commonwealth of the Northern Mariana Islands.
The following subsections describe key features of each of the survey programs managed by MRIP and MRIP partners, including the major state supplemental programs. The descriptions of each of these programs focus on features that bear most directly on the utility of the data for inseason management and monitoring of recreational catch: timeliness of access to the data, accuracy (coverage biases and reporting bias corrections), precision of estimates (if sample-based), and spatial or other resolution of fishing effort and catch.
MRIP: Access Point Angler Intercept Survey
A detailed description of the APAIS program and its components is found in Papacostas and Foster (2018). APAIS involves intercept interviews at public-access fishing sites and is designed to estimate catch rates and trip characteristics. APAIS uses a stratified, clustered multistage design. The APAIS primary sampling unit (PSU) is a site cluster-day-time interval. PSU sampling probability is based on fishing intensity, with high-traffic fishing sites having a higher probability of selection. The sample frame for APAIS is centrally administered by the MRIP Survey Operations Team and includes publicly accessible locations (i.e., shore-based sites, piers, marinas, boat launches) that are established sites where recreational fishing occurs or to which recreational fishing boats will
return after a trip. Individual states may supplement the basic regional MRIP samples to increase the precision of estimates of catch for selected species or substate geographic domains. As of March 2021, all APAIS intercept data on recreational catch for the Atlantic Coastal and Gulf Coast regions were captured electronically, making raw data potentially available within a short period of time after the actual intercept sampling has taken place. Note that the APAIS intercept interviews also provide information on nonresident angler trips that are not covered by the FES sample frame or charter/guided trips not covered by the permit frame for the FHS. These data are used in turn to develop weighting adjustments that are applied to estimation of total fishing effort (trips) from the FES mail and FHS telephone surveys (Papacostas and Foster, 2018).
MRIP: Fishing Effort Survey
The FES is a self-administered, address-based mail survey used to estimate private boat and shore-mode fishing effort (trip) estimates for in-state resident anglers. The FES is conducted annually in six 2-month waves. The survey is focused on coastal states and stratified by coastal versus noncoastal county and whether or not fishing licenses are matched with addresses. From January through December (Waves 1–6), the FES is administered in North Carolina, Florida, Alabama, Mississippi, and Hawaii. All other states—with the exception of Maine—are sampled from March through December (Waves 2–6); Maine is sampled from May through October (Waves 3–5). The FES has been administered in Puerto Rico, but MRIP data collection efforts have been suspended in this region as the territory rebuilds following Hurricane Maria in 2017.
Sample selection is a simple random sampling of households in each stratum (Papacostas and Foster, 2018). The survey approach involves three mailings (Dillman et al., 2014): an initial mailing of all survey materials, a reminder postcard 1 week later, and a follow-up survey 3 weeks later.
MRIP Headboat and For-Hire Surveys
MRIP estimates of recreational marine fisheries catch and effort include domain-specific estimates defined by year, wave, region, state, fishing mode (for-hire, private vessel, shoreline), area fished (inshore, state ocean waters, or federal ocean waters), species, and catch type (harvested, released). Estimation of recreational catch by the for-hire mode is supported by special surveys and data collections that either are distinct from or supplement data collected with the standard probability sample methodologies used in the MRIP APAIS (catch) and FES (effort) surveys. The for-hire sector includes both recreational charter fishing and headboat excursions—the latter often defined as larger party boat or charter operations that routinely take more than six paid customers per outing.
The fraction of total annual recreational catch that can be attributed to the for-hire domain is highly variable across many of the other MRIP temporal, geographic, and species-specific reporting domains. Table 3.2, originally published in a 2016 ACCSP report, highlights the variability in the 2014 for-hire proportion of total recreational catch for selected species in the Mid-Atlantic region. Anglers on headboats and charter boats accounted for an estimated 54 percent of the 2014 Black Sea Bass landings in that region. That same year, the for-hire domain accounted for a much smaller 17.7 percent of Black Sea Bass landings in the North Atlantic region. The for-hire proportion of 2014 landings for Bluefish was similar across the two regions: Mid-Atlantic (15 percent) and North Atlantic (22.7 percent).
As illustrated in Figure 3.3, MRIP catch and effort data for the for-hire domain are currently obtained from multiple data collection programs, including (clockwise from the Northeast to Alaska), the VTR, the FHS, the Southeast Headboat Survey, the California Recreational Fisheries Survey, the Oregon Recreational Boat Survey (ORBS), the Washington Ocean Sampling Program
TABLE 3.2 Percent of 2014 Mid-Atlantic Region Landings (Fish Harvested) of Top Five Species by Charter and Guide Boat Anglers
| Species | For-Hire Harvest | Private Harvest | Percent Landed by For-Hire |
|---|---|---|---|
| Black Sea Bass | 542,039 | 456,482 | 54 |
| Atlantic Croaker | 472,854 | 4,745,202 | 9 |
| Bluefish | 467,661 | 2,748,567 | 15 |
| Summer Flounder | 415,713 | 1,580,775 | 21 |
| Striped Bass | 384,348 | 904,071 | 30 |
SOURCE: ACCDP, 2016.
and Alaska Saltwater Logbook Program and Statewide Harvest Survey, and the Hawaii Marine Recreational Fishery Survey and data collections of WPacFIN. In addition, MRIP supports the LPS to collect catch and effort data for the highly specialized recreational fisheries for Tuna, Sharks, Swordfish and other Billfishes, and other offshore species. Since January 2021, the SEFHIER program also has been providing catch and effort data for the for-hire domain of the South Atlantic and Gulf region recreational fisheries.
MRIP data collection and catch estimation for the for-hire domains have a comparative advantage over reporting for the private vessel and shoreline domains in the form of many federal and state registration and licensing programs for headboats, charter operators, and fishing guides, as well as the special permitting and registration requirements for vessels targeting highly migratory and other federally managed species. With limited exceptions, MRIP and its partners obtain effort data directly from mandatory logbook programs or high-intensity sample surveys and interviews with for-hire headboats, charter boats, and guide operators. Some but not all programs also perform on-site validation surveys to establish the accuracy of logbook self-reports or reports from telephone surveys. On the Atlantic Coast, region-level CPUE data for the for-hire domains are obtained through the MRIP APAIS dockside intercept sampling for charter boats and special headboat “at-sea” observations. Various Atlantic Coast states (Massachusetts, Rhode Island, Delaware, Virginia, and North Carolina) supplement the MRIP APAIS sampling with additional sampling to achieve greater precision for catch estimates. In the Pacific Region and Alaska, mandatory logbooks, at-sea observations, and dockside sampling generally combine the collection of effort and catch data. Possibly the most developed of the joint effort/catch data collections may be the Alaska Saltwater Sportfishing Logbook (see below).2
MRIP reports catch estimates by state, fishing mode, and species for bi-monthly waves. Typically, MRIP estimates for the for-hire and other domains are published 45 days after the close of a wave (e.g., August 15 for the May–June 2-month wave). However, most MRIP and state programs that collect data on the for-hire domain are organized around weekly samples or weekly/daily logbook reporting. Individual state partners to the MRIP program often have access to their for-hire effort as well as effort and catch data within a week after trips occurred, and estimates can be available to state and regional managers with as brief as a 1- to 2-week lag. The committee heard from several state managers responsible for specific Pacific region fish stocks that they reviewed incoming catch and effort data on a daily basis or after a weekend of high fishing effort.
MRIP bi-monthly estimates and annual estimates of recreational catch are based on inputs from multiple population frames and multiple data collection or logbook reporting programs. There
___________________
2 See https://www.adfg.alaska.gov/index.cfm?adfg=SFGuidesLicense.Logbook.
is consistent support from individual experts (Donaldson et al., 2013) and cooperative programs, such as the ACCSP (2017), for a comprehensive approach to for-hire data collection. These same publications also call for improvements in the data collected on selective or required discards/returns by for-hire fishers, as well as methodology to validate the accuracy of other self-reported data obtained through logbooks or other mandatory reporting systems. Efforts are under way to develop comprehensive reporting across the for-hire marine recreational fishery based on more standardized logbook/e-logbook reporting (ACCSP, 2017; Brick, 2018; NASEM, 2020; NOAA Fisheries, 2019a,b).
As noted above, data inputs to MRIP bi-monthly and annual reporting of recreational catch by the for-hire modes are derived from a patchwork of sources, which in turn must be carefully integrated using established, predominantly design-based statistical estimation methods (Papacostas and Foster, 2018). The following subsections provide summary descriptions of each of the MRIP and MRIP partner programs that contributes data to MRIP reporting of total catch from headboat and charter boat modes. In addition to these MRIP or MRIP-supported/certified partner programs, individual states support independent data collection programs for registered for-hire vessels.
GARFO Vessel Trip Reporting Program
From Maine to North Carolina, the NOAA Fisheries Greater Atlantic Regional Fisheries Office (GARFO) operates the VTR. The VTR program covers approximately 900 headboat and charter fishing vessels that hold federal permits. Under the VTR, all permitted vessel operators must complete daily trip reports and angler effort. The VTR reports are filed weekly, and by November 2021 all VTR reporting was expected to be electronic. Jointly, the VTR and FHS (see below) provide partially overlapping dual-frame coverage of headboats and charter vessels that operate from Maine to North Carolina. Since 2017, MRIP bi-monthly and annual catch estimates have used VTR effort reports for vessels also sampled in the FHS telephone survey; the VTR can provide coverage of fishing trips by for-hire vessels that are not covered in the FHS telephone survey frame. The VTR does not provide coverage of charter and guide boat operations that fish exclusively in state waters and do not hold a permit to fish in federally managed waters. Effort data for these state-only for-hire operations are surveyed in the FHS or covered by state-managed logbook programs, such as the Maryland Charter Fisheries Logbook program or South Carolina Department of Natural Resources Charter Logbook initiative.
The MRIP For-Hire Survey
Along the Atlantic Coast and the Gulf Coast of Florida, Alabama, and Mississippi, MRIP and its state partners operate the FHS. The universe for the FHS includes all for-hire charter vessels and private guides regardless of whether they fish in federal or state waters (or both). The sample frame for the FHS is developed and maintained for MRIP by state partners. It is compiled by integrating federal and state permit and licensing databases covering charter boats and guide boat operators, and verifying that the permitted vessel is active (i.e., actively offering for-hire trips) before they are included in the frame. New vessels are also added to the frame when they are discovered during dockside intercepts or through local and web-based advertising. Stratified samples are selected weekly from the sample frame, and the designated vessel representative is contacted by telephone by a state representative. Each telephone interview collects effort data on trips (number of anglers, hours spent fishing, and species targeted) taken during a 1-week reporting period. MRIP summarizes the data from the FHS weekly samples and rolls the weekly data into the standard bi-monthly and annual reports. As noted above, for the Mid-Atlantic and New England regions, if a sample FHS vessel is also a mandated VTR reporter, the VTR effort data are used in lieu of the FHS report for
that vessel. In the South Atlantic and Gulf regions, sample frames for the FHS and the Southeast Region Headboat Survey (SRHS; see below) are separate and do not overlap; thus the two surveys are independent.
The Southeast Region Headboat Survey
The SRHS is a long-standing program of the NOAA Southeast Fisheries Science Center. The survey has operated along the Southeast U.S. Atlantic since 1972 and in the Gulf of Mexico since 1986. The geographic coverage of the SRHS spans the South Atlantic and Gulf Coast from North Carolina to Texas. The universe for the SRHS includes approximately 1,650 headboats that are federally licensed to target offshore reef fish. Since 2013, all headboats in this region holding these federal permits have been required to file weekly e-logbook reports that include daily summaries of number of anglers, catch by species, and other data elements. To adjust for underreporting of trips in the e-logbook filings, port agents also record data on trips taken by headboats included in the SRHS population. The catch and effort data collected through the SRHS program are integrated with the FHS effort data and the APAIS intercept and at-sea sampling programs to produce MRIP bi-monthly and annual estimates of catch.
Southeast Atlantic For-Hire Electronic Reporting Program
NOAA Fisheries launched the SEFHIER (“Sea Fire”) program in early January 2021. The purpose of this expanded electronic reporting program is to provide more accurate and reliable fisheries information about for-hire catch, effort, and discards. Under SEFHIER, all federal Gulf reef fish and/or coastal migratory pelagic charter and headboat permit holders and all federal South Atlantic Snapper-Grouper, Atlantic coast migratory pelagics, and Atlantic Dolphin Wahoo charter/headboat permit holders are required to report fishing effort and landings electronically. Permit holders file electronic reports for each permitted vessel using one of two approved applications: eTrips/mobile2 or VESL.
Permit holders in the South Atlantic region are required to file trip-level reports once each week. Reports from South Atlantic region permit holders are due each Tuesday following the Monday–Sunday fishing week covered by the report. Reporting for Gulf region permit holders is virtually in real time. Each trip must be declared electronically before leaving the dock or launch, and the final report of catch and effort must be filed before any retained fish are offloaded upon return from a trip.
Currently, the SEFHIER program allows headboats that are included in the SRHS to continue to use their VESL reporting application to file trip reports. Likewise, for-hire vessels with a South Carolina charter fishing vessel license can meet SEFHIER requirements by continuing to report weekly to the South Carolina for-hire logbook program. In both cases, a duplicate SEFHIER report is not required.
MRIP Large Pelagics Survey and NOAA Highly Migratory Species Reporting Programs
Originating in 1992, from Maine to Virginia, MRIP also conducts the LPS—a specialized program designed to support the information needs of stock assessment and fishery management for pelagic fishes including Tuna, Billfishes; Swordfish; Sharks; and other pelagic species that are under federal management, such as Wahoo, Dolphin, and Amberjack. The universe of fishing activity covered by the LPS includes vessels that fish for these pelagic species and hold a NOAA
Fisheries HMS permit.3 This includes both permitted private boat fishing activity and permits issued to charter and headboat operators. The LPS programs include three components: the Large Pelagics Intercept Survey (LPIS), the Large Pelagics Telephone Survey (LPTS), and the Large Pelagics Biological Survey (LPBS). The LPIS and the LPTS contribute to the estimation of total catch for large pelagic species, while the LPBS contributes biological data needed by NOAA scientists for assessing age and growth rates and related information on population health.
The LPIS is an intercept survey, conducted dockside. Captains of returning private and for-hire vessels provide detailed characteristics, including catch information, for the intercepted trip they have just completed. The LPIS on-site direct observations also provide data on catch and effort by vessels that are not covered by the sample frame of permit holders. Approximately 3–5 percent of LPS fishing vessels are sampled each month for the LPIS. The LPTS is a weekly to bi-weekly telephone survey of designated representatives for permitted vessels, sampling and interviewing approximately 3–10 percent of vessel operators on the permit frame during each week of the fishing season. In the LPTS survey, vessel representatives report the number of LPS trips taken during the previous 1- to 2-week period. Design-based, ratio-type (CPUE × E) estimates of total catch and the raw data are produced monthly with a 1-month lag and shared with U.S. and international fishery management partners.
Highly Migratory Species Permit Reporting and Catch Card Report Programs
From Maine to the Gulf of Mexico, headboat and charter boat operators who hold a NOAA HMS permit may also be required to file a report of Swordfish and other billfish and Bluefin Tuna landings and releases within 24 hours of a successful trip. Reports may be filed at a permit office, by a catch reporting app, or using a toll-free number. Permit holders are also required to participate if contacted for the MRIP surveys (FHS, LPTS, LPIS). In addition, the HMS reporting program selects a sample of permit holders to complete a Pelagic Fisheries Vessel Logbook covering catch of all federally managed species. Under the program, LPS vessels may also be sampled, to include an on-board observer on fishing trips.
Maryland has extended the HMS reporting methodology and requires all charter boat and headboat operators to use a catch card or harvest tagging to record and report catch of Bluefin Tuna, Marlin, Swordfish, Sailfish, and federally managed Shark species. In North Carolina, both a catch card and tag are required before an HMS catch can be removed from the vessel.
HMS catch data generated under these NOAA and state-managed programs are available within 1–2 weeks of report filings but are not currently used in producing MRIP bi-monthly or annual catch estimates.
MRIP Certification Process for Specialized and Alternative Surveys
Several states have designed and initiated recreational fishing surveys as alternatives or supplements to MRIP. Four of these surveys—Louisiana’s LA Creel, Mississippi’s Tails n’ Scales, Alabama’s Snapper Check, and Florida’s State Reef Fish Survey—have been certified by NOAA Fisheries, indicating acceptance of their survey designs and estimation methods as scientifically sound and capable of providing the best scientific information available. Additionally, the Pacific RecFIN-administered state surveys are currently in the certification process. The two overarching principles of the certification process are meeting a shared set of standards and undergoing an independent peer review (see Box 3.1).
___________________
3 See https://www.fisheries.noaa.gov/recreational-fishing-data/types-recreational-fishing-surveys#large-pelagics-survey;https://www.fisheries.noaa.gov/atlantic-highly-migratory-species/atlantic-highly-migratory-species-reporting.
Beyond certification, NOAA Fisheries has additional requirements and processes in place for transitioning from MRIP to other surveys, as well as maintaining accountability after transitions. The transition process is overseen by the MRIP Transition Team, which is composed of NOAA and state fisheries agencies, and the process is particularly important for understanding differences between estimates for use in management processes. In some scenarios, the transition process may require benchmarking or calibration. Benchmarking involves conducting side-by-side comparisons of MRIP and another survey to assess the consistency of resulting estimates. Calibration involves converting the historical estimates of MRIP to align with the currency of the new estimates.
Coordination of Specialized and Alternative Surveys
With the increase in specialized and alternative surveys, there is often a need to coordinate surveys or integrate data from multiple surveys for use in stock assessment and management. For instance, estimating the total catch or effort for a region can require integrating the data from multiple surveys with differing methodologies, which can pose a number of challenges. Through the process established by the MRIP Regional Implementation Teams, regional FIN networks, including federal and state partners, have been actively working on identifying and addressing issues involved in survey integration and calibration. However, these topics remain highly salient, as survey integration or calibration is complex and may at times lead to outcomes that are unintuitive to stakeholders.
REGION-BY-REGION SUMMARY OF MANAGEMENT AND SURVEYS
New England
The major recreational fisheries managed by the New England Fishery Management Council include Atlantic Cod, Haddock, Pollock, Winter Flounder, and Atlantic Wolffish. State-managed fisheries include Scup, Black Sea Bass, Tautog, and Weakfish.
Because of the colder climate of New England, MRIP surveys are conducted for only part of the year. APAIS sampling is conducted for Waves 2–6, with the exception of Maine, where only Waves 3–6 are implemented. Massachusetts has funded supplemental MRIP surveys since 2013 that include 400 additional surveys in Waves 3–5. These additional surveys are aimed at improving precision for estimates of Black Sea Bass, Striped Bass, Bluefish, and Summer Flounder.
In-season management is generally not used in New England. Fisheries management agencies from both Rhode Island and Massachusetts expressed reluctance to consider in-season management and identified a variety of common concerns, including data availability, uncertainty, and outreach to anglers as major challenges.
Atlantic
The Atlantic States Marine Fisheries Commission (ASMFC) is responsible for managing 27 species or groups. Several species are managed jointly with regional Councils. In general, ASMFC does not favor in-season adjustments to ACLs and instead promotes stability and multiyear regulations. ASMFC also embraces alternative management strategies, with Striped Bass fisheries being managed with a target fishing rate instead of absolute removals.
Mid-Atlantic
The major recreational fisheries managed by the Mid-Atlantic Fishery Management Council (MAFMC) currently include Summer Flounder, Bluefish, Scup, Black Sea Bass, Atlantic and Chub Mackerel, and Golden and Blueline Tilefish. The first four are managed jointly with the ASMFC, with joint approval of ACLs and most management strategies. Through this management arrangement, bag limits, size limits, and seasons often vary between federal and state waters.
The process for setting ACLs in the Mid-Atlantic region begins in August of the preceding year. Current-year MRIP data through Wave 4 are used to project the full year’s recreational harvest, and projections are then compared with the following year’s harvest limit. Decisions to increase or decrease the overall federal and state harvest limits are made from mid-December at MAFMC and ASMFC meetings through April, when any changes for the following season are implemented. A major challenge for this process is species for which Wave 5 data are particularly important for reducing uncertainty in projections, and there is rarely time to incorporate these data before the December MAFMC and ASMFC meetings.
In-season management is not currently used in federal waters. In fact, the MAFMC’s 2013 Omnibus Recreational Accountability Amendment4 actually removed the ability of the NOAA Fisheries regional administrator to close the recreational fishery in season if recreational harvest was projected to exceed the ACL. An argument in support of this restriction was that in-season closures had a disproportionate negative impact on states with fishing seasons later in the year.
In-season management in state waters is also rare in the Mid-Atlantic region. In-season management has frequently been suggested by recreational fishing stakeholders, particularly for Black
___________________
4 MAFMC Omnibus Recreational Accountability Amendment: https://www.mafmc.org/actions/omnibus-recreational.
Sea Bass and Summer Flounder. However, managers have expressed concerns related to the timing and uncertainty of estimates, as well as the significant investments in staff time required.
South Atlantic
Similar to the Gulf of Mexico, the South Atlantic supports many species in recreational demand. These include multiple species of Snappers and Groupers, as well as Dolphin (Mahi), Wahoo, and King and Spanish Mackerel (which are managed jointly with the Gulf of Mexico). ACLs are set or adjusted in response to a stock assessment rather than through an annual specifications process. Management measures (e.g., size, season, and bag limits) may also be modified at that time to constrain harvest to the ACL or meet management objectives. It should be noted that of the 35 stocks or stock complexes managed under ACLs, half are unassessed; their ACLs are set using approaches based entirely on catch data.
In-season management of ACLs occurs for all but seven stocks in the form of recreational fishery closures if an ACL is approaching its limit or has been met. Between 2017 and 2019, in-season closures were applied eight times across five stocks. However, because of the timing and availability of MRIP data, most closures occurred well after an ACL had been exceeded. All monitored stocks have post-season accountability measures (AMs) that may include adjustments to season length or bag limits the following year and payback of overages if the total combined ACL (recreational and commercial) is exceeded. The South Atlantic Council is considering modifications to recreational AMs to allow more flexibility in management and better align AMs with the precision and timeliness of MRIP data (see Chapter 5 for more detailed information).
States along the South Atlantic have also developed supplemental surveys, but the majority of these efforts are not designed to collect quantitative catch-and-effort data. Florida, where the Florida Reef Fish Survey is conducted, is one exception. The South Atlantic Council has also considered options for private recreational permitting and reporting that might improve existing catch-and-effort data produced by MRIP (see Chapter 5 for more detailed information on these efforts). The Council recently convened a working group that includes both state agency and MRIP representatives specifically to explore approaches to recreational reporting in the region.
The South Carolina Department of Natural Resources (DNR) conducts the South Carolina DNR Charter Logbook program, in which all licensed headboat and charter fishing operations are required to complete daily logbooks covering catch and effort. Licensed operators are required to file their logbook by the 10th of each month, covering all trips taken since the last filing period. Currently, the South Carolina DNR Charter Logbook data are not incorporated into the MRIP bimonthly or annual estimates of catch.
Gulf of Mexico
All five states in the Gulf of Mexico have developed alternative or supplemental surveys to MRIP for estimating recreational fishing effort and catch (see Table 3.3).
Alabama’s Snapper Check requires that private vessel anglers report Red Snapper catches and encourages Greater Amberjack and Triggerfish reporting before fish are landed in that state. In 2018, Alabama’s Snapper Check was certified by MRIP. Snapper Check consists of two complementary components: an electronic reporting system and a dockside access point intercept survey. The information electronically reported by anglers is validated and corrected using information observed through the dockside intercept survey.
In Louisiana, LA Creel has been conducted in place of the MRIP general survey since 2014. LA Creel couples an on-site intercept survey with a telephone survey to estimate total landings of recreational fisheries species. LA Creel’s telephone survey is designed to estimate total effort
TABLE 3.3 Gulf of Mexico Supplemental Surveys for Recreational Catch
| Alabama | Florida | Louisiana | Mississippi | Texas | |
|---|---|---|---|---|---|
| Program | Snapper Check | Florida State Reef Fish Survey | LA Creel | Tails n’ Scales | Texas Parks & Wildlife Creel Survey |
| Metrics | Catch, effort | Catch, effort | Catch, effort | Catch, effort (near census) | Harvest estimates only |
| Mode(s) | Website, mobile app, dockside paper forms, phone call-in (ended in 2017) | Mail, intercept | Intercept, telephone | Trip registration, intercept | Intercept |
| Species/Taxa | Red Snapper (mandatory), Amberjack (optional), Triggerfish (optional) | Reef fish | Multiple state and federal species | Red Snapper | Multiple state and federal species |
| Years | 2014–present (MRIP-certified in 2018) | 2015–present in Gulf; 2020–present in Atlantic | 2014–present | 2015–present | 1974–present |
| Seasonality | Fishing seasons of the species covered | Year-round | Year-round | Private recreational Red Snapper season | Year-round |
| Timelineness (estimate frequency) | Monthly | Weekly | Real time | Twice annually | |
| Cost | $75,000 | $3.0M | $1.9M | $60,000 |
in number of trips, whereas the access point survey estimates harvest rate. Timeliness is a major strength of LA Creel, with estimates produced as frequently as weekly when needed. These estimates are also adaptable and can be produced for various time periods, geographic regions, and fishing modes.
In Texas, the Parks & Wildlife Department has conducted the Texas Parks & Wildlife Creel Survey (TPWCSs) in place of MRIP since 1974. TPWCSs involve on-site intercept interviews at boat access sites throughout the state. Its primary focus is on private boat fishing in state waters, but offshore and for-hire fishing are also included. TPWCSs collects data on harvest but not on discarded fish. TPWCS data collection occurs year-round, but estimates are produced only twice yearly, after the high season (May 15–November 20) and low season (November 21–May 14).
Pacific
The Pacific Council has fishery management plans (FMPs) for Salmon, Groundfish, coastal pelagic species HMS, and ecosystem-based management. Among the species included in the FMPs, only Salmon, Pacific Halibut, and Groundfish are actively managed in season. The Council uses catch estimates provided by each state for in-season management and stock assessments. The state
programs that generate these estimates include the Washington Ocean Sampling Program, Washington Puget Sound Sampling Program, Oregon ORBS, and California Recreational Fisheries Survey. These state sampling programs, administered by RecFIN and partially funded by MRIP, replaced the NOAA Fisheries Marine Recreational Fisheries Statistics Survey (MRFSS) on the Pacific Coast in 2003–2004. The main reason for this change was to support Salmon and Pacific Halibut in-season management, in which estimates are needed on a weekly basis.
Another main difference between these state surveys and the MRIP surveys, besides the short data turnaround, is in how effort surveys are conducted. The on-site effort surveys conducted by the three states are considered a census on each sampling day. The daily census is then expanded by the ratio of total days to total sampled days within strata. Daily observed catch is expanded to stratum level based on the same approach. The on-site effort survey works well in the Pacific Northwest, especially in Washington State, because of the rugged coastline, surf conditions, lack of infrastructure, and therefore limited access to coastal ports or beaches. Table 3.4 summarizes the recreational surveys in the Pacific region. Details of associated sampling designs, protocols, and estimation procedures can be obtained from RecFIN.
Pacific Salmon In-Season Management
The United States and Canada signed the Pacific Salmon Treaty in 1985 to manage Pacific Salmon. The Pacific Salmon Commission (PSC) is a decision-making body for cooperative management of Pacific Salmon. A comprehensive new agreement was established in 1999, and the treaty was reaffirmed in 2019. The PSC establishes overall reduction and exploitation objectives for Salmon stocks from Alaska to the Oregon–California border at its annual meetings. Preseason fisheries guidelines for many Alaskan and Canadian fisheries are set by the PSC, while preseason guidelines for many of the southern U.S. (California, Oregon, and Washington) fisheries are set in the Pacific Fishery Management Council (PFMC) process. The PFMC process ensures that stock returns meet the guidelines set by the PSC and by NOAA when a stock is listed under the Endangered Species Act (ESA). In the post-season evaluation, when much of the season-setting process occurs during the PFMC process for southern U.S. fisheries, those fisheries must meet both PSC and federal ESA guidelines. The PFMC specifies ACLs only for California Sacramento River fall Chinook, California Klamath River fall Chinook, and Washington Willapa Bay Coho stocks. Weekly catch estimates for all Salmon stocks are produced by state agencies for purposes of managing the fishery relative to available allocation. State fishery managers track catch closely throughout the season and coordinate with NOAA Fisheries and other state managers to close the fisheries when catch is projected to reach the subarea allocation.
Pacific Halibut In-Season Management
Management of Pacific Halibut is accomplished through the International Pacific Halibut Commission (IPHC), an international organization established by a convention between Canada and the United States in 1923. The IPHC conducts stock assessments and sets coastwide total allowable catch, area apportionment, and other fishery regulations. The PFMC process establishes catch allocation and sharing plans among the three states based on the apportionment set by the IPHC for the PFMC region. State sampling programs (see Table 3.4) collect data for estimating recreational catch and effort. Weekly estimates are produced by state agencies for purposes of managing the fishery relative to available allocation. State fishery managers track catch closely throughout the season and coordinate with the IPHC, NOAA Fisheries, and other state managers to close the fisheries when catch is projected to reach the subarea allocation.
TABLE 3.4 Summary of State Recreational Surveys: Washington Ocean Sampling Program (WA-OSP), Washington Puget Sound Sampling Program (WA-PSSP), Oregon Ocean Recreational Boat Survey (OR-ORBS), and California Recreational Fisheries Survey (CA-CRFS)
| WA-OSP | WA-PSSP | OR-ORBS | CA-CRFS | |
|---|---|---|---|---|
| Metrics | Catch (retained, discarded), effort | Catch (retained, discarded), effort | Catch (retained, discarded), effort | Catch (retained, discarded), effort |
| Mode(s) | On-site effort count (census); dockside interview for catch, boat-based | Effort: phone survey for non-Salmon species; on-water boat survey or aerial survey for Salmon | On-site effort count (census); dockside interview for catch, boat-based | Pacific region (PR): on-site effort count; dockside interview for catch, boat-based |
| Catch or catch per unit effort (CPUE): dockside interview, boat-based | Pacific coast: capture-recapture (commercial passenger fishing vessel log and on-off-site trip validation) for effort; dockside and on-board interview, boat-based | |||
| Human-made: On-site effort count, on-site interview, shore-based | ||||
| Beaches and banks: effort phone survey; on-site interview, shore-based | ||||
| PR: private access and nighttime effort: off-site phone survey; proxy interviews from PR, boat-based | ||||
| Species/taxa | Salmon, Halibut, and other selected finfish | All finfish species, except forage fish | All finfish species, plus Dungeness Crab | All species in Pacific Fishery Management Council (PFMC) fishery management plans (FMPs): coastal pelagic and coastal migratory species, highly migratory species, Groundfish, Salmon, and inshore species and other anadromous species |
| WA-OSP | WA-PSSP | OR-ORBS | CA-CRFS | |
|---|---|---|---|---|
| Years | 1990–present | 2003–present | 1979–present | 2004–present with various breaks in lower-priority modes |
| Seasonality | March–October | Year-round | Year-round with caveats | Year-round |
| Timeliness (estimate frequency) | Weekly for Salmon and Halibut; monthly for Groundfish and Tuna | Groundfish: 2-month wave with roughly a 2-month lag | Weekly for Salmon and Halibut; monthly for Groundfish and Tuna | Monthly estimates with approximately 45-day delay; anticipated catch values (ACVs) using model-based approach, semi-monthly and replaced with CRFS estimates when available |
| Salmon: daily to bi-weekly, depending on needs | ||||
| Halibut: weekly | ||||
| Estimation approach | Observed catch expanded by on-site effort count (census) | Groundfish: CPUE total effort estimate | Observed catch expanded by on-site effort count (census) | CRFS modes: CPUE total effort estimate |
| Salmon: observed catch expanded by on-site effort count | ACV: observed catch expanded by on-site effort count (census) | |||
| Halibut: combination of OSP and Salmon approaches | ||||
| Program annual cost (recent year average) | Total: $1.2M | Total: $3.5M | Total: $1.5M | Total: $5.1M |
| MRIP: $361K | MRIP: $25K | MRIP: $348K | MRIP: $1.5M | |
| State: $160K | State: $900K | State: $242K | State: $3.6M | |
| Other federal fund: $690K | Other federal fund: $2,575K | Other federal fund: $910K | Other federal: Not available |
Groundfish In-Season Management
The PFMC manages more than 100 Groundfish species listed in its FMP. Analysts at the NMFS Northwest and Southwest Fisheries Science Centers and state agencies conduct Groundfish stock assessments to support PFMC management. The Council adopts overfishing limits (OFLs) and sigma (scientific uncertainty) recommended by its Scientific and Statistical Committee (SSC), determines P* (risk tolerance), and adopts acceptable biological catch and/or ACL and catch allocations after considering recommendations from its advisory bodies, primarily its Groundfish Management Team and the Groundfish Advisory Subpanel. The state agencies adopt conforming rules and monitor catches. Groundfish in-season management is implemented by NOAA Fisheries and state agencies. Before the fishing season, the Groundfish Management Team uses projection models, reviewed by the SSC, to evaluate and set state rules for the forthcoming fishing season. State sampling programs, summarized in Table 3.4, monitor fishing activities and provide monthly
catch estimates. If needed, these estimates can be made available weekly during Salmon and Halibut seasons. Raw sampling data are available to managers at the end of each sampling day.
North Pacific (Alaska)
The North Pacific Fishery Management Council does not manage fisheries in season. As in the PFMC region, management of the Salmon and Halibut fisheries is coordinated with the PSC and IPHC, respectively. The ADF&G participates in in-season management only for Chinook (King) Salmon in Southeast Alaska. In contrast with the PFMC region, Halibut is not managed in season in the Alaska region. The majority of Alaska marine recreational fishing occurs in state waters, with the exception of Halibut. Statewide, ADF&G requires all charter businesses and guides to maintain detailed daily logs for each angler trip. The Alaska Saltwater Logbook data form collects information on the date of each trip, individual angler name and license number, primary fishing location (Salmon and Groundfish), and numbers of fish by species—kept and released. Charter operators and guides must file the completed paper logbook forms or submit electronic forms within 1 week of a completed trip. Annually, ADF&G also conducts a mail survey of licensed angler households. In 2020, the Alaska Sport Fishing Survey was sent to approximately 47,000 randomly selected Alaska resident and nonresident households with a licensed angler. The survey asks anglers to use retrospective recall to report the number of days fished (guided and not guided) by members of their household and to report the number of fish caught and harvested by location. Data gathered through the annual ADF&G Saltwater Logbook program, Sport Fishing Survey, and special dockside creel surveys are combined to produce annual estimates of harvest and released catch by species and location. These estimates are publicly disseminated during the following year through the Alaska Fisheries Information Network.
Western Pacific
Hawaii Marine Recreational Fishing Survey
The Hawaii Marine Recreational Fishing Survey is conducted by the Hawaii Division of Aquatic Resources (DAR) and MRIP (Ma and Ogawa, 2016; Ma et al., 2018). Since 2003, this program has yielded annual recreational catch estimates by combining phone interviews conducted by the Coastal Household Telephone Survey for estimating total fishing effort with an access point intercept survey (i.e., on-site fisher interviews), which together can be used to estimate CPUE for boat-based and shore-based activities. The fishing effort survey was switched from a phone to a mail survey in 2018. Prior to the switch, both phone and mail surveys were conducted in 2017, and effort estimates derived from mail surveys were found to be higher than the estimates from phone surveys for both shore- and boat-based recreational fishing activities. The differences may result from a reduction in the number of households with landline phones over time; however, no correction factors are available for 2003 to 2016. The pre-2003 recreational catch estimates are not available. In a recent Uku (Gray Snapper, Aprion virescens) stock assessment, the pre-2003 catch was estimated based on the assumption that recreational catch would be proportional to the Hawaii population size, and the recreational fishery participation would increase with overall population in Hawaii. High uncertainty tends to be associated with the Hawaii Marine Recreational Fishing Survey’s recreational catch estimates.
U.S. Territories of American Samoa, Guam, and the Commonwealth of the Northern Mariana Islands
The WPacFIN coordinates recreational fishing creel surveys in these U.S. territories. Currently, there is no active in-season management of recreational fisheries in this western Pacific region, although WPacFIN representatives indicated it is very much part of their planning process and are seeking needed assistance from MRIP. The existing surveys in the territories are currently not officially part of MRIP, but U.S. Fish & Wildlife Service grant funding has been available to support MRIP consultation on survey design improvements.
MRIP ESTIMATION OF RECREATIONAL CATCH FOR FISHERIES MANAGEMENT
MRIP Data Aggregation, Cleaning, Weighting, and Estimation
MRIP produces wave (bi-monthly) estimates of total catch of each species for multiple domains of the marine recreational fishery in the Atlantic and Gulf regions. Geographically, estimates for each applicable species are produced by region and state within a region. Separate state-level estimates for each relevant species are produced for the location of catch, defined as inshore, near-shore (<3 mi or <10 mi depending on state declaration), and offshore (in the federal exclusive economic zone). For each state, total catch for each species is estimated for three fishing modes: shore angler, private boat, or charter/for-hire.
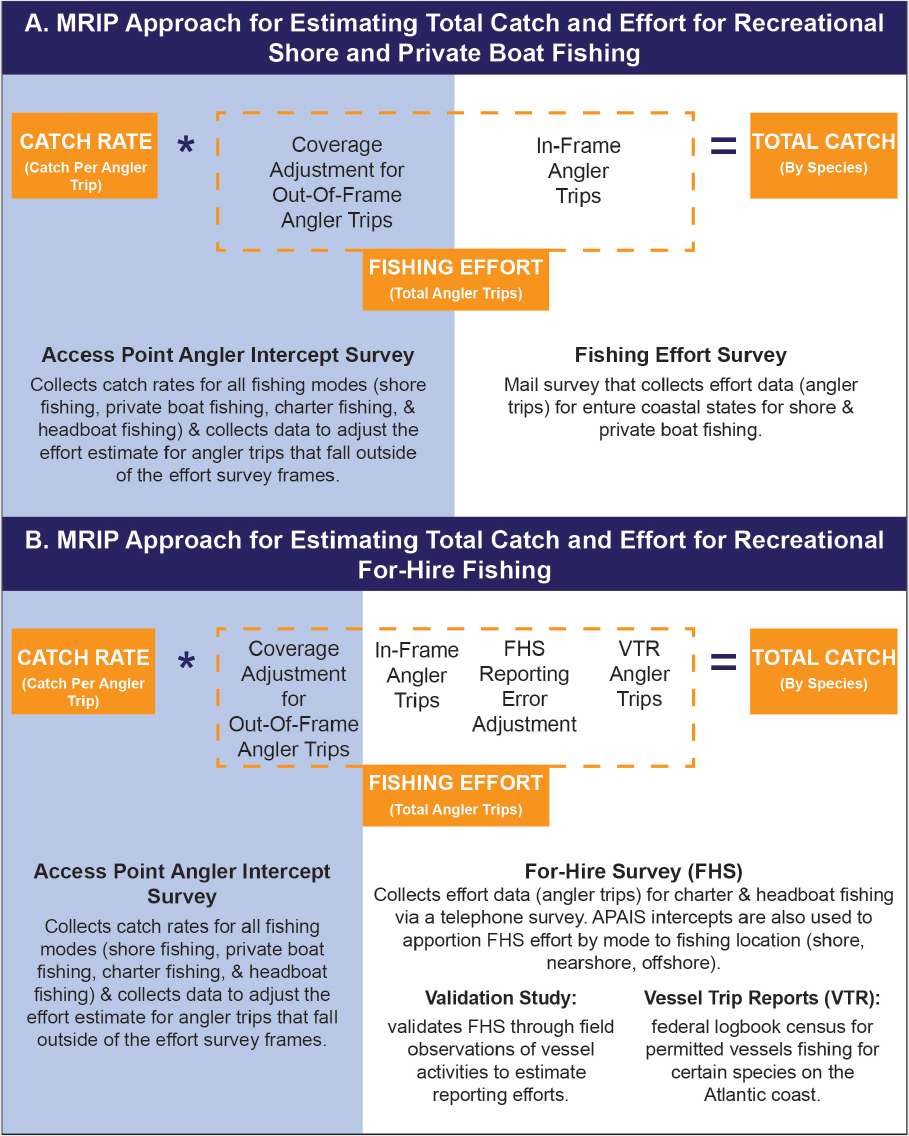
MRIP statistical methodology for producing these domain-specific estimates of recreational fisheries catch and effort is summarized in a detailed NOAA Fisheries report published in 2018 (Papacostas and Foster, 2018). The MRIP methodology for estimating total catch for each domain centers on separate estimation of two components: total effort (E), measured in numbers of angler trips, and mean “catch rate” (C/E), measured in numbers of fish caught per angler trip (see Figure 3.4).
For all three fishing modes (shore, private boat, for-hire vessel), the MRIP estimation of the C/E component is based on probability samples and the angler intercept data collected in the MRIP APAIS program either dockside or on board as part of the special APAIS sampling for licensed headboats that hold permits to fish federal waters. Following each 2-month APAIS wave, MRIP computes weighted estimates of mean C/E by species for each subregion, state, substate region (county), mode (shore, private boat, for-hire), and location (inland, nearshore, offshore) (see Papacostas and Foster, 2018). MRIP estimates of the catch rate are computed for each domain (D) using a design-based weighted estimator of mean catch per angler trip (Papacostas and Foster, 2018):
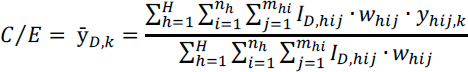
where:
D = the domain for the estimate (region, state, fishing mode, fishing location)
h = 1, …, H = APAIS primary stratum (pseudo-stratum)
i = 1, …, nh = sample PSU within stratum h
j = 1, …, mhi = jth angler’s trip observed within stratum h and PSU i
ID,hij = an indicator (0,1) equal to 1 if observation (h,i,j) belongs to domain D (0 otherwise)
whij = the APAIS weight for angler trip observation (h,i,j)
yhij,k = the species K catch (number, pounds) for angler trip observation (h,i,j)
SOURCE: Adapted from a similar figure presented in the 2018 NOAA Fisheries methodology report (Papacostas and Foster, 2018).
Standard errors of the estimates of catch rates are estimated using robust Taylor Series Linearization methods that account for the influence of the sample design stratification, clustering, and weighting on the variance of the estimates.
Given these estimates of catch per unit effort (C/E) for each species (k) and domain (D), MRIP separately estimates the total effort, E (expressed in angler trips), for each domain, D, from the FES. The bi-monthly estimation of total catch, Yk,D, for each species and domain is then computed as the product of the C/E and the E estimates for each domain.
Estimates of total angler trips (E) for the shore and private boat fishing modes are based on retrospective trip reporting by anglers responding to the FES mail survey. Following each 2-month wave of data collection, the FES data gathered in that wave are used to estimate total angler effort, E, for each coastal state and fishing mode (shore, private boat). The FES mail survey captures information on each angler trip for the reporting period, including the state in which the trip occurred and the fishing mode (shore or private boat). Prior to estimation, each FES respondent household is assigned an analysis weight that includes factors for the base sample inclusion probability, an adjustment for survey nonresponse, calibration to census populations for the sample strata, and an APAIS-based coverage adjustment for nonresident anglers who would not be eligible for the FES stratified sample of coastal state households and fishing license holders. Using a form of the Horvitz-Thompson estimator for a population total, the FES analysis weights are then applied to the survey reports of trips to derive estimates of total angler trips for state x shore/private boat domains. The FES does not collect information on the fishing location (inland, near-shore, or offshore) for individual trips. Instead, total angler trips for state x mode domains are apportioned to three fishing locations based on estimated proportions of trips observed in the APAIS intercepts.
Estimation of for-hire angler effort (E) is based on data collected in the FHS telephone survey. In specific strata of for-hire vessels, census data from special logbook or legacy survey programs are used in lieu of the FHS telephone interview data—VTR logbook data in the Northeast and Mid-Atlantic and SRHS data for headboats with permits to fish in the South Atlantic and Gulf. FHS telephone survey reports and the VTR/SRHS logbooks provide detailed information for each trip that occurred within the assigned reporting period, including the location fished. The FHS also includes a validation component in which dockside checks are used to verify the accuracy of trip reports and develop weighting adjustment to correct for potential underreporting in the weekly telephone survey.
Bi-monthly weighted estimates of total recreational angler catch, Ŷk,D for each reporting domain (D) are computed as the product of the FES/FHS-based estimates of effort and the APAIS-based estimates of the CPUE, C/E:
![]()
where:
![]() D,k = mean catch of species k per angler trip in MRIP reporting domain D
D,k = mean catch of species k per angler trip in MRIP reporting domain D
![]() D = the FES/VTR/FHS-based estimate of total recreational angler trips in MRIP reporting domain D
D = the FES/VTR/FHS-based estimate of total recreational angler trips in MRIP reporting domain D
For the private recreational domain, APAIS-based estimates of C/E are based on data collected at public-access sites, while the FES-based estimates of effort include anglers using both public-access and private-access sites. Hence, an assumption in the MRIP catch estimates is that in a given domain, C/E for anglers using private-access sites is the same as C/E for anglers using public-access sites. There is some evidence, however, that C/E is lower for fishers using private-access sites than for those using public-access sites (Ashford et al., 2010, 2011, 2013). Previous National Academies studies that reviewed both MRFSS (NRC, 2006) and MRIP (NASEM, 2017) indicated that this
issue has important implications for the estimation of total catch (potential bias),5 especially in situations where the proportion of private sites is appreciable. A study completed by MRIP in 2016 (the FES Follow-Up Study) used data collected via follow-up mail and online survey to look at differences in C/E between public- and private-access sites (NOAA Fisheries, 2016). However, the MRIP Research and Evaluation Team found that response rates were low, and sample sizes were too small for properly evaluating noncoverage error in APAIS.6 A subsequent and ongoing MRIP study (the FES Boat Survey), expected to be completed in 2021, utilizes the FES sampling design to estimate the distribution of boat trips by access type, fishing area, and boat type.
In general, estimates for larger domains are computed as the sum of estimates for the smaller domains. For example, a bi-monthly estimate of the total recreational catch of Bluefish for New York is derived by summing over the domain-level Bluefish catch estimates for the combinations of fishing location and fishing mode.
MRIP releases its preliminary estimates of total catch by recreational fishery domain approximately 45 days after the close of each bi-monthly wave (e.g., August 15 for the May–June wave). As noted above, the catch rate (C/E) data from the APAIS dockside and on-board observations are recorded electronically, and although they must then be subjected to MRIP standard quality control processes, statistical access to the raw data is not the time-limiting factor in the production and release of MRIP catch estimates. Focusing on the effort (E) data, most data collection for the FHS and the VTR logbook programs occurs within 1–2 weeks of the date on which the fishing trip occurred. The FES mail survey methodology requires a slightly longer period for all returns from the final 2-week sample period to be received. Consequently, it is approximately 2 weeks after the end date of the bi-monthly wave before the majority of the raw data can be assembled and undergo the required data management, quality control, and scientific review steps that must be completed before final estimates are compiled and published.
MRIP releases its bi-monthly and annual catch estimates by species and recreational fishery domain through the NOAA Fisheries website.7 Fisheries managers and the public can access the individual-level catch data from the APAIS intercept program website.8 Annual species-specific catch estimates (commercial and recreational) for all regions and states are also posted on the NOAA Fisheries site.9 The annual estimates of recreational catch posted at this site include not only the MRIP estimates for the Atlantic region, the Gulf, and Hawaii, but also estimates for Texas; RecFIN estimates for California, Oregon, and Washington; and Alaska Fisheries Information Network estimates for Alaska.
SUMMARY OF SURVEY PRECISION AND TIMELINESS OF MRIP AND OTHER SURVEYS
The desire to improve the timeliness or precision of recreational catch and harvest estimates has been expressed by several previous reports or working groups, including in a 2011 workshop hosted by NOAA Fisheries (Salz et al., 2011), the 2017 National Academies report on MRIP (NASEM,
___________________
5 “Estimates of CPUE may be biased if anglers accessing the water from private access points or from little known public access points differ in their fishing (e.g., fishing modes, areas and species targeted, effort and success rate) from those accessing the water from well-documented public access points” (NRC, 2006, p. 64). “The lack of intercept information from most private access means that the use of CPUE requires the strong assumption that catch and effort are equal between anglers using public and private access” (NASEM, 2017, p. 34).
6 Personal communication. Rob Andrews and John Foster, NOAA Fisheries MRIP Research and Evaluation Team, November 2020.
7 See https://www.fisheries.noaa.gov/topic/recreational-fishing-data.
8 See https://www.fisheries.noaa.gov/recreational-fishing-data/recreational-fishing-data-downloads.
2017), and the earlier National Academies study of the predecessor MRFSS program (NRC, 2006), and multiple MRIP regional implementation plans.
While the following chapter explores potential pathways to improving the timeliness of MRIP data in more detail, it is worth noting here that the 2011 workshop yielded six recommendations to this end: (1) moving toward 1-month waves; (2) reducing lag times (from data collection to data provision); (3) developing forecast models from early survey returns; (4) encouraging the development of other forecasting models for estimating catch and effort; (5) continuing to explore electronic reporting technologies; and (6) further developing innovative methods for addressing data timeliness and management needs for specific fisheries contexts, including small catch limits or short seasons. This historical context is important for evaluating the relative strengths of other state and regional surveys described in this chapter and summarized here. For instance, while MRIP has not transitioned from 2-month waves to shorter intervals, multiple state and regional surveys have done so. In the Gulf of Mexico region, for example, both Florida’s and Louisiana’s state survey programs are MRIP-certified and designed to produce either monthly or weekly estimates for at least some species.
The specific question of the timeliness of the release of catch estimates has also been a longstanding concern of MRIP and was studied in depth in the 2011 workshop (Salz et al., 2011; see Figure 3.5). At that time, the conclusion of the MRIP report (Salz et al., 2011) was that with modest additional resources, the time period for release of preliminary catch estimates could be shortened to 30 days after the end of each wave (e.g., August 1 for the May–June wave estimates).
When considering the precision of MRIP or other surveys, it is important to take into account the purpose for which the resulting data will be used. For instance, MRIP is designed as a general survey, and its precision is greatest for annual estimates at larger geographic scales; the precision of MRIP estimates is much lower for shorter periods of time and smaller geographic areas. The
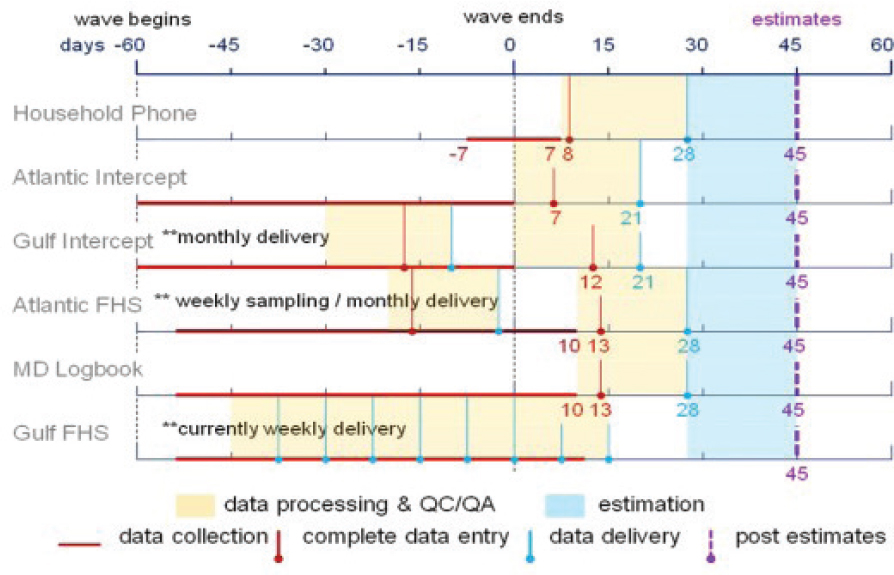
SOURCE: Salz et al., 2011.
precision of MRIP estimates also varies by species depending on such fishery characteristics as limited distribution and low catch rates. In contrast, state and specialized surveys can offer improved precision for certain taxa or contexts (e.g., reef fish fisheries in the Gulf of Mexico, Salmon fisheries in the Pacific Northwest). However, the narrower focus (taxa, geography, and season) and various methodologies involved in these surveys can pose challenges for fisheries managed across multiple states or regions, as more cohesive, regionwide estimates of recreational catch are needed for Council-managed fisheries.
Improvements in the timeliness and precision of catch and effort estimates for recreational fisheries have been described as high priorities in several recent regional MRIP implementation plans. In GulfFIN’s 2016–2018 implementation plan, for example, improving timeliness and precision was listed as important for improving the management of fisheries with ACLs, as well as reducing buffers between ACLs and annual catch targets (ACTs). In the South Atlantic, the ACCSP MRIP Implementation Plan (ACCSP, 2017) specifically addresses the potential value of transitioning to 1-month waves for better managing species in northern areas where fishing may be concentrated within a single month, such as when certain fish species are migrating through. In addition to describing region-specific challenges or research needs, the regional MRIP implementation plans also highlight the current context for and importance of better coordinating catch and effort surveys among states, regions, and MRIP.
The following section summarizes the context and issues related to the timeliness, precision, and adaptability of surveys described in this chapter. Chapter 4 goes a step further to describe how these surveys could be improved for current management and in response to desires for in-season management. Chapter 5 describes the more detailed approaches and pathways for alternative management strategies that would leverage and build on these surveys.
CONCLUSIONS AND RECOMMENDATION
Conclusion: Within their intended scope and design constraints, MRIP data are critically important for fisheries management. Recognizing the limitations of these data, including concerns about precision, most states desire access to raw MRIP data.
Conclusion: By utilizing existing infrastructure developed by regional Fishery Information Networks (FINs), MRIP Regional Implementation Teams provide the framework for integrating regional and state partner input, identifying regional priorities, and ensuring coordination in the development of strategies for addressing stock assessment and management needs for Council-managed recreational fisheries. In many instances, these needs include the development and implementation of specialized recreational surveys (either supplemental or alternative) to address limitations of a general survey such as MRIP.
Conclusion: Compared with MRIP surveys, alternative or supplemental (state) surveys have achieved a variety of benefits, including greater timeliness of estimates; greater spatial resolution; provision of additional information; and possibly in some cases, greater precision of estimates.
Conclusion: Alternative and supplemental surveys have improved timeliness through the use of new technologies (e.g., mobile apps and tablets), as well as reduced lag times in data processing and release.
Conclusion: Compared with MRIP surveys, alternative or supplemental surveys have been shown to provide different estimates for recreational catches for the same fishery (stock and area). Differences between estimates can be moderate or quite substantial.
Conclusion: Public perceptions of differences between MRIP and alternative surveys in methodology, final catch estimates, and the precision of the estimates are a source of consternation among anglers, fisheries managers, and other stakeholders.
Recommendation: Current efforts by the Marine Recreational Information Program and its partners in the area of survey inter-calibration should continue and, where significant differences between surveys exist in terms of final estimates or precision, the causes of the differences should be determined and communicated to the public.
Conclusion: While the implementation of MRIP surveys is generally standardized, there is precedent for adapting coverage to regional characteristics and needs. For instance, both APAIS and FES are conducted during only the warmer part of the year in the Northeast region.
REFERENCES
ACCSP (Atlantic Coastal Cooperative Statistics Program). 2016. Inventory and Comparison of For-Hire Data Collections in the Atlantic and Gulf of Mexico, 2016. Arlington, VA: ACCSP Recreational Fisheries Program.
ACCSP. 2017. ACCSP Atlantic Coast MRIP Implementation Plan—2017–2022. https://www.fisheries.noaa.gov/resource/document/mrip-regional-implementation-plan-atlantic-coast-2017-2022.
Ashford, J. R., C. M. Jones, and L. Fegley. 2010. Private waterfront householders catch less per trip than other fishers: Results of a marine recreational survey. Transactions of the American Fisheries Society 139:1083–1090.
Ashford, J. R., C. M. Jones, L. Fegley, and R. Reilly. 2011. Catch data reported by telephone avoid public access bias in a marine recreational survey. Transactions of the American Fisheries Society 139:1751–1757.
Ashford, J. R., C. M. Jones, and L. Fegley. 2013. Independent estimates of catch by private and public access fishers avoid between-group sources of error in a marine recreational survey. Transactions of the American Fisheries Society 142:422–429.
Biemer, P. P. 2010. Total survey error: Design, implementation and evaluation. Public Opinion Quarterly 74(5):817–848.
Brick, J. M. 2018. Review of Options for Electronic Reporting in Survey Research Applied to Estimating Fishing Effort. https://media.fisheries.noaa.gov/dam-migration/electronic_reporting_in_survey_research_applied_to_estimating_fishing_effort.pdf.
Dillman, D. A., J. D. Smyth, and L. M. Christian. 2014. Internet, Phone, Mail and Mixed-Mode Surveys: The Tailored Design Method, 4th Edition. Hoboken, NJ: John Wiley and Sons.
Donaldson, D., G. Bray, B. Sauls, S. Freed, B. Cermak, P. Campbell, A. Best, K. Doyle, A. Strelcheck, and K. Brennan. 2013. For-Hire Electronic Logbook Pilot Study in the Gulf of Mexico. Report submitted to the Marine Recreational Information Program Operations Team. https://www.st.nmfs.noaa.gov/Assets/recreational/pdf/Charter_Boat_Logbook_Project_report.pdf.
Groves, R. M. 1989. Survey Errors and Survey Costs. Hoboken, NJ: John Wiley and Sons.
Groves, R.M., F. J. Fowler, M. P. Couper, J. M. Lepkowski, E. Singer, and R. Tourangeau. 2009. Survey Methodology, 2nd Edition. Hoboken, NJ: John Wiley and Sons.
Ma, H., and T. K. Ogawa. 2016. Hawaii Marine Recreational Fishing Survey: A Summary of Current Sampling, Estimation, and Data Analyses. U.S. Department of Commerce, NOAA Tech. Memo. NOAA-TM-NMFS-PIFSC-55.
Ma, H., T. K. Ogawa, T. R. Sminkey, F. J. Breidt, V. M. Lesser, J. D. Opsomer, J. R. Foster, and D. A. Van Voorhees. 2018. Pilot surveys to improve monitoring of marine recreational fisheries in Hawai‘i. Fisheries Research 204:197–208. https://doi.org/10.1016/j.fishres.2018.02.010.
NASEM (National Academies of Sciences, Engineering, and Medicine). 2017. Review of the Marine Recreational Information Program. Washington, DC: The National Academies Press. https://doi.org/10.17226/24640.
NASEM. 2020. Data and Management Strategies for Recreational Fisheries with Annual Catch Limits—Statement of Task. Briefing Book, Committee on Data and Management Strategies for Recreational Fisheries with Annual Catch Limits, March 16–17, 2020, Committee Meeting. Washington, DC.
NMFS (National Marine Fisheries Service). 2020. Fisheries of the United States, 2018. U.S. Department of Commerce, NOAA Current Fishery Statistics No. 2018. https://www.fisheries.noaa.gov/national/commercial-fishing/fisheries-united-states-2018.
NOAA Fisheries (National Marine Fisheries Service of the National Oceanic and Atmospheric Administration). 2014. MRIP Data User Handbook, December 2014. http://www.st.nmfs.noaa.gov/recreational-fisheries/MRIP-Handbook/MRIP_handbook.pdf.
NOAA Fisheries. 2016. Marine Recreational Information Program: 2016–2017 Implementation Plan Update. https://www.st.nmfs.noaa.gov/Assets/New-MRIP/FINAL_2016-17_IP_Update-11.21.16.pdf.
NOAA Fisheries. 2019a. Developing For-Hire Electronic Logbooks: The MRIP Road Map. https://www.fisheries.noaa.gov/resource/educational-materials/developing-hire-electronic-logbooks-mrip-road-map.
NOAA Fisheries. 2019b. Marine Recreational Information Program, Research and Evaluation Team Review of the iAngler and iSnapper Reporting Programs. https://media.fisheries.noaa.gov/dam-migration/mrip_ret_review_of_iangler_and_iSnapper_reporting_programs_05-10-2019.pdf.
NOAA Fisheries. 2021. Marine Recreational Information Program Teams. https://www.fisheries.noaa.gov/recreational-fishing-data/marine-recreational-information-program-teams.
NRC (National Research Council). 2006. Review of Recreational Fisheries Survey Methods. Washington, DC: The National Academies Press. https://doi.org/10.17226/11616.
Papacostas, K. J., and J. Foster. 2018. Survey Design and Statistical Methods for Estimation of Recreational Fisheries Catch and Effort, 2018—Version 1. National Marine Fisheries Service’s Marine Recreational Information Program. https://www.fisheries.noaa.gov/resource/document/survey-design-and-statistical-methods-estimation-recreational-fisheries-catch-and.
Salz, R., D. Van Vorhees, G. Colton, and J. Rosetti. 2011. Addressing the Fishery Management Need for More Timely Recreational Data. MRIP Final Project Report. NOAA Fisheries. https://media.fisheries.noaa.gov/dam-migration/mrip-addressing-the-fishery-management-need-for-more-timely-recreational-data-2011.pdf.


