
Appendix A
Multiple-Frame Methods
The example given here illustrates the application of Hartley’s (1962, 1974) basic dual-frame estimator to the case of combining Marine Recreational Information Program (MRIP) survey data with supplemental survey data for the purpose of reducing the variance of a total catch estimate.
Consider two intersecting survey sample frames, M and S, where M is the MRIP sample frame, and S is the supplemental survey sample frame (e.g., a supplemental state survey frame). NM is the target population covered by M, NS is the target population covered by S, Nms is the population covered by the intersection of M and S, Nm is the population in M that is not in S, and Ns is the population in S that is not in M.
A random sample of individuals is taken from each sample frame: nM is the sample from M, nS is the sample from S, n'ms is that part of nM in the intersection of M and S, n"ms is that part of nS in the intersection of M and S, nm is that part of nM that is not in S, and ns is that part of nS that is not in M. One potential challenge of using multiple-frame methods is identifying individuals in the intersection of the sample frames (NASEM, 2017, p. 48). Some type of identifying information, such as angler license number or address, might need to be collected by both surveys to identify anglers occurring in both frames (NASEM, 2017, p. 50). However, if the supplemental survey frame is a subset of the MRIP sample frame (e.g., if a state conducts a supplemental mail survey of a subset of the Fishing Effort Survey [FES] sample frame for that state), then all of the observations from the supplemental survey are in the intersection of M and S (that is, nS = n"ms and ns = 0), and additional identifying information may not need to be collected by the supplementary survey.
Suppose that variable y is measured for each individual i sampled in each survey. For the case of combining MRIP with a supplemental survey, let yi = fish catch of individual i, ȳm = sample mean fish catch for individuals in sample frame M who are not in sample frame S, ȳm = sample mean fish catch for individuals in sample frame S who are not in sample frame M, ȳs = sample mean fish catch for individuals from sample frame M in the intersection of sample frames M and S, ![]() = sample mean fish catch for individuals from sample frame S in the intersection of sample frames M and S, p = a weighting variable to be determined later (see below), and YMS = total fish catch for all individuals in the population targeted by the combined sample frames. Assuming
= sample mean fish catch for individuals from sample frame S in the intersection of sample frames M and S, p = a weighting variable to be determined later (see below), and YMS = total fish catch for all individuals in the population targeted by the combined sample frames. Assuming
sufficient sample sizes so that finite population corrections can be ignored, the “dual-frame” post-stratified estimator ŶMS of total YMS is (Hartley, 1962):
![]()
with variance:

where ![]() is the population variance of y for individuals in sample frame M who are not in sample frame S, σs is the population variance of y for individuals in sample frame S who are not in sample frame M, and
is the population variance of y for individuals in sample frame M who are not in sample frame S, σs is the population variance of y for individuals in sample frame S who are not in sample frame M, and ![]() is the population variance of y for individuals in the intersection of sample frames M and S.
is the population variance of y for individuals in the intersection of sample frames M and S.
“MRIP ALONE” ESTIMATOR
For the purpose of comparing the estimators of catch and variance when MRIP is used alone with the estimators of catch and variance when MRIP is used together with a supplemental survey, the “MRIP alone” catch estimator ŶM in the notation above is:
![]()
The “MRIP alone” estimator above is a special case of the general dual-frame estimator in which Ns = 0, p = 1, and (1 – p) = 0. Similarly, the variance of the “MRIP alone” estimator is a special case of the variance of the general dual-frame estimator in which NS = 0:
“MRIP WITH SUPPLEMENTAL SURVEY” DUAL-FRAME ESTIMATOR
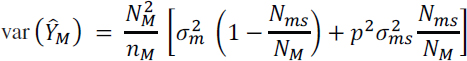
Assuming that the MRIP sample frame has 100 percent coverage of the population of interest (licensed recreational saltwater anglers in the region of interest), sample frame S is a subset of sample frame M, so Ns = 0 in the general dual-frame estimator, yielding the “MRIP with Supplemental Survey” estimator:
![]()
When sample frame S is a subset of sample frame M, it follows that Nms = NS and ![]() , so the variance of the general dual-frame estimator simplifies to:
, so the variance of the general dual-frame estimator simplifies to:

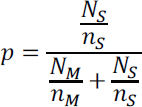
The optimal value of the weighting variable p minimizes var (ŶMS). The optimal value of p is found by setting the partial derivative of var(ŶMS) with respect to p equal to zero and solving for p (note that var(ŶMS) is convex in p):
REDUCTION IN VARIANCE OF CATCH ESTIMATE DUE TO SUPPLEMENTAL SURVEY
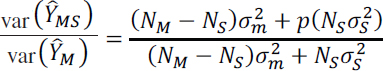
The variance of the catch estimate using the dual-frame estimator as a proportion of the variance of the catch estimate using MRIP alone is given by:

For example, if the ratio above is 0.75, then the variance of the catch estimate based on the dual-frame estimator is only 75 percent as large as the variance of the catch estimate based on MRIP alone. That is, using the dual-frame estimator has reduced the variance of the catch estimate by 25 percent compared with what the variance would be using MRIP alone.
Inserting the values of var (ŶM) and var (ŶMS) into the variance ratio above, and after some algebraic manipulation, the ratio can be shown to be:
where ![]()
![]() . Hence, for sufficiently large sample sizes nM and nS, combining MRIP survey results with those from a supplemental survey with sample frame S that is a subset of the MRIP sample frame M always reduces the variance of the catch estimate.
. Hence, for sufficiently large sample sizes nM and nS, combining MRIP survey results with those from a supplemental survey with sample frame S that is a subset of the MRIP sample frame M always reduces the variance of the catch estimate.
SENSITIVITY ANALYSIS
Increasing the MRIP survey sample size nM increases the value of p, increases the variance ratio ![]() , and hence reduces the benefit (in terms of variance reduction) of a supplemental survey.
, and hence reduces the benefit (in terms of variance reduction) of a supplemental survey.
Increasing the supplemental survey sample size nS decreases the value of p, decreases the variance ratio, and hence increases the benefit (in terms of variance reduction) of conducting a supplemental survey.
An increase in the variance of y within the supplemental survey (that is, an increase in ![]() ) decreases the variance ratio, and hence increases the benefit (in terms of variance reduction) of conducting a supplemental survey.
) decreases the variance ratio, and hence increases the benefit (in terms of variance reduction) of conducting a supplemental survey.
An increase in the variance of y in the portion of the MRIP sample frame outside the supplemental survey sample frame (i.e., an increase in ![]() ) increases the variance ratio, and hence decreases the benefit (in terms of variance reduction) of conducting a supplemental survey.
) increases the variance ratio, and hence decreases the benefit (in terms of variance reduction) of conducting a supplemental survey.
As the size of the supplemental survey sample frame increases relative to the size of the MRIP sample frame (i.e., as NS/NM increases), the variance ratio increases, and hence the benefit (in terms of variance reduction) of conducting a supplemental survey decreases.
The sensitivity analysis results, taken together, provide guidance on how best to target supplemental surveys for the goal of variance reduction within a dual-frame estimation framework. To provide the most benefit in terms of variance reduction, supplemental surveys should be targeted to MRIP domains with relatively low MRIP sample sizes (small nM) and with high variance in y. Within the MRIP domain, the subset population targeted by the supplemental survey should be relatively small (small NS), but the sample size within the subset should be relatively large (nS large relative to NS).
REFERENCES
Hartley, H. O. 1962. Multiple frame surveys. Proceedings of the Social Statistics Section, American Statistical Association, pp. 203–206.
Hartley, H. O. 1974. Multiple frame methodology and selected applications. Sankhya, Ser. C. 36:99–118.
NASEM (National Academies of Sciences, Engineering, and Medicine). 2017. Review of the Marine Recreational Information Program. Washington, DC: The National Academies Press. https://doi.org//10.17226/24640.


