
4
The Landscape of NIH SBIR/STTR Awardees
This chapter focuses on the landscape of National Institutes of Health (NIH) Small Business Innovation Research (SBIR)/Small Business Technology Transfer (STTR) awardees. The aim is to provide descriptive data with which to answer basic questions about the characteristics and geographic location of firms applying for and winning SBIR/STTR awards. The focus is specifically on the programs’ mandate to improve outreach to small businesses that are (1) woman-owned, (2) minority-owned, (3) new to the programs, or (4) from underrepresented states. This mandate is evaluated against the location and distribution of health-related resources. The distribution of applications and awards is analyzed over time, as well as across award types and across institutes and centers (ICs) within NIH, with particular attention to woman-owned firms, SED1-owned firms, and first-time SBIR winners, including changes following the 2011 SBIR/STTR reauthorization (H.R. 1540-526).2 The geographic distribution of awards across states is examined in terms of program success rates and total SBIR/STTR activity, normalized to other forms of NIH research and development (R&D) funding. Finally, the chapter explores patterns of collaboration for STTR awardees and examines the characteristics of partnering institutions.
METHODOLOGY AND SAMPLING
The data used in this chapter come from two main sources: (1) NIH SBIR/STTR application data provided to the committee by NIH; and (2) NIH’s public RePORTER database of funded projects and related outcomes. The committee limited its analysis to applications filed in 2001 through 2019 to
___________________
1 The Small Business Administration (SBA) uses this term to refer to those firms whose owners self-identify as “socially and economically disadvantaged” when completing their SBIR/STTR applications, and this report adheres to that usage. However, the committee finds this designation to be problematic and unhelpful, and recommends instead the use of “underrepresented minority (URM)” in future data collection efforts.
2https://business.defense.gov/Portals/57/Documents/SBIR-STTR%20Reauthorization%20Act%20of%202011.pdf.
provide a reasonably long history of the program while also avoiding data limitations of earlier SBIR/STTR records. Records in RePORTER from the past two decades are much more likely to have Dun & Bradstreet Data Universal Numbering System (DUNS) ID numbers. These DUNS identifiers are valuable links to other sources of data, such as the General Service Administration’s (GSA’s) System for Award Management (SAM) database,3 which the committee used for initial cross-checks on demographic characteristics of awardees and for its analysis of collaborations between research institutions and small businesses (Hemmatian et al., 2021). In addition, starting the analysis with 2001 allows a 5-year look back at applicants to measure total award volume for applicants more consistently across the sample period years. This time frame enables observation of overall program activity over the past 20 years while also making it possible to assess the changing nature of that landscape with detailed information about both applicants and awardees.
The final dataset for the sample period 2001–2019 contains 130,339 SBIR/STTR applications, 35,922 (27.6 percent) of which received awards. The sample thus includes both unfunded and successful applications, and it also includes revised applications for previously unfunded awards. It contains applications for special award types (Fast-Track, Direct-to-Phase II, Phase IIB), although challenges in cleanly differentiating those applications are discussed below. Moreover, the applicant data received from NIH include measures of race, ethnicity, and sex for principal investigators (PIs) and firm owners for both funded and unfunded applications, and the committee used this information to analyze trends in the diversity of race, ethnicity, and gender of applicants and awardees. For a small business to be classified as a woman-owned small business (WOSB), it must be (1) at least 51 percent owned and controlled by one or more women, and managed primarily by one or more women4; and (2) “small” in its primary industry in accordance with the Small Business Administration’s (SBA’s) size standards for that industry.5 For a small business to be classified as a socially and economically disadvantaged small business (SDB), (1) it must be 51 percent or more owned and controlled by one or more disadvantaged persons; (2) the disadvantaged person or persons must be both socially and economically disadvantaged; and (3) the firm must be small according to SBA’s size standards.6
For federal tracking purposes, prior to March 2019, NIH encouraged, but did not require, program applicants to self-certify regarding their firm ownership characteristics as WOSBs and SDBs.7 To validate awardees’ self-reported ownership data from SBA8 and NIH, the committee supplemented those data with
___________________
3https://sam.gov/data-services.
4https://sbir.nih.gov/about/women-owned.
5https://www.sba.gov/federal-contracting/contracting-guide/size-standards.
6https://grants.nih.gov/grants/guide/pa-files/PA-18-837.html.
7 This paragraph and related text in Chapter 4 were edited to provide additional detail on the application process and data used in the analysis after a prepublication version of the report was provided to NIH.
available firm-level records from GSA’s SAM database (Inouye et al., 2020a).9 The firm’s DUNS ID was used as a unique identifier in matching firm records.
Detailed descriptive statistics appear in the sections that follow, and changes to the base sample are documented in descriptions of the committee’s subanalyses.
Missing Data
Over the years, race and gender data are missing for a large and increasing number of SBIR/STTR applications. As Table 4-1 shows, 11.7 percent of applications from 2001 to 2019 are missing data on the PI’s gender, 22.9 percent are missing data on the PI’s race, and 29.9 percent are missing data on the PI’s ethnicity.10 These data gaps hinder precise analysis of diversity outcomes and whatever progress NIH may be making toward alleviating any disparities. It is imperative for NIH to take steps to ensure accurate measurement of applicant demographics in order to enable better evaluation of its performance on these measures and to highlight areas for improvement. It is especially troubling that the proportion of applications with missing data has risen steadily for both race and gender over time.
DISTRIBUTION OVER TIME: APPLICATIONS, AWARDS, AND TOTAL NIH FUNDING
Table 4-2 reports total annual spending amounts for the SBIR and STTR programs at NIH in inflation-adjusted dollars, the total number of SBIR and STTR applications, and the total number of funded SBIR and STTR applications over the sample period. Appropriations for the SBIR and STTR programs are determined through a statutory formula that directs an agency to set aside a given percentage of extramural federal R&D funds (in a given fiscal year) for the SBIR and STTR programs. Because NIH’s budget is allocated at the IC level, each IC has a different allocation for its SBIR and STTR awards. Awards are allocated through grants (and in some cases contracts) based on applications submitted to the SBIR and STTR program offices for each NIH IC using the processes described in Chapter 3.
As discussed in Chapter 3, 24 of the 27 NIH ICs participate in the SBIR/STTR programs. Year-to-year variation in the level of total funding for each IC will translate into variation in the level of funding available for the SBIR and
___________________
9https://sam.gov/data-services. Information in SAM includes a much finer partition of demographic information on business owners, such as whether the business is Black American Owned, Asian-Pacific American Owned, Native American Owned, Native Hawaiian Organization Owned Firm, Tribally Owned Firm, Alaska Native Corporation Owned Firm, or Service Disabled Veteran Owned Business. See SAM Functional Data Dictionary v4.0.
10 Applicants can choose not to provide racial and ethnic information on applications, except for “NIH programs designed to enhance the participation the participation of individuals who have been determined to be underrepresented in health-related sciences on a national basis.” https://grants.nih.gov/grants/guide/notice-files/not-od-15-089.html.
STTR programs for that IC. Since the relative size of the budgets of the different ICs can change over time, the allocation of the SBIR and STTR budget across the ICs will change over time as well.
Because the SBIR and STTR programs are funded as a set-aside of extramural R&D funding, their funding levels increase with overall budget increases. Funding levels for the programs are also affected by changes in the set-aside, and although the programs are often referred to as a single program, the mandated set-aside percentages for each program are, in fact, separate and have increased over time at different rates. As shown in Table 4-2, SBIR spending at NIH increased roughly in proportion to the size of the total NIH budget, with the former increasing by 130 percent in inflation-adjusted terms from 2001 to 2019 and the latter by 92 percent over the same period. According to data from NIH’s RePORTER database, STTR expenditures, on the other hand, went up by 452
TABLE 4-1 NIH SBIR/STTR Applications: Annual Trends in Missing Demographic Data for Principal Investigators
| Fiscal Year | Percentage of Applications with Missing Data (by category) | ||
|---|---|---|---|
| Gender | Race | Ethnicity | |
| 2001 | 5.0 | 14.2 | 43.6 |
| 2002 | 4.4 | 12.3 | 36.2 |
| 2003 | 4.1 | 11.5 | 21.3 |
| 2004 | 4.0 | 10.8 | 18.8 |
| 2005 | 4.5 | 11.5 | 18.2 |
| 2006 | 6.8 | 14.3 | 22.5 |
| 2007 | 8.3 | 19.9 | 32.2 |
| 2008 | 6.3 | 23.1 | 33.5 |
| 2009 | 5.4 | 26.3 | 34.2 |
| 2010 | 7.5 | 29.7 | 36.7 |
| 2011 | 7.2 | 30.3 | 36.4 |
| 2012 | 9.8 | 29.8 | 35.4 |
| 2013 | 17.1 | 30.5 | 33.8 |
| 2014 | 17.1 | 27.8 | 30.9 |
| 2015 | 18.5 | 26.4 | 28.3 |
| 2016 | 19.3 | 25.6 | 27.8 |
| 2017 | 20.5 | 26.1 | 27.6 |
| 2018 | 23.0 | 27.9 | 28.8 |
| 2019 | 24.2 | 28.8 | 30.2 |
| Average | 11.7 | 22.9 | 29.9 |
SOURCE: Application data provided by NIH.
percent, from $25.5 million in 2001 to $140.9 million in 2019, an amount that exceeds the mandated amount for that program. Part of the reason for the larger increase in spending for the STTR program in percentage terms is the threefold increase in the legislatively mandated set-aside for that program, which increased from 0.15 percent in 2001 to 0.45 percent in 2019. During the same period, the SBIR set-aside increased by less than one-third, from 2.5 percent to 3.2 percent.
The data appear to indicate that applicants respond to increases in SBIR/STTR budgets. In general, there was a modest but noticeable increase in the overall number of applications throughout the sample period, with more than a 30 percent increase in applications in 2017–2019 compared with 2001–2003 (see Table 4-2). This increase was not uniform between the SBIR and STTR programs: whereas the SBIR program experienced only a 20 percent increase in applications during the sample period (with a few outlier years for applications, including 2010 and 2016), the number of NIH STTR applications increased by more than 200 percent, ranging from 300–400 applications per year in the early 2000s to more than 1,100 per year since 2014. From 2001 to 2019, STTR’s share of the number of total NIH SBIR/STTR awards also rose, from 8.6 percent to 16.6 percent. The rate of increase in applications after 2011 was greater than the increase in the size of the budget allocated to the program, indicating a general uptick in awareness and popularity of the program as a tool for startups.
Aside from the general increase in applications corresponding to the increase in the set-aside percentages over the sample period, application rates also rose in years corresponding to increased funding for NIH overall. For example, increases in the overall NIH budget due to the American Recovery and Reinvestment Act (ARRA), which boosted the overall NIH budget by 2.3 percent on a temporary basis during 2009–2010, correspond to a more than a 50 percent rise in SBIR applications during 2008–2010 (see Table 4-2).
DEMOGRAPHIC DISTRIBUTION
As specified in its statement of task (Box 1-1 in Chapter 1), the committee conducted “an examination of the non-economic impacts to businesses, including measures of demographics” and “participation of underrepresented groups.”11 Previous National Academies reports on NIH’s SBIR and STTR programs (NRC, 2009; NASEM, 2015) relied mainly on cross-sectional survey data to ascertain demographic trends, but the low response rates on these surveys limited their usefulness as a source of evidence for drawing inferences.12 Consistent with those previous National Academies assessments of
___________________
11 See Chapter 1 for the committee’s full statement of task.
12 The 2015 report is based on a 2014 National Academies survey of PIs for NIH SBIR/STTR Phase II awards granted in 2001–2010 (726 respondents, 21.5 percent response rate). An earlier survey, carried out in 2005 and published in a 2009 report, used a similar methodology for NIH SBIR/STTR awards and also had a similar low response rate. These 2009 and 2015 reports were prepared by committees other than the one responsible for the present study.
TABLE 4-2 NIH SBIR/STTR Budget Allocations and Applications over Time
| Fiscal Year | Total NIH Budget (1000s of 2019 dollars) | SBIR Set-Aside (percent) | STTR Set-Aside (percent) | Total NIH SBIR Spending (1000s of 2019 dollars) | Total NIH STTR Spending (1000s of 2019 dollars) |
|---|---|---|---|---|---|
| 2001 | 20,458,556 | 2.50 | 0.15 | 394,208 | 25,528 |
| 2002 | 23,321,382 | 2.50 | 0.15 | 465,991 | 30,690 |
| 2003 | 27,166,715 | 2.50 | 0.15 | 509,158 | 30,997 |
| 2004 | 28,036,627 | 2.50 | 0.30 | 545,939 | 66,970 |
| 2005 | 28,594,357 | 2.50 | 0.30 | 551,723 | 73,316 |
| 2006 | 28,560,417 | 2.50 | 0.30 | 551,342 | 69,825 |
| 2007 | 29,178,504 | 2.50 | 0.30 | 561,783 | 72,246 |
| 2008 | 29,607,070 | 2.50 | 0.30 | 567,202 | 73,196 |
| 2009 | 30,545,098 | 2.50 | 0.30 | 606,708 | 88,511 |
| 2010 | 31,238,000 | 2.50 | 0.30 | 607,714 | 83,423 |
| 2011 | 30,916,345 | 2.50 | 0.30 | 591,747 | 74,185 |
| 2012 | 30,860,913 | 2.60 | 0.35 | 593,858 | 86,783 |
| 2013 | 29,315,822 | 2.70 | 0.35 | 565,006 | 79,614 |
| 2014 | 30,142,653 | 2.80 | 0.40 | 606,052 | 93,563 |
| 2015 | 30,311,349 | 2.90 | 0.40 | 627,837 | 95,575 |
| 2016 | 32,311,349 | 3.00 | 0.45 | 692,684 | 115,134 |
| 2017 | 34,300,999 | 3.20 | 0.45 | 778,644 | 122,932 |
| 2018 | 37,311,349 | 3.20 | 0.45 | 854,150 | 132,167 |
| 2019 | 39,313,000 | 3.20 | 0.45 | 907,896 | 140,938 |
SOURCE: Application data provided by NIH; NIH RePORTER data.
| Total Number of Applications | Number of SBIR Applications | Number of STTR Applications | Total Number of Applications Funded | Number of SBIR Applications Funded | Number of STTR Applications Funded |
|---|---|---|---|---|---|
| 4,634 | 4,228 | 406 | 1,773 | 1,620 | 153 |
| 5,170 | 4,819 | 351 | 1,945 | 1,793 | 152 |
| 6,458 | 5,984 | 474 | 2,078 | 1,923 | 155 |
| 7,942 | 7,155 | 787 | 2,255 | 1,939 | 316 |
| 7,298 | 6,400 | 898 | 1,988 | 1,710 | 278 |
| 6,611 | 5,528 | 1,083 | 1,880 | 1,619 | 261 |
| 5,804 | 4,551 | 1,253 | 1,840 | 1,591 | 249 |
| 5,560 | 4,508 | 1,052 | 1,928 | 1,679 | 249 |
| 6,026 | 5,103 | 923 | 2,015 | 1,723 | 292 |
| 8,359 | 7,519 | 840 | 1,877 | 1,625 | 252 |
| 7,677 | 6,891 | 786 | 1,568 | 1,379 | 189 |
| 6,960 | 6,168 | 792 | 1,708 | 1,464 | 244 |
| 6,423 | 5,541 | 882 | 1,537 | 1,285 | 252 |
| 6,490 | 5,384 | 1,106 | 1,747 | 1,459 | 288 |
| 6,872 | 5,618 | 1,254 | 1,681 | 1,398 | 283 |
| 9,210 | 7,246 | 1,891 | 1,803 | 1,460 | 328 |
| 7,633 | 6,065 | 1,454 | 1,914 | 1,560 | 317 |
| 7,676 | 6,187 | 1,454 | 2,194 | 1,784 | 375 |
| 7,536 | 6,127 | 1,390 | 2,191 | 1,809 | 363 |
the SBIR and STTR programs at NIH, however, this committee found persistently low levels of program participation among women and African Americans, Hispanics, Latine Americans, American Indians, and others. For Asian Americans, Pacific Islanders, and Subcontinent Indian Americans, participation rates were generally higher than for other minority groups but remained disproportionately below these groups’ overall level of representation in the science, technology, engineering, and mathematics (STEM) workforce in the United States. Note that, despite the lack of diversity among awardees, both the share of applications and the share of awards addressing health issues for minority populations or women increased substantially from 2001 to 2019.
Program-wide Demographics
As shown in Table 4-3, there was little discernible improvement in the overall participation rates for NIH’s SBIR and STTR programs across multiple
TABLE 4-3 Overall Demographic Trends in NIH SBIR/STTR Applications over Time
| Fiscal Year | Percentage of Applications with Principal Investigator who is— | Percentage of Applications with Owner who is— | |||||
|---|---|---|---|---|---|---|---|
| Woman | African America | White | Asian | Hispanic or Latine | Woman | Minority | |
| 2001 | 17.3 | 1.3 | 69.2 | 13.7 | 1.7 | 4.3 | 2.7 |
| 2002 | 17.2 | 1.0 | 69.3 | 15.5 | 1.8 | 2.6 | 1.3 |
| 2003 | 17.0 | 1.1 | 68.5 | 17.3 | 2.0 | 10.3 | 5.8 |
| 2004 | 17.0 | 0.9 | 68.8 | 17.7 | 1.9 | 11.4 | 6.1 |
| 2005 | 17.5 | 1.1 | 68.9 | 16.7 | 2.1 | 10.8 | 4.7 |
| 2006 | 17.0 | 1.0 | 67.0 | 16.5 | 2.1 | 12.4 | 5.2 |
| 2007 | 16.4 | 1.0 | 61.8 | 16.6 | 1.7 | 12.6 | 4.8 |
| 2008 | 16.9 | 0.9 | 59.5 | 16.3 | 1.7 | 13.3 | 4.7 |
| 2009 | 18.4 | 1.2 | 57.8 | 15.4 | 2.3 | 13.4 | 5.0 |
| 2010 | 17.8 | 1.0 | 53.6 | 15.9 | 2.1 | 14.0 | 5.7 |
| 2011 | 17.2 | 1.1 | 53.7 | 15.2 | 2.3 | 13.1 | 4.6 |
| 2012 | 16.9 | 1.2 | 54.2 | 15.1 | 2.2 | 13.1 | 4.4 |
| 2013 | 15.6 | 0.9 | 54.2 | 14.9 | 2.4 | 14.5 | 3.5 |
| 2014 | 16.3 | 1.4 | 53.8 | 17.2 | 2.4 | 13.0 | 3.9 |
| 2015 | 15.9 | 1.3 | 55.2 | 17.2 | 2.5 | 12.8 | 3.9 |
| 2016 | 16.0 | 1.6 | 55.0 | 17.0 | 3.1 | 13.3 | 3.9 |
| 2017 | 15.4 | 1.5 | 54.9 | 17.3 | 3.3 | 13.1 | 4.5 |
| 2018 | 16.1 | 1.2 | 53.2 | 17.8 | 3.1 | 13.7 | 4.8 |
| 2019 | 16.9 | 1.5 | 52.4 | 17.2 | 2.9 | 11.6 | 3.7 |
| Average | 16.8 | 1.2 | 59.0 | 16.4 | 2.3 | 12.0 | 4.5 |
SOURCE: Application data provided by NIH.
underrepresented groups from 2001 to 2019. The shares of applications from women and African American PIs did not increase over this period. Although the share of applications from Latine or Asian PIs increased slightly, these increases are not statistically significant.
Tables 4-4 and 4-5, respectively, list proportions of applications and awards for each gender and race category over the sample period.13 The committee attributed demographic characteristics to applicants and application topics in the following three ways: (1) using the PI-level detail on race, ethnicity, and gender provided in the applicant data; (2) using the indicators for whether the owner of an applicant firm was a woman or a member of a SED group, which are available on the SBA website for all awardees; and (3) performing text analysis on each application to determine whether the project addressed topics (illnesses, treatments, devices, social and biological phenomena) pertaining to the health of women and minorities.
As shown in Table 4-4, while women PIs and woman-owned small businesses remained flat as a share of total applications over the sample period, a steady increase in the number of applications addressing topics of importance to women increased steadily. This same pattern applies to awards to women’s health topics, whose coverage increased by about 15 percentage points.
Table 4-5 shows similar statistics for minority applicants. The sample period saw steady but modest increases in the proportions of total applications from firms with Black or Hispanic/Latine PIs or SED owners, but the share of abstracts and funded applications dealing with minority health issues increased at a much higher rate.
According to the most recent publicly available data from the U.S. Census Bureau’s 2019 Annual Business Survey, which covers reference year 2018, about 19.9 percent of all U.S. businesses were owned by women, and 18.3 percent were minority-owned.14 In 2019, Asian Americans made up 17 percent of college-educated STEM workers;15 33 percent of all U.S. STEM baccalaureates;16 and 35 percent of doctoral recipients in the life sciences, physical sciences, and math or computer sciences that were awarded to U.S. citizens or permanent residents.17 The American Association of Physicians of Indian Origin, an organization that represents 80,000 practicing physicians and 40,000 medical students, residents, and fellows, reported that 10 percent of all physicians in the United States were of Indian origin.18 According to a 2012 study by the Minority
___________________
13 Total application counts for these tables exclude applications listed as revisions in order to avoid double counting.
14https://www.census.gov/programs-surveys/abs/data/tables.2019.html.
15https://www.pewresearch.org/social-trends/2018/01/09/diversity-in-the-stem-workforce-varies-widely-across-jobs.
16https://nces.ed.gov/programs/raceindicators/indicator_reg.asp.
17 National Science Foundation, Survey of Earned Doctorates, Table 22, doctorate recipients, by subfield of study, citizenship status, ethnicity, and race: 2019.
Business Development Agency, 6.9 percent of all U.S. small businesses were Asian-owned (Inouye et al., 2020a).19 Taken together, these statistics suggest that women and minorities would reasonably be expected to constitute a substantially higher percentage of firm owners or PIs than is currently seen in the NIH SBIR and STTR programs.
TABLE 4-4 NIH SBIR/STTR Programs: Descriptive Statistics Regarding Gender for All Applications and Funded Applications, by Fiscal Year
| Fiscal Year | Percentage of Applications | Percentage of Funded Applications | ||||
|---|---|---|---|---|---|---|
| PI is a woman | Business owner is a woman | Abstract addresses women’s health | PI is a woman | Business owner is a woman | Abstract addresses women’s health | |
| 2001 | 17.3 | 4.3 | 26.7 | 17.1 | 3.3 | 26.7 |
| 2002 | 17.2 | 2.6 | 29.3 | 17.1 | 1.4 | 27.6 |
| 2003 | 17.0 | 10.3 | 30.4 | 16.8 | 7.6 | 28.1 |
| 2004 | 17.0 | 11.4 | 30.4 | 18.0 | 10.2 | 28.6 |
| 2005 | 17.5 | 10.8 | 32.9 | 17.5 | 8.8 | 31.2 |
| 2006 | 17.0 | 12.4 | 34.4 | 18.8 | 11.3 | 34.2 |
| 2007 | 16.4 | 12.6 | 34.9 | 17.4 | 10.8 | 35.2 |
| 2008 | 16.9 | 13.3 | 38.0 | 16.5 | 11.6 | 36.6 |
| 2009 | 18.4 | 13.4 | 37.4 | 18.3 | 12.1 | 37.9 |
| 2010 | 17.8 | 14.0 | 38.0 | 17.2 | 11.5 | 40.0 |
| 2011 | 17.2 | 13.1 | 42.7 | 17.6 | 11.0 | 45.0 |
| 2012 | 16.9 | 13.1 | 41.9 | 19.6 | 12.0 | 41.7 |
| 2013 | 15.6 | 14.5 | 39.1 | 18.5 | 12.9 | 40.2 |
| 2014 | 16.3 | 13.0 | 40.0 | 18.3 | 12.2 | 39.3 |
| 2015 | 15.9 | 12.8 | 40.6 | 17.3 | 10.2 | 40.0 |
| 2016 | 16.0 | 13.3 | 40.5 | 19.4 | 11.5 | 40.0 |
| 2017 | 15.4 | 13.1 | 41.3 | 18.0 | 12.0 | 42.9 |
| 2018 | 16.1 | 13.7 | 42.0 | 18.6 | 12.7 | 40.5 |
| 2019 | 16.9 | 11.6 | 41.8 | 17.9 | 12.7 | 42.4 |
| Average | 16.8 | 12.0 | 37.4 | 17.9 | 10.3 | 36.5 |
NOTE: PI = principal investigator.
SOURCE: Application data provided by NIH.
___________________
19https://archive.mbda.gov/news/news-and-announcements/2016/08/asian-owned-businesses-nearing-two-million.html.
TABLE 4-5 NIH SBIR/STTR Programs: Descriptive Statistics Regarding Diversity for All Applications and Funded Applications, by Fiscal Year
| Fiscal Year | Percentage of All Applications | Percentage of Funded Applications | ||||
|---|---|---|---|---|---|---|
| PI is Black, Hispanic, or Latine | Business owner is from socially or economically disadvantaged group | Abstract addresses diversity | PI is Black, Hispanic, or Latine | Business owner is from socially or economically disadvantaged group | Abstract addresses diversity | |
| 2001 | 3.0 | 2.7 | 7.7 | 1.4 | 2.1 | 7.7 |
| 2002 | 2.8 | 1.3 | 8.1 | 1.9 | 0.8 | 8.6 |
| 2003 | 3.1 | 5.8 | 9.5 | 2.1 | 2.8 | 9.7 |
| 2004 | 2.7 | 6.1 | 9.4 | 2.4 | 3.6 | 10.4 |
| 2005 | 3.2 | 4.7 | 9.3 | 2.7 | 3.3 | 9.1 |
| 2006 | 3.0 | 5.2 | 9.2 | 2.1 | 4.3 | 9.2 |
| 2007 | 2.7 | 4.8 | 10.2 | 2.3 | 3.6 | 10.5 |
| 2008 | 2.6 | 4.7 | 11.0 | 2.4 | 4.1 | 11.9 |
| 2009 | 3.5 | 5.0 | 11.1 | 3.0 | 3.5 | 11.9 |
| 2010 | 3.1 | 5.7 | 12.1 | 2.8 | 3.7 | 12.5 |
| 2011 | 3.4 | 4.6 | 12.2 | 2.7 | 3.6 | 13.4 |
| 2012 | 3.4 | 4.4 | 11.9 | 3.1 | 3.5 | 10.6 |
| 2013 | 3.3 | 3.6 | 11.8 | 4.0 | 2.7 | 11.1 |
| Fiscal Year | Percentage of All Applications | Percentage of Funded Applications | ||||
|---|---|---|---|---|---|---|
| PI is Black, Hispanic, or Latine | Business owner is from socially or economically disadvantaged group | Abstract addresses diversity | PI is Black, Hispanic, or Latine | Business owner is from socially or economically disadvantaged group | Abstract addresses diversity | |
| 2014 | 3.7 | 3.9 | 12.1 | 4.4 | 2.5 | 12.1 |
| 2015 | 3.8 | 3.9 | 12.1 | 3.8 | 2.7 | 12.7 |
| 2016 | 4.8 | 3.9 | 12.4 | 4.5 | 2.7 | 12.2 |
| 2017 | 4.8 | 4.5 | 12.5 | 4.4 | 2.6 | 11.8 |
| 2018 | 4.3 | 4.8 | 12.1 | 4.5 | 2.2 | 12.8 |
| 2019 | 4.4 | 3.7 | 13.1 | 4.8 | 3.4 | 13.3 |
| Average | 3.5 | 4.5 | 11.1 | 3.1 | 3.0 | 11.1 |
NOTE: PI = principal investigator.
SOURCE: Application data provided by NIH.
American Recovery and Reinvestment Act (ARRA) Applicants
The committee explored conditional impacts on various groups of an application’s being labeled as part of the ARRA. In 2009 and 2010, NIH granted 284 awards out of a total of 959 applications for SBIR and STTR projects under the ARRA. The success rate in obtaining funding for these ARRA projects was slightly higher (29.6 percent) than the average rate for NIH SBIR and STTR projects not associated with ARRA funding (27.5 percent). Despite this slightly higher overall success rate for ARRA applications, however, female and male applicants saw disparate rates: on average, women PIs had a 7.2 percent lower success rate for ARRA-funded applications than for non-ARRA-funded applications, whereas male PIs saw a 5.3 percent increase with ARRA-funded applications. The ARRA designation appears not to have impacted funding rates relative to non-ARRA applications for any groups except women.
Demographic Differences across ICs
Differences in SBIR/STTR activity across the various ICs participating in the SBIR/STTR programs are shown in Tables 4-6 (covering 2001–2011) and 4-7 (covering 2012–2019), which are organized in order of the ICs’ SBIR/STTR budgets and include the average shares of applications by demographic group for NIH as a whole. These tables show that the largest ICs drew shares of minority- and woman-owned firms as applicants that were lower than the shares for NIH as a whole, a trend that persisted both before and after the 2011 reauthorization. The National Institute on Minority Health and Health Disparities (NIMHD), unsurprisingly, performed best in terms of attracting applications from diverse groups, although its small size makes the overall impact of these efforts negligible in the context of the larger ICs’ stagnation on those measures.
In addition to looking at whether ICs attracted diverse applicants, the committee looked at whether success rates for minority or women applicants increased, but the number of awardees was too small to differentiate success rates by IC. Overall, the programs became more competitive during the sample period, with overall success rates falling from 21.6 percent in 2001–2011 to 17.2 percent in 2012–2019 (see Table 4-8). At the same time, the success rates for African American and American Indian PIs improved. Overall, the increases in acceptance rates for those groups, though small, are somewhat encouraging during a period when overall funding rates decreased as a result of higher volumes of total incoming applications.
PHASE I TO PHASE II CONVERSION
The Phase I award of the SBIR and STTR programs provides a small amount of money, regarded as proof-of-concept funding, which may lead to a larger Phase II award to move the project and the technology closer to
TABLE 4-6 NIH SBIR/STTR Programs: Differences across ICs in Application Shares from Underrepresented Groups, Fiscal Years 2001–2011
| IC (in order of decreasing SBIR/STTR program size) | Number of Applications | Percentage of Applications | |||||
|---|---|---|---|---|---|---|---|
| PI is African American | PI is Asian | PI is Hispanic or Latine | PI is a Woman | Owner is a Woman | Owner is from a Socially or Economically Disadvantaged Group | ||
| NCI | 12,903 | 0.8 | 21.1 | 1.8 | 16.9 | 9.9 | 4.3 |
| NIAID | 9,571 | 0.9 | 17.3 | 1.7 | 17.5 | 7.3 | 3.7 |
| NHLBI | 7,553 | 1.2 | 14.2 | 2.0 | 14.0 | 8.5 | 4.0 |
| NIGMS | 5,197 | 0.6 | 19.7 | 1.8 | 12.7 | 7.5 | 4.1 |
| NIDDK | 4,643 | 1.4 | 15.0 | 1.8 | 17.9 | 10.9 | 4.4 |
| NINDS | 3,873 | 0.3 | 14.0 | 2.9 | 13.3 | 8.2 | 2.9 |
| NICHD | 3,454 | 1.5 | 9.1 | 2.0 | 26.7 | 17.3 | 3.7 |
| NIBIB | 2,969 | 0.9 | 18.3 | 1.2 | 7.8 | 9.7 | 6.1 |
| NIA | 2,433 | 0.9 | 11.5 | 2.2 | 23.6 | 16.4 | 4.8 |
| NIAMS | 2,464 | 1.4 | 16.3 | 2.5 | 15.2 | 7.5 | 3.6 |
| NIMH | 2,675 | 1.4 | 8.3 | 2.8 | 28.2 | 19.2 | 5.2 |
| NEI | 1,822 | 0.7 | 18.9 | 2.6 | 14.9 | 11.3 | 4.3 |
| NIEHS | 1,669 | 0.8 | 16.9 | 2.8 | 18.6 | 11.2 | 7.1 |
| NIDA | 1,721 | 2.5 | 5.1 | 3.2 | 33.2 | 25.6 | 5.5 |
| NIDCR | 1,164 | 0.9 | 13.8 | 2.4 | 13.6 | 11.4 | 5.2 |
| NIDCD | 917 | 0.3 | 7.8 | 2.7 | 18.3 | 14.4 | 4.6 |
| NHGRI | 843 | 0.3 | 15.8 | 1.1 | 9.8 | 4.8 | 3.8 |
| NINR | 511 | 1.9 | 9.0 | 1.6 | 31.4 | 20.6 | 5.8 |
| NCCIH | 592 | 4.5 | 21.6 | 1.4 | 21.6 | 15.9 | 5.9 |
| NIAAA | 762 | 3.0 | 14.3 | 1.4 | 25.1 | 15.5 | 6.3 |
| NLM | 566 | 0.8 | 19.4 | 1.5 | 12.4 | 13.2 | 8.7 |
| NIMHD | 243 | 11.2 | 18.5 | 4.2 | 29.4 | 28.9 | 32.4 |
| Average | 1.1 | 16.0 | 2.0 | 17.4 | 10.8 | 4.5 |
NOTE: IC = institute/center; PI = principal investigator.
SOURCE: Application data provided by NIH.
TABLE 4-7 NIH SBIR/STTR Programs: Differences across ICs in Application Shares from Underrepresented Groups 2012–2019
| IC (in order of decreasing SBIR/STTR program size) | Number of Applications | Percentage of Applications | |||||
|---|---|---|---|---|---|---|---|
| PI is African American | PI is Asian | PI is Hispanic or Latine | PI is a Woman | Owner is a Woman | Owner is from a Socially or Economically Disadvantaged Group | ||
| NCI | 10,046 | 1.1 | 20.5 | 2.1 | 15.3 | 12.0 | 3.3 |
| NIAID | 7,693 | 1.1 | 15.3 | 2.9 | 17.5 | 9.9 | 2.6 |
| NHLBI | 6,226 | 1.2 | 16.1 | 3.5 | 13.6 | 11.4 | 3.5 |
| NIGMS | 4,596 | 0.7 | 20.3 | 2.9 | 12.4 | 9.2 | 3.6 |
| NIDDK | 4,265 | 1.5 | 16.5 | 2.9 | 15.5 | 11.0 | 4.5 |
| NINDS | 3,506 | 0.7 | 16.1 | 2.6 | 12.7 | 10.5 | 2.9 |
| NICHD | 3,037 | 1.7 | 14.0 | 2.2 | 23.4 | 21.0 | 4.3 |
| NIBIB | 2,317 | 1.5 | 18.1 | 3.4 | 9.1 | 11.7 | 4.6 |
| NIA | 3,040 | 1.1 | 15.5 | 2.6 | 18.3 | 16.3 | 4.6 |
| NIAMS | 2,031 | 0.8 | 16.4 | 1.5 | 14.3 | 12.1 | 3.0 |
| NIMH | 1,764 | 1.7 | 10.2 | 1.8 | 25.0 | 21.1 | 4.1 |
| NEI | 1,656 | 1.1 | 17.1 | 2.7 | 11.1 | 14.8 | 5.8 |
| NIEHS | 1,312 | 0.9 | 17.8 | 4.1 | 14.9 | 15.6 | 4.8 |
| NIDA | 1,421 | 3.2 | 13.0 | 2.0 | 23.6 | 21.9 | 5.1 |
| NIDCR | 805 | 0.9 | 19.2 | 1.8 | 14.5 | 13.2 | 3.3 |
| NIDCD | 657 | 0.8 | 9.3 | 5.3 | 21.3 | 14.6 | 2.2 |
| NHGRI | 665 | 0.3 | 17.9 | 3.8 | 12.2 | 7.0 | 3.4 |
| NINR | 662 | 2.3 | 8.9 | 0.6 | 21.4 | 20.7 | 9.3 |
| NCCIH | 475 | 2.1 | 18.1 | 4.4 | 19.8 | 16.4 | 6.1 |
| NIAAA | 503 | 2.3 | 12.9 | 2.6 | 27.9 | 19.5 | 5.7 |
| NLM | 215 | 0.4 | 9.3 | 1.5 | 16.2 | 14.9 | 4.5 |
| NIMHD | 660 | 10.4 | 11.2 | 9.5 | 31.4 | 31.0 | 23.9 |
| NCATS | 749 | 0.6 | 17.4 | 1.6 | 18.8 | 18.1 | 4.9 |
| ORIP | 499 | 3.1 | 15.9 | 3.3 | 16.2 | 15.9 | 8.0 |
| Average | 1.3 | 16.7 | 2.8 | 16.2 | 13.2 | 4.0 |
NOTE: IC = institute/center; PI = principal investigator.
SOURCE: Application data provided by NIH.
TABLE 4-8 NIH SBIR/STTR Programs: Success Rates by Race of Principal Investigator (PI)
| Race of PI | Fiscal Years 2001–2011 | Fiscal Years 2012–2019 | ||
|---|---|---|---|---|
| Percentage of applications funded | Number of observations | Percentage of applications funded | Number of observations | |
| White | 23.9 | 39,835 | 20.4 | 27,929 |
| Asian | 18.8 | 10,582 | 17.2 | 8,910 |
| Unknown | 15.8 | 9,126 | 8.1 | 10,556 |
| Withheld | 21.8 | 2,939 | 19.4 | 4,123 |
| African American | 12.1 | 705 | 13.6 | 734 |
| More than one race | 18.9 | 663 | 20.8 | 567 |
| American Indian | 15.1 | 106 | 20.9 | 91 |
| Native Hawaiian | 23.1 | 65 | 12.9 | 31 |
| Total | 21.6 | 64,021 | 17.2 | 52,941 |
SOURCE: Application data provided by NIH.
commercialization. The successful conversion of a project from Phase I to Phase II requires three steps: (1) the Phase I project must show significant progress in meeting its Phase I goals; (2) the Phase I awardee must apply for a Phase II grant for that same project; and (3) the Phase II application must be approved.
The committee calculated a “conversion rate,” defined as the number of funded Phase II applications divided by the number of Phase I awardees applying for Phase II. The conversion rate for a given year, therefore, represents the proportion of successful Phase I applications that eventually were converted to Phase II.20 The measure thus incorporates both the Phase II success rate and the proportion of Phase I winners who pursue Phase II funding. It also includes Phase I and II revisions; that is, an application initially failing at either the Phase I or II stage might later be revised successfully and then included in the calculation. NIH allows applicants up to 3 years to submit Phase II applications after their initial Phase I award.
Of course, given the high risk and early stage of Phase I projects, a 100 percent conversion rate would suggest that the agency was not taking sufficient risk. The overall conversion rate fluctuated over the sample period but was lower from 2008 to 2019 than between 2001 and 2007 (Joshi et al., 2018). Because
___________________
20 Note: This metric is not equivalent to Phase II success rates. The latter gives the proportion of Phase II applications that were successful, while the former gives the proportion of successful Phase I awards whose recipients both applied for and received a Phase II award. The conversion rate can deviate from the average success rate of Phase II applications for a number of reasons, such as the number of applicants who resubmit an initially failed Phase II application, the number of Direct-to-Phase II applicants, and changes in the number of applicants over time.
success rates for Phase II applications declined over time, it is not surprising that the conversion rates also declined (see Table 4-9). STTR conversion rates fluctuated greatly, likely because of the volatility associated with a smaller program, whereas SBIR conversion rates steadily declined. These conversion rates reinforce the general picture of the SBIR/STTR programs becoming more competitive over time.
Distribution of Phase I and Phase II Awards across SBIR versus STTR
Over the sample period, the relative proportions of NIH SBIR and STTR awards changed. STTR’s share of Phase I awards increased substantially (Table 4-10), with the number of STTR Phase I awards more than doubling. The number of STTR Phase II awards also grew more rapidly relative to SBIR Phase II awards:
TABLE 4-9 NIH SBIR/STTR Programs: Changes in Rates of Phase I to Phase II Conversion by Program
| Fiscal Year | Overall Conversion Rate (weighted average, percent) | SBIR Conversion Rate (percent) | STTR Conversion Rate (percent) |
|---|---|---|---|
| 2001 | 31.5 | 32.5 | 21.7 |
| 2002 | 29.8 | 30.0 | 27.8 |
| 2003 | 29.4 | 28.7 | 36.4 |
| 2004 | 26.2 | 27.5 | 20.1 |
| 2005 | 28.4 | 29.3 | 24.0 |
| 2006 | 29.7 | 29.6 | 30.1 |
| 2007 | 28.7 | 29.8 | 22.9 |
| 2008 | 23.9 | 24.1 | 23.0 |
| 2009 | 20.7 | 21.8 | 14.1 |
| 2010 | 21.2 | 21.2 | 20.6 |
| 2011 | 25.0 | 24.3 | 29.8 |
| 2012 | 22.9 | 22.8 | 23.4 |
| 2013 | 20.7 | 21.5 | 17.2 |
| 2014 | 21.9 | 22.8 | 18.0 |
| 2015 | 23.6 | 23.5 | 24.0 |
| 2016 | 24.8 | 25.7 | 22.0 |
NOTE: Because there is a 3-year gap between the time at which Phase I awards were granted and the required date of Phase II applications, the table displays annual conversion rates only up to 2016.
SOURCE: Application data provided by NIH.
the number of STTR Phase II awards nearly tripled (from 56 to 133 awards), whereas the number of SBIR Phase II awards increased by about 50 percent (from 719 to 1,023).
A different picture of program growth emerges when one looks at total spending for each program. As Figure 4-1 illustrates, the greatest growth in dollars was for SBIR Phase II awards, especially those after 2011. This rise in SBIR Phase II spending was likely due to an increase in the maximum Phase II award amount. Although the standard amount for a Phase II award is $750,000 per year for 2 years ($1.5 million in total), the vast majority of ICs have received waivers from these caps for particular diseases or topics. While conversations with IC
TABLE 4-10 Allocation of Phase I and II Awards across NIH SBIR versus STTR Programs
| Fiscal Year | Number of Awards | |||
|---|---|---|---|---|
| SBIR Phase I | STTR Phase I | SBIR Phase II | STTR Phase II | |
| 2001 | 901 | 97 | 719 | 56 |
| 2002 | 949 | 90 | 844 | 62 |
| 2003 | 1,075 | 99 | 848 | 56 |
| 2004 | 1,087 | 234 | 852 | 82 |
| 2005 | 908 | 179 | 802 | 99 |
| 2006 | 775 | 166 | 844 | 95 |
| 2007 | 752 | 144 | 839 | 105 |
| 2008 | 848 | 135 | 831 | 114 |
| 2009 | 843 | 149 | 880 | 143 |
| 2010 | 824 | 131 | 801 | 121 |
| 2011 | 662 | 94 | 717 | 95 |
| 2012 | 795 | 137 | 669 | 107 |
| 2013 | 647 | 157 | 638 | 95 |
| 2014 | 780 | 195 | 679 | 93 |
| 2015 | 647 | 183 | 751 | 100 |
| 2016 | 634 | 214 | 826 | 114 |
| 2017 | 639 | 196 | 921 | 121 |
| 2018 | 765 | 245 | 1,019 | 130 |
| 2019 | 786 | 230 | 1,023 | 133 |
SOURCE: Application data provided by NIH.
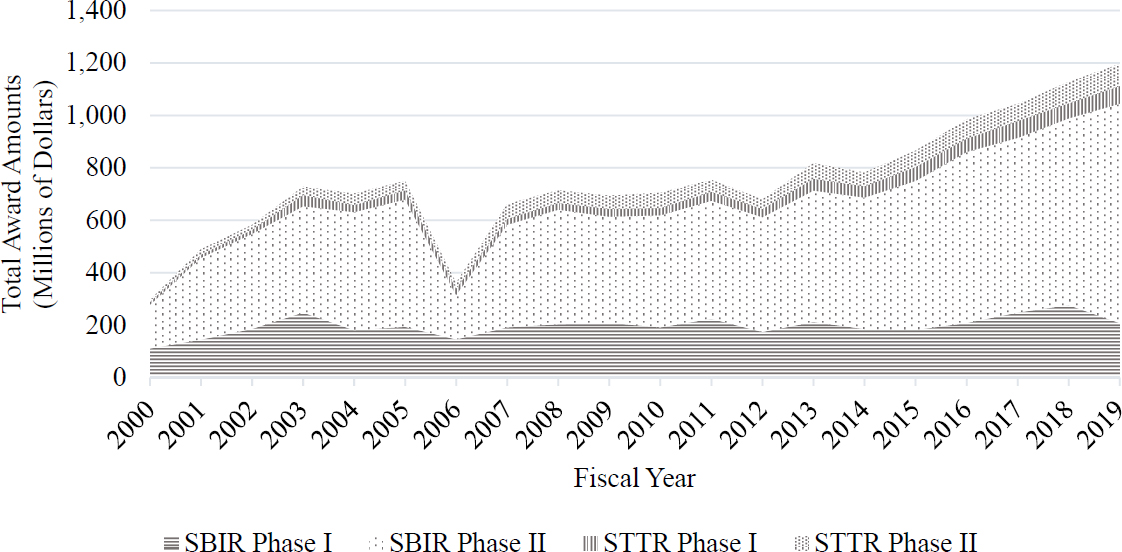
SOURCE: Based on data from NIH RePORTER.
SBIR/STTR program managers did not indicate differences in programmatic goals between SBIR and STTR, ICs may be spreading their STTR funding across a wider range of participants because the projects may be earlier in the innovation and commercialization cycle relative to SBIR projects.
Special Award Types
In addition to Phase I and Phase II, NIH funds a handful of special award types within the SBIR/STTR programs: Fast-Track, the oldest and most commonly used of these special types, is a mechanism designed to reduce the time lag between phases through the simultaneous review of Phase I and Phase II applications for a given project; Direct-to-Phase II allows small businesses to receive a Phase II award without a prior Phase I; and Phase IIB provides additional, follow-on funding for Phase II recipients whose projects require more time and effort for commercial development. Detail on the distribution of applications for these special award types is somewhat limited for two reasons: the small number of total applications and awards, particularly for Phase IIB and Direct-to-Phase II; and the inability to distinguish failed Fast-Track applications from failed Direct-to-Phase II applications in the raw application data the committee received from NIH.21
NIH does provide public access to detailed aggregate statistics on each of the three special award types from 2011 on. An excerpt from those statistics is shown in Table 4-11. This table shows that neither Phase IIB nor Direct-to-Phase II awards represent large shares of total applications or awards. It shows further that pursuit of Fast-Track awards grew: total Fast-Track applications nearly doubled from 2011 to 2018, whereas Fast-Track awards more than tripled over the same period, indicating a sizable increased use of the mechanism within NIH.
CHANGES IN PROGRAM SELECTIVITY OVER TIME
Total funding for the SBIR/STTR programs increased by more than 100 percent over the sample period, from $420 million in 2001 to $1.05 billion in 2019 (Table 4-12), an increase corresponding to a near doubling of applications received over the same period. However, as Table 4-12 shows, while the number
___________________
21 Fast-Track and Direct-to-Phase IIs awards are coded the same way in NIH’s grant numbering system. Thus a grant number beginning with the prefix “1R44” could be a either a Fast-Track or a Direct-to-Phase II. For funded grants, a Fast-Track will also correspond to a later “4R44,” but this does not help distinguish the two types within the failed application database. Funding amounts also were not available to the committee for failed applications, making distinction on that basis impossible as well. Furthermore, the data reported in this table reflect summary statistics that the committee was unable to replicate using either the public RePORTER or confidential application records. The use of the “1R44” prefix yields counts of funded “Fast-Track” applications much larger than NIH’s reported numbers in Table 4-12. It also yields counts of Direct-to-Phase II awards during years prior to NIH’s implementation of that program.
TABLE 4-11 NIH SBIR/STTR: Special Award Programs 2011–2019
| Fast Track | ||||
| Fiscal Year | Number of Applications Reviewed | Number of Applications Awarded | Success Rate (percent) | Total Funding (dollars) |
| 2011 | 451 | 46 | 10.20 | 10,873,804 |
| 2012 | 390 | 68 | 17.40 | 16,826,434 |
| 2013 | 355 | 61 | 17.20 | 16,523,514 |
| 2014 | 388 | 76 | 19.60 | 18,137,053 |
| 2015 | 398 | 76 | 19.10 | 20,329,454 |
| 2016 | 748 | 230 | 30.70 | 175,818,239 |
| 2017 | 624 | 116 | 18.60 | 37,755,632 |
| 2018 | 860 | 175 | 20.30 | 51,187,737 |
| 2019 | 772 | 178 | 23.10 | 61,098,527 |
| 2020 | 743 | 128 | 17.20 | 52,267,233 |
| Total | 5,729 | 1,154 | - | 460,817,627 |
| Direct-to-Phase II | ||||
| Fiscal Year | Number of Applications Reviewed | Number of Applications Awarded | Success Rate (percent) | Total Funding (dollars) |
| 2011 | N/A | N/A | N/A | N/A |
| 2012 | N/A | N/A | N/A | N/A |
| 2013 | N/A | N/A | N/A | N/A |
| 2014 | N/A | N/A | N/A | N/A |
| 2015 | 347 | 65 | 18.70 | 55,150,363 |
| 2016 | 621 | 83 | 13.40 | 22,214,429 |
| 2017 | 397 | 109 | 27.50 | 94,532,103 |
| 2018 | 0 | 0 | 0.00 | 0 |
| 2019 | 213 | 25 | 11.74 | 21,356,324 |
| 2020 | 588 | 112 | 19.00 | 103,621,112 |
| Total | 2,166 | 394 | - | 296,874,331 |
| Phase IIB | ||||
| Fiscal Year | Number of Applications Reviewed | Number of Applications Awarded | Success Rate (percent) | Total Funding (dollars) |
| 2011 | N/A | N/A | N/A | N/A |
| 2012 | N/A | N/A | N/A | N/A |
| 2013 | N/A | N/A | N/A | N/A |
| 2014 | N/A | N/A | N/A | N/A |
| 2015 | 34 | 13 | 38.24 | 11,708,214 |
| 2016 | 497 | 84 | 16.90 | 74,799,524 |
| 2017 | 53 | 21 | 39.62 | 18,813,316 |
| 2018 | 88 | 33 | 37.50 | 37,019,207 |
| 2019 | 97 | 42 | 43.30 | 46,087,199 |
| 2020 | 106 | 39 | 36.79 | 41,707,283 |
| Total | 875 | 232 | - | 230,134,743 |
SOURCE: NIH RePORTER, Table 215: NIH Small Business Innovation Research and Small Business Technology Transfer Grants: Competing Applications, Awards, Success Rates and Total Funding by Phase Made with Direct Budget Authority Funds, FY 2011-2020.
of total annual applications increased by 62.6 percent (with individual spikes of 80.4 percent in 2010 and 98.7 percent in 2016 relative to 2001 levels), the total number of awards increased by only 23.6 percent. In general, increases in program expenditures did not keep pace with increases in applications, resulting in an increase in program selectivity since 2001 (Joshi et al., 2018). Most of this increase can be accounted for by increased competition for STTR and Phase II grants. As shown in Table 4-12, the STTR acceptance rate dropped from 38 percent in 2001 to 17 percent in 2016. Moreover, the rate of successful conversion of a Phase I project to a Phase II award dropped from 31 percent to 25 percent over the same period, as was shown in Table 4-9. Although the mandated set-asides are a floor on the amount ICs must spend on the SBIR/STTR programs, the ICs did not respond to an increase in the number of high-quality proposals by increasing their spending on SBIR/STTR applications.
FIRST-TIME APPLICANTS AND MULTIPLE-AWARD RECIPIENTS
One of the most noteworthy shifts in the NIH SBIR/STTR landscape over the sample period was the decline in awards granted to multiple-award
TABLE 4-12 Changes in NIH SBIR/STTR Program Selectivity over Time
| Fiscal Year | Number of Applications | Overall Success Rate (percent) | SBIR Success Rate (percent) | STTR Success Rate (percent) |
|---|---|---|---|---|
| 2001 | 4,634 | 38 | 38 | 38 |
| 2002 | 5,170 | 38 | 37 | 43 |
| 2003 | 6,458 | 32 | 32 | 33 |
| 2004 | 7,942 | 28 | 27 | 40 |
| 2005 | 7,298 | 27 | 27 | 31 |
| 2006 | 6,611 | 28 | 29 | 24 |
| 2007 | 5,804 | 32 | 35 | 20 |
| 2008 | 5,560 | 35 | 37 | 24 |
| 2009 | 6,026 | 33 | 34 | 32 |
| 2010 | 8,359 | 22 | 22 | 30 |
| 2011 | 7,677 | 20 | 20 | 24 |
| 2012 | 6,960 | 25 | 24 | 31 |
| 2013 | 6,423 | 24 | 23 | 29 |
| 2014 | 6,490 | 27 | 27 | 26 |
| 2015 | 6,872 | 24 | 25 | 23 |
| 2016 | 9,210 | 20 | 20 | 17 |
| 2017 | 7,633 | 25 | 26 | 22 |
| 2018 | 7,676 | 29 | 29 | 26 |
| 2019 | 7,536 | 29 | 30 | 26 |
| Total | 130,339 | 27.5 | 27.8 | 27.9 |
SOURCE: Application data provided by NIH.
recipients. Often pejoratively referred to in the literature as SBIR “mills,” these firms present a dilemma to administrators seeking to balance the need to support new small businesses with the need to fund high-quality projects from known entities, both of which are important functions of the SBIR/STTR programs. The evidence suggests that NIH diverted more funding to firms that were new to the program relative to past recipients of multiple awards.
Awards to first-time applicants began rising after the 2011 reauthorization, increasing from roughly 17 percent to 21 percent of total annual award volume from 2012 to 2019. Figure 4-2 charts this trend, depicting a decline
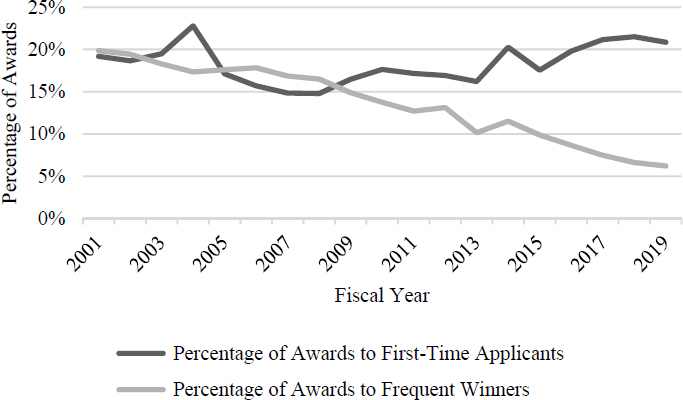
SOURCE: Based on applicant data provided by NIH.
in the share of total annual awards to multiple award winners22 from 20 percent to 6 percent.
First-time applicants have received little analytical attention in the SBIR/STTR literature. These applicants are likely to be newly incorporated and in the early stage of product commercialization, and thus may be in the best position to benefit from the SBIR/STTR programs. Using application data makes it possible to compare firms that did and did not have at least one successful application in their first year as an NIH SBIR/STTR applicant.
The committee found that over the sample period, not only did first-year applicants that received awards perform better in terms of total award volume over time, but they also experienced less time between awards (see Table 4-13). These differences are descriptive only and do not account for the fact that the lowest-quality firms are the most likely to fail in their first year. However, the substantial
___________________
22 The Committee defines a “multiple-award winner” as an award-winning small business that received 15 or more Phase I or II awards within NIH in the preceding 5 years. This definition follows that in the National Academies (NASEM, 2020) report on the Department of Energy’s SBIR/STTR programs and is an adaptation of the much more stringent definition put forth in a 1998 Government Accountability Office (GAO) report, which counted a firm as a “multiple-award recipient” only if it had won a Phase I award in a year in which it had also won 15 or more Phase II awards in the preceding 5 years. Since this latter definition results in a minuscule sample of firms, subsequent definitions have widened to include some additional repeat winners. The committee’s definition also allows more flexibility when dealing with newer versus older SBIR/STTR applicants. Other definitions have used award density based on total number of awards per year (Lanahan and Armanios, 2018), which is appropriate for more experienced firms, but less useful for newer firms that could be counted as frequent winners before they had accrued many awards at all.
edge gained by those who win in their first year suggests an opportunity for NIH to consider how it can support first-time applicants so as to improve their success rate, such as by expanding the Application Assistance Program described in Chapter 3.
GEOGRAPHIC DISTRIBUTION
The committee next looked at the geographic distribution of NIH SBIR/STTR applications and awards, normalized for each state’s population and its total number of NIH Research Project Grant (R01) awards for a given year. Normalizing for NIH R01 awards is the preferred means of comparison since it allows distinguishing outlier states from those states whose STTR/SBIR performance may simply mirror their overall pattern of NIH award activity.
Two charts (Figure 4-3) illustrate the geographic distribution of SBIR/STTR activity during the sample period using the following state-level metrics: (1) the relationship between a state’s SBIR/STTR activity and its R01 grant activity, (2) states’ overall success rate for SBIR/STTR applications, and (3) the total volume of SBIR/STTR activity normalized to both population and R01 activity. The first pattern that emerges is that a state’s overall research activity (as measured by R01 activity) is strongly correlated with its SBIR/STTR activity. However, the strength of this relationship decreases after the 2011 reauthorization, as shown by the decrease in the steepness of the trend line from the lefthand to the righthand figure in Figure 4-3. This gradual decoupling of SBIR/STTR activity from overall research activity provides evidence of increased use of the SBIR/STTR programs in areas not traditionally associated with large amounts of research funding. Montana, for instance, is a growing SBIR/STTR powerhouse, with high application success rates and a relatively large ratio of SBIR/STTR awards to overall R01 awards.
TABLE 4-13 NIH SBIR/STTR Programs: Effect of Receiving an Award in the First Year of Applying to the Programs
| Outcome | Effect on Total Number of Awards | Effect on Gap between First & Second Awards | ||
|---|---|---|---|---|
| Number of Phase I applications | Average number of awards | Number of Phase I applications | Average gap (years) | |
| Fail in first year | 18,838 | 0.553 | 10,008 | 0.934 |
| Succeed in first year | 4,267 | 5.978 | 3,832 | 0.671 |
| Total observations | 23,105 | 13,840 | ||
| Mean difference | −5.425a | 0.263a | ||
SOURCE: Application data provided by NIH.
a p <0.01.
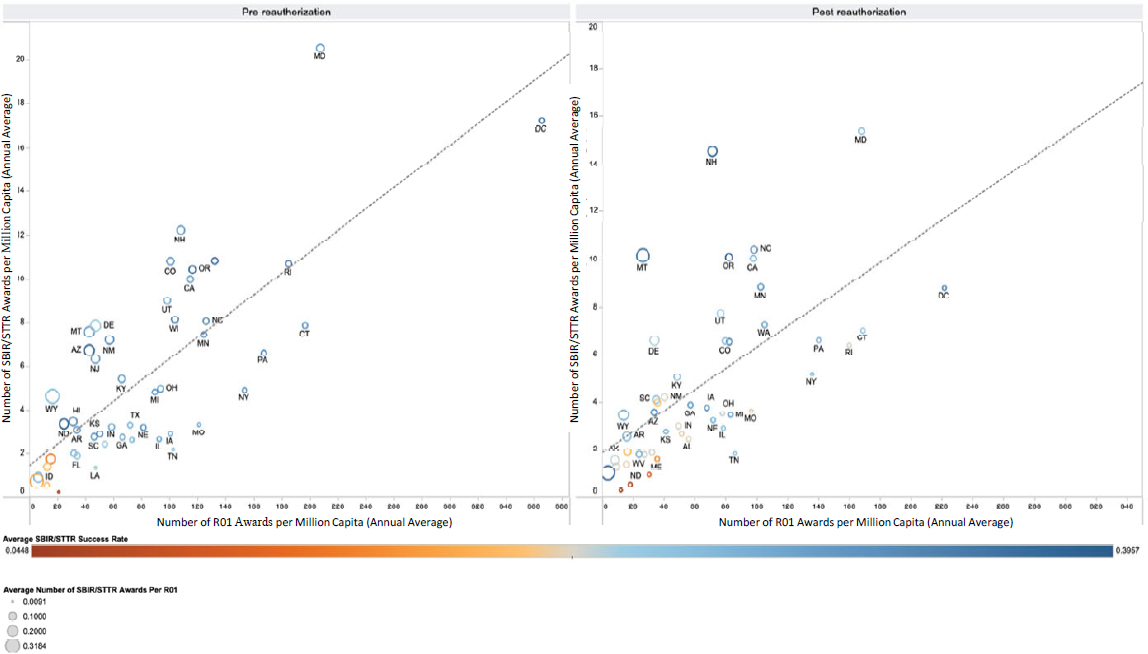
SOURCE: Based on applicant data provided by NIH and R01 data from NIH RePORTER.
Not shown in these graphs are the outliers—Massachusetts and Virginia—which predictably outperformed all other states as a result of their high concentrations of research activity and university clusters. These states’ shares of the total SBIR/STTR allocation did decrease slightly over the sample period. Massachusetts, for instance, saw its average annual SBIR/STTR awards per million capita drop from roughly 35 to 30 after the 2011 reauthorization.
Another basic trend emerging is that experience matters in SBIR/STTR success rates, such that states with higher average volumes of SBIR/STTR and R01 activity tend to see higher overall SBIR/STTR success rates. In Figure 4-3, circles are shaded on a color spectrum in which darker orange indicates success rates further below average, gray represents average rates, and darker blue corresponds to rates further above average. Again, Montana exemplifies this trend: as its SBIR/STTR award volume increased after the reauthorization, so, too, did its average application approval rating.
PATTERNS OF COLLABORATION
Since the SBIR program was created in 1982 through congressional enactment of the Small Business Innovation Development Act and the STTR program was established through the Small Business Research and Development Enhancement Act of 1992, one of the primary objectives of the programs has been to “foster and encourage participation in innovation and entrepreneurship by socially and economically disadvantaged persons and women-owned small businesses.”23 Additionally, the STTR program has an objective “to stimulate a partnership of ideas and technologies between innovative SBCs [small business concerns] and Research Institutions.”24 The committee’s statement of task requested “an evaluation of the effectiveness of the STTR program in stimulating new collaborations and any obstacles that may prevent or inhibit the creation of such collaborations.”25 While the committee would have liked to extend this analysis to include the SBIR program, it was constrained to analyzing collaborations between STTR awardee firms and their R&D partners because NIH did not provide data on collaboration between SBIR firms and their collaborators.
R&D collaborations between NIH SBIR/STTR awardees and nonprofit research institutions, such as universities, medical schools, and hospitals, are an essential element of the U.S. national system of innovation for the health care sector. This section provides a descriptive overview and summary statistics regarding the demographic composition of participating research institutions and the geographic distance separating them from their partnering awardee firms. The committee found low rates of program participation by various types of minority-serving institutions (MSIs) as formal R&D partners for STTR awardees, highlighting potential concerns with NIH’s outreach to both individuals (PIs and
___________________
23https://sbir.nih.gov/about/what-is-sbir-sttr#:~:.
firm owners) from underrepresented groups and organizations (MSIs) that are oriented toward supporting the educational needs of underrepresented communities.
Participation by Research Institution Type
Data for the 2011–2020 period show that 79.7 percent of Phase I awardees and 77.7 percent of Phase II awardees collaborated with universities as their formal R&D partner in the NIH STTR program. Approximately 27 percent of Phase I and 26 percent of Phase II NIH STTR R&D partnerships were with land-grant institutions. Among the academic institutions participating in the STTR program, 66 percent were public and 34 percent were private; 86 percent conferred medical degrees, and 48 percent operated hospitals. As shown in Table 4-14, MSIs had extremely low levels of participation as R&D partners for NIH STTR awardees during the sample period, and there appears to have been little discernible improvement in the overall participation rates across five major institution types: historically Black colleges and universities (HBCUs); predominately Black institutions; Hispanic-serving institutions (HSIs); Asian American, Native American, and Pacific Islander–serving institutions; and tribal colleges and universities.26 While few MSIs have medical schools or operate hospitals, about half of HBCUs have medical colleges.27 MSIs without medical college may be unable to provide specialized equipment, conduct laboratory experiments, or manage clinical trials to aid NIH STTR awardees in their technology transfer and commercialization activities. Despite these apparent limitations, a 2019 National Academies report identifies MSIs as producing 20 percent of the nation’s STEM bachelor’s degrees and as “an underutilized resource for producing talent to fulfill the needs of the nation’s current and future STEM workforce” (NASEM, 2019). HBCUs with medical schools are major sources of training for medical graduates who are African American or members of other underrepresented minority groups (Campbell et al., 2020). In a 2020 report, the National Academies recommends that the Department of Energy “actively take steps to ensure the diversity of the reviewer pools as a means to increase the diversity of the applicant pool” (NASEM, 2020, p. 8). NIH, either through the Center for Scientific Review or the individual ICs, could make similar efforts to add diversity to its reviewer pools, perhaps with faculty or advanced degree recipients from MSIs (Inouye et al., 2020b).
Geographic Distance and Collaboration Patterns
The committee also looked at geographic distance and collaboration patterns between awardees and research institutions for the 1,730 STTR awards
___________________
26https://cmsi.gse.rutgers.edu/content/brief-history-msis.
27 In 2018, 57 of about 112 HBCUs had medical colleges; https://hbcu-colleges.com/medical.
TABLE 4-14 Research Partner Participation in the NIH STTR Program, by Type of Minority-Serving Institution (MSI)
| Research Partner (Percentage of STTR Awardees) | |||||
|---|---|---|---|---|---|
| Time Period | HBCU | PBI | HSI | AANAPISI | TCU |
| 2001–2011 | 0.08 | 0.33 | 3.04 | 6.40 | 0.00 |
| 2012–2020 | 1.09 | 0.88 | 4.23 | 6.93 | 0.00 |
SOURCE: 4-14 – NIH RePORTER; GRID (Global Research Identifier Database); Rutgers MSI list, https://cmsi.gse.rutgers.edu/content/msi-directory.
NOTE: HBCU = historically Black college or university; PBI = predominately Black institution; HSI = Hispanic-serving institution; AANAPISI = Asian American, Native American, or Pacific Islander–serving institution; TCU = tribal college or university.
(1,372 Phase I and 358 Phase II) granted during 2012–2020. On average, the geographic distance between awardees and their formal institutional R&D partners was 419 miles—403 miles for Phase I awards and 479 miles for Phase II awards. This difference of +76 miles is marginally statistically significant (p <0.1) and indicates that in Phase II, awardees tend to engage with somewhat more distant partners compared with Phase I awardees.
Approximately 9 percent of NIH STTR awardees are collocated with their R&D partner institution in the same physical campus or facility; 44 percent are located within 10 miles of their partners; about 60 percent are within 50 miles; and 63 percent are within 100 miles. On average, minority-owned firms are located 629 miles from their R&D partner, compared with 403 miles for their non-minority-owned counterparts. This difference of +226 miles is statistically significant (p <0.001) and indicates that minority-owned firms tend to engage with partners that are substantially farther away compared with the R&D partners of their non-minority-owned counterparts. On average, woman-owned firms are located 366 miles from their R&D partner, compared with 427 miles for their non-woman-owned counterparts, although this difference of −61 miles is not statistically significant.
The large and statistically significant increase in partner distance for minority-owned STTR awardees may indicate that these firms must go further than non-minority-owned counterparts to obtain the same resources. Larger distances may inhibit collaboration and can lead to increased costs. On the other hand, this differential may also show that the STTR program is serving a useful function in enabling minority-owned firms to collaborate with more distant partners than would have been possible without the program.
In terms of available NIH resources for technical support, the average distance to the nearest NIH proof of concept center (POC) across all STTR awardees is 252 miles, to the nearest NIH Center for Accelerated Innovations (NCAI) is 266 miles, and to the nearest NIH Research Evaluation and Commercialization Hub (REACH) is 294 miles. Because these centers appear to be located much closer to awardees relative to their R&D partners, the technical resources they offer may mitigate awardees’ distance-related challenges in collaborating with their R&D partners.
Almost 3 percent of NIH STTR awardees are collocated within an NCAI; overall, about 29 percent of awardees are located within 50 miles of an NCAI member institution, and about 37 percent are located within 100 miles. Fewer than 2 percent of NIH STTR awardees are collocated with a REACH center; approximately 17 percent are within 50 miles of a REACH member institution, and 24 percent are within 100 miles. Although fewer than 1 percent of NIH STTR awardees are collocated with POCs, nearly 33 percent of awardees are within 50 miles of a POC member institution, and more than 41 percent are within 100 miles. Some STTR awardees engage in formal R&D partnerships with institutions that are members of NIH centers: about 8 percent with NCAI center members, about 3 percent partner with POC members, and about 3 percent with an institution that is a primary or secondary affiliate of a REACH center.
The nationwide network of federally funded Minority Business Development Agency (MBDA) centers and state-funded business assistance centers may also be available to STTR awardees. Minority-owned firms are located, on average, 73 miles away from the nearest federally funded MBDA center and 60 miles away from the nearest state-funded business assistance center. Woman-owned firms are located, on average, 57 miles away from the nearest state-funded business assistance center. Thus, firms whose owners are members of underrepresented or socioeconomically disadvantaged groups may have access to other relevant resources that are much closer relative to their R&D partners in the STTR program.
MISSING PATENT DATA
In addition to missing demographic data that could be improved by linking NIH’s application records to the SAM database, as discussed above, the committee found that the patent data in the RePORTER database could be improved by checking the reported data against and linking them with other government databases. In principle, the NIH RePORTER database should include all patents from the U.S. Patent and Trademark Office (USPTO) database in which an NIH SBIR/STTR award is mentioned in the “government interest” statement that is part of a patent filing.28 However, the committee found that SBIR/STTR awardees do not report their patents accurately to NIH and therefore the RePORTER database is incomplete.
Overall, the committee found 35,713 NIH-funded patents listed in patent government-interest statements (linking to one or more extramural grant numbers). Of these, about 8 percent were linked to an SBIR/STTR award. However, as shown in Figure 4-4, the propensity to report back to NIH (as
___________________
28 Under the Bayh-Dole Act of 1980 and its modification, although the inventor retains U.S. patent rights for inventions funded by the federal government, the inventor is required to file a “government interest” statement for any patent granted by the USPTO for inventions funded, at least in part, by a federal research grant or government contract. This statement identifies the award and agency that supported the creation of the invention.
indicated by RePORTER listings) is much lower for SBIR/STTR awards than for other NIH awards. Only 30 percent of the patents resulting from SBIR/STTR awards were reported back to the agency, compared with 64 percent of other awards (mainly R01s). Looking only at reported outcomes misses a substantial share of output.
One likely reason for this underreporting is the lag between the first year of an SBIR/STTR grant and the patent application. The committee found that patents with later filing dates relative to grant start dates were less likely to be reported. In addition, firms with multiple awards are much more likely to report their patents to NIH. This differential could reflect either organizational capabilities or resources, with certain firms being better able to manage the administrative burdens associated with reporting. It could also reflect strategy: firms expecting to return to the program for funding may be more likely to be diligent in their reporting. Of interest, STTR awardees were much more likely than SBIR awardees to report their patents (41 percent versus 28 percent), a finding consistent with either of these explanations. Better data on such outcomes as patents could easily be obtained by linking the data with other government databases.
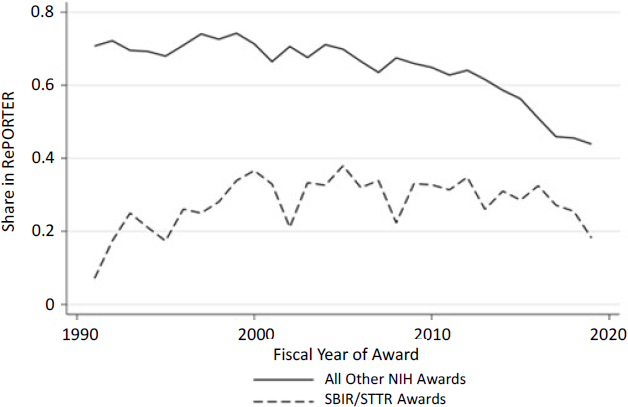
SOURCE: Committee calculations based on data from NIH RePORTER and USPTO.
SUMMARY
The discussion in this chapter points to large, persistent disparities in NIH’s allocation of SBIR/STTR awards despite the programs’ mandate to improve outreach to underrepresented groups, with little indication of change in this trend over time. Exceptions to this trend include increased funding to first-time winners relative to multiple-award winners, as well as increased funding for topics related to women’s and minority heath. Analysis of patterns of collaboration in the STTR program corroborates the finding of a lack of improvement in diversity measures. The proportions of STTR collaborations with HBCUs and HSIs as R&D partners have not increased over the past two decades.
Both STTR and Phase II awards have garnered increasing shares of total program activity since 2001, and both have become increasingly competitive. On average, STTR awards are more likely to go to Phase I awardees, while the bulk of SBIR funding goes to Phase II awards.
The strength of the relationship between a U.S. state’s overall NIH research productivity, as measured by the number of R01 awards per capita, and per capita SBIR/STTR awards has decreased since the 2011 reauthorization. This decrease indicates an increased role for the program in spurring innovation outside of traditional research centers.
Finally, analysis of NIH data on the SBIR/STTR programs indicates that better data on the programs could be produced by linking the data in the RePORTER database with other government datasets.
FINDINGS AND RECOMMENDATIONS
Finding 4-1: Persistently low levels of NIH SBIR/STTR program participation among women and minorities remain a major unresolved challenge for NIH.
Finding 4-2: Additional funding does not improve representation of women or minorities in terms of receiving NIH SBIR or STTR awards. Additional funding from the American Recovery and Reinvestment Act of 2009 did not improve the success rates of female principal investigators, and the proportion of women and minorities among SBIR/STTR applicants is no greater in larger than in smaller NIH ICs.
Finding 4-3: Minority-serving institutions—including historically Black colleges and universities; predominately Black institutions; Hispanic-serving institutions; Asian American, Native American, and Pacific Islander–serving institutions; and tribal colleges and universities—have extremely low levels of participation as research partners for NIH STTR-awarded firms.
Finding 4-4: NIH’s RePORTER database can be supplemented with information from government data, such as demographic information on applicants from the System of Award Management and patenting data from the U.S. Patent and Trademark Office.
Recommendation 4-1: NIH SBIR/STTR program managers should improve outreach to minority-serving institutions. For example, the Center for Scientific Review and the individual ICs should increase the diversity of their reviewer pools for the SBIR/STTR programs by drawing on faculty or advanced degree recipients from such institutions, which could also help broaden the diversity of the programs’ applicant pools.
Recommendation 4-2: The NIH director should require that the NIH RePORT Support Team work to ensure that data in RePORTER are consistent with other government data on commercial outcomes of SBIR/STTR awardees, such as data available from the U.S. Patent and Trademark Office government-interest statements.
This page intentionally left blank.


