
3
Diversity of NASA Competed Missions Teams and Space Science Workforce
Not only must the mission proposal development and review process be fair and unbiased, but a diverse proposer pool is needed to supply diverse teams for competed space missions. Several studies have demonstrated that multiple forms of diversity (i.e., cognitive, experiential, and demographic) are beneficial to the creativity, innovation, and impact of science teams (Campbell et al. 2013), provided that the challenges that often come with diverse teams are anticipated and addressed adequately (Joshi 2014; NRC 2015). Diverse teams thrive in inclusive environments where all team members feel welcomed, supported, and valued, and where mutual respect and interpersonal trust exist within the group (Hall et al. 2018). Additionally, ensuring that team members feel a sense of psychological safety (Edmondson 2004) helps create the conditions in which diverse teams perform effectively. Evidence further suggests that a critical mass of team members from historically minoritized and underrepresented groups is necessary to realize the benefits of that diversity (i.e., comprising between 15% and 30% of the team) (Cain and Leahy 2014). Though social scientists continue to try to understand how specific forms of diversity (e.g., racial/ethnic, gender, career stage diversity) relate to various aspects of team performance, it is generally understood that, when engaged productively in an inclusive environment, diverse perspectives, experiences, and backgrounds can strengthen teams, leading to better science (Sommers 2006). As noted by the Astronomy and Astrophysics Decadal Survey (Astro2020), “the pursuit of science, and scientific excellence, is inseparable from the humans who animate it” (NASEM 2021, p. 3-1). Similarly, the National Aeronautics and Space Administration’s (NASA’s) Vision for Scientific Excellence notes, “diversity is a key driver of innovation and more diverse organizations are more innovative…. NASA believes in the importance of diverse and inclusive teams to tackle strategic problems and maximize scientific return” (NASA 2020b).
IMPORTANCE OF DEMOGRAPHICS DATA: QUALITY AND QUANTITY
Science conducted in teams is a foundational aspect of NASA’s missions. Many of the science questions and engineering feats essential to addressing these questions require the broad range of knowledge, technical expertise, and disciplinary perspectives often found on science teams. To accomplish the goal of such diverse NASA mission teams, the various forms of diversity to be reflected in these teams would first need to be measured and quantified. Currently, the demographic information gathered on mission proposal teams by NASA Science Mission Directorate (SMD) is mostly limited to gender or sex, often inferred, and sometimes conflating the two categories (see Chapter 1, Box 1.3 for definitions of these terms). There is little discussion of race or ethnicity in the data
provided to the committee by NASA. Additionally, while NASA’s Solicitation and Proposal Integrated Review and Evaluation System (NSPIRES) does ask questions about race, ethnicity and disability status for proposers (see Annex 3.A), none of these factors were reported in a recent NASA study of demographic makeup of Astrophysics Explorer-class mission teams (Centrella et al. 2019).
The people leading proposal teams for competed missions are generally space scientists who have worked on previous missions, on scientific instruments to fly on space missions, and/or have been supported on research and analysis (R&A) grants. Thus, to understand the diversity of the leadership of competed space missions, accurate demographic data need to be collected and analyzed on the leadership and team membership of missions, on grant proposers, as well as the research workforce across the four science divisions of NASA’s SMD: Astrophysics, Heliophysics, Earth Science and Planetary Science.
In this chapter, the demographics data gathered by the NASA SMD Data Analytics Team (led by Michael New, Deputy Associate Administrator for Research, NASA Headquarters) from competed mission proposals are compared with data gathered through NSPIRES which is overseen by NASA’s Office of the Chief Scientist. These data are compared to the demographic data available on the space science workforce from surveys performed by professional organizations such as the American Institute of Physics (AIP) and federal agencies like the National Science Foundation, as well as with demographics of the U.S. science and engineering (S&E) workforce and overall U.S. population. SMD’s two other science divisions (Biological and Physical Sciences Division and Joint Agency Satellite Division), are not included in this study because these divisions do not have competed missions. Nevertheless, the benefits of gathering comprehensive demographics data for this specific workforce likely also apply across the whole agency.
It should be noted that both the quality and quantity of data gathered by NASA and in workforce surveys are highly variable. Indeed, Astro2020 (NASEM 2021) devoted a section and two high-level recommendations directing the agencies (including NASA) to systematically and deliberately collect and analyze demographics data across the portfolio of activities (see Astro2020 Section 3.3.6). Annex 3.A provides examples of the questions asked by NASA and AIP to collect demographic information as well as a discussion of the issues involved. See Chapter 6 for comparison with the methods applied by other agencies to gather such data and lessons to be learned therefrom.
DEMOGRAPHICS OF MISSION PROPOSERS ACROSS THE FOUR SMD SCIENCE DIVISIONS
As discussed in Chapter 1, the first AO for a fully competed and totally PI-led mission (as we know them today) was the Planetary Division’s Discovery AO released in 1994. For the first few years, the number of opportunities were limited. By 2006 most divisions were regularly issuing AOs for competed missions. Since 1996, there have been 701 mission proposals submitted to NASA, of which 143 were selected.
Over the same period, there were 232 proposals submitted for instruments on flagship missions (usually led by a NASA center) of which 46 were selected. The NASA SMD Data Analytics Team have examined these 933 proposals to gather statistics on how demographics of the proposal teams varies with SMD division, size of mission, and year of submission (Jensen and Pappas 2021). For this report, the scope is limited to proposals submitted in the past decade (2010-2019) since the primary interest is the current proposal process. Table 3.1 shows the number of proposals submitted during this time period for missions of various sizes (categorized by maximum cost) plus instruments for flagship missions. Missions of opportunity (MOs) can be an open call for hardware—a small, development spacecraft or an instrument, or contribution to a non-U.S. mission.
It is important to note that the (binary) gender—woman/man (W/M)—of mission proposal personnel were derived via two steps: (1) the NSPIRES system provided full names, team member roles, and institutions for all proposal personnel; (2) genders of team members were obtained from their first names using the online tool Gender API1 (team members having the first (given) names with reported accuracy of 95% or higher for inferred gender were assigned to the binary W/M categories; otherwise, binary gender was determined using public domain
___________________
1 See https://gender-api.com, which uses first names to infer binary woman/man gender from a database of over 2.1 million names, covering 178 countries.
TABLE 3.1 Submissions and Selections Between 2010 and 2019 Across SMD and for PIs Inferred to Be Women (W PI) for Different Mission Sizes
| Mission Size | Cost Cap | Number of AOsa | Number of Proposals | %W PI Proposed | Number Selected | % Selected | %W PIb Selected |
|---|---|---|---|---|---|---|---|
| MO/Instrument | <$125 million | 21 | 326 | 11% | 65 | 20% | 12% |
| Small | <$250 million | 5 | 89 | 4% | 18 | 20% | 0% |
| Medium | <$750 million | 5 | 97 | 23% | 24 | 25% | 46% |
| Large | >$750 million | 1 | 12 | 42% | 4 | 33% | 50% |
| Mission Total | 11 | 198 | 16% | 46 | 23% | 28% | |
| Overall Total | 32 | 524 | 13% | 111 | 21% | 19% |
NOTE: MO = Mission of Opportunity.
a Some announcements of opportunity include more than one mission size.
b Percentage of selected proposals with woman as PI.
SOURCE: Heidi Jensen and Lorenzo Pappas, NASA Science Mission Directorate.
searches). As it relates to career stage for team members, public domain searches of curricula vitae (CVs) were made to determine the number of years since PhD—a proxy for career age—for each member. For all discussions in this chapter, only de-identified versions of these data were provided to the committee.
Award Rates
The average rates at which mission proposals (across all of SMD) are selected for funding range from 20% to 33%, depending on mission size. The percentage of proposals submitted by a woman PI range from 4% (for small missions) to 42% (for large missions) while the percentage of successful proposals with a woman PI range from 0% (for small missions) to 50% (for large missions) as shown in Table 3.1. To further explore this wide range of success rates, particularly for women PIs, the proposals were categorized according to the specific SMD division to which they were submitted. Table 3.2 shows the distribution of 524 proposals submitted (2010-2019) across the four SMD science divisions for different mission sizes, separated by inferred gender of the PI and whether funded or not. The total number of proposals in each mission class were similar for Astrophysics (total 101, 7% women PIs) and Heliophysics (total 96, 8% women PIs). Earth Science had only small missions and MOs (total 108, 5% women PIs) in this time period, and in Planetary Science there were no small missions (which are usually limited to Earth orbit) in this time period, while there were a number of instrument and medium missions (total 219, 22% women PIs).
Most notable is that there were no women PIs funded in Astrophysics and Earth Science during this time-period (see Table 3.2), while in both Heliophysics and Planetary Science ~38% of proposals submitted by women were
TABLE 3.2 Number of Proposals Funded and Denied Between 2010 and 2019 for Each NASA Science Mission Directorate Science Division and Inferred Gender of Principal Investigator
| Total 524 |
Astrophysics 101 |
Earth Science 108 |
Heliophysics 96 |
Planetary Science 219 |
||||
|---|---|---|---|---|---|---|---|---|
| Funded | Denied | Funded | Denied | Funded | Denied | Funded | Denied | |
| Men | 22 | 72 | 11 | 92 | 30 | 58 | 27 | 144 |
| Women | 0 | 7 | 0 | 5 | 3 | 5 | 18 | 30 |
| Total | 22 | 79 | 11 | 97 | 33 | 63 | 45 | 174 |
SOURCE: Heidi Jensen and Lorenzo Pappas, NASA Science Mission Directorate.
funded. Using Fisher’s exact test (Mehta and Patel 1983) for count data, preferred in situations when cell counts are small, the null hypotheses that funding rates are the same for men and for women are tested for each SMD division separately. For Astrophysics, Earth Science, and Heliophysics, all respective p-values were greater than 0.3. That is, considering all submissions to these divisions over 2010-2019, Fisher’s exact tests show no evidence that funding rates vary by gender in Astrophysics, Earth Science, and Heliophysics. Note, however, that even if there were differences in funding rates, detecting them with statistical significance is impossible due to the small number of proposal submissions from women PIs in these three divisions. For example, in Astrophysics, given a total of 94 submissions by men PIs with 22 of those being funded, detecting a statistically significant (at the 0.05 level) difference in funding rates by gender would only be possible if there were 15 or more total submissions by women PIs. For Planetary Science, on the other hand, the overall number of proposal submissions between 2010-2019 is about twice as large, and the number of submissions from women PIs is at least five times as large as in other divisions, and the p-value of Fisher’s exact test is 0.002. Thus, in Planetary Science, between 2010-2019, the funding rate for women was significantly greater than the funding rate for men. In fact, if the funding rates were the same, only about 10 women out of 48 that submitted competed mission proposals as PIs in Planetary Science would have been expected to be funded. In the analysis of the data, it is noted that there were 18 women PIs funded in Planetary Science between 2010-2019 (see Table 3.2).
The above analysis is presented for illustrative purposes and is accompanied by several caveats in interpretation. In addition to difficulties detecting statistical significance due to small numbers of submissions by women PIs in three out of four SMD divisions, the analysis is also limited in other aspects. First, the aggregated summary does not reflect important dependencies on, for example, mission size, submission year, or specific AO. These are all important confounders and there are likely to be others. Some parameters, such as mission size, were available to the committee, while other specifics such as individual AO and submission year were not. Second, the same individual PIs could have had multiple submissions among funded, denied, or both denied and funded proposals counted in Table 3.2, and PI individual identifiers were not available. Additionally, significant associations can disappear, get stronger, or reverse the direction when data is disaggregated (Blyth 1972). While appropriate choice of the control variables is an important part of any research study (Agresti 2003) it is beyond the scope of this committee’s task.
Additionally, the lack of statistically significant differences by gender should not be interpreted as an indication of a lack of gender bias in the review process. Assessments of the presence or lack of gender bias in these decisions would require more information about the qualifications and experience of the PIs in question, and no such data are available. Research on gendered patterns in science, technology, engineering, and mathematics (STEM) specifically, and gendered labor force patterns more broadly, demonstrates that women are often less likely than men to consider themselves qualified for funding, awards, or job applications, even when they have identical credentials (Waisbren et al. 2008; Moss-Racusin and Rudman 2010; Goulden et al. 2011; Mijid 2014). If the women PIs were more qualified than the men PIs who submit mission proposals, then the lack of significant gender patterns would indicate gender bias because women would have been held to a higher standard than men to have the same chances for an award (Pohlaus et al. 2011). In short, identifying the existence or absence of gender bias in the proposal assessment process would require in-depth analyses involving proposal-specific and PI-specific information.
The committee acknowledges that there is no easy solution that would ensure unbiased and fair allocation of competed mission funding with respect to gender, racial, ethnic, and other historically marginalized groups within the complicated and high stakes proposal development and review process employed by NASA (see Chapter 2). Because of the ways in which social group identities can be tied to research qualifications and experience, it is crucial to continuously evaluate the process and compare with current research about social disparities in science’s interwoven reward systems, as well as involve experts who specialize in the complicated ways in which disparities associated with historically marginalized groups manifest themselves in society (Lee et al. 2020).
Pathways
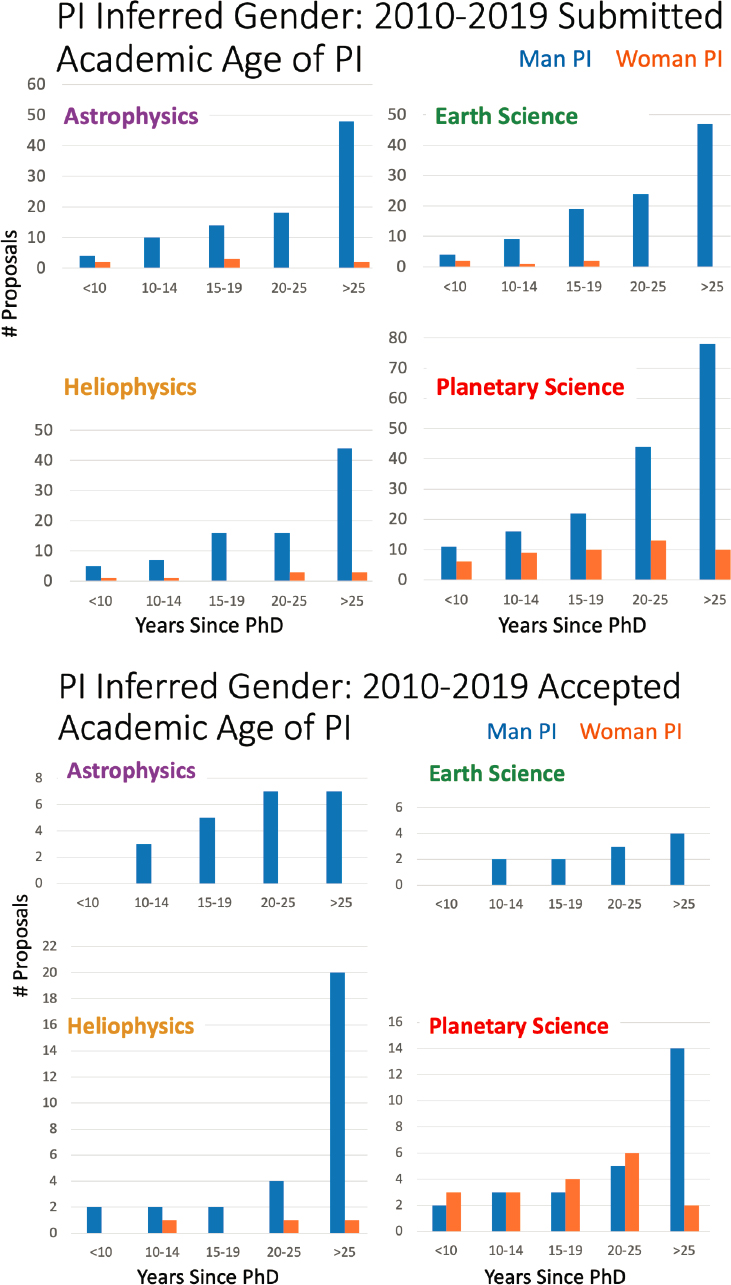
To understand the career pathway to becoming a PI of a competed mission, the academic age of PIs (categorized as the number of years since PhD of the PI at the time of proposal submission) is assessed for all proposals submitted to NASA SMD between 2010 and 2019. Most submitted proposals have a PI who completed their PhD >25 years before proposal submission (see Figure 3.1; top plot). Most notable in the distribution of academic age for PIs of accepted proposals is that the profile is flatter for Astrophysics and Earth Science, while for Heliophysics, and, to a lesser extent, for Planetary Science, the PIs of successful proposals are predominantly older men. Overall, the data suggests that women PIs tend to be younger.
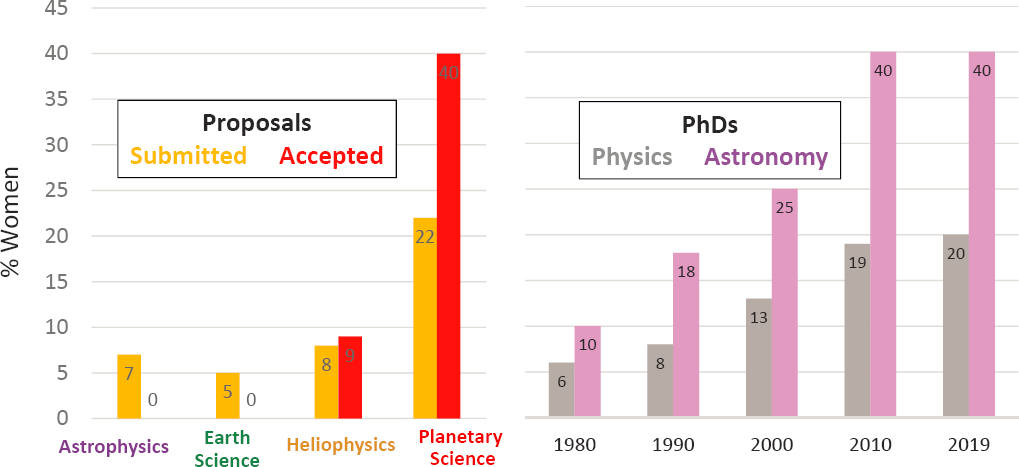
If one takes age 30 as the typical age for completing a PhD, these data suggests that mission PIs are typically >55 years of age. Currently 20% of U.S. PhDs in physics and 40% of U.S. PhDs in astronomy are awarded to women (Porter and Ivie 2019). We focus on physics and astronomy given an appreciable proportion of mission proposers earn doctorates in these fields. Looking back 30 years (~1990) the fraction of physics and of astronomy PhDs awarded to women was 8% and 18% respectively (see Figure 3.2). These percentages are consistent with the percentage of women PIs of proposals in Heliophysics, where PIs are likely to have earned a PhD in physics >25 years ago. While such trends provide some explanation for the low representation of women PIs, they do not explain the stark variation across SMD divisions.
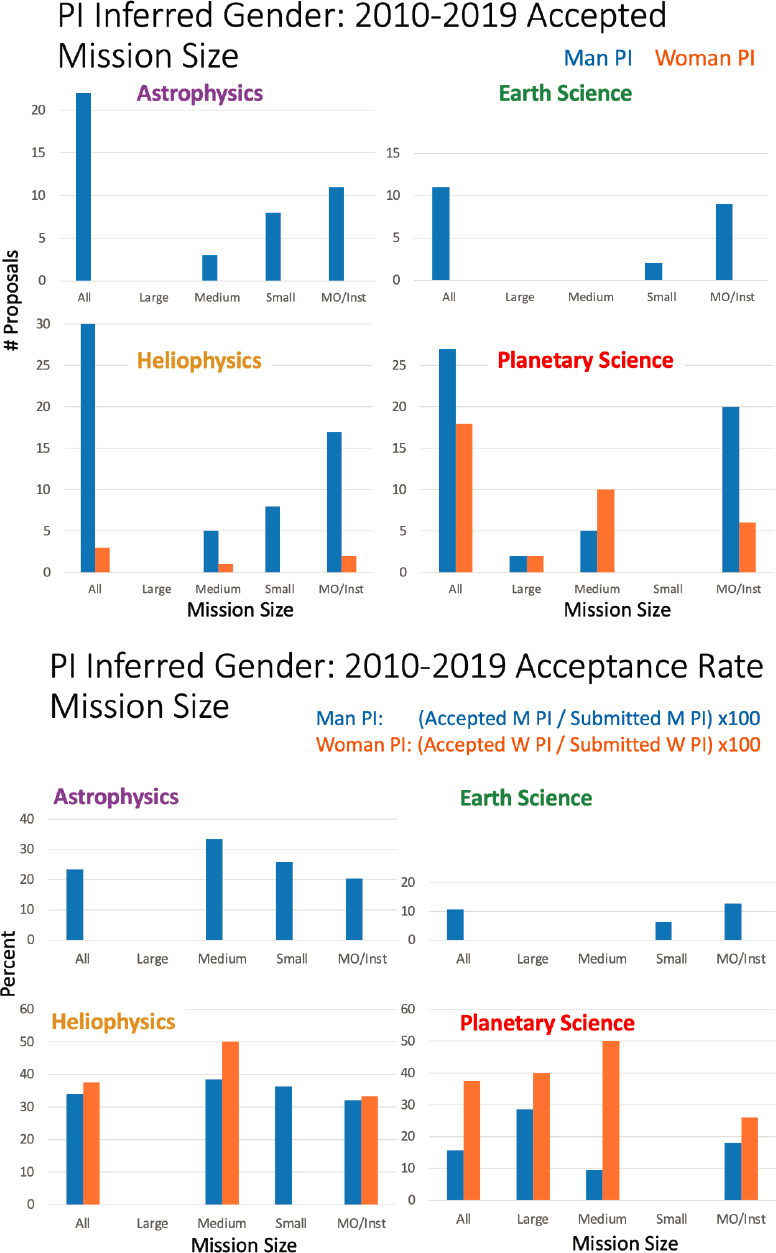
Further analysis of the data on proposals selected for funding demonstrated that both the number of accepted mission proposals and the rate of acceptance varies between divisions, depending on mission size and on inferred gender (see Figure 3.3). The committee acknowledges that different divisions will need missions of different sizes to address their very different science goals, yet, the lack of women PIs, both proposing and being funded, in Astrophysics and Earth Science for almost an entire decade is a significant gap. Overall acceptance rates in the 20-30% range are consistent with the average acceptance rate across all SMD divisions (see Table 3.1), except for Earth Science where 10% is more typical. Additionally, the acceptance rates for women in Heliophysics are relatively comparable to men (except for non-involvement of women PIs in small missions) and the acceptance rates for women are higher in Planetary Science. These wide-ranging demographics of mission leadership beg the question about what differences in the pathways, workforces, proposal processes and/or cultures of these divisions lead to such variation. Addressing these questions at the specific divisional level could not be accommodated in this report without compromising confidentiality, but could certainly be taken up within the context of the NASA-funded decadal surveys that are carried out for each of the SMD divisions and also involve a larger pool of Earth and space scientists for the purposes of examining the state of the profession. See Chapter 5 for a discussion of factors that may contribute to disparate outcomes within STEM fields more broadly.
Mission Teams
For many mission PIs, an important step in their path to becoming a PI is involvement on a mission team, often as a co-investigator (Co-I). Chapter 2 (see Figure 2.8) shows the distribution of roles held by members of the science teams of competed missions (2006-2019). The majority (81%) of team members are Co-Is. A Co-I (or Collaborator) usually provides a limited, focused component to the project. A few mission teams are recognizing the importance of training future Co-Is and PIs as well as including students and/or postdoctoral researchers on the team (see Chapter 4). Correspondingly, the distribution of academic age amongst team members is shifted about 10 years younger than the academic age distribution of PIs shown above.
Over the past decade, the data from the NASA SMD Data Analytics Team for 2010-2019 show that the total number of Co-Is were 3,414 in Planetary Science versus 1,640 in Heliophysics, 1,452 in Earth Science, and 1,343 in Astrophysics. Dividing these numbers by nine results in the total number of Co-Is submitting per year to be 379 for Planetary Science, 182 for Heliophysics, 161 for Earth Science, and 149 for Astrophysics.
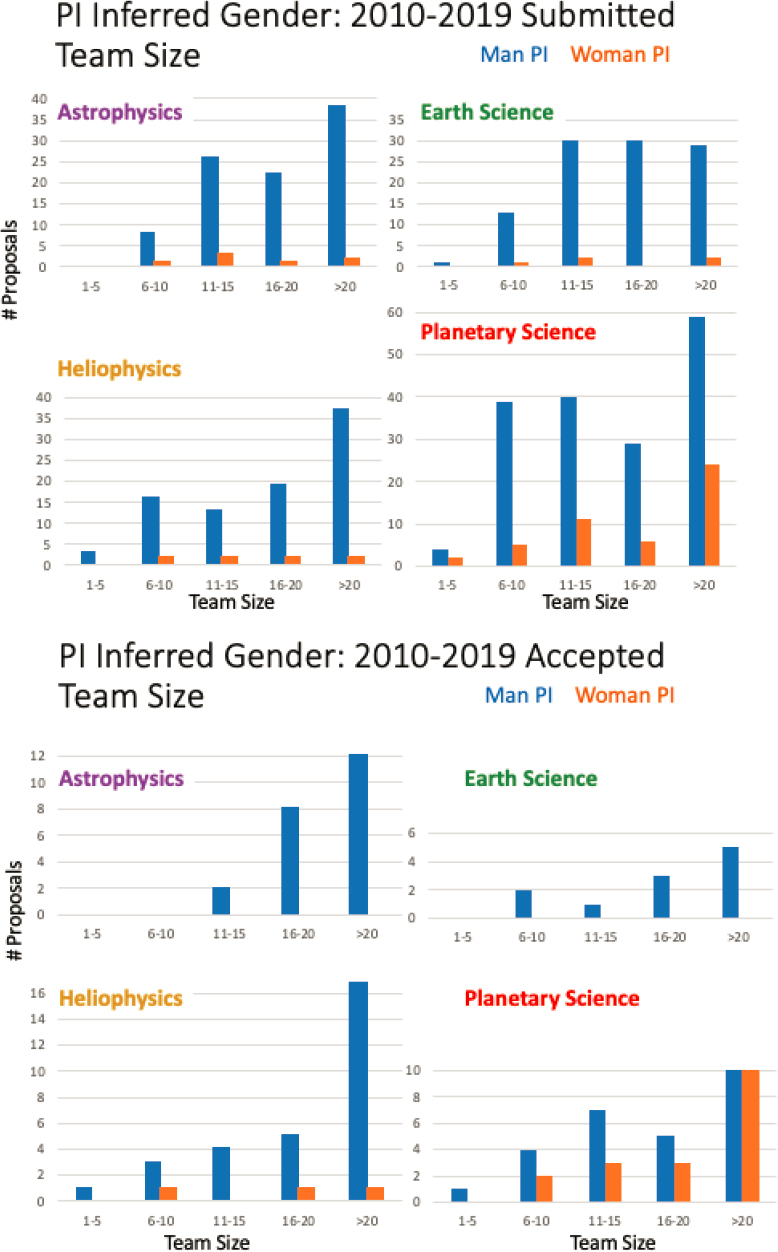
Figure 3.4 shows the distribution of proposals (2010-2019) that were submitted (left) and accepted (right) for the four science divisions versus the size of the team and sorted by (inferred) gender of the PI. No analogous information was available to the committee regarding PIs race or ethnicity. Comparing the distribution of team
sizes for accepted versus submitted proposals suggests that perhaps larger teams are proportionally more successful, particularly in Astrophysics and Heliophysics, though the small-number statistics may not provide solid evidence.
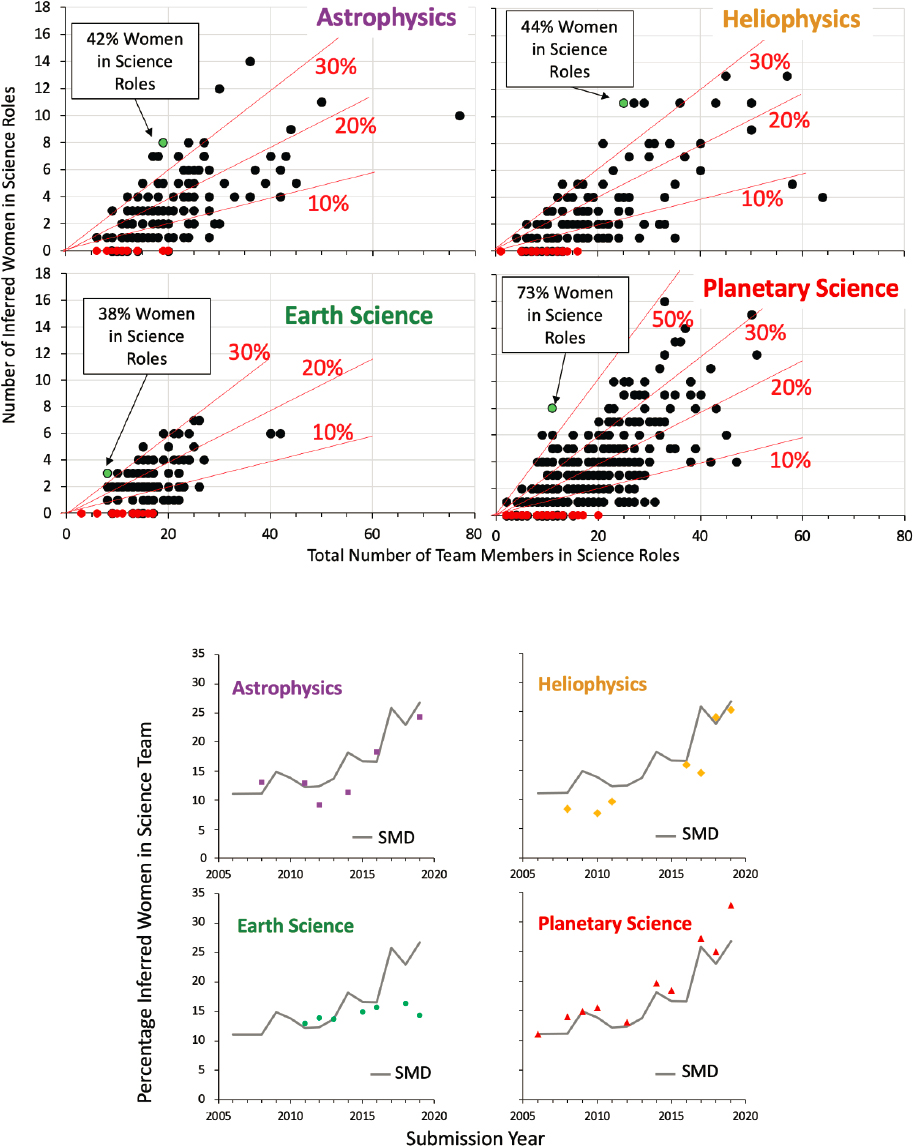
The involvement of women in proposed mission science teams has been slowly increasing with time across SMD. The top graph of Figure 3.5 shows the average percentage of women (inferred) on science teams on submitted proposals for each year from 2006 to 2019 (the only range of data provided to committee). The gray line connects the points of the yearly percentage women participation in science roles across all submitted proposals over all of SMD. Averaged across SMD and across team size, the participation of women has increased over the 13 years from ~10% to ~25%. The colored symbols (top, Figure 3.5) correspond to the respective average yearly women participation observations in each division. Since Planetary Science greatly outnumbers the other SMD divisions (e.g., see Figure 3.7 in the next section), the average line tends to closely follow the yearly observations for women participation in Planetary Science proposed mission science teams. Note, however, that the participation of women in Planetary Science mission teams has been above the average after 2010, rising to ~33% in 2019. The participation of women in Astrophysics and Heliophysics roughly follow the trend across SMD. By contrast, in Earth Science the mission participation of women has remain quite flat between 12-15%.
The bottom graph of Figure 3.5 shows the composition of mission teams—specifically, the number of (inferred) women on a team versus size of the team for proposals submitted between 2006 and 2019. The red lines illustrate corresponding percentage of (inferred) women on the teams. We note that there are a number of missions in all SMD divisions where there are no women on the team (illustrated by red dots along the x axis). For all but a few proposals, the participation of women on mission teams is less than 30% across all divisions except Planetary Science where there are several with 30-50% participation by women and even one proposal with 73% women. It would be useful to compare these statistics for proposal submissions with the corresponding data from the proposals that were funded. Moreover, given these data plots were provided to the committee with the inclusion of statistics from 2006-2010, further study is needed to determine the specific influence of these earlier years on the current distributions.
Conclusion 3-1: The data gathered by NASA on the demographics of proposal teams, both competed missions and R&A grants, is inadequate to inform NASA about the diversity of space scientists funded by the agency. In particular, while some data were presented on (binary) gender identity of members of proposal teams, information about race, ethnicity, and disability are lacking in NASA’s analyses.
Conclusion 3-2: During 2010-2019, fewer than 10% of all competed mission proposals to the Astrophysics, Earth Science, and Heliophysics divisions of NASA SMD were submitted by women PIs. Zero women-led competed missions were selected for funding in both the Astrophysics and Earth Science divisions. The low number of submissions make it impossible to determine whether there are statistically significant gender differences in funding rates for these divisions. Over the same period, 22% of all competed mission proposals to the Planetary Science division were submitted by women PIs, and women-led competed missions were selected at a significantly higher rate than men-led competed missions in this division. No analogous data on PI race or ethnicity were available to the committee.
Conclusion 3-3: Without further in-depth analyses involving proposal-specific and PI-specific information, the absence of evidence of gender differences in aggregate funding rates over 2010-2019 cannot be interpreted as an indication of the presence or absence of gender bias in NASA proposal review process.
DEMOGRAPHICS OF ALL PROPOSERS ACROSS THE FOUR SMD SCIENCE DIVISIONS
To put the demographics of competed mission proposals in a larger context, this section considers demographics data gathered on all proposals submitted to the science divisions of SMD. The NASA Solicitation and Proposal Integrated Review and Evaluation System (NSPIRES) was implemented in 2006, and is the primary online proposal submission interface at NASA for programs that encompass all of the competitively funded research for NASA Earth and Space Sciences, ranging from research projects on the order of $100,000 per year to the >$750 million large mission proposals. The programs support researchers at all career levels, from new investigators at the graduate student level (Future Investigators in NASA Earth and Space Science and Technology [FINESST]), the Early Career Investigators programs, extending to large, interdisciplinary research (Interdisciplinary Research Science [IDS]) to competed instrument and mission proposals. Beginning in 2016, NSPIRES users, including proposers, reviewers, and students, were asked to create personal profiles based on a series of nine questions (see Annex 3.A).
The data collected via NSPIRES consisted of gender, ethnicity, race, and disability/serious health conditions. It also asked if the person had ever been a PI, program director (PD), Co-PI, or Co-PD on any federally funded project (not specific to NASA). In 2019, NASA added an additional option for the “gender” question, specifically “Other” (rather than only “Male” or “Female”). Note that the question intended to collect data about gender actually asks about biological sex. While gender and biological sex are conflated in the original data provided to the committee, in this report, all respective data charts and tables are labeled as gender. In 2019, questions were also added on “Career Status,” including Highest Degree Achieved, Year of Highest Degree, Career Classification Sector, and Career Type. NSPIRES requests but does not require responses to these questions, and “I prefer not to answer” (PNA) is one of the possible options. It is important to note that data are not recollected each time an NSPIRES user visits the site, nor are users requested to update their profile. The current list of questions asked under the NSPIRES Personal Profile is provided in Annex 3.A, but is in the process of being updated to include more expansive categories for identification (e.g., binary and non-binary gender, disability type, etc.) among other changes.
To gain some insight into the potential community of mission proposers, the demographic data collected via NSPIRES on all research and analysis (R&A) grant proposers and disaggregated by SMD science division by NASA’s Office of the Chief Scientist were used as a proxy in this report (Barbier et al. 2021). As another caveat, we note that demographic data were collected beginning in 2016 and, where possible, the data were “back-casted” for proposals submitted in 2014 and 2015. Figure 3.6 shows the gender distribution (for both PIs and Co-Is combined)
across proposals submitted between 2014 and 2020 in each science division. Across the four divisions, there were similar percentages proposals submitted by men (65-72%), women (19-23%) and by those who selected “prefer not to answer” (9-14%). For Planetary Science, the percentage of people (0.1%) who chose “other” for gender is also included. Note that the proportions of submissions with unknown (“prefer not to answer”) PI and Co-I gender are substantial.
In Figure 3.6, for each division, the total number (N) of Investigators includes multiple counts of the same individuals (PIs and Co-Is) if they participated in multiple proposals. Table 3.3 shows these data disaggregated by SMD science division. When the total number of Investigators (PIs and Co-Is) is divided by the total number of proposals submitted, the average number of Investigators per proposal ranges from 3.2 to 4.2 across the divisions. When the total number of proposals submitted are averaged for each year, there are notable differences between the divisions, with Earth Science and Planetary Science submitting roughly twice the number submitted by the Astrophysics and Heliophysics divisions. When the unique names of PIs are considered, it is possible to evaluate how many proposals the PIs submitted per year. The resulting number of proposals submitted per PI does not vary much for each division across the 7 years.
Considering the most recent data (2020), the percentage of PIs who submitted just one proposal in 2020 ranges from 74% for Earth Science to 90% for Astrophysics. The percentage of PIs who submitted two proposals in 2020 ranged from 8.5% in Astrophysics to 19% in Earth Science. The remaining percentage of PIs who submitted more than 2 proposals ranged from 1.5% for Astrophysics to 7% for Earth Science. These data give some indications of the amount of effort expended by scientists in submitting research proposals to NASA but to fully understand the implications across the workforce, further analysis is required (such as submission versus selection rates and across dimensions of gender and race/ethnicity).
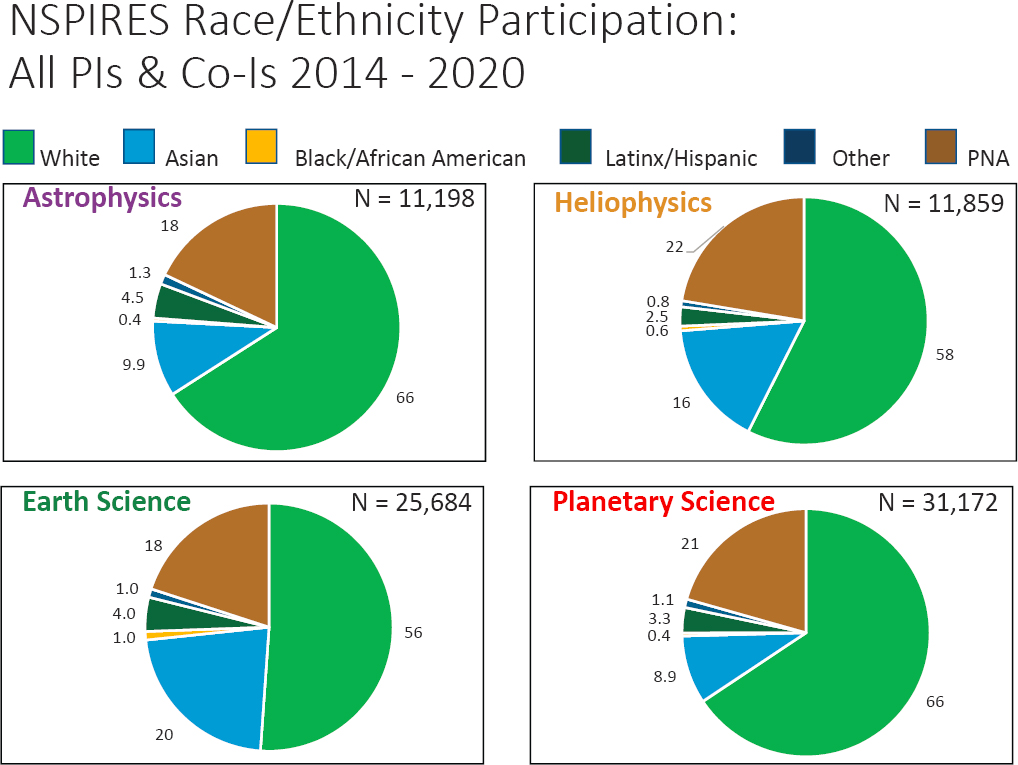
Within NSPIRES, there are limited data available on the race and ethnicity of proposers. Figure 3.7 shows the participation rates of various racial/ethnic groups (PIs and Co-Is combined) as Investigators across the four divisions. Due to small numbers of respective Investigators, the following racial/ethnic groups are combined into “Other”: American Indian or Alaska Native, Multi-racial, Native Hawaiian or Other Pacific Islander, and Other. The racial/ethnic distribution is very similar across the four divisions, and participation is heavily dominated by investigators who identify as White (56-66%). The participation rates of Investigators who identify as Asian is ~9-20%, while the percentages of Investigators who identify as Black/African American, Latinx/Hispanic, or Other are very small (~0.4-5%). Again, the large percentage of Prefer-Not-to-Answer responses (~18-22%) could have a significant impact on the statistics if there is a tendency of a particular racial/ethnic group that prefers not to identify.
As discussed in the next section, the numbers of active researchers (those receiving research funding from NASA and/or the National Science Foundation [NSF]) in each of the four SMD divisions are comparable, and divisional differences in proposals submitted to NASA may be related to a significant fraction of funding coming from NASA versus NSF or other agencies. Results from workforce surveys in the space sciences show that for Astronomy, the percentage of respondents receiving funding from NASA was 68% and from NSF was 36%, with many scientists getting funding from both agencies. The average percent of total funding reported by astronomers from NASA was 72% and from NSF was 57%. For Heliophysics, of those getting support external to their employer institution, 74% said the funding came from NASA, 46% said from NSF. The median level of support for Heliophysics research from NASA was 75% and from NSF was 50%. In Planetary, non-university employees were asked about their source of funding, to which 54% respondents reported funding from NASA grants, 43% from NASA mission support, and only 5% reported funding from NSF. The relative funding rates from NASA versus NSF are not available for the Earth observing community of investigators.
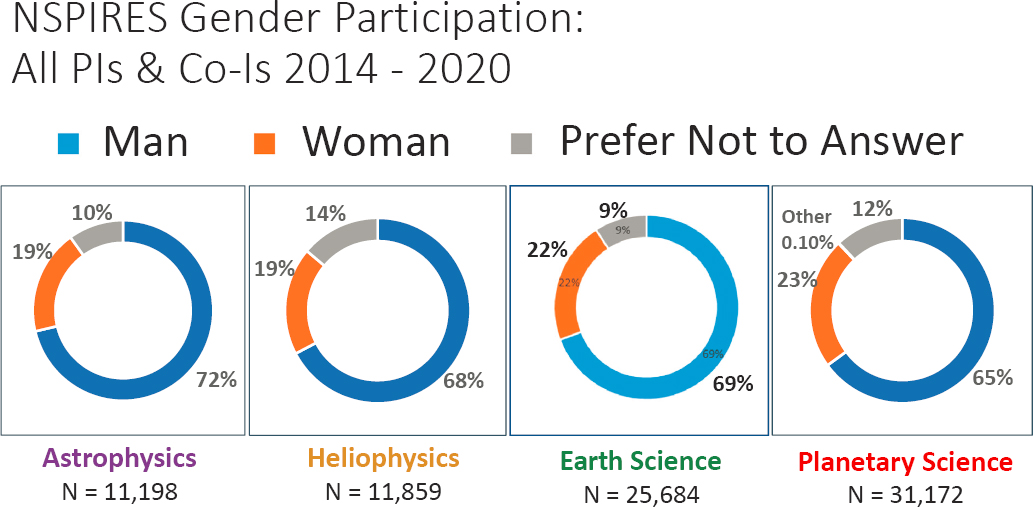
TABLE 3.3 Proposals Submitted to NSPIRES Across NASA Science Mission Directorate Science Divisions
| Total 524 | Astrophysics 101 |
Earth Science 108 |
Heliophysics 96 |
Planetary Science 219 |
||||
|---|---|---|---|---|---|---|---|---|
| Funded | Denied | Funded | Denied | Funded | Denied | Funded | Denied | |
| Men | 22 | 72 | 11 | 92 | 30 | 58 | 27 | 144 |
| Women | 0 | 7 | 0 | 5 | 3 | 5 | 18 | 30 |
| Total | 22 | 79 | 11 | 97 | 33 | 63 | 45 | 174 |
NOTE: Data for 2020 were not complete.
SOURCE: Office of the Chief Scientist, NASA Headquarters.
DEMOGRAPHICS OF SPACE SCIENCE WORKFORCE
To understand the demographic profile of the space sciences workforce in the United States, the committee relied on workforce surveys carried out by professional organizations, such as the American Institute of Physics (AIP). The AIP is an umbrella organization that encompasses organizations such as the American Physical Society, the American Geophysical Union (AGU), and the American Astronomical Society (AAS); and includes a Statistical Research Center with experience in surveying the workforce of the corresponding academic fields. As explained below, such surveys have their limitations, but provide estimates of the total numbers of research scientists working in the United States and their demographics. To date, there has been no systematic survey of the workforce conducted by NASA SMD to evaluate the total size and overlap between divisions, let alone their demographics or stark differences between divisions.
Astrophysics
The most recent workforce survey in astrophysics was conducted in 2018 by the AIP in preparation for the National Academies’ Decadal Survey on Astronomy and Astrophysics 2020, and the survey results reflect demographic data for members of the AAS (Pold and Ivie 2018). The AAS is the primary affiliation of professional astronomers in the United States, and while a significant proportion of astronomers are not involved in NASA space missions (e.g., ground-based observations and theoretical research funded by NSF), the demographics reported across AAS are a reasonable representation of the workforce associated with NASA’s astrophysics division. The AIP survey was sent to the 3,354 AAS members in the United States, with a response rate of about 60% (n=2018 responses). The (biological sex and race/ethnicity demographics of this population is shown in Figure 3.8. Based on the number of respondents who were PhD recipients (n=1,431), a rough “ballpark” estimate can be made that the total U.S. post-PhD workforce in astrophysics is approximately 2,400.2
___________________
2 The caveat is noted for these “ballpark” numbers that the population who responded is assumed to be the same as the population who did not respond.
Heliophysics
The most recent workforce survey in heliophysics was conducted in 2011 by the AIP (White et al. 2011a) in preparation for the Solar and Space Physics: A Science for a Technological Society decadal survey (NRC 2013), and the survey results reflect demographic data for Solar, Space & Upper Atmospheric Physicists identified across various sources: the AGU Space Physics and Aeronomy Section, the AAS Solar Physics Division, Space Weather Week attendee lists, and NSF PI lists. This AIP survey was sent to 2,560 unique email addresses, with a response rate of about 51% (n=1,305 responses). Of the responses received, 1,171 respondents indicated that they considered themselves in the field of Solar, Space and Upper Atmospheric Physics and currently work and reside in the United States. The biological sex and race/ethnicity demographics of this population is shown in Figure 3.8. Based on the number of respondents who were PhD recipients, a rough “ballpark” estimate can be made that the total U.S. post-PhD workforce in Heliophysics is approximately 2,300.
Planetary Science
The most recent workforce survey in planetary science was conducted in 2020 by the AIP in preparation for the National Academies’ Planetary Science and Astrobiology Decadal Survey 2023-2032, and the survey results reflect demographic data for members of the AAS Division of Planetary Science (DPS) (Porter et al. 2020). Planetary science is a particularly interdisciplinary field of research with scientists belonging to a range of professional organizations and attending diverse conferences. Furthermore, the field is expanding into astrobiology and exoplanets. Thus, the planetary science workforce likely has the most overlap with other science divisions. The 2020 AIP survey was sent to 4,965 members of the planetary science community across the AAS-DPS, the planetary division of the Geological Society of America, and attendees of the Lunar and Planetary Science Conference (LPSC), with a response rate of about 48% (n=2,367 responses). It is important to note that the AGU declined participation in the 2020 workforce survey, though the preceding workforce survey of members of AAS-DPS, AGU-planetary and LPSC, showed that only 12% of respondents belonged only to the AGU (White et al. 2011b). The biological sex and race/ethnicity demographics of the planetary science population is shown in Figure 3.8. Again, a rough “ballpark” estimate can be made that the total U.S. workforce in planetary sciences is approximately 1,960.
Earth Science
NASA’s Earth Science Division specifically involves space-based observations of Earth, and such observations look at land, ocean, and the atmosphere. To date, no workforce survey has been conducted for this sub-field of Earth science alone, and there is no single professional organization of which such Earth-observers are likely to be members. To get a sense of the U.S. Earth Science workforce as it relates to NASA space missions, the committee relied on two sources: the 2018 NSF Report of Earned Doctorates in the United States (NSF 2018) and the work of Bernard and Cooperdock (2018). The latter looks at the demographic data on geoscience PhDs included in the aforementioned NSF report and further analyzes these data by sub disciplines—Earth, ocean, and atmospheric sciences. In this consensus report, the focus is placed on the demographic data in the atmospheric sciences presented in Bernard and Cooperdock (2018), since this field most closely resembles the dominant component of NASA’s Earth Science Division, rather than the data in the original NSF report, likely comprised of mainly field geologists. While the data presented in Bernard and Cooperdock reflect PhD recipients in 2016, the most recent demographic data on 2019 geoscience PhD recipients appear similar (NSF 2019), underscoring the fact that no progress persists with respect to diversity in the geosciences. The biological sex and race/ethnicity demographics of the atmospheric science population as a proxy for the Earth Science workforce relevant to NASA is shown in Figure 3.8.
The PhD production rate (236/year in atmospheric science) is probably not reliable for estimating the total NASA Earth science workforce. Instead, taking the 25,684 PIs and Co-Is who submitted to NSPIRES with respect to the Earth Science Division from 2014-2020 as shown in Figure 3.6, and postulating that active scientists submit 2 to 3 proposals per year, then a very rough “ballpark” estimate of the number of active Earth scientists involved in proposals submitting to NSPIRES is on the order of 1,400-2,100. For each of the four research fields of the SMD divisions, the “ballpark” estimates of the total number of active researchers in the fields (between ~1,000
and ~3,000) are very rough estimates. A systematic effort to gather the workforce data in all four areas is needed to allow NASA to accurately measure not only the workforce doing research in these areas but to also evaluate the overlap between fields (e.g., scientists studying exoplanets, planetary magnetospheres, or the impact of Earth’s magnetosphere on Earth’s atmosphere, etc.).
Finding: The total size of the U.S. post-PhD workforce in each of the four divisions of SMD, plus the degree of the overlap between divisions, is very poorly quantified.
The demographics of PhD scientists working in the United States are pretty similar across the four disciplines associated with NASA SMD space missions (albeit with the caveats of the limitations of respective workforce surveys described above) (see Figure 3.8). Women comprise 17-38% of the space science workforce, and with respect to race/ethnicity, the workforce is far less diverse. Note that these studies treat gender and race/ethnicity as separate, independent categories while the intersectionality of gender with race/ethnicity tends to compound marginalization. Approximately 75-82% of the space science workforce identify as White, about 8-13% identify as Asian/Asian American (comparable to representation in the overall STEM workforce), the percentage of the workforce identifying as Latinx/Hispanic varies between the disciplines, and Black/African Americans are the least represented in the overall space science workforce. The non-White populations within the space science workforce are clearly small in number and there is considerable uncertainty with respect to demographic data on these populations associated with the range in: methodologies used to collect these data, wording of questions
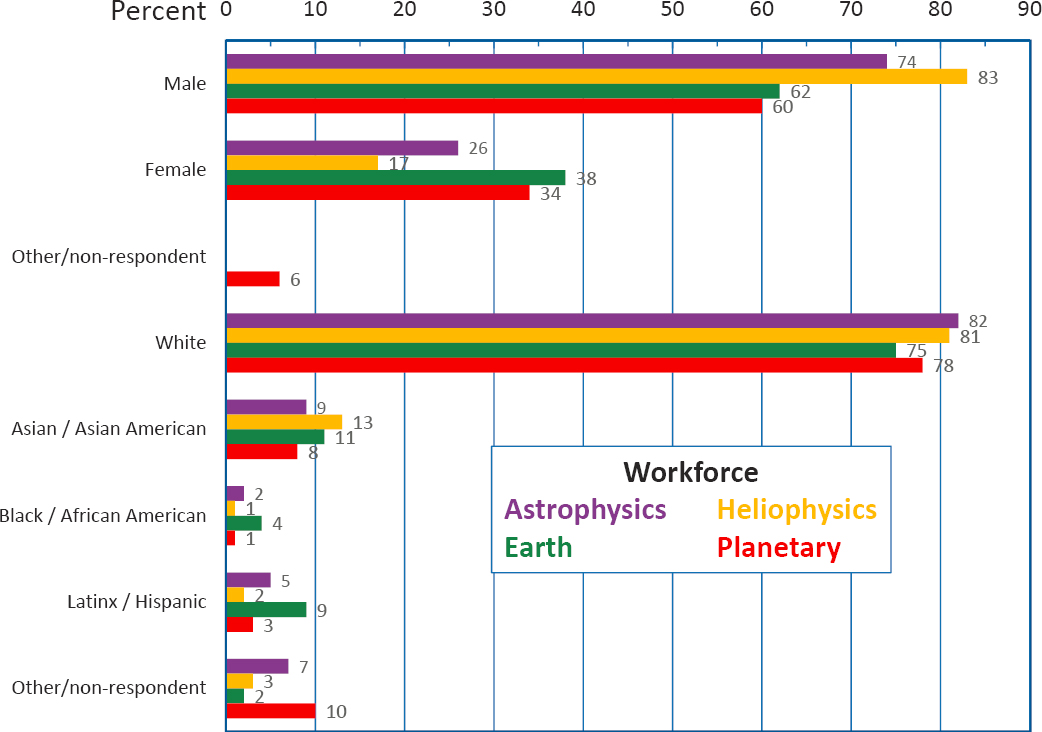
on survey instrument, how multiple/mixed races/ethnicities are included, etc. A consistent system for gathering workforce data across the space sciences is needed to accurately measure the diversity of the workforce.
COMPARISON OF DEMOGRAPHICS OF PROPOSERS AND THE WORKFORCE ACROSS THE FOUR SMD DIVISIONS TO THE U.S. POPULATION
In this final section, the demographics data for mission proposers and all NASA proposers are compared with the overall space science workforce data, which comprises the proposer pool. The comparison is also made with the U.S. workforce in STEM fields as well as overall.
Gender
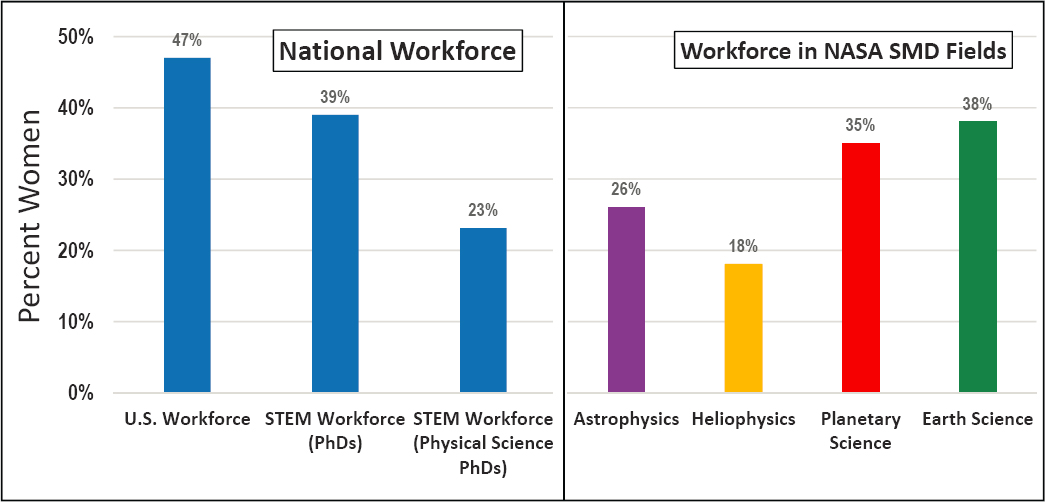
Women remain underrepresented among the leaders of competed mission proposal submissions, NSPIRES PIs and Co-Is, and within certain sub-areas of the space science workforce relative to their share of the U.S. STEM workforce and the overall national workforce. As shown in Figure 3.9, in 2019, the most recent year for which data are available, women represented 47% of the total U.S. workforce, 39% of the STEM workforce holding PhDs, and 23% of the STEM workforce holding PhDs in a physical science field.3 The proportion of women in the astrophysics workforce (26%) exceeded that of the STEM workforce with physical science PhDs, but fell below that of the overall PhD-holding STEM workforce and the national workforce. In planetary sciences and Earth sciences, women composed a larger share of the workforce (35% and 38%, respectively) than they did of the total physical science PhD-holding STEM workforce (23%). The proportion of women in the planetary and Earth science workforce nearly equaled that of women in the PhD-holding STEM workforce. However, women remained underrepresented in the planetary and Earth science workforce relative to their share in the overall U.S. workforce.
___________________
3 See NSF (2021d) and the NSF National Center for Science and Engineering Statistics database “National Survey of College Graduates,” https://ncsesdata.nsf.gov/builder/nscg.
The representation of women in heliophysics (18%) remained lower than their share of the STEM workforce (both physical science PhDs and PhDs in any field) and women’s share of the U.S. workforce.
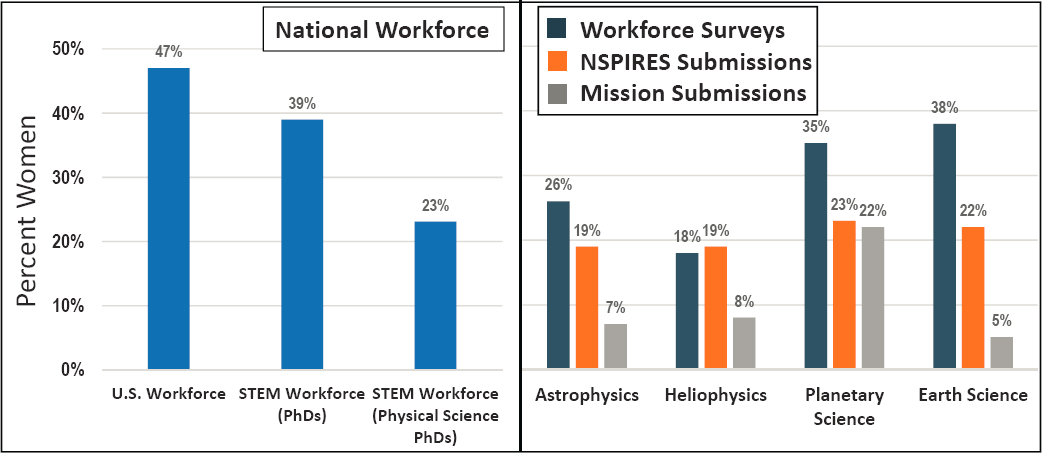
Women are also underrepresented among NSPIRES PIs and Co-Is between 2014 and 2020, relative to their share in the U.S. workforce, the STEM workforce and within certain sectors of the space science workforce. As shown in Figure 3.10, 19% of NSPIRES PIs and Co-Is in astrophysics were women, which is lower than women’s representation within the astrophysics workforce, the STEM workforce and the U.S. workforce. In planetary sciences and Earth sciences, a similar pattern of underrepresentation is observed. In planetary science, 23% of NSPIRES PIs and Co-Is between 2014 and 2020 were women compared to 35% of the planetary science workforce. In Earth science, 22% of NSPIRES PIs and Co-Is between 2014 and 2020 were women, compared to 38% of the workforce in that SMD science field. In heliophysics, 19% of NSPIRES PIs and Co-Is between 2014 and 2020 were women, which slightly exceeds women’s share of the heliophysics workforce.
As previously mentioned, gender is inferred in the demographic data on PIs for competed mission proposals provided to the committee by NASA SMD. Figure 3.10 also shows the inferred gender statistics for competed mission PIs compared with the workforce in NASA SMD fields, the STEM workforce holding PhDs in physical sciences, the overall U.S. STEM PhD workforce, and the overall U.S. workforce. The PIs on the competed mission proposals, both submitted and funded, comprise of 5% to 22% women across the four NASA SMD fields. While this range is comparable to the percentage of women in the heliophysics workforce, it is significantly below the percentages of women in the workforce for the other three divisions.
The percentage of PIs on competed mission proposals that are women vary considerably across divisions. Between 2014 and 2020, very few mission proposals with women PIs were submitted both in astrophysics and Earth science, and none were selected (see Figure 3.2). The percentage of competed mission proposals with women PIs submitted and funded in Heliophysics is comparable (8% versus 9%, respectively; see Figure 3.2). In contrast, 22% of competed missions proposals with women PIs were submitted in planetary sciences, and 40% of the funded missions were those led by women PIs. For comparison, 39% of the U.S. STEM PhD workforce is female which drops to 23% when only the physical sciences are considered.
Race/Ethnicity
Though data on the race/ethnicity of the PIs and Co-Is of competed mission proposals are not available, an examination of data on NSPIRES PIs and Co-Is between 2014-2020 (serving as a proxy for the potential community of mission proposers in the context of this study), and the most recently available space science workforce data, reveal that many racially minoritized populations continue to experience severe underrepresentation relative to their share of the U.S. STEM workforce and the overall U.S. workforce. Note again that these studies treat gender and race/ethnicity as separate, independent categories while the intersectionality of gender with race/ethnicity tend to compound marginalization. As shown in Figure 3.11, 6% of the U.S. workforce identified as Asian/Asian American, compared to 26% of PhD-holding STEM workforce and 29% of the STEM workforce with doctorates in physical sciences. Asian/Asian Americans were less represented in the space science workforce (ranging from 8% in planetary science to 13% in Heliophysics), but were overrepresented within the pool of NSPIRES PIs and Co-Is, relative to their share of the workforce in each of the SMD science fields.
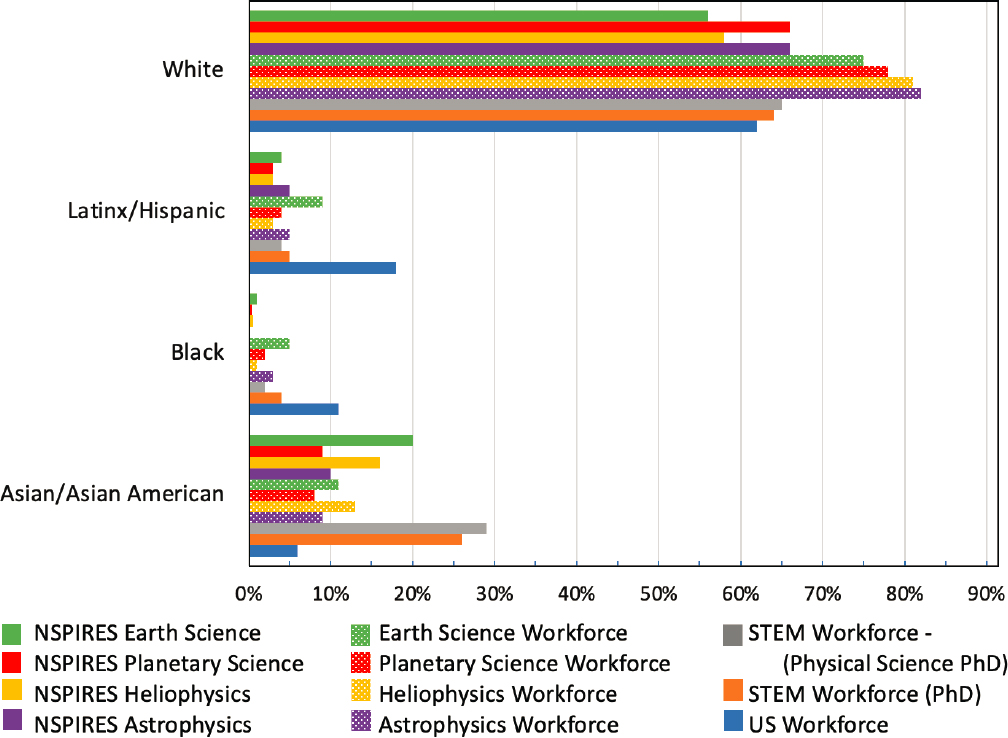
Individuals identifying as Black as well as those identifying as Latinx/Hispanic experience severe underrepresentation in the STEM workforce, the space science workforce, and among NSPIRES PIs and Co-Is, relative to their share of the overall U.S. workforce. Though 11% of the U.S. workforce identify as Black/African American, this population represents just 4% of the doctorate-holding STEM workforce, between 1% and 5% of the space science workforce and less than 1% of NSPIRES PIs and Co-Is between 2014 and 2020. Individuals of Latinx/Hispanic ethnicity are also underrepresented in the STEM workforce, the space science workforce and among NSPIRES PIs and Co-Is relative to their share of the overall U.S. workforce. However, in astrophysics and heliophysics, the proportion of the space science workforce of Hispanic/Latinx ethnicity is similar to that of Hispanic/Latinx NSPIRES PIs and Co-Is. In planetary sciences and Earth sciences, the proportion of the respective workforce identifying as Latinx/Hispanic exceeded this population’s share of NSPIRES PIs and Co-Is.
Figure 3.11 also illustrates the overrepresentation of self-identified non-Hispanic White individuals in all four NASA SMD fields relative to their share of the U.S. workforce and STEM workforce. The proportion of NSPIRES PIs and Co-Is identifying as White falls between 56% and 66% in the four NASA SMD fields, which is below their share of the larger space science workforce. However, it is important to note that a significant proportion (18-22%) of NSPIRES PIs and Co-Is decline to disclose their racial/ethnic identity on the demographic questionnaire within the proposal system. Given roughly one-fifth of PIs and Co-Is opt out of the race/ethnicity question, it is difficult to fully characterize the degree to which the racial/ethnic groups are overrepresented or underrepresented among the NSPIRES proposer pool. Additionally, the lack of data on the racial/ethnic identities of competed mission proposal PIs makes it difficult to determine whether the patterns of underrepresentation and overrepresentation within the larger space science workforce and NSPIRES PIs and Co-Is described above hold for the competed mission proposer pool. Nonetheless, given the low representation of Black and Latinx/Hispanic among NSPIRES proposer pool, it is reasonable to assume that these groups experience underrepresentation within the competed space mission proposer pool as well.
While this chapter describes the representational patterns within the space science workforce and among NASA PIs and Co-Is, it is also important to understand the root of these patterns so that points of intervention are identified. The causes of this underrepresentation, which are multi-faceted and operate at multiple points along the education-to-career pathway, are discussed in Chapter 4 of this report.
Finding: With the exception of Planetary Science, the percentages of competed mission proposal submissions made by women PIs over 2010-2019 (8% for Heliophysics, 7% for Astrophysics, 22% for Planetary Science, and 5% for Earth Science) are well below the current percentage of PhDs awarded to women in physical sciences (23%), below the percentage of women in the SMD workforce (17% for Heliophysics, 26% for Astrophysics, 34% for Planetary Science, and 38% for Earth Science), and below the percentage of women submitting to the NASA Solicitation and Proposal Integrated Review and Evaluations System (NSPIRES) (19% for Heliophysics, 19% for Astrophysics, 23% for Planetary Science, and 22% for Earth Science).
Conclusion 3-4: Further study is needed to evaluate to what extent the differences in the proportion of women among mission PI proposers compared to the proportion of women among doctorate recipients in the physical sciences are due to the mismatch between the career stage distribution of women in these various populations and the current seniority expectation for mission PIs.
Conclusion 3-5: Currently, there is no strategy and methodology being employed to effectively gather data on participation in the Earth and space sciences along the whole career pathway—from undergraduate and graduate programs to academic departments to the professional workforce.
ANNEX 3.A
Demographics Data Collection in the Earth and Space Sciences
There are wide ranges in quality and quantity of demographics data gathered via the workforce surveys of the different research fields in space sciences as well as via the NASA Solicitation and Proposal Integrated Review and Evaluations System (NSPIRES) system. Table 3.A.1 lists the questions asked by the different methods and the response options.
NASA’s NSPIRES Grant Submission Interface (NSPIRES).4 NSPIRES collects demographic data on gender (Note: the question is labeled gender but actually asks about biological sex), ethnicity, race, disability status, etc.5 The web portal does allow one to click a box “why this information is being collected.” However, the language in the box appears to be compliance-driven, and does not explain the importance of collecting such data. Additionally, in its current form, respondents are told that “Submission of the requested information is voluntary and will not affect an organization’s eligibility for an award. However, withholding this information will undermine the usefulness of the information provided by others. Any individual who would prefer not to submit some or all of the information requested should check the box(es) provided.” Respondents are also required to open additional boxes and pages in order to provide all of the requested information.
Workforce Survey of 2018 U.S. AAS Members (Pold and Ivie 2018). The survey was administered by the American Institute of Physics’ Statistical Division who sent the survey to the email addresses of American Astronomical Society (AAS) members. The survey of the astronomy workforce included questions about gender identity (including transgender identity), sexual identity, race or ethnicity, disability and accessibility aids. The entrance page to the survey says “Welcome to the AAS Workforce Survey, sponsored by the Demographics Committee. Thank you for your participation!” The demographics questions appear at the very end of the survey, following a range of questions about marital status, children, and childcare.
2011 Survey of Solar, Space & Upper Atmospheric Physicists (White et al. 2011a). The survey was administered by the American Institute of Physics’s (AIP’s) Statistical Division who sent the survey to the email addresses of all members of the Space Physics and Aeronomy section of the American Geophysical Union, the AAS Solar Physics Division, attendees of the Space Weather Week conference, and National Science Foundation principal investigator lists. The survey of the heliophysics community had the least demographics questions (perhaps reflecting it was carried out over a decade ago), one on sexual identity and one on race or ethnicity. These two questions appear at the very end of the survey following open-ended questions about perceived determinants and barriers of respondent’s success and preceding a final question requesting year of birth.
2020 Survey of the Planetary Science Workforce (Porter et al. 2020). The survey was administered by the AIP’s Statistical Division who sent the survey to the email addresses of the Division of Planetary Sciences of the AAS, the Planetary Division of the Geological Society of America, and attendees of the Lunar and Planetary Science Conference. The survey included a series of demographic questions on gender identity, transgender status, sexual identity, racial/ethnic designation, disability and use of accessibility aids. These demographic questions appear toward the end of the survey before open-ended questions on determinants and barriers of respondent’s success, and following a range of questions about the use of childcare resources or grants for attending conference meetings. The preamble to the survey says “Thank you for helping us learn more about the demographics and career paths of planetary scientists. Aggregated results will be shared with the community to be used to inform the Planetary Science Decadal Survey which is including workforce issues for the first time.”
___________________
4 See the NASA Solicitation and Proposal Integrated Review and Evaluations System at https://nspires.nasaprs.com.
5 Why this information is being collected: The federal government has a continuing commitment to monitor the operation of its review and award processes to identify any inequities based on gender, race, ethnicity, or disability. NASA asks that you provide information about your gender, race, ethnicity, and disability status to ensure compliance with Title VI of the Civil Rights Act of 1964, 42 U.S.C. § 2000d et seq., Title IX of the Education Amendments of 1972, 20 U.S.C. § 1681 et seq., Section 504 of the Rehabilitation Act of 1973, 29 U.S.C. § 701 et seq., and NASA’s implementing regulations at 14 CFR §§ 1250, 1251, and 1253.
TABLE 3.A.1 Demographics Questions in NSPIRES and Workforce Surveys
| NASA NSPIRES Person Profile Questions | ||
|---|---|---|
| Question/Category | Options | |
|
Gender1 (choose one)
1Note this question is labeled gender but actually asks about biological sex. |
Male Female Other I prefer not to report my gender |
|
| Ethnicity (choose one) | Hispanic or Latin Not Hispanic or Latin I prefer not to report my ethnicity |
|
| Race (select one or more) | American Indian or Alaskan Native Asian Black or African American Native Hawaiian or Other Pacific Islander White Other I prefer not to report my race |
|
| Do you have any of the following disabilities/serious health conditions? Consider your answers without the use of medication and aides (except eyeglasses) or the help of another person. (Check all boxes that apply to you) |
Hearing Impairment Visual Impairment Mobility/Orthopedic Impairment Other None I prefer not to reveal my disabilities/health conditions |
|
| Workforce Survey of 2018 U.S. AAS Members | ||
| Question/Category | Options | |
| What is your gender identity? | Woman Man Another identity (please specify if you wish) Prefer not to respond |
|
| Do you identify as transgender? | Yes No Prefer not to respond |
|
| Do you identify as | Heterosexual or straight Gay or lesbian Bisexual Other Prefer not to respond |
| What is your race or ethnicity (Please check all that apply) | American Indian or Alaska Native Asian or Asian American Black or African American Hispanic or Latino Native Hawaiian or other Pacific Islander White Other (please specify) Prefer not to respond |
| Please indicate which of the following apply to you: (Please check all that apply) | I am deaf or hard-of-hearing I have difficulty seeing even when wearing glasses I have serious difficulty standing, walking or climbing stairs I have a cognitive or learning disability I have a mental illness I am neuroatypical I have an autoimmune or pain disorder, or other chronic condition I have disabling allergies, asthma, or other environmental sensitivities Other disability: None of the above Prefer not to respond |
| Which of the following accessibility aids do you use? (Please check all that apply) | Sign language (American or other) Hearing aids, headphones, and other audio devices Closed-captioning Screen readers Braille Speech transcription Mobility aids Note Takers Quiet spaces Dietary accommodation related to health or disability Environmental adjustments (lighting, air, noise, etc.) Service animal Other accessibility aid: None of the above Prefer not to respond |
| Have you requested accessibility accommodation at work or school? (Please check all that apply) | Yes No No, but I would benefit from accessibility accommodation No, and I am afraid of disclosing my disability or chronic condition Not applicable |
| 2011 Survey of Solar, Space & Upper Atmospheric Physicists | |
| Question/Category | Options |
| Are you: | Female Male |
| To what racial or ethnic group do you belong? (Check all that apply.) | Asian or Asian American Black or African American Hispanic or Latino White Other |
| 2020 Survey of the Planetary Science Workforce | |
| Question/Category | Options |
| What is your gender identity? | Woman Man Another identity (please specify if you wish) Prefer not to answer |
| Do you identify as transgender? | Yes No Prefer not to answer |
| Do you identify as: | Heterosexual Gay or Lesbian Bisexual Other (please specify if you wish) Prefer not to answer |
| Which of the following racial/ethnic designations best describes you? Please select all that apply. | Hispanic/Latinx American Indian or Alaska Native Asian or Asian American Black or African American Native Hawaiian or Other Pacific Islander White Addition (please specify if you wish) Prefer not to answer |
| Please indicate which of the following apply to you. Please select all that apply. | I am deaf or hard-of-hearing I have difficulty seeing even when wearing glasses I have serious difficulty standing, walking, or climbing stairs I have a cognitive or learning disability I have a mental illness I am neuroatypical I have an autoimmune or pain disorder, or other chronic condition I have disabling allergies, asthma, or other environmental sensitivities Other (please specify if you wish) None of the above Prefer not to answer |
| Which of the following accessibility aids to you use? Please select all that apply. | Sign language, American or other Hearing aids, headphones, and other audio devices Closed-captioning Screen readers Braille Speech transcription Mobility aids Note takers Quiet spaces Dietary accommodation Environmental adjustments – For example lighting, air, noise, etc. Service animal Other accessibility aid (please specify) None of the above Prefer not to respond |
| Have you requested or utilized accessibility accommodations at work or school? Please select all that apply. | Yes Yes, but accommodations were not available No No, but I would benefit from accessibility accommodations No, and I am afraid of disclosing my disability or chronic condition Not applicable |
SOURCE: Data from the NASA Solicitation and Proposal Integrated Review and Evaluations System (https://nspires.nasaprs.com/external), Pold and Ivie (2018), and White et al. (2011b).


