
Appendix G
Exploratory Spatial Analyses of the Locations of 2019–2021 Premium Cigar Association Retailers, United States
Authored by: Amanda Y. Kong, Ph.D., M.P.H.1
BACKGROUND
This exploratory analysis calculated the census tract retailer density of premium cigar retailers (per 1,000 people) and examined correlations between tract sociodemographic characteristics and retailer density in the United States. It also explored associations between sociodemographic characteristics and the presence (versus absence) of a retailer in a census tract.
DATA SOURCES AND METHODS
Sociodemographic Characteristics
Sociodemographic variables at the census tract level from the 2015–2019 5-Year American Community Survey were downloaded from Social Explorer.2 Variables included total population; percent of non-Hispanic white (white), non-Hispanic Black or African American (Black), and Hispanic or Latino (Hispanic/Latino) individuals; percent of population 65+, and median household income.
___________________
1 Assistant Professor, University of Oklahoma Health Sciences Center.
2 ACS 2019 (5-Year Estimates). Social Explorer; 2019. Available at https://www.socialexplorer.com/tables/ACS2019_5yr (accessed October 18, 2021).
Premium Cigar Association Retailer Members
The Premium Cigar Association (PCA) provided a retailer-level dataset that included current members in 2019 through 2021, with all physical brick-and-mortar retailers that are PCA members and where the majority of sales were for premium cigars or pipe tobacco;3 retailer types, such as convenience stores, hookah/head shops, and vape stores, were excluded.
The original dataset included 1,316 unique retailers. However, upon review of the address fields and states, further cleaning of several observations was performed in consultation with the National Academies of Sciences, Engineering, and Medicine, briefly described below and detailed in Supplement A:4,5
- 25 observations were removed:
- Not in the USA or territory (n = 21)
- Store closed upon review of address (n = 1)
- Could not determine address (n = 3)
- Addresses corrected from PO Box to retailer address using Google (n = 10)
- Listed address corrected using Google (n = 4)
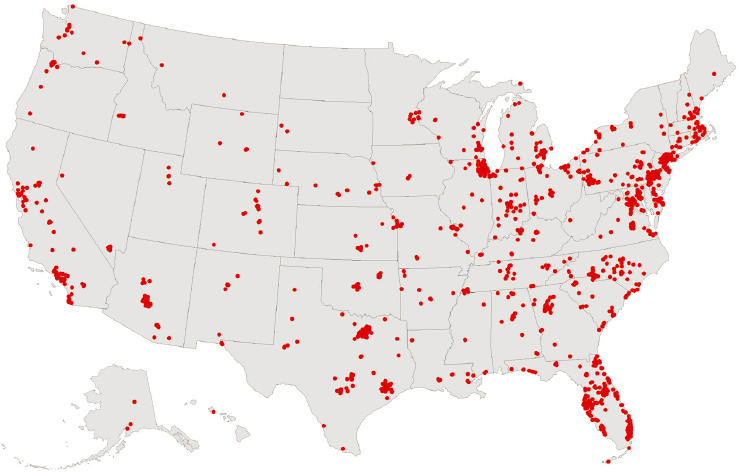
After cleaning the dataset, 1,291 unique retailers remained. Using ArcMap 10.8.1, all retailers were geocoded and assigned a latitude and longitude (see Figure G-1).
Calculating Premium Cigar Retailer Density
All premium cigar retailers were spatially joined to their respective census tract and corresponding sociodemographic data, and the number of retailers per 1,000 people in a tract was calculated (Figure G-2). Tracts with zero population (n = 611; two PCA members) were omitted from analysis (total number of PCA members n = 1,289).
___________________
3 Personal communication, email from Scott Pearce (Premium Cigar Association) to National Academies study staff, August, 16, 2021. Available by request from the National Academies Public Access Records Office at PARO@nas.edu.
4 The final data set and codebook are available by request from the National Academies Public Access Records Office at PARO@nas.edu.
5 See Supplement A for more details on the removed and corrected observations. Supplements are available in the project’s public access file and upon request from the National Academies Public Access Records Office at PARO@nas.edu.
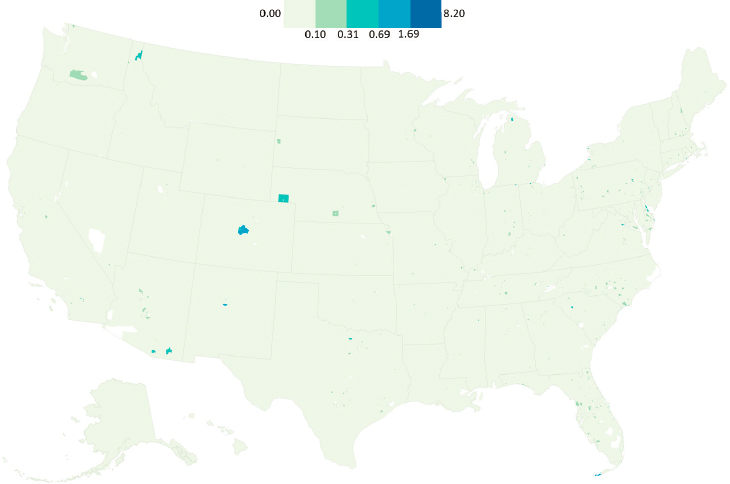
NOTE: Census tracts with zero population (white) were omitted from the analysis (n = 611).
Analysis
Using SAS 9.4, Spearman correlations between each tract-level sociodemographic variable and premium cigar retailer density were calculated. In additional exploratory analyses, a binary variable indicating the presence (=1) of at least one premium cigar retailer (versus none = 0) was created. Unadjusted associations between sociodemographic characteristics and this binary indicator were fit. Tract-level age, race, and ethnicity variables were scaled to tens (e.g., 10 percent is coded 1.0) so that estimates may be interpreted as the expected difference for a census tract that has a 10-percentage point greater value in the sociodemographic variable. Median household income was scaled to $1,000. As census tracts are nested within states (and Washington, DC), general estimating equation (GEE) methods with an exchangeable working correlation matrix were used, which adjust both estimates and standard errors to account for this geographic nesting.
RESULTS
PCA Members Retailer Density
Figure G-2 shows very little variation in premium cigar retailer density (mean = 0.00, SD = 0.06), largely due to minimal variation in the total retailer count (Tables G-1 and G-2). Supplements B–D provide state-level maps and a table of the total count of retailers and density per 1,000,000 residents.6
Spearman correlations (see Table G-3) indicated very small positive correlations, though caution should be taken interpreting these results due to the large sample size (statistical significance is likely) and because geographic nesting is not accounted for in analyses.
Further exploration indicated that only 16 census tracts had a premium cigar retailer density of 1.00 or more, and this may be due to lower population sizes in the tract (Supplement E). These observations had no apparent patterns in sociodemographic characteristics.
Presence of Absence of Retailer
With so little variation in the total retailer count, unadjusted associations between each sociodemographic characteristic and the presence (versus absence) of a retailer were investigated. As indicated in Table
___________________
6 Supplements are available in the project’s public access file and upon request from the National Academies Public Access Records Office at PARO@nas.edu.
TABLE G-1 Total Count of Premium Cigar Association Member Retailers, U.S. Census Tracts (n = 72,410)
| Count | Frequency | Percent |
|---|---|---|
| 0 | 71,164 | 98.3 |
| 1 | 1,205 | 1.6 |
| 2 | 39 | 0.1 |
| 3 | 2 | 0.0 |
TABLE G-2 Distribution of Premium Cigar Association Member Retailer Density (Per 1,000 People), U.S. Census Tracts (n = 72,410)
| Level | Quantile |
|---|---|
| 100% Max | 8.20 |
| 99% | 0.20 |
| 95% | 0.00 |
| 90% | 0.00 |
| 75% Q3 | 0.00 |
| 50% Median | 0.00 |
| 25% Q1 | 0.00 |
| 10% | 0.00 |
| 5% | 0.00 |
| 1% | 0.00 |
| 0% Min | 0.00 |
TABLE G-3 Spearman Correlation Coefficients between Premium Cigar Association Member Retailer Density (Per 1,000 People) and Sociodemographic Characteristics of U.S. Census Tracts (n = 72,410)
| % Aged 65+ | % White | % Black | % Hispanic/Latino | Median Household Income ($USD) | |
|---|---|---|---|---|---|
| Retailer density | 0.00755 | 0.00754 | 0.01450 | 0.00602 | 0.01740 |
| p value | 0.0423 | 0.0425 | <.0001 | 0.1051 | <.0001 |
NOTE: USD = U.S. dollar.
G-2, 71,164 of census tracts (98.3 percent) did not have a premium cigar retailer, while 1,246 (1.7 percent) had one or more. Descriptive analyses indicating the average value of each sociodemographic characteristic are presented in Table G-4.
Results from the GEE models (see Table G-5) indicate that tracts with a higher percentage of white residents had greater odds of having at least one (versus none) premium cigar retailer (odds ratio [OR] = 1.06; 95 percent confidence interval [CI]: 1.03–1.09). In contrast, tracts with a higher percentage of Black (OR = 0.92; 95 percent CI: 0.88–0.96) and Hispanic/Latino residents (OR = 0.90; 95 percent CI: 0.84–0.96) had lower odds of having at least one premium cigar retailer. Adjusted models including all sociodemographic characteristics were not fit due to multicollinearity.
TABLE G-4 Average Values of Sociodemographic Characteristics by Presence or Absence of At Least One Premium Cigar Association Member Retailer, U.S. Census Tracts (n = 72,410)
| Sociodemographic Characteristic | No Retailer | ≥ 1 Retailer | ||
|---|---|---|---|---|
| Mean | SD | Mean | SD | |
| % Aged 65+ | 16.4 | 8.1 | 17.4 | 9.6 |
| % White | 61.2 | 30.1 | 65.6 | 23.2 |
| % Black | 13.5 | 21.6 | 11.5 | 15.9 |
| % Hispanic/Latino | 16.7 | 21.5 | 14.0 | 15.7 |
| Median household income ($USD) | 66,664 | 33,729 | 70,314 | 32,995 |
NOTE: SD = standard deviation; USD = U.S. dollar.
TABLE G-5 Associations between Sociodemographic Characteristics and the Presence (vs. Absence) of At Least One Premium Cigar Association Member Retailer, U.S. Census Tracts (n =72,410)
| Sociodemographic Characteristic | Unadjusted | |
|---|---|---|
| OR | 95% CI | |
| % Aged 65+ | 1.03 | 0.96–1.11 |
| % White | 1.06 | 1.03–1.09 |
| % Black | 0.92 | 0.88–0.96 |
| % Hispanic/Latino | 0.90 | 0.84–0.96 |
| Median household income ($USD) | 1.00 | 1.00–1.01 |
NOTES: Tract-level age, race, and ethnicity variables were scaled to tens (e.g., 10 percent is coded 1.0) so that estimates may be interpreted as the expected difference for a census tract that has a 10-percentage point greater value in the sociodemographic variable. Median household income was scaled to $1,000. All models account for the nesting of tracts within states. Bolding indicates statistical significance. CI = confidence interval; OR = odds ratio; USD = U.S. dollar.
CONCLUSION
The majority of U.S. census tracts do not have a premium cigar retailer. However, the percentage of white residents in a tract is associated with greater odds of at least one retailer compared to none. In contrast, a higher percentage of Black or Hispanic/Latino residents is associated with lower odds of at least one retailer compared to none.
This page intentionally left blank.


