
12
Capital Flows in Global Value Chains
Paper Author/Presenter: Xiang Ding (Georgetown University)
Moderator: Nadim Ahmad (Organisation for Economic Co-operation and Development)
The workshop paper by Xiang Ding studies capital flows in the context of global value chains (GVCs). This is an important consideration to add to structural models to develop a more nuanced and fuller perspective of international trade.
Xiang Ding, assistant professor of economics at the Walsh School of Foreign Service at Georgetown University, introduced the workshop paper by motivating the importance of understanding the flow of capital in GVCs. He provided a stylized example about the semiconductor GVC to motivate. Manufacturing of semiconductors takes place in Taiwan with silicon coming from China, capital equipment from Japan, and research and development (R&D) from the United States. This means that both tangible and intangible capital are durable intermediate inputs in the production process and can be traded in a similar fashion to nondurable inputs, such as silicon. In the context of trade liberalization, while it is understood how liberalization between China and Taiwan would reduce the price of semiconductors, understanding how liberalization between Japan and Taiwan impacts prices is just as important.
Ding explained two major challenges in accounting for capital in GVCs: measurement and dynamics. Traditional national accounts tables do not account for the supply-use flow of capital goods. In the example outlined above, an input-output table would be split into three categories: intermediate inputs (China), gross output (semiconductors), and value added (United States, Japan, and Taiwan). In the standard framework the value added term does not differentiate rents due to capital, R&D, or value added due to labor. The second challenge, dynamics, is summarized as “investment today” and is dependent on future expectations. The existing literature treats capital as a primary factor of production and investment as final use in the national accounts.
CONTRIBUTION
Ding stated that his paper contributes to the past literature by proposing a unified framework that quantifies GVCs by treating capital services and intermediate goods alike. The framework is based on an open economy in a dynamic general-equilibrium model that focuses on the long-run steady-state outcome. The model uses the same underlying quantitative framework as the existing static models of trade employed in the field, with a slight alteration to the calibration of the production function parameters.
Ding explained that this framework motivates the measurement of the capital coefficients through understanding the flow of investment by linking the rental payments to capital to the value of new investment. His empirical work uses data from the U.S. Bureau of Economic Analysis (BEA) Capital Flow Tables and the standard World Input-Output Tables (WIOT).
Ding stated that his model predicts new production links between the supply and use of capital. The gains from trade liberalization are more than doubled in the new framework and distributed more heavily in capital-intensive industries. In this instance, capital intensity is for use in both production and supply of final products, or the forward and backward linkages discussed in the workshop paper presented by Shang-Jin Wei (Wang et al., Chapter 3).
LITERATURE REVIEW
According to Ding, this paper fits into or expands the following related literature:
- quantitative models calibrated using WIOTs, which do not consider capital as an intermediate input (Antràs and Chor, 2021; Carvalho and Tahbaz-Salehi, 2019; Costinot and Rodriguez-Clare, 2014);
- existing literature on trade in capital, which focuses on either physical capital or knowledge capital, but not both (Eaton and Kortum, 2001; Keller and Yeaple, 2013);
- multisector real business cycle (RBC) models, which deal only with short-term fluctuations in capital and not the long-term steady state (Atalay, 2017; Eaton et al., 2016a; vom Lehn and Winberry, 2022); and
- national accounting (Barro, 2021; Corrado et al., 2009; Hulten, 1979; Koh et al., 2020).
ACCOUNTING FRAMEWORK AND MEASUREMENT ISSUES: EXAMPLES OF AN ISLAND ECONOMY
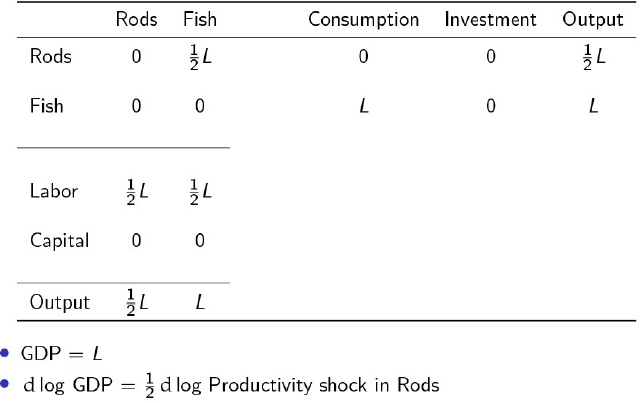
Ding first presented two simple stylized models of an island economy. Economy (A), which consumes only fish, is closed to outside markets. Wages are
normalized to a numeraire, and the production function of fish depends on labor and access to a fishing rod. Fishing rods are an intermediate input, and the production function of fishing rods depends only on labor. This means that there are two sectors in the economy: a fish-producing sector and a rod-producing sector. In the stylized example, the labor value added is split evenly between the two sectors. The fish-producing sector will employ labor and rods (an intermediate input) at equal proportions. Fishing rods are intermediate goods as they decay perfectly in 1 year. The final output, gross domestic product (GDP), will be equal to the size of the labor force. The simple model confirms the prediction from Hulten (1978) that analyzes the productivity shock in rods on GDP. One can take the Dolmar weight, the output of fishing rods with respect to labor (½ L in this example), and divide by the total GDP (L). In this example, the result is an elasticity, between GDP and a productivity shock in fishing rods, equal to one-half (see Figure 12-1).
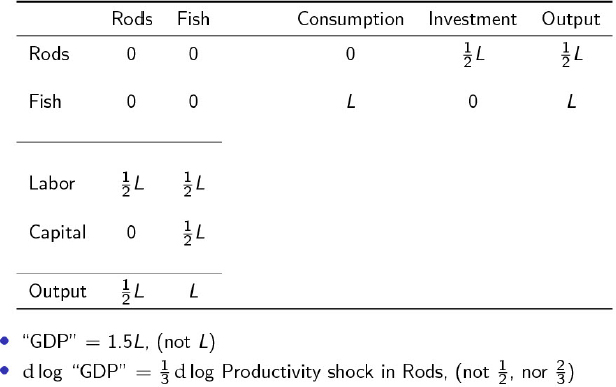
In Ding’s second stylized model, Economy (B), fishing rods that last for 2 years are now considered capital inputs, but require twice as many workers. The distribution of labor will be the same as in Economy (A), meaning that the number of rods used will also be the same. The major difference is that only half of the fishing rods need to be replaced each period. This is represented in the model as a ½ L investment, and ½ L capital value added, rather than a ½ L intermediate and no capital value added as in the first economy. The resulting GDP in the economy is then 1.5 times the size of the labor force, rather than L in the first economy (see Figure 12-2). Barro (2021) explores issues of double counting in GDP, and reports that GDP in real consumption would be double counted, but GDP in terms of
NOTE: GDP = gross domestic product.
SOURCE: Presentation by Xiang Ding.
capital value added would not. This has implications for the implied Hulten elasticity, defined above. In terms of capital value added, the elasticity of a productivity shock with respect to GDP is one-third. This differs from the elasticity for real consumption (one-half) and it does not coincide with GDP when measured as the sum of labor and capital value added, which is two-thirds. This illustrates the issue an outside observer would encounter if they were trying to estimate these elasticities from the final input-output table.
Ding stated that this is not an artifact of the stylized model and that it has real-world implications. In 2008, the System of National Accounts made a shift from weighting most global R&D output as intermediate expenses, to weighting them as an equal share with gross fixed-capital formation. The resulting inferences and calibrations from these datasets are then potentially drastically altered. Further, capital is traded at the same frequency as intermediate goods.
THEORETICAL FRAMEWORK
Ding moved to describing the theoretical model that will be calibrated. Households have a standard intertemporal preference function with discount factor, β. The rate of return, or risk-free rate rf, for capital comes from the Euler equation. There are j industries that use intermediates and capital as factors in a Cobb-Douglas production function with constant returns to scale. Capital evolves in a standard way; capital tomorrow depends on depreciation, with rate δj, capital today plus investment today.
NOTE: GDP = gross domestic product.
SOURCE: Presentation by Xiang Ding.
Ding presented the key insight offered by the model as the link between investment flows and capital value added. The value of the net present asset is the sum of the rental price for the asset and the depreciated value tomorrow, discounted to today’s prices. The steady-state predictions are that the value of the net present asset is the same today as tomorrow, or a constant. Further, investment is set at the level that replaces the depreciated capital stock. There is a no-arbitrage condition that pins down the return of risk-free capital, Kj, and the price, Pj, of a new investment good. This leads to the final equation,
![]()
which relates the level of investment, Ij, to the return payments to capital for each asset j. The conditions for the steady-state equilibrium are standard: labor market clearance, asset market clearance, investment of each asset type achieves the required rate of return, and output market clearance. The output market clearing condition provides a deeper intuition. The total output produced by industry j is the sum of demand for intermediate inputs, the sum of expensed goods and new capital formation, and the demand for the final good, the sum of the labor income, and capital gains income.
Ding discussed one proposition of the model, the propagation of a shock in autarky, or the considered elasticities from the island economy. Using the Leontief inverse, the productivity shock in any industry can be related to the per-period steady-state welfare measured as the real final consumption. The inverse depends on the expenditures on intermediate inputs and implicit expenditures on capital goods. Domar weights (gross output over GDP) are no longer a sufficient statistic. The weights will now be modified because of the capital gains income that is consumed in the same period. This implies that the weights will not be modified only in the limit that the rental rate of capital goes to zero.
Ding explained that the model predicts that welfare gains of liberalization will be doubled if a country moves from autarky to an open economy. In a one-sector economy with a typical intermediate input share of 0.5, the proposed elasticity for the propagation of a shock with respect to real consumption is 2. In a world of intermediates and capitalized investments, the share moves from 0.5 to 0.75, providing an elasticity of 4.
The model in an open economy offers the same intuition as the above closed economy, but with the inclusion of international products and capital.
QUANTITATIVE RESULTS
Ding briefly discussed the calibration of the model. He used the 2007 release of the WIOT merged with socioeconomic data for the share of labor in each industry, using 33 countries and 33 industries. For the industry-level trade elasticities, he used three sources: Caliendo-Parro and Costinot and Rodriguez-Clare for trade in goods, and a constant elasticity of 5 for trade in services. The
WIOT offers information on labor incomes, gross output, import shares, intermediate input use, cost expensing (from supply and use), and cost civilization (only total value added from capital). To fit the model parameters, the linking equation discussed in the theory section is used, in connection with the BEA’s Capital Flows Tables (see Meade et al., 2003) to decompose the capital value added. Ding used BEA estimates of depreciation rates by asset and assumed a global risk-free return to capital as the risk-free U.S. interest rate.
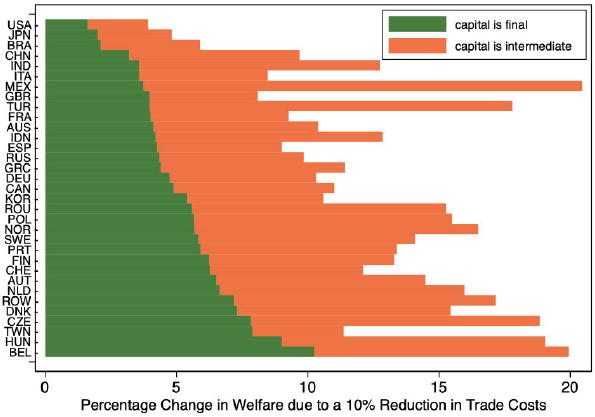
Following model calibration, Ding ran a counterfactual in which trade is liberalized by 10 percent across all countries and industries. Using the standard hat algebra approach (see Dekle et al., 2008), he solved for the exact welfare changes, which are the sum of the real labor income and transfer payments and real capital gains. The welfare impacts are then compared in two models calibrated to the same data: a setting with capital as the primary input and investment as final use, as in past literature, and a model with rental services from capital assets as intermediate inputs, which is Ding’s contribution (see Figure 12-3).
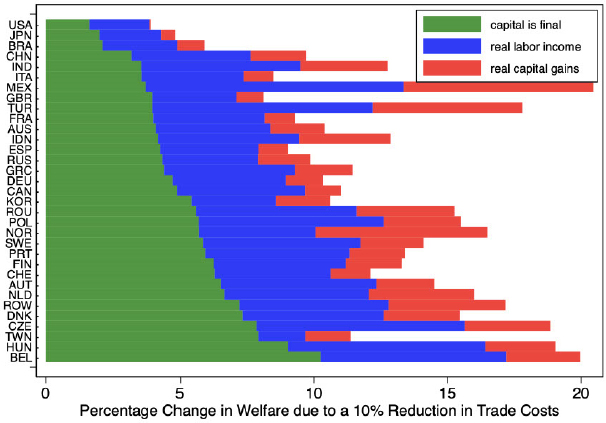
The model predicts a doubling, an average factor of 2.4 across all industries, of the welfare gains of trade due to a 10 percent liberalization in the second model approach relative to the first, in both open and closed economies. Welfare gains are heterogeneous across countries, as seen when decomposing the gains by capital is final, real labor income, and real capital gains.
Ding stated that countries with high capital intensity, when capital is a final good, experience larger increases to their welfare following liberalization.
SOURCE: Presentation of Xiang Ding.
The gains are also heterogeneous across industries in which capital-intensive industries benefit the most (see Figure 12-4).
SUMMARY
The measurement of supply and use of capital assets across industries using current macrodata is difficult, driving a disconnect between the reality of GVCs and the calibration of macro trade models. Ding offered a conceptual framework, in the form of a dynamic general equilibrium model, that treats rental of capital as an intermediate expense. This model offers comparable steady-state predictions to static models and follows a similar solution method, hat algebra, with a slightly altered calibration. The model predicts that treating capital as an intermediate good doubles the welfare gains from liberalization with the largest impact on capital-intensive countries and industries.
Ding mentioned several channels for future work in this area, adding to the theory for adjustment to new steady states, the implications for measurement in national accounts, the role of multinational firms and foreign direct investment, and profit-shifting incentives for tax avoidance.
DISCUSSION
Discussant: Brent Moulton (International Monetary Fund)
Brent Moulton, senior economist at the International Monetary Fund, began by giving a summary of the paper and contextualizing it in the existing
SOURCE: Presentation of Xiang Ding.
literature. Prior work in this area focuses on the use of global suppliers to transform intermediate inputs to final goods. The paper expands this view of GVCs to include capital inputs by treating them analogously to traditional intermediate inputs. Relative to the prior models that do not treat capital as an intermediate input, the paper reports that their inclusion more than doubles the gains from trade in terms of real consumption. These gains are strongest in capital-intensive countries.
Moulton focused his comments on the measurement issues raised rather than the trade theory, offering several main comments before moving to a deeper discussion of the measurement issues that Ding raised. As the paper is in an early stage, there are several avenues through which it can increase its contribution to the field. The paper would benefit by connecting with the productivity literature, which provides solutions to several measurement concerns raised. This literature includes several datasets that could be incorporated into the paper. Moulton’s last main comment is on the terminology used; one should be careful in the comparison of capital and traditional intermediates as they behave in separate manners. More work on developing the framing of this work would also be useful.
Moving to the measurement of capital services, Moulton offered some background on the national accounts data. The founders of national accounting (Richard Stone, Simon Kuznets, and others) treated capital as a consumable in the production process and noted the services that capital provides. Their terminology, intermediate consumption for rented capital, and consumption of fixed capital for owned capital, indicate this understanding. However, practical measures for differentiating capital goods and their respective services were not available in the 1930s and 1940s, so capital goods were treated as gross operating surplus.
Moulton went on to say that economists in the 1960s and 1970s studying growth accounting and productivity produced measures of capital services that differentiate various forms. Some of the more notable papers in this literature are Jorgenson (1963) on capital theory and investment behavior; Jorgenson and Griliches (1967), which explained productivity change; Hulten (1973), which introduced Divisia index numbers; Diewert (1976), which introduced exact and superlative index numbers; and Hulten (1978) on growth accounting and intermediate inputs.
Moulton explained that the methods developed in the prior decades were implemented in the 1980s in studies on multifactor, or total factor, productivity of the macroeconomy and its constituent industries. In 1983, the Bureau of Labor Statistics began their analysis of trends in multifactor productivity with work documenting the trends between 1948 and 1981. Gollop and colleagues (1987) offered a major study of productivity in the United States. These authors aggregated capital services for multiple capital-asset classes with intermediate inputs and labor services. In 2001, the Organisation for Economic Co-operation and Development published a handbook on the measurement of productivity at the macro and industry levels. Moulton suggested that this work would be particularly interesting and beneficial in the context of the paper for the
understanding of industries. Especially of interest are such industries as information and computing technology services that experience large price changes. Lastly, the System of National Accounts (SNA) (European Commission et al., 2009) has a chapter on the role of capital services.
Moulton transitioned to discuss the measurement of capital flows. The paper has two data sources: the WIOTs, which made a change in 2008 regarding the relative importance of capital and traditional intermediates, and the U.S. BEA capital flow tables for 1997. The BEA publishes alternate estimates of investment in detailed capital assets by industry, which are not as detailed as the 1997 tables but still have large coverage and may be useful. The more recent BEA estimates were improved by a more detailed collection of capital asset classes during the Census Bureau’s annual capital expenditure survey.
Moulton pointed out that international capital flow tables, such as those developed by the BEA, are not in the 2008 SNA, and many countries have not developed them. Several countries have developed these estimates as part of their multifactor productivity accounts, or estimates were developed by university research teams. The KLEMS (analysis of capital [K], labor [L], energy [E], materials [M], and service [S] inputs) project, organized by Jorgenson, Timmer, and Van Ark, includes capital-flow estimates for the European Union, United States, China, India, Canada, and several other countries.
Moulton’s final comment was directed at Ding’s treatment of capital assets as an intermediate input. There are analogies between the capital goods and traditional intermediate goods, but there are also several differences. The SNA does not treat capital assets as intermediate inputs, as they are owned by the firm and semidurable. Further, capital assets have value and are recorded on firm balance sheets. No direct measure of rental service or income flow from production exists; so, for practicality, it is simpler to record income from capital assets as a segment of the operating surplus.
The productivity literature has developed methods for and theory for measuring capital services, and Moulton recommended their introduction into the paper. The paper relies heavily on steady-state conditions to connect capital flows and services. For this reason, Moulton suggested that Ding think more about how capital flows vary in the temporal dimension when the conditions for a steady state are not met. For example, a company has a 5-year-old asset that, if replaced today, would be sourced from Thailand; but since the asset has 5 more years of life, it may be sourced from the Philippines when they choose to invest in new equipment. In this case, how would this flow be measured: the observed flow as purchase, an imputed flow at time of use, or the expected flow at replacement?
One audience member asked how to reconcile and explain the gains from trade results from the input-output tables in the more complex quantitative tables and the stylized tables in the example. Ding responded that he keeps the use of intermediate input and simply shifts capital value added into a vector across all asset classes. He retains the standard input-output linkages, but adds in new ones based on the capital intensity of an industry.
This page intentionally left blank.


