
PURPOSE AND APPROACH OF THE CHAPTER
This chapter reviews the pay-equity concepts measured in the Component 21 data collection. The design and implementation of the Component 2 data collection was described in Chapter 2. In this chapter, the utilities of the concepts measured are assessed for their intended use; alternatives are considered as appropriate.2 This chapter also considers pay-equity concepts not measured in the Component 2 data collection. Including these concepts in future pay-data collections could improve EEOC’s ability to enforce its statutory responsibilities, as described in Chapter 1. The chapter concludes with a summary of the panel’s findings regarding the measures used for the 2017–2018 Component 2 data collection. Conclusions and recommendations for future pay-data collections are provided.
PAY-EQUITY CONCEPTS MEASURED BY THE COMPONENT 2 INSTRUMENT
Pay
W-2 Box 1
To report total earnings, filers were instructed to report W-2 Box 1 earnings for the reporting year for all employees identified in the workforce “snapshot” by assigning them to the appropriate pay band (EEOC, 2020d).
W-2 Box 1 includes the total taxable wages, tips, and other compensation that the employer paid to the employee during the year. However, Box 1 does not include elective deferrals except section 501(c)(18) contributions (Brown et al., 2016; Towarnicky, 2021). A more inclusive definition of compensation is found for W-2 Box 5. The state of California’s mandated pay-data collection effort uses W-2 Box 5 to define annual compensation.
___________________
1 In 2018 and 2019, EEO-1 data collections occurred in two components. The customary EEO-1 instrument containing composition data (Component 1) was collected in 2018 for reporting year 2017, and in 2019 for reporting year 2018. In 2019 and 2020, pay data (Component 2) were collected for reporting years 2017 and 2018. In this report, we refer to historical EEO-1 data collections as EEO-1, and the 2017 and 2018 EEO-1 Component 1 and Component 2 instruments as “Component 1” and “Component 2,” respectively. All information collected by the Component 1 instrument is also collected by the Component 2 instrument.
Findings
The W-2 Box 1 earnings measure may not be ideal for the purpose of the Component 2 data collection. It excludes some forms of income that are not federally taxable, such as employee contributions to section 401(k) or 403(b) plans. Hence, Box 1 cannot be used to identify disparities in compensation in these excluded components. This poses a challenge for EEOC when using Component 2 data to compare compensation among similarly situated employees in initial charge investigations, to review employers for systemic patterns of disparity, and for purposes of employer self-assessment. For example, no systemic pay disparities may be found between groups of similarly situated employees if the group that receives a higher level of total compensation also contributes a higher amount to section 401(k).
Indeed, existing research and data indicate that elective deferrals of compensation differ systematically by race, ethnicity, and sex. For example, Internal Revenue Service data from tax year 2018 (the most recent available) show that women are less likely to make contributions to defined-contribution retirement plans (40.1% for women versus 43.3% for men), and women who do contribute make smaller contributions ($4,641 on average for women versus $6,308 for men; IRS, 2022).
Annualized base pay and other components of total compensation:
a second alternative measure is annualized base pay, which imposes a relatively low filing burden on employers. However, this measure may be inappropriate for the Component 2 data collection as it fails to capture compensation that comes in other forms (e.g., bonuses, commissions, and fringe benefits). For example, two employees may receive virtually the same level of annualized base pay but may differ in terms of bonuses and commissions, resulting in pay disparities that merit consideration and analysis.
Focusing the data collection on total compensation may mask pay discrimination pertaining to individual components. Such discrimination may arise, for example, through unequal base pay or through differential access to overtime pay, bonuses, and commissions. If Component 2 data are meant to inform initial evaluations of charges filed by claimants (or brought forward on their behalf as commissioner charges), it would be useful to consider not just total wages but also the separation of various components of wages.3
___________________
3 A recent court case is relevant for this point. In Tracy Sempowich vs. Tactile Systems Technology, case number 20-2245, a lower court initially granted summary judgment to Tactile, doing business as medical device company Tactile Medical, on the grounds that Sempowich hadn’t demonstrated that the company paid different wages to a male colleague because she
Occupational Employment and Wage Statistics wages:
the measurement of wages used by the Occupational Employment and Wage Statistics (OEWS) survey offers another alternative. “Earnings in the OE[W]S survey are defined as straight-time, gross pay, exclusive of premium pay. The definition includes a base rate of pay, cost-of-living allowances, guaranteed pay, hazardous-duty pay, incentive pay (including commissions and production bonuses), and tips” (National Research Council, 2013, p. 56). However, “[t]he definition excludes overtime pay, severance pay, shift differentials, nonproduction bonuses, employer cost for supplementary benefits, and tuition reimbursements”4 (National Research Council, 2013, p. 56). Hence, this measure of pay does not capture all components of compensation. The OEWS measure of pay was recommended by the 2013 National Research Council report (at the time OEWS was referred to as Occupational Employment Statistics, or OES; National Research Council, 2013).
Pay Bands
OEWS Pay Bands
The Component 2 data collection requires that employers collapse and submit their W-2 Box 1 earnings into 12 pay bands. These pay bands are the same as those used by BLS in reporting results for the OEWS survey for the November 2018 and May 2019 survey panels, except that wages are
___________________
earned more in combined salary and commissions (Sempowich v. Tactile Systems Technology, Inc., 2021b).
On appeal, the Court of Appeals for the Fourth Circuit found in favor of Sempowich, stating that the lower court should instead have made its determination based on pay rate, which was lower for Sempowich than it was for the colleague (Sempowich v. Tactile Systems Technology, Inc., 2021a). “The district court incorrectly stated that total wages is the proper metric under the regulations,” Circuit Judge Diana Gribbon Motz wrote on behalf of the panel. “This error apparently arose from a misreading of EEOC’s definition of the term ‘wages.’” The relevant portion of The Equal Pay Act of 1963 “says nothing about total wages; it places all the emphasis on wage rates… As a result, we need not even decide whether we should defer to EEOC’s interpretation of the statute—the statute itself makes clear that wage rate is the proper metric” (Sempowich v. Tactile Systems Technology, Inc., 2021a, p. 19).
In its amicus brief supporting Sempowich’s appeal, EEOC said, “Although the [lower] court purported to rely on EEOC’s regulatory guidelines in so holding, its analysis contravenes the plain language and the statutory purpose of the EPA [Equal Pay Act], and this court should correct it” (Sempowich v. Tactile Systems Technology, Inc., 2021c, p. 1).
4 For a complete list of wages types included (and excluded) in the definition of wages for the purposes of the OEWS, see BLS, 2021a.
defined somewhat differently than in OEWS5 (see Table 3-1). Except for the lowest and highest bands, the ratio between the upper and lower bounds of these pay bands is approximately 1.27. In other words, the difference between the lower and upper part of the pay band is about 27 percent.
Findings
To convert pay-band categories into continuous dollar values that might be used for calculating pay disparities, two approaches are to (1) choose the midpoint of the dollar range or (2) use external data to calculate medians or averages among those falling within the pay band. For the latter, one might calculate the medians or averages separately for each pay band for workers in each unique pay-band/race/sex/ethnicity/occupation
TABLE 3-1 Pay Bands in EEOC Component 2 Collection, 2017–2018
| Band | Compensation Band Label |
|---|---|
| 1 | $19,239 and less |
| 2 | $19,240–$24,439 |
| 3 | $24,440–$30,679 |
| 4 | $30,680–$38,999 |
| 5 | $39,000–$49,919 |
| 6 | $49,920–$62,919 |
| 7 | $62,920–$80,079 |
| 8 | $80,080–$101,919 |
| 9 | $101,920–$128,959 |
| 10 | $128,960–$163,799 |
| 11 | $163,800–$207,999 |
| 12 | $208,000 and more |
SOURCE: EEOC, 2020f.
___________________
5 The 2013 National Research Council report recommended the use of Occupational Employment Survey (OES, now OEWS) pay bands if compensation were to be collected using the OES definition. The 2015 Sage Computing report recommended measuring compensation using a W-2 Box 1 definition of wages. The Component 2 data collection mixes this approach: it defines compensation as W-2 Box 1 and collects that information using OES pay bands. BLS pay bands are changed periodically to adjust for inflation; e.g., see BLS, 2021b.
cell. However, these methods essentially assume that workers in each pay band receive the same level of pay, which can be problematic because the pay bands are so wide.
Performance of pay bands in Component 2:
overall, the upper bound of each pay band (excluding the top and bottom bands) used by the Component 2 instrument is approximately 27 percent higher than the lower bound. To provide a reference point, in 2020, women who were full-time wage and salary workers had median typical weekly earnings that were 82 percent of those of male full-time wage and salary workers (BLS, 2022a), which would imply a pay gap by sex of approximately 18 percent. This means that a median-earning woman could well be in the same pay band as a median-earning man. If the analysis of pay disparities does not involve direct imputation, it would likely involve alternative assumptions such as a functional form assumption about the distribution of earnings across workers.
We examined the performance of the pay bands used in the Component 2 data collection. Figure 3-1 shows variation in pay bands by job category in 2018. Table 3-2 shows percent distribution of employees in pay bands for each job category. For all the job categories, employees were spread across all pay bands, both overall and within subgroups. However, for the highest- and lowest-paid job categories, the data tended to concentrate more heavily in a small number of pay bands. For example, about 70 percent (8.6% + 9.3% + 51.8% = 69.7%) of employees in the executive category (Table 3-2) fall under the three highest pay bands, and about 75 percent (50.4% + 11.1% + 13.5% = 75%) of service workers fall under the three lowest pay bands. The concentration of workers in a small number of pay bands may produce establishment reports with insufficient pay-band variation within occupations, as well as overly wide pay bands that make it difficult to detect large pay disparities. This will affect the utility of wage data collected to make enforcement comparisons of pay within a given occupation by sex and race/ethnicity. However, when we examine separate sex and race/ethnicity subgroups or within establishments, then dispersion across pay bands will vary. A further investigation of the potential concerns with pay bands will be presented in subsequent chapters.
Individual-level pay data:
an alternative format of pay-data collection involves asking employers to submit individual-level pay data, which are more precise than pay bands and capture the full range of pay variability.
Collecting individual-level pay data has become the standard for OEWS after a long evolution. See Box 3-2.
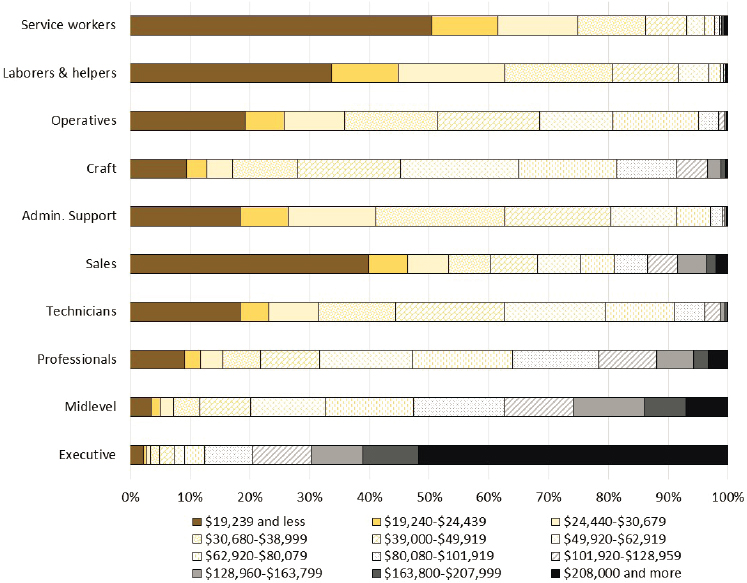
SOURCE: 2018 Component 2 employee file.
NOTE: Excludes firms that reported more than 1.4 million employees (i.e., larger than the largest employer); establishments that reported only employee count data and not pay data (i.e., Type 6 reports); and missing cell values for employee sex, race/ethnicity, occupation, and pay data (i.e., “99” codes).
TABLE 3-2 Percent Employed by Pay Band, Component 2 Data, 2018
| Executives | Midlevel | Professional | Technicians | Sales | Administrative Support | Craft | Operatives | Laborers and Helpers | Service Workers | |
|---|---|---|---|---|---|---|---|---|---|---|
| Total Number | 3,867,316 | 11,625,579 | 21,791,200 | 6,936,129 | 10,561,595 | 14,003,620 | 5,971,061 | 11,710,199 | 8,451,228 | 17,749,949 |
| Total Percent | 100.0 | 100.0 | 100.0 | 100.0 | 100.0 | 100.0 | 100.0 | 100.0 | 100.0 | 100.0 |
| $19,239 and less | 2.2 | 3.4 | 9.0 | 18.3 | 39.8 | 18.4 | 9.4 | 19.2 | 33.6 | 50.4 |
| $19,240–$24,439 | 0.4 | 1.5 | 2.7 | 4.9 | 6.6 | 8.1 | 3.4 | 6.5 | 11.2 | 11.1 |
| $24,440–$30,679 | 0.7 | 2.2 | 3.7 | 8.2 | 6.8 | 14.7 | 4.4 | 10.2 | 17.8 | 13.5 |
| $30,680–$38,999 | 1.4 | 4.4 | 6.3 | 13.0 | 7.0 | 21.5 | 10.9 | 15.4 | 17.9 | 11.2 |
| $39,000–$49,919 | 2.4 | 8.5 | 10.0 | 18.1 | 8.0 | 17.8 | 17.3 | 17.2 | 11.1 | 6.9 |
| $49,920–$62,919 | 1.8 | 12.5 | 15.5 | 17.0 | 7.1 | 10.9 | 19.7 | 12.3 | 5.1 | 2.9 |
| $62,920–$80,079 | 3.4 | 14.7 | 16.8 | 11.5 | 5.7 | 5.8 | 16.4 | 14.3 | 1.9 | 1.7 |
| $80,080–$101,919 | 7.9 | 15.2 | 14.4 | 5.1 | 5.7 | 1.9 | 10.0 | 3.3 | 0.6 | 0.9 |
| $101,920–$128,959 | 9.9 | 11.5 | 9.8 | 2.5 | 5.0 | 0.5 | 5.2 | 1.0 | 0.3 | 0.3 |
| $128,960–$163,799 | 8.6 | 11.9 | 6.2 | 0.8 | 4.8 | 0.2 | 2.3 | 0.3 | 0.1 | 0.3 |
| $163,800–$207,999 | 9.3 | 7.0 | 2.4 | 0.3 | 1.6 | 0.1 | 0.8 | 0.1 | 0.1 | 0.2 |
| $208,000 and more | 51.8 | 7.1 | 3.3 | 0.2 | 2.0 | 0.1 | 0.4 | 0.2 | 0.3 | 0.6 |
SOURCE: 2018 EEO-1 Component 2 employee file.
NOTE: Excludes firms that reported more than 1.4 million employees (i.e., larger than the largest employer); establishments that reported only employee count data and not pay data (i.e., Type 6 reports); and missing cell values for employee sex, race/ethnicity, occupation, and pay data (i.e., “99” codes).
Why did this change occur? Larger establishments initiated the process of submitting employee-level data rather than submitting pay data in bands. By expanding the collection of employee-level data, OEWS expected the accuracy and consistency of pay estimates to improve (Mousa, 2020).6 Individual-level pay data are more likely to provide valid measures of central tendency and dispersion, thereby affording an important quality check and analytical capability (NRC, 2013).
OEWS used cognitive tests to assess the feasibility and administrative burden of transitioning to individual-level pay data. Since larger establishments often submitted data that effectively amounted to individual-level pay data, while smaller establishments were viewed as facing the greatest burden if the OEWS pay-data collection were converted from pay bands to individual-level data, the feasibility study focused on establishments with fewer than 50 employees. Initial results indicated that nearly all of these smaller-sized employers could provide exact pay rates for their employees and clearly understood what the form was asking for, while they were roughly evenly split on whether they preferred to submit individual-level pay data or ranges (Kaplan et al., 2019). Aggregating pay data into pay bands imposed both administrative and computational burdens on employers.
___________________
6 Although these data were collected as individual-level wages, they are currently still reported by BLS within pay bands.
A subsequent pilot study focused on employers with fewer than 20 employees—the group for whom providing individual-level pay data was expected to be the most burdensome. Results showed no reduction in response rates between the individual-level-wage (test) and pay-band (control) approaches (Kaplan, 2020).
Taking into account the observed tendency of larger employers to submit individual-level pay data, and the results of the cognitive tests of small establishments, BLS found that both larger and smaller employers often preferred to submit individual-level pay data. Accordingly, OEWS progressively made employee-level data the default submission format, while retaining the option for employers to report using pay bands (Holt and Wagoner, 2021; Holt, personal communication, May 10, 2022).
How does the OEWS experience inform future design considerations for the Component 2 data collection? A recent study of the Component 2 data collection also found that placing employees within pay bands was challenging for firms (Boren et al., 2022). The Component 2 data collection is directed to the larger firms that BLS found often submit individual-level pay data by choice, so transitioning to the collection of individual-level data may reduce burden for most employers, particularly if employers are also given the option of reporting using pay bands. Since the panel has not seen a systematic assessment of concerns that employers may have about feasibility and burden, it is important that field testing include systematic employer feedback.
Nonetheless, the Component 2 data collection is more complicated than the OEWS survey. The Component 2 collection asks for pay information broken down by sex and race/ethnicity, perhaps requiring the use of multiple databases. Accordingly, transitioning the Component 2 data collection from pay bands to individual-level pay data would require careful field testing in advance of a full-scale data collection. In addition, confidentiality protections would need to be reviewed and perhaps strengthened by established methods used by federal statistical agencies, such as BLS and the Census Bureau.
The panel notes that Illinois Department of Labor is planning to collect individual-level wage data from employers for purposes of enforcing its Equal Pay Act (Public Act 102-0036, 2021). Since the EEO-1 instrument collects pay data in aggregate (and not at the individual level), filers of the forthcoming Illinois pay-data collection would need to aggregate their individual records to complete their EEO-1 filing requirements (Illinois Department of Labor, 2021).
Thus, in a limited sense, the feasibility of collected individual-level pay data, which yields more accurate estimates than pay bands, has been demonstrated. In a fuller sense, feasibility can be established by the testing just described. Some firms prefer reporting in pay bands, and this flexibility
is managed by OEWS. Though the 2015 Sage Computing report recommended pay-band use to protect confidentiality and manage burden (Sage Computing, 2015), both needs can be met in other ways. Firms can be given the option of responding using pay bands, as in the OEWS survey, and EEOC can still choose to report the data using pay bands to protect confidentiality, while restricting access to individual-level wage data using methods established by federal statistical agencies (Federal Committee on Statistical Methodology, 2005).
Occupation
This section discusses the panel’s review of and dialogue on how best to code occupations for the intended uses of Component 2 data. The job categories used in the Component 2 instrument are defined very broadly and do not include the level of detail provided by the federal SOC system (at two to six digits) or even by EEOC’s EEO-5 reports from public schools. Even at a broad level, the Component 2 instrument’s job categories cannot be correctly mapped to SOC occupations, limiting comparison to other federal datasets. Therefore, the panel’s primary question was whether EEOC’s aggregated broad job categories are useful for identifying pay differences—either for initial charge investigation, review for systemic patterns of disparity, or employer self-assessment.
EEOC Job Categories
The 10 EEO-1 job categories used in the Component 2 instrument are executive-/senior-level officials and managers; first- or midlevel officials and managers; professionals; technicians; sales workers; administrative support workers (formerly office and clerical workers); craft workers (formerly craft workers, skilled); operatives (formerly operatives, semiskilled); laborers and helpers (formerly laborers, unskilled); and service workers (EEOC, 2020e). As described in Chapter 2, the EEO-1 Job Classification Guide and the EEO-1 census codes crosswalk website were provided as aides to data collection. Filers were also referred to the Alphabetical and Classified Indices of Industries and Occupations, prepared by the Census Bureau (Census Bureau, 2010), which reflect federal statistical standards for collecting data on industries (OMB, 2021) and occupations (OMB, 2017).
Findings
Standard Occupational Classification system:
the SOC system classifies all occupations for which work is performed for pay or profit. It covers all jobs in the national economy, including occupations in the public, private, and military sectors. In this way, the SOC is designed to reflect the current occupational composition of the United States (OMB, 2017). The SOC system groups together detailed occupations with similar job duties, and sometimes those with similar skills, education, and/or training. For purposes of data analysis, SOC can be used at its two- to up to six-digit level to facilitate comparisons of like work. The occupations are systematically reviewed every five years through a federal interagency expert group co-led by BLS and the Census Bureau on behalf of the Office of Management and Budget (OMB). Recommendations for updates are submitted through a public comment process, and any final updates are authorized by OMB (OMB, 2017).
Breadth and overlap:
the condensed, broad job categories that EEOC uses may lend themselves to error in reporting and may be too broad for useful comparisons of pay differences. A recent paper comparing broad job categories to three-digit occupations for predicting within-workplace pay gaps by sex found that broad categories produced an average 30 percent higher pay gap by sex then did detailed occupations (Penner et al., 2022). The clustering of employees’ reported pay into job categories based on the Component 2 data collection is presented in Figure 3-1.7
Interoperability:
since EEOC job categories cannot be mapped well to SOC occupations (EEOC job categories are too broad and overlap), comparison of EEOC data to other federal data sources for benchmarking purposes is limited. This lack of interoperability undermines the utility of EEOC data, especially when used in conjunction with American Community Survey data as proposed by EEOC and the Office of Federal Contract Compliance Programs (OFCCP).
Work performed:
in understanding pay differences, it is important to ensure that workers performing similar work are compared, and the only way to do so is to compare job duties—not titles (alone) or broad job categories such as those used in the Component 2 data collection. Using job titles in combination with other data, such as industry categories, can support highly accurate occupational coding systems.
___________________
7 The degree to which this clustering affected pay-disparity analysis of the technology industry in Silicon Valley in 2018 is examined in Chapter 7.
One option EEOC could explore is the use of automated occupational coding for job categories. Beginning in November 2020, OEWS collected occupations using employer provided (write-in) job titles that, coupled with North American Industry Classification System (NAICS) codes, were autocoded to SOC occupations and verified by a human expert. The OEWS autocoder is an in-house, machine-learning, logistic-regression model (Holt and Wagoner, 2021). The model inputs include job title, NAICS code, and employer identification number. The autocoder is trained annually on finalized, state-coded data. The current version used approximately 10.4 million records to train and 3.2 million records for validation, resulting in an overall accuracy or “rate of agreement” of approximately 70 percent at the six-digit level, prior to editing by a human expert.8 The OEWS autocoder is only used by the OEWS program and is trained on OEWS data. Other programs at BLS also have autocoders developed and trained with data from BLS’s programs (Fincher, personal communication, December 1, 2021).
Other autocoding programs used outside of BLS show similar rates of agreement. For example, the National Institute for Occupational Safety and Health’s Industry and Occupation Computerized Coding System and the Standardized Occupational Coding for Computer-Assisted Epidemiological Research (commercially available) provide acceptable rates of agreement with manual coding of SOC occupations, particularly when NAICS code is incorporated into the model (Buckner-Petty et al., 2019).
The benefits associated with the autocoding approach include reduced employer/respondent burden as well as increased reporting accuracy. Autocoding of job titles to SOC occupations improves comparisons of similarly situated employees by improving the reliability and accuracy of the categories used (Fincher, personal communication, December 1, 2021). In principle, if autocoding of job titles were employed for EEOC pay data, BLS OEWS staff could possibly apply their autocoding tool to EEOC data (once stripped of identifiers by EEOC, as appropriate) and return the result to EEOC for remerging. This could provide more detailed occupational data at lower burden to EEOC and also enhance the quality of the occupational database behind BLS’s autocoder.
___________________
8 To determine the model’s accuracy, results are tested against “gold-coded” occupations that are manually coded separately. The current gold-code dataset contains approximately 50,000 records. Although the OEWS autocoder produces a code for every job title received, each job title and code are reviewed manually and recoded if the autocode is incorrect. In addition, coders only see autocodes that receive a score above the set threshold (typically a probability or p-value of 0.6). To avoid misleading coders with codes with above-threshold p-values, those codes are not provided and the job titles are coded manually without input from the autocoder (Fincher, personal communication, December 1, 2021).
It is important to recognize that SOC categorizes job titles based on actual work performed, not job title. Autocoders must therefore consider actual job duties rather than relying only on job titles. The programming method used by OEWS takes into account NAICS code and related characteristics when assigning SOC codes to reported job titles (Fincher, personal communication, December 1, 2021).
Hours Worked
The panel also discussed the definition and collection of hours-worked data by the Component 2 instrument. Hours-worked data are necessary to adjust annual pay for differences in labor supply and length of employment within the reference year. Information on hours worked could be used to assess pay-equity issues in terms of hourly rate of pay, as well as demographic disparities in access to full-time and overtime hours.
Reporting Hours Worked
In the Component 2 data collection for non-exempt employees under the Fair Labor Standards Act (FLSA), employers must report actual hours worked.
For FLSA-exempt employees, employers have the option to either: (1) report actual hours worked by exempt employees if the employer already maintains accurate records of this information; or (2) report a proxy of 40 hours per week for full-time exempt employees and 20 hours per week for part-time exempt employees, multiplied by the number of weeks the employees were employed during the EEO-1 reporting year. (EEOC, 2018, p. 5)
Filers were also instructed to report aggregated hours worked only for those employees who worked during the selected workforce snapshot period. There were no separate measures for part-time or full-time worker status, or exempt or non-exempt worker status.
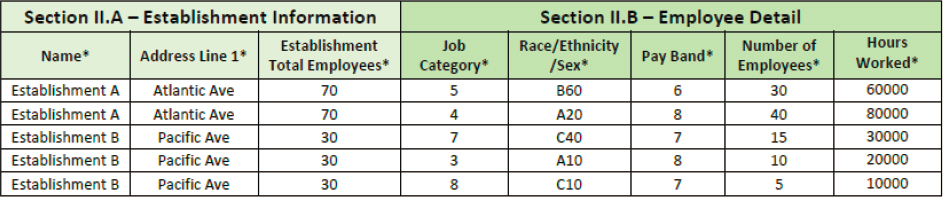
As described in Chapter 2, the Component 2 instrument has two matrices. The first is used to report employee counts by sex/race/occupation/pay band (Figure 2-2). The second matrix is used to report hours-worked data by sex/race/occupation/pay band corresponding to the employee count presented in the first matrix. Filers were instructed to report the hours worked during the reporting year by all employees counted in the cell on the summary compensation data matrix, total it, and record the total in the corresponding cell on the hours-worked matrix (EEOC, 2018).
Findings
Paid leave:
hours worked generally do not include paid leave, such as sick leave, vacation leave, or paid holidays (EEOC, 2018). In its pay-data collection for reporting year 2020 (modeled on the Component 2 data collection, with some notable differences), the California Department of Fair Employment and Housing (CA DFEH) asked filers to report (for the entire reporting year) the total number of hours worked by each employee plus the hours the employee was on any form of paid time off (such as vacation, sick, or holiday time) (CA DFEH, 2021). This requirement better matches the pay-data concept of annual earnings reported on W-2 forms.
Part-time, full-time, and overtime:
one potential concern with the hours-worked data is that total hours reported does not reflect which employees work part-time, full-time, or overtime. Therefore, it is difficult to identify variations in pay that could be attributed to scheduling, hours worked, or position type, for example.
Estimated hours:
additionally, for exempt employees, employers may have used an estimate of hours worked, since employers are not required to maintain accurate timekeeping records for these employees. To assume 40-hour work weeks or 2,080 hours per year for all employees whose time is not recorded does not accurately reflect the variety of unique work schedules in today’s workforce. Therefore, these estimates are imperfect reflections of hours worked by exempt employees, and any derivative calculations regarding average hourly wages using these numbers are essentially estimates of estimates.
Reporting format:
the matrix used in the Component 2 instrument to collect hours-worked data was a separate matrix from that used to collect pay-band data. The separation of the two types of data would make it more difficult for employers to notice mismatches and make it easier to report incorrect data in a particular matrix (e.g., reporting employee counts in the cell for employee hours worked). The extent to which this occurred will be discussed in Chapter 5. It is notable that CA DFEH collected hours-worked information as a separate column alongside employee-count information (see Figure 3-2) instead of as two separate, but very similar, matrices, as used by the Component 2 instrument (see Figure 2-2). The CA DFEH method is a preferred format in that it reduces the chance of a responding firm reporting employment but not hours (or vice versa), as documented in Chapter 5. This is also the format used by the Component 2 instrument’s data-upload mode.
SOURCE: California Pay-Data Reporting Portal, User Guide. California Department of Fair Employment and Housing, 2020, Version 1.1, p. 19. https://www.dfeh.ca.gov/wp-content/uploads/sites/32/2021/01/CA-Pay-Data-Reporting-User-Guide.pdf
Sex and Gender
As described in Chapter 1, EEOC has enforcement responsibility under the Equal Pay Act of 1963 and Title VII of the Civil Rights Act of 1964 (hereafter Title VII) to prohibit pay inequities for similarly situated employees based on sex.
“In Bostock vs. Clayton County, Georgia, No. 17-1618, the U.S. Supreme Court held that firing individuals because of sexual orientation or transgender status violates Title VII’s prohibition on discrimination because of sex. The Court reached its holding by focusing on the plain text of Title VII” (EEOC, 2022f).
Accordingly, EEOC’s authority to identify and address pay inequities is expanded to include those faced by LGBTQIA+ people. “The law forbids sexual orientation and gender identity discrimination in any aspect of employment, including hiring, firing, pay, job assignments, promotions, layoffs, training, fringe benefits, and any other employment term or condition” (EEOC, 2022f).
Male/Female
In the Component 2 data collection, “sex” is not defined or mentioned in the section of instructions entitled “Race, Ethnic, and Sex Identification” (EEOC, 2018). The instrument provides filers with separate columns to report employee counts and hours worked for male and female employees.
The Frequently Asked Questions document accompanying the Component 2 instrument includes a question asking how employers can report data on employees who do not fall within the male/female binary (EEOC, 2018). There is no statement that employers should or must give employees the option to identify as something other than male or female (e.g., non-binary, intersex, or other gender identity). Employers that collect data with a broader set of categories and wish to report them are instructed to note counts and hours worked for non-binary employees in the comment box on the certification page of the instrument.
Findings
In its 2020 Bostock vs. Clayton County decision, the Supreme Court ruled that discrimination based on gender identity and sexual orientation constitutes sex discrimination under Title VII. However, data challenges can affect EEOC’s ability to sufficiently address these inequities, namely measurement conceptualization and standard collection, and the availability of data for reporting purposes.
Historically, measurement in federal data collections has conflated biological sex and gender identity “under the assumption that they are mutually determined and do not differ from each other, despite widespread understanding that sex refers to biological characteristics and gender refers to social and behavioral characteristics” (the National Academies of Sciences, Engineering, and Medicine, 2022, p. 17).
The EEO-1 instrument reflected this history of conflating the concepts and terms. It measured (biological) sex as male or female only and did not measure gender identity in the pay-band matrices. Subsequent instructions for the 2017–2018 Component 2 data collection added a provision to measure whether an employee has a non-binary gender identity using text comments (see below) but did not specify other possible gender identities, such as transgender.
By treating data on employees with non-binary identities as an exception to be noted in a comments box, the Component 2 data unclearly categorize people with non-binary identities. Information in the comment box is difficult to extract from the current data file to analyze filers that reported employee counts and hours worked for non-binary employees. In addition, pay-band, job-category, and race/ethnicity information is not systematically collected for non-binary persons, making it impossible to examine pay inequities for this group. Component 2 data are therefore inadequate for pay comparisons that might identify differences in outcomes for people identifying as transgender compared with those who are cisgender (i.e., those whose gender identity matches their sex assigned at birth).
If better data on sexual orientation and gender identity of employees were available, the Court’s ruling could be enforced more effectively. Failing that, when EEOC receives reports of sex discrimination based on gender identity or sexual orientation, Component 2 sex-disparity data cannot be used as an initial screen.
In contrast, the CA DFEH pay-data collection added a non-binary gender category for the collection of compensation data. Their race, ethnicity, and sex codes allow for reporting male, female, and non-binary people (CA DFEH, 2020). However, the CA DFEH definition still fails to capture the full range of gender identities. Transgender people might identify as either male or female and not necessarily as non-binary, making even a three-category sex definition problematic.
Measurement of sexual orientation and gender identity in federal data collections continues to mature (the National Academies of Sciences, Engineering, and Medicine, 2022; Morgan et al., 2020; National Institutes of Health, 2020; OMB, 2016a,b; Park, 2016). For example, the Census Bureau’s Pulse Survey offers an example of possible response options for
a gender identity question: male/female, transgender, or none of these.9 A separate but related issue is whether sexual orientation and gender identity data are collected by employers, and (just as with race/ethnicity and sex) the extent to which proxy reporting of sexual orientation and gender identity would be acceptable for this mandatory data collection given privacy concerns.
Accordingly, given its potential to address pay inequities faced by LGBTQIA+ persons, to assist the maturation of research on collecting sexual orientation and gender identity data, and to contribute to the increasing collection of these data by federal agencies, EEOC should develop and test its instruments to allow for reporting employees’ sexual orientation and gender identities. However, the panel recognizes that these data may not be available in human resource systems for reporting purposes and that asking employees to self-report on sexual orientation and gender identity raises important privacy concerns.
Race/Ethnicity
EEO-1 Race/Ethnicity Groups
Title VII prohibits pay discrimination on the basis of race or color. The Component 2 instrument collects race/ethnicity data as Hispanic or Latino, White, Black or African American, Native Hawaiian or Other Pacific Islander, Asian, American Indian or Alaska Native, and Two or more races. Filers were instructed to report based on self-identification, if possible. Employees must be counted by sex and race/ethnicity for each of the 10 occupational categories. “Every employee must be accounted for in only one of the race/ethnicity categories” (EEOC, 2020f, p. 5).
Findings
A federal standard on the collection of data on race/ethnicity was established to facilitate comparison of race/ethnicity data collected by federal agencies and thereby improve those data for policy making (OMB, 1997).
The federal standard has five categories for data on race: American Indian or Alaska Native, Asian, Black or African American, Native Hawaiian or Other Pacific Islander, and White. There are two categories for data on ethnicity: Hispanic or Latino, and Not Hispanic or Latino (OMB, 1997). Respondents are encouraged to select all that apply. There is no category
___________________
9 This wording may be controversial since it assumes that transgender people do not identify as male or female.
for more than one race. A combined format of the federal standard may be used, if necessary, for observer-collected data on race and ethnicity:
Both race (including multiple responses) and ethnicity shall be collected when appropriate and feasible, although the selection of one category in the combined format is acceptable. If a combined format is used, there are six minimum categories:
- American Indian or Alaska Native;
- Asian;
- Black or African American;
- Hispanic or Latino;
- Native Hawaiian or Other Pacific Islander; and
- White (OMB, 1997, p. 58789).
In addition, the federal standard provides instruction on how to report race/ethnicity data when responses are collapsed:
In cases where data on multiple responses are collapsed, the total number of respondents reporting ‘‘Hispanic or Latino and one or more races’’ and the total number of respondents reporting ‘‘more than one race’’ (regardless of ethnicity) shall be provided (OMB, 1997, p. 58789).
The panel notes that OFCCP’s 2000 Equal Opportunity Survey, which fielded a pay-data collection similar to the Component 2 collection, offered combined race/ethnicity response categories that are consistent with the federal standard (see Chapter 2). Specifically, the instrument collected race as American Indian or Alaska Native, Asian, Black or African American, Native Hawaiian or Other Pacific Islander, and White. The instrument collected ethnicity as Hispanic or Latino (all races), Hispanic or Latino (White race only), and Hispanic or Latino (all other races). It also provided a category for “race unknown” (Office of Federal Contract Compliance Programs, 2000).
This measurement method allows more precise comparison of similarly situated employees by allowing comparison of Hispanic or Latino (White race only) and Hispanic or Latino (all other races). It does not collect the EEO-1 category “Two or more races,” which is not consistent with the federal standard.
The panel was informed that EEOC contracted with the National Opinion Research Center at the University of Chicago in 2018 to evaluate, among other aspects, EEOC’s compliance with the federal standard on race/ethnicity. EEOC’s work related to assessing how to best measure race/ethnicity is ongoing, but preliminary results suggest the need to further study how best to count persons of more than one race (EEOC, 2021g,h).
The federal standard for collecting data on race/ethnicity was created “to provide a common language for uniformity and comparability in the collection and use of data on race and ethnicity by federal agencies” (OMB, 1997, p. 58788). Using these categories would provide EEOC with a more inclusive measure of race/ethnicity by allowing more detailed comparisons. Revising instructions to encourage reporting of more than one specific race/ethnicity where appropriate may also guard against inaccurate selection of only one category.
Additionally, use of these categories will allow greater comparison to, and therefore expand the utility of, other federal data sets; it will also facilitate benchmark comparisons for data quality analyses. OFCCP demonstrated how the federal standard measure for combined race/ethnicity could be used efficiently in pay-data collection. Federal statistical agencies have developed methods to bridge data collected using prior measures of race/ethnicity to correspond to current federal standards (Ingram et al., 2003).
PAY-EQUITY CONCEPTS NOT CURRENTLY INCLUDED
Other Groups Protected by EEOC
The panel’s review raised the broader question of compensation and employment data for employees in other protected categories not currently included in the EEO-1 data collections. As described in Chapter 1, Title VII prohibits a wide range of discriminatory employment practices based on sex (including gender identity, and sexual orientation), as well as race and color. It also protects against discriminatory employment practices based on national origin. However, EEOC is also charged with enforcing statutes protecting other groups:
- The Age Discrimination in Employment Act of 1967 prohibits discriminatory employment practices based on age.
- The Americans with Disabilities Act, the Civil Rights Act of 1991, the Americans with Disabilities Act Amendments Act of 2008, and the Rehabilitation Act of 1973 (Sec. 501 and 503) prohibit discriminatory employment practices based on disability status.
In addition, EEOC has equities in the enforcement of employment protections for veterans under the Uniformed Services Employment and Reemployment Rights Act, and OFCCP has responsibility to enforce employment protections for federal contractors under the Vietnam Era Veterans’ Readjustment Assistance Act of 1974.
Findings
The Component 2 data collection does not currently provide data that would help to identify the need to enforce prohibitions of discrimination based on age, disability, or veteran status. As noted above, the panel also finds that measurements of gender identity and sexual orientation are unavailable for purposes of examining pay inequities for those populations.
Additional Measures of Individual Characteristics
Pay differences can be attributable to bona fide seniority, merit, incentive systems, or additional factors other than protected status. Indeed, the panel was informed by employer stakeholders during open panel meetings that employer self-assessments of pay differences often take into account employee education, performance ratings, changes in work duties, assignments, location, and work experience (Fortney, 2021; Clements et al., 2021).
However, the Component 2 instrument does not include measures of the individual characteristics that may form a legitimate basis for pay differences. Not including these measures diminishes the robustness of data as used for initial EEOC investigations, as well as the utility of the data for employers to conduct self-assessments. Including variables in the Component 2 data collection that measure such individual characteristics could help explain legitimate pay differences and better focus EEOC’s efforts to understand and mitigate pay inequities. Including these variables would also increase the utility of Component 2 data for employer self-assessments. EEOC should work with employer groups and federal data collection agencies to explore ways to collect individual-level data, such as education, job experience, and tenure, which will support detailed pay-disparity analyses and employer self-assessments. The JEDx project (see Chapter 8) may be valuable in this regard.
The panel acknowledges that collecting additional measures would increase reporting burden and that, in many cases, filers would not have access to this information in human resource systems. However, where data collection is feasible (i.e., data collection is permitted, standard measures exist, and data are likely to be included in human resource systems), measurement challenges may be minimized and the value of improved data for protected groups may outweigh the cost and burden associated with collection. There may be additional benefit to including measures of age (perhaps categorized as less than 40 and greater than or equal to 40), which also
serves as a useful proxy in the analysis of pay differences in the absence of measures of educational attainment and work experience.
SUMMARY
This chapter reviewed the pay-equity concepts measured in the Component 2 data collection and assessed the utility of those concepts for measuring pay differences to thereby assist EEOC’s enforcement efforts. Alternatives were considered, as appropriate. The chapter also proposed various pay-equity concepts not currently measured in the Component 2 data collection, but which are feasible for large-scale data collection and may improve the usefulness of the data for its intended uses. Inclusion of these concepts may also enhance EEOC’s ability to enforce its statutory responsibilities as described in Chapter 1.
CONCLUSIONS AND RECOMMENDATIONS
Key conclusions and recommendations from the chapter’s findings appear below.
CONCLUSION 3-1: The 2017–2018 Component 2 collection measure of pay (W-2 Box 1) only partially reflects total compensation and may therefore mask compensation differences.
CONCLUSION 3-2: Use of pay bands in the 2017–2018 Component 2 data collection provides information that is less useful than that provided by individual-level pay data. Using established, improved methods, other federal agencies have demonstrated that individual-level pay data can substantially reduce respondent burden, increase precision in estimating pay gaps, and protect confidentiality. The Bureau of Labor Statistics’ Occupational Employment and Wage Statistics collection is an example.
CONCLUSION 3-3: The job categories in the 2017–2018 Component 2 data collection are insufficient for describing the modern workforce.
CONCLUSION 3-4: The 2017–2018 Component 2 data collection does not fully measure EEOC-protected groups under the sex and race/ethnicity concepts. The instrument does not provide a way to identify more than one specific race for an individual, nor do the data support
distinguishing Hispanic persons by race. The instrument does not collect data on LGBTQIA+ status.
CONCLUSION 3-5: The 2017–2018 Component 2 data collection does not allow measurement of pay differences experienced by other groups protected by EEOC’s authority. Measuring pay differences experienced by persons age 40 and older, persons with disabilities, and veterans is within the scope of EEOC’s authority and policy equities.
CONCLUSION 3-6: The 2017–2018 Component 2 data collection does not include measures of legitimate causes of pay differences, such as educational attainment and tenure. Such information would assist both EEOC enforcement efforts and employers’ self-assessments. Employer self-assessments could contribute to improved employment equity through self-monitoring and adjustment.
CONCLUSION 3-7: Improvements could be made to the current Component 2 instrument to substantially reduce, and possibly eliminate, many of the errors and weaknesses observed in the 2017–2018 Component 2 data.
CONCLUSION 3-8: EEOC’s current approach for aggregate pay and hours-worked data severely limits the utility of the data collected, unnecessarily increases employer burden, and complicates the collection of additional key information. Collecting data from employers at the level of individual workers may be less burdensome than the current approach and would markedly increase the utility of pay data.
RECOMMENDATION 3-1: EEOC should implement a standard reporting period to improve comparability of data and reduce respondent burden.
RECOMMENDATION 3-2: EEOC should require professional employer organizations (PEOs) to submit data separately for each firm they represent, use the client firm’s industry code, and require employing firms to certify PEO submissions before filing.
RECOMMENDATION 3-3: EEOC should collect W-2 Box 5 data to measure total compensation, instead of W-2 Box 1 data.
RECOMMENDATION 3-4: If EEOC continues to collect pay data in bands, narrower pay bands should be adopted, and the number of bands should be expanded for top earners to better capture variation in pay.
RECOMMENDATION 3-5: EEOC should update instructions to filers to conform to the federal standard on measuring race/ethnicity. This standard offers solutions for reporting race/ethnicity data in a combined format.
RECOMMENDATION 3-6: EEOC should work with other federal agencies to develop and test ways to measure employees’ sex, gender identity, and sexual orientation in a manner appropriate for EEOC data collections.
RECOMMENDATION 3-7: EEOC should develop, test, and (if found acceptable) implement modifications to the Component 2 instrument to collect individual-level employee pay data, which reflects employers’ current reporting practice to state and federal agencies. EEOC’s transition to individual-level pay data should be informed by the Occupational Employment and Wage Survey instrument and protocol. Field testing should estimate respondent burden relative to alternative methods and assess confidentiality protections to be applied.
RECOMMENDATION 3-8: EEOC should adopt the Standard Occupational Classification system for classifying occupations to provide greater precision for comparisons of similarly situated employees. To limit respondent burden, EEOC should explore established, improved data systems for occupational coding of individual-level job titles, such as those used by the Bureau of Labor Statistics’ Occupational Employment Wage Statistics collection.
RECOMMENDATION 3-9: EEOC should distinguish between Fair Labor Standards Act-exempt and non-exempt workers, and between part-time and full-time workers. A measure for the number of weeks worked should be included to account for part-year employment. EEOC should only collect hours worked for non-exempt employees.
RECOMMENDATION 3-10: EEOC should explore the measurement of pay gaps for additional groups protected under its authority or policy equities, including persons age 40 and older, persons with disabilities,
and veterans. To do this robustly while minimizing respondent burden, other federal data collections measuring pay of these groups, such as the American Community Survey, may be instructive.
RECOMMENDATION 3-11: EEOC should work with employer groups and federal data-collection agencies to explore ways to collect individual-level data, such as education, job experience, and tenure, which will support detailed pay-disparity analyses and employer self-assessments.
This page intentionally left blank.


