
OBJECTIVE
This chapter assesses the utility of 2017 and 2018 Component 2 data1 for enforcement purposes. As discussed in Chapter 1, EEOC could intend to use compensation data to assist with initial charge investigations; focus systemic investigations; motivate commissioner charges; and produce reports on local, regional, national, and industry-level pay gaps. Component 2 data could be intended to be used by the Office of Federal Contract Compliance Programs (OFCCP) to conduct outlier analyses to identify contractors that depart substantially from comparable benchmarks.
To achieve these enforcement purposes, analysts would need to use Component 2 data to (1) identify sex and race/ethnicity pay gaps at the establishment, occupational, and industry levels, and at various geographical levels; (2) identify job-level pay gaps at establishments targeted by EEOC charges; and (3) compare pay gaps at targeted establishment(s) to peer establishments.
This chapter describes several analyses assessing the use of Component 2 data for these purposes. Specifically, it provides an analysis of sex and race/ethnicity pay gaps in a single labor market, defined by industry and geography: the technology sector in Silicon Valley. Unadjusted sex and race/ethnicity pay gaps at the local labor-market level and at four hypothetically targeted establishments are examined. The panel’s intent is to use a mock analysis to demonstrate how Component 2 data could be used for enforcement purposes, specifically during charge investigations, to direct systemic enforcement, to identify commissioner charges, and for industry-wide reports. Drawing on the results of this exercise, the utility of Component 2 data for EEOC and OFCCP enforcement efforts is discussed.
ANALYTICAL APPROACH
Following a 2016 EEOC report called Diversity in High Tech (EEOC, 2021j), the current analysis focused on the Silicon Valley technology labor market and four EEO-1 job categories: executives/senior-level officials and managers; first- or midlevel officials and managers; professionals; and technicians. As the EEOC report attests, the technology sector has seen a
___________________
1 In 2018 and 2019, EEO-1 data collections occurred in two components. The customary EEO-1 instrument containing composition data (Component 1) was collected in 2018 for reporting year 2017, and in 2019 for reporting year 2018. In 2019 and 2020, pay data (Component 2) were collected for reporting years 2017 and 2018. In this report, we refer to historical EEO-1 data collections as EEO-1, and the 2017 and 2018 EEO-1 Component 1 and Component 2 instruments as “Component 1” and “Component 2,” respectively. All information collected by the Component 1 instrument is also collected by the Component 2 instrument.
significant increase in jobs in recent years (Richards and Terkanian, 2013) and it employs a substantial share of the U.S. professional workforce. Moreover, the report shows a lack of diversity in the technology sector and experiences of bias, isolation, and early-exit are well-documented among women and racial minority workers in this sector (Williams, 2015). For these reasons, the technology sector, and its professional workforce are a timely example for this analysis of pay gaps and of particular interest to EEOC. Another benefit of focusing on the Silicon Valley technology sector is that establishments are sufficiently large to avoid coverage issues, which are more serious among small establishments. However, the panel notes that focusing on the technology sector may provide an overly optimistic view of data utility, particularly in estimating raw gaps at the local labor-market level, as coverage in the Silicon Valley technology sector is expected to be relatively high, based on industry coverage patterns discussed in Chapter 4.
To simulate the types of analyses that may be used in initial charge investigations and systemic enforcement, aggregate sex and race/ethnicity pay gaps for the four job categories of interest were computed to establish average gaps in the local labor market. Attention was paid to outlier establishments, or those that departed substantially from the local labor-market average. Four hypothetically targeted establishments were then analyzed, and sex and race/ethnicity pay gaps were identified at these establishments. Finally, these establishment-level gaps were compared to the local labor-market average.
DATA AND MEASURES
The technology sector in Silicon Valley was defined using four-digit North American Industry Classification System (NAICS) codes and the core-based statistical areas (CBSAs) of San Francisco-Oakland-Fremont and San Jose-Sunnyvale-Santa Clara zip codes, replicating the local labor market analyzed in the 2016 EEOC report. A list of NAICS codes included in the sample and a list of cities included in the two CBSAs (41860 and 41940) are provided in Appendixes 7-1 and 7-2. Based on these definitions, 1,210 establishments were identified in 2018 Component 2 data. Analysis was restricted to establishments and sex-race/ethnicity-occupation-pay (SROP) cells with “green flags,” as defined in Chapter 5, to eliminate SROP cells with implausible values. The same filtering process described in Chapter 6 was used, which involved removing establishments that were outliers in terms of employee numbers, had problematic data for hours worked, had missing data, or could not be matched to Component 1 data for verification
of employee counts. This resulted in a total sample size of 946 establishments, or 78 percent of the original Silicon Valley technology sector sample. Summary statistics for the original Silicon Valley sample (n = 1,210) and the analytic sample used here (n = 946) are similar, indicating that data filtering is not patterned by establishment or employee characteristics (see Appendix 7-3).
Calculating Pay Gaps
Raw or “unadjusted” pay gaps between White men and other sex and race/ethnicity groups were calculated based on differences in annual pay. As the Component 2 instrument uses 12 pay bands to measure pay, the midpoints of pay bands were used to estimate annual pay for workers in each unique SROP cell. For the top and bottom pay bands, data from the American Community Survey (ACS) were used to compute the median pay over the previous 12 months for individuals in California in those pay bands. This approach is described in detail in Chapter 6.
Pay Bands
As discussed in Chapter 3, one concern with using Component 2 pay-band data to measure pay disparities is that pay bands may be too wide to capture within-job pay disparities. This may especially be the case in the lowest- and highest-paid job categories. For instance, in many establishments, all executives are in the top pay band, with wages above $208,000. However, for some sex and race/ethnicity groups, average wages could be near the lower bound (i.e., $210,000), while for other sex and race/ethnicity groups, average wages might be much higher (e.g., $310,000). Yet Component 2 data would suggest pay parity because both groups are in the same pay band. Moreover, given that pay gaps are calculated in terms of differences in pay-band midpoints, there must be at least two pay bands per sex-race/ethnicity-occupation (SRO) cell to calculate sex and race/ethnicity gaps.
These issues were assessed in the Silicon Valley technology sector sample by examining the number of pay bands per SRO cell by establishment characteristics, occupation, sex, and race/ethnicity. As shown in Table 7-1, the typical Silicon Valley technology establishment shows sufficient variation in wages to calculate pay gaps, with an average of three pay bands used per SRO cell. However, lack of variation is an issue in small establishments. For establishments with fewer than 100 workers, 86 percent of SRO cells use one to three pay bands, with an average of only two bands. For
TABLE 7-1 Number of Pay Bands Used per SRO Cell, by Selected Employer Characteristics
| Characteristic | Mean # of Pay Bands | Percentage of Cells by Number of Pay Bands | |||
|---|---|---|---|---|---|
| 1–3 | 4–6 | 7–10 | 11–12 | ||
| Total | 3.0 | 69.4 | 18.7 | 9.4 | 2.5 |
| Establishment Size | |||||
| Less than 100 | 2.0 | 85.6 | 12.7 | 1.7 | * |
| 100–249 | 2.8 | 71.8 | 19.5 | 8.1 | 0.7 |
| 250–499 | 3.2 | 64.4 | 22.4 | 11.8 | 1.4 |
| 500–999 | 3.8 | 58.2 | 21.9 | 15.8 | 4.2 |
| 1,000 or More | 4.8 | 47.9 | 21.3 | 19.0 | 11.9 |
| Federal Contractor | |||||
| Yes | 3.2 | 68.0 | 18.9 | 10.0 | 3.0 |
| No | 2.7 | 73.6 | 18.0 | 7.4 | 1.0 |
| Submission Status | |||||
| Single Establishment | 2.9 | 71.3 | 19.6 | 7.9 | 1.2 |
| Consolidated Report | 3.1 | 69.1 | 18.6 | 9.6 | 2.7 |
| Mode of Administration | |||||
| Online-entry | 3.1 | 68.4 | 19.0 | 9.9 | 2.8 |
| Data-upload | 2.8 | 72.4 | 18.0 | 8.0 | 1.6 |
| NAICS | |||||
| 32–33: Manufacturing | 2.9 | 70.4 | 19.5 | 8.1 | 2.0 |
| 51: Information | 3.4 | 65.4 | 18.6 | 12.1 | 3.9 |
| 54: Professional, Scientific, and Technical Services | 3.0 | 70.7 | 17.8 | 9.2 | 2.3 |
SOURCE: Panel generated from Component 2 employer, establishment, and employee files for 2018.
NOTE: Excludes data based on all rules in Appendix 6-1. Data limited to Silicon Valley in the NAICS codes specified in Appendix 7-1. Minimum and maximum pay-band values for all characteristics shown are 1 and 12, respectively, with the exception of establishment size less than 100 employees (maximum value is 10). * Rounds to zero.
establishments of 500–999 employees, the average number of pay bands used per SRO cell is four, and for establishments of more than 1,000 employees, the average is five. A large number of pay bands might indicate that job categories are not precise enough to be meaningful for pay-band analysis; however, only 12 percent of establishments overall had seven or more pay bands per SRO cell, and some of the variation was likely due to part-time or partial-year employees, whose annual pay does not accurately reflect their hourly wages.
The frequency of pay bands by sex, race/ethnicity, and occupation was also examined (Table 7-2). As expected, executives showed less pay dispersion compared with other job categories, with a mean of roughly 1.4 bands and 95 percent having 1–3 bands. This underscores the issue of over-aggregation of pay among executives (as executives are concentrated in the highest pay band) and limits the utility of Component 2 data, as collected, for identifying executive pay gaps. As discussed in Chapter 3, further differentiation in pay is in order, especially for high-paying occupations, to identify within-job pay gaps by sex and race/ethnicity.
Table 7-2 also shows that women in the Silicon Valley technology sector are concentrated in slightly fewer pay bands than men, and most workers of color (including Black workers, Hispanic workers, and workers from other race groups) are concentrated in fewer bands compared to White workers. However, Asian workers in the Silicon Valley technology sector show more pay differentiation (3.8 bands) relative to White workers (3.6 bands), though the difference is small.
Adjusted Versus Unadjusted Gaps
It is important to note that the differences in pay observed between sex and race/ethnicity groups are not adjusted by individual-level factors that affect pay, such as hours worked, experience, tenure, or education. The raw pay gap analysis did not constitute a “pay equity” or “pay disparity” analysis, as such analyses would involve adjusting raw pay gaps with individual-level attributes or predictors known to legitimately affect wages. Component 2 data lack such information, with the exception of aggregate data on hours worked.
Hours Worked
An attempt was made to adjust raw annual wages by computing hourly wages, by multiplying the midpoint for each pay band by the number of employees in the band and dividing by the total number of hours worked
TABLE 7-2 Number of Pay Bands Used per Selected Employee Characteristics
| Characteristic | Mean # of Pay Bands | Percentage of Cells by Number of Pay Bands | |||
|---|---|---|---|---|---|
| 1–3 | 4–6 | 7–10 | 11–12 | ||
| Total | 3.1 | 67.9 | 19.6 | 9.8 | 2.7 |
| Job Category | |||||
| Executives | 1.4 | 95.1 | 4.3 | 0.6 | 0.1 |
| Managers | 2.7 | 72.4 | 21.4 | 5.3 | 0.9 |
| Professionals | 4.2 | 51.9 | 24.4 | 18.0 | 5.7 |
| Technicians | 2.4 | 78.8 | 16.2 | 4.5 | 0.5 |
| Sex | |||||
| Male | 3.2 | 66.6 | 20.1 | 10.4 | 2.9 |
| Female | 3.0 | 69.5 | 19.0 | 9.0 | 2.4 |
| Race/Ethnicity | |||||
| Hispanic | 2.5 | 78.7 | 15.4 | 5.3 | 0.6 |
| White | 3.6 | 59.8 | 23.8 | 12.9 | 3.5 |
| Black/African American | 2.0 | 86.0 | 10.5 | 3.2 | 0.2 |
| Asian | 3.8 | 57.1 | 24.2 | 14.0 | 4.8 |
| All Other Races | 2.2 | 84.1 | 11.7 | 3.6 | 0.6 |
SOURCE: Panel generated from Component 2 employer, establishment, and employee files for 2018.
NOTE: Excludes data based on all rules in Appendix 6-1. Data limited to Silicon Valley in the NAICS codes specified in Appendix 7-1. Minimum and maximum pay-band values for all characteristics shown are 1 and 12, respectively, with the exception of the executives job category (maximum value is 11).
for the corresponding cell. This came with challenges, however, as computing hourly wages in this way requires the assumption that all workers in the same SROP cell have the same hourly rate. Of course, employees in the same cell may not share the same hourly rates due to individual-level differences in hours or weeks worked. For instance, a worker working half time at the same annual wage would be assigned twice as much per hour as a worker working full-time. In short, if there are multiple workers in the same SROP cell, there is no way of knowing how to distribute the hours worked among them.
Attempts to apportion hours worked equally among workers in the same cell resulted in implausible values for hourly wages. These errors occurred frequently enough to render hourly wage estimates suspect for multiple SRO groups. As discussed in Chapters 3 and 6, this is a critical limitation of the current format for measuring hours worked in the Component 2 instrument. The panel recommends that analysts extensively scrutinize and clean Component 2 hours-worked data before transforming annual pay into hourly wage rates for enforcement purposes. Statistically controlling for aggregate hours worked might be safer than endeavoring to compute hourly wages, but even here the error structure is not well understood by the panel.
In the mock analysis presented here, the focus was on annual wages rather than hourly wage rates. However, the panel recognizes that, in doing so, crucial information needed to interpret differences in pay will be lost. This may result in both overestimates of pay gaps and disparities between sex and race/ethnicity groups, due to the lower-earning group working fewer hours and weeks, and underestimates of pay gaps, such as scenarios in which earnings are equivalent even though one group is working more hours and should receive higher pay.
Job Categories
Following the 2016 EEOC Diversity in High Tech report, four EEO-1 occupational categories were profiled in the current exercise: executives/senior-level officials and managers; first- or midlevel officials and managers; professionals; and technicians.2 Although restricting analysis to a single sector (technology) limits the breadth of jobs contained in each category, these occupational categories are still crude and may lead to errors in measurement of pay differences, including both overestimation and underestimation of gaps. The category of professionals, for instance, is a heterogenous job category in the technology sector; the aggregation of many job titles into the professional category may lead to the identification of raw pay gaps due largely to differences in job titles and duties, thus contributing to overestimation of gaps. The executive category, in contrast, is less heterogeneous and may post smaller pay gaps simply because of greater similarity in job titles and duties, as well as the use of fewer pay bands. In short,
___________________
2 As the 2016 EEOC report showed (EEOC, 2021j), roughly two-thirds of technology sector employment is in the four job categories profiled, with more than half of the industry’s employees being professionals or technicians.
the aggregated nature of the occupational categories in the Component 2 instrument contributes to uncertainty in assessments of pay differences. Increased precision in measurement of job categories, such as the automated occupational coding protocols recommended in Chapter 3, would improve accuracy in the measurement of pay differences at the local labor-market and establishment levels.
RESULTS
Local Labor-Market Profile: Silicon Valley Technology Sector
Table 7-3 provides summary statistics on the Component 2 sample representing the Silicon Valley technology sector, as defined by geographical and industrial codes. Summary statistics are provided for each focal EEO-1 job category by 10 sex and race/ethnicity groups: White non-Hispanic men, White non-Hispanic women, Black men, Black women, Hispanic men, Hispanic women, Asian men, Asian women, men of all other race groups, and women of all other race groups. For the last two categories, Native Hawaiian or Other Pacific Islander, American Indian/Alaska Native, and Two or More Race groups were aggregated due to small cell sizes. Table 7-3 presents numbers, percentages, mean annual wages, and standard deviations for each sex and race/ethnicity group across the four target occupations. Mean pay gaps and percentage pay gaps were calculated for each group in terms of relative difference from White non-Hispanic men. Within-job differences are discussed below.
Caution is advised because these estimates of annual wages reflect error due to the overaggregation of pay (especially for high earners), and they are not adjusted for hours or weeks worked. To the extent groups work different numbers of hours per week or have higher rates of entry and exit from employment, comparisons to White non-Hispanic men may be affected. The Silicon Valley labor market is a unique labor market in many ways. Wages are generally high, as is competition for jobs, job turnover, and the use of temporary labor (Hyde, 2003). This may affect how employees and hours worked are reported, as many employees may work partial years. Silicon Valley also differs demographically from the national labor force. Compared to the EEO-1 private-sector labor force nationwide, the representation of White workers, Asian workers, and men is high in the Silicon Valley technology sector while the representation of Black workers, Hispanic workers, and women is relatively low (EEOC, 2021j). This makes the calculation of pay gaps for Asian men and Asian women, relative to White men, feasible for the Silicon Valley labor force whereas calculations
| Number | Percent | Annual Wages | Hourly Rate | Percent Gap on Annual Wagesa | |||||
|---|---|---|---|---|---|---|---|---|---|
| Mean | Standard Deviation | Mean Pay Gap | Mean | Standard Deviation | Mean Pay Gap | ||||
| Executives | 9,747 | 100.0 | $270,917.6 | $121,127.4 | –$4,388.5 | $199.5 | $5,918.8 | –$23.3 | –1.6 |
| White Men (reference) | 4,855 | 49.8 | $275,306.2 | $133,623.3 | $0.0 | $222.8 | $10,098.0 | $0.0 | 0.0 |
| White Women | 1,254 | 12.9 | $264,529.3 | $118,475.7 | –$10,776.9 | $167.7 | $552.3 | –$55.1 | –3.9 |
| Black/African American Men | 69 | 0.7 | $272,416.7 | $72,194.5 | –$2,889.4 | $156.0 | $119.8 | –$66.8 | –1.1 |
| Black/African American Women | 34 | 0.3 | $241,941.6 | $86,364.4 | –$33,364.6 | $136.2 | $34.3 | –$86.6 | –12.1 |
| Hispanic Men | 216 | 2.2 | $266,961.5 | $84,116.8 | –$8,344.7 | $200.1 | $544.4 | –$22.7 | –3.0 |
| Hispanic Women | 82 | 0.8 | $262,825.0 | $82,781.8 | –$12,481.2 | $220.3 | $642.5 | –$2.4 | –4.5 |
| Asian Men | 2,398 | 24.6 | $270,830.1 | $125,398.2 | –$4,476.1 | $185.8 | $924.7 | –$36.9 | –1.6 |
| Asian Women | 639 | 6.6 | $257,866.5 | $118,074.4 | –$17,439.7 | $153.1 | $312.9 | –$69.6 | –6.3 |
| All Other Races Men | 141 | 1.4 | $263,293.7 | $85,717.0 | –$12,012.5 | $167.8 | $360.2 | –$55.0 | –4.4 |
| All Other Races Women | 59 | 0.6 | $249,376.8 | $91,962.1 | –$25,929.4 | $142.3 | $54.0 | –$80.5 | –9.4 |
| Managers | 65,386 | 100.0 | $225,698.1 | $210,160.9 | –$13,613.2 | $139.5 | $682.7 | –$8.5 | –5.7 |
| White Men (reference) | 22,365 | 34.2 | $239,311.3 | $239,243.2 | $0.0 | $148.1 | $911.7 | $0.0 | 0.0 |
| White Women | 9,019 | 13.8 | $224,603.1 | $193,600.5 | –$14,708.2 | $131.3 | $467.5 | –$16.8 | –6.2 |
| Black/African American Men | 716 | 1.1 | $201,726.9 | $133,828.4 | –$37,584.4 | $118.8 | $263.3 | $29.3 | –15.7 |
| Black/African American Women | 473 | 0.7 | $202,745.5 | $121,056.2 | –$36,565.8 | $119.3 | $251.1 | –$28.8 | –15.3 |
| Hispanic Men | 2,069 | 3.2 | $209,527.0 | $144,027.1 | –$29,784.3 | $142.4 | $532.3 | –$5.7 | –12.5 |
| Hispanic Women | 1,066 | 1.6 | $193,205.0 | $129,813.7 | –$46,106.3 | $135.5 | $389.3 | –$12.6 | –19.3 |
| Asian Men | 20,152 | 30.8 | $220,251.6 | $271,850.9 | –$19,059.7 | $136.8 | $863.3 | –$11.3 | –8.0 |
| Asian Women | 8,074 | 12.3 | $218,259.1 | $191,000.1 | –$21,052.1 | $134.4 | $595.0 | –$13.7 | –8.8 |
| All Other Races Men | 889 | 1.4 | $212,256.8 | $118,719.6 | –$27,054.5 | $152.0 | $408.5 | $3.9 | –11.3 |
| All Other Races Women | 563 | 0.9 | $196,042.6 | $112,422.4 | –$43,268.6 | $125.3 | $237.6 | –$22.8 | –18.1 |
| Professionals | 209,739 | 100.0 | $172,851.1 | $273,363.1 | –$14,205.5 | $109.2 | $613.7 | –$2.1 | –7.6 |
| White Men (reference) | 56,931 | 27.1 | $187,056.6 | $333,157.3 | $0.0 | $111.3 | $639.9 | $0.0 | 0.0 |
| White Women | 20,537 | 9.8 | $151,461.0 | $217,141.6 | –$35,595.6 | $93.3 | $456.7 | –$17.9 | –19.0 |
| Black/African American Men | 2,775 | 1.3 | $136,396.1 | $150,405.6 | –$50,660.5 | $93.8 | $330.6 | –$17.5 | –27.1 |
| Black/African American Women | 1,469 | 0.7 | $120,809.8 | $124,531.7 | –$66,246.8 | $85.5 | $233.1 | –$25.8 | –35.4 |
| Hispanic Men | 6,258 | 3.0 | $156,745.8 | $168,115.5 | –$30,310.8 | $97.0 | $305.9 | –$14.3 | –16.2 |
| Hispanic Women | 3,358 | 1.6 | $129,719.5 | $129,074.4 | –$57,337.1 | $80.5 | $195.4 | –$30.8 | –30.7 |
| Asian Men | 77,176 | 36.8 | $183,677.7 | $375,161.6 | –$3,378.9 | $121.0 | $1,017.5 | $9.7 | –1.8 |
| Asian Women | 35,938 | 17.1 | $155,806.3 | $263,661.3 | –$31,250.3 | $98.8 | $555.6 | –$12.5 | –16.7 |
| All Other Races Men | 3,321 | 1.6 | $150,894.2 | $134,495.3 | –$36,162.4 | $97.0 | $246.2 | –$14.3 | –19.3 |
| Number | Percent | Annual Wages | Hourly Rate | Percent Gap on Annual Wagesa | |||||
|---|---|---|---|---|---|---|---|---|---|
| Mean | Standard Deviation | Mean Pay Gap | Mean | Standard Deviation | Mean Pay Gap | ||||
| All Other Races Women | 1,976 | 0.9 | $124,122.2 | $106,373.8 | –$62,934.4 | $84.5 | $204.7 | –$26.8 | –33.6 |
| Technicians | 12,073 | 100.0 | $75,299.2 | $72,446.4 | –$7,625.1 | $44.2 | $157.3 | –$3.3 | –9.2 |
| White Men (reference) | 3,326 | 27.5 | $82,924.3 | $99,286.2 | $0.0 | $47.5 | $80.1 | $0.0 | 0.0 |
| White Women | 689 | 5.7 | $65,430.7 | $63,221.7 | –$17,493.6 | $45.9 | $77.4 | –$1.6 | –21.1 |
| Black/African American Men | 371 | 3.1 | $73,630.5 | $49,910.3 | –$9,293.7 | $45.3 | $93.6 | –$2.2 | –11.2 |
| Black/African American Women | 65 | 0.5 | $58,695.0 | $41,416.0 | –$24,229.3 | $35.9 | $18.8 | –$11.6 | –29.2 |
| Hispanic Men | 1,273 | 10.5 | $74,071.2 | $61,627.4 | –$8,853.1 | $40.3 | $25.8 | –$7.2 | –10.7 |
| Hispanic Women | 442 | 3.7 | $59,039.6 | $45,496.0 | –$23,884.7 | $38.3 | $69.9 | –$9.2 | –28.8 |
| Asian Men | 3,715 | 30.8 | $77,051.7 | $76,657.9 | –$5,872.5 | $45.1 | $300.3 | –$2.5 | –7.1 |
| Asian Women | 1,633 | 13.5 | $67,909.7 | $57,724.8 | –$15,014.6 | $39.6 | $65.2 | –$7.9 | –18.1 |
| All Other Races Men | 437 | 3.6 | $73,396.5 | $51,329.8 | –$9,527.8 | $43.0 | $25.8 | –$4.5 | –11.5 |
| All Other Races Women | 122 | 1.0 | $61,152.5 | $51,258.4 | –$21,771.7 | $45.7 | $87.9 | –$1.8 | –26.3 |
SOURCE: Component 2 employer, establishment, and employee files for 2018, “green flags” only.
NOTE: Excludes data based on all rules in Appendix 6-1. Data limited to Silicon Valley in the NAICS codes specified in Appendix 7-1. N = 946 establishments.
a Relative to White men.
of wage gaps between Black and White workers are limited by low counts of Black employees. Labor markets with different demographic profiles will face different challenges. The panel’s intent is not to generalize to the national labor force but to provide a profile of raw pay gaps in a unique, largely professional, local labor force.
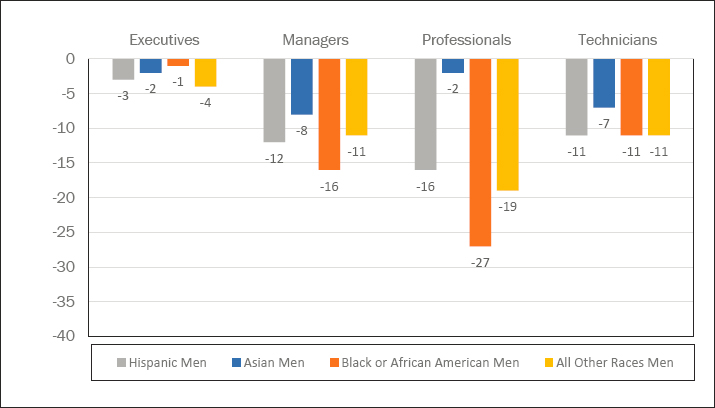
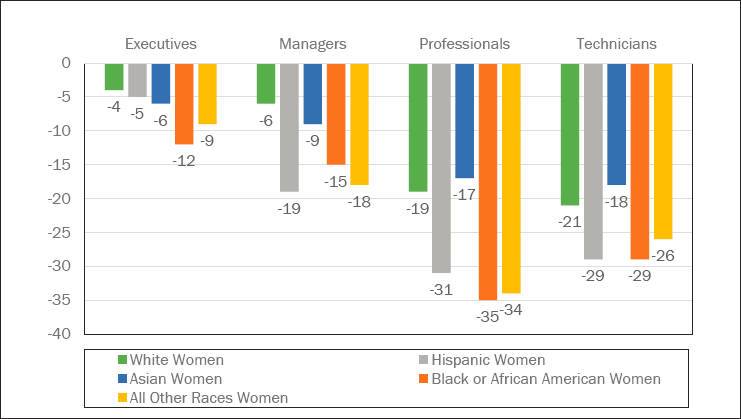
Figures 7-1 and 7-2 display percentage pay gaps relative to White non-Hispanic men by job category, for men and women of each race/ethnicity group, respectively. Across the four job categories White non-Hispanic men out-earn all other sex and race/ethnicity groups, and women of all race/ethnicity groups make less than their same-race/ethnicity male peers, except for Black women officials/managers whose average earnings are equivalent to Black men managers.
Executives
White men hold half (50%) of executive positions in the Silicon Valley technology sector, Asian men are about a quarter (25%) of executives, White women represent about 13 percent, and Asian women represent 7 percent. All other sex and race/ethnicity groups are represented in small percentages. For all race/ethnicity groups, men are better represented among executives compared to women. The average annual pay of executives in
SOURCE: Panel generated from Component 2 employer, establishment, and employee files for 2018.
NOTE: Excludes data based on all rules in Appendix 6-1. Data limited to Silicon Valley in the NAICS codes specified in Appendix 7-1.
SOURCE: Panel generated from Component 2 employer, establishment, and employee files for 2018.
NOTE: Excludes data based on all rules in Appendix 6-1. Data limited to Silicon Valley in the NAICS codes specified in Appendix 7-1.
Silicon Valley is $270,918,3 with White men posting the highest pay of $275,306 and Black women posting the lowest pay of $241,942. Pay gaps, as expressed in percentages relative to White men, run from just –1.05 percent for Black men to –12.12 percent for Black women. Executive pay gaps relative to White men are larger for women than for men of the same race/ethnicity group, as shown in Figures 7-1 and 7-2.
Officials and Managers
Among officials and managers in the Silicon Valley technology sector, White men (34%) and Asian men (31%) are represented in nearly equal proportions, again followed by White women (14%) and Asian women (12%). Hispanic men hold three percent of official and managerial jobs, and Hispanic women hold two percent, while Black men, Black women, and
___________________
3 The averages for high earners (i.e., executives and some officials/managers and professionals) will likely be underestimates, as median pay is used in the top band based on ACS data, whereas actual pay of executives is likely skewed. Moreover, the Component 2 instrument uses W-2 Box 1 earnings, which may not reflect full compensation for executives and high-level managers, officials, and professionals.
men and women of all other race backgrounds each are roughly one percent of officials and managers. The average pay for officials and managers in Silicon Valley is $225,698, with White men slightly above the average and all other sex and race/ethnicity groups below the average. The pay of Black men, Black women, Hispanic women, and women of other race/ethnicity groups is 15–20 percent lower than that of White men (Figures 7-1 and 7-2), while White women (6%), Asian men (8%), and Asian women (9%) post the smallest relative gaps. Women officials/managers of all race/ethnicity backgrounds make less than their male counterparts, with the exception of Black women, whose annual wages are similar to those of Black men.
Professionals
Asian men hold 37 percent of professional positions, followed by White men (27%) and Asian women (17%). White women represent 10 percent of professionals, Hispanic men represent three percent, and men and women of other sex and race/ethnicity groups hold less than two percent of professional jobs. The average annual pay for Silicon Valley technology sector professionals is $172,851. Despite being second to Asian men in terms of representation, White men still maintain the highest annual pay ($187,057). Asian men’s annual pay is two percent lower than that of White men at $183,678, Hispanic men’s pay is 16 percent lower than White men’s at $156,746, and Black men fall 27 percent below White men in terms of pay (Figure 7-1). Among women, Asian women’s wages lag 17 percent below White men’s wages at $155,806, and White women lag 19 percent below White men. The wages of Black women, Hispanic women, and women of other race groups’ wages fall more than 30 percent below those of White men (Figure 7-2).
Technicians
Similar to professionals, Asian men hold 31 percent of technician positions, White men hold 28 percent, and Asian women hold 14 percent. Hispanic men represent about 11 percent of technicians; White women about 6 percent; and Hispanic women, Black men, and men of other race groups hold roughly 3–4 percent of technician jobs. Black women and women of other race groups are just one percent of technicians. The average wage of Silicon Valley technology sector technicians is $75,299. White men out-earn Asian men by seven percent, with annual wages of $82,924. The wages of all other groups also fall further below those of White men, with gaps ranging from 10–12 percent for Hispanic men, Black men, and men of other race groups (Figure 7-1) to gaps of 20–30 percent for White women, Hispanic women, Black women, and women of other race groups
(Figure 7-2). Again, pay gaps relative to White men are considerably larger for women technicians of every race/ethnicity group compared with men of the same race/ethnicity group.
Targeted Analysis: Profiling Four Establishments
Having identified aggregate pay disparities for sex and race/ethnicity groups relative to White men in the Silicon Valley technology sector, the next step was to focus on four targeted establishments. The objective of this exercise was to simulate the type of analysis EEOC investigators might initially conduct using Component 2 data when employees bring complaints of pay discrimination.
Selecting Four Target Establishments
In selecting potential target establishments for mock charge analysis, the Silicon Valley sample was first restricted to establishments with 250–350 employees to avoid the problems of undercoverage (see Chapter 4), lack of variation in pay bands (see Table 7-1), and small SRO cell sizes present in small establishments. Establishments larger than 350 employees were avoided, as data quality/error assessments in Chapter 5 show large establishments may only appear large due to inconsistent/implausible data. Of the 946 establishments contained in the Silicon Valley technology sector sample, 60 establishments were identified that met these size criteria.
Among these 60 potential targets, NAICS codes and the distribution of employees across the four job categories of interest were examined. Eleven possible target establishments were identified from a variety of four-digit NAICS codes and with enough employees in each occupation to enable comparisons. For these 11, data on the number of pay bands per occupation and the number of sex and race/ethnicity categories per occupation were then examined. Professionals showed the most diversity in pay, with a mean of 9.1 pay bands, while executives showed the least, with a mean of 2.9 pay bands. Officials/managers and technicians both averaged roughly six pay bands. In terms of sex and race/ethnicity group representation, professionals were again the most diverse, with a mean of 8.9 sex and race/ethnicity groups represented in that occupation, followed by officials/managers (7.5) and technicians (6.0), while executives were the least diverse, averaging only 3.9 sex and race/ethnicity groups.
Finally, from the short list of 11 establishments, four target establishments were selected that showed variation in pay and sex and race/ethnicity diversity by occupation. For the four target establishments, raw gaps in annual pay were calculated for each sex and race/ethnicity group
in the executive, official/manager, professional, and technician occupations, relative to White men.
This selection process purposely identified establishments that were sufficiently large and diverse to enable calculation of within-job-category sex and race/ethnicity pay gaps. Of course, when EEOC receives a charge, there is no guarantee that the establishment named in the charge will (1) be represented in Component 2 data (see coverage issues in Chapters 4 and 5); and/or (2) show sufficient within-job-category variation in pay, sex, and race/ethnicity representation to calculate raw pay gaps.
It is thus crucial to emphasize that the mock analysis demonstrated here is a best-case scenario in terms of data coverage, within-job pay-band differentiation, and within-job sex and race/ethnicity representation. For charge investigations, EEOC will only be able to conduct such analyses for establishments that have two or more pay bands per occupation of interest and sufficient sex and race/ethnicity within-job diversity to compare the wages of target sex, race/ethnicity group(s) to similarly situated others. If individual-level pay data become available, there will be a greater capacity to examine pay disparities that occur within a single pay band (Recommendation 3-7). If data on education and length of employment become available, there will be a greater capacity to determine whether people are in the wrong job category (Recommendation 3-11). Of course, some types of disparities may only be detected after EEOC receives complaints and performs more intensive investigations. These data are meant to be an initial tool for identifying situations requiring further research, but EEOC as part of its normal enforcement processes would collect more detailed data from those establishments.
Examining Pay Gaps at Targeted Establishments
Turning to the four targeted establishments, the last four columns of Table 7-4 present annual pay gaps for each sex and race/ethnicity group relative to White men, for SRO cells with sufficient data. Cells with a double dash (– –) indicate that either there were no employees in the SRO cell or there were fewer than three employees, and data were suppressed due to disclosure concerns. For Establishment 2, there were sufficient data to calculate an executive a pay gap for White women relative to White men (+2.4%); however, there were fewer than three Asian women, and thus a pay gap is not presented for Asian women relative to White men. There were no Black women or Hispanic women in executive positions in Establishment 2; thus, no gaps are shown for these groups. Thus, even with deliberate selection of target establishments, the calculation of within-job pay gaps for many sex and race/ethnicity groups due to small cell sizes is unadvised. This was especially the case for the executive category, which
showed less pay differentiation and sex and race/ethnicity diversity than the other job categories. Indeed, aside from White women in Establishment 2, the only other executive pay gap shown is for Asian men in Establishment 4 (–2.51). Calculating pay gaps for sex and race/ethnicity groups in the other three job categories was easier due to larger SRO cell sizes and their dispersion across more pay bands.
To prepare this report for the public, the panel was required to suppress data for small cells to avoid disclosure of analyzed establishments. For investigative purposes, EEOC can access these cells, although the use of inferential statistics for the size of pay gaps will be limited by sample size.4
Among officials and managers, Table 7-4 shows pay gaps for White women relative to White men in Establishment 1 (–16.9%) and Establishment 2 (–2.6%); pay gaps for Asian men relative to White men in Establishments 1, 3, and 4; and pay gaps for Asian women relative to White men across all four establishments. How might these data inform charge processing? If EEOC were to receive a charge of sex discrimination in pay from a White woman manager in Establishment 1, for example, and subsequently calculated the difference in pay between White women managers and White men managers, investigators could observe the –16.9 percent pay gap, decide that additional scrutiny is necessary, and place high investigative priority on the charge. Alternatively, if EEOC were to receive a similar charge from a White woman manager in Establishment 2 and observed the much smaller –2.6 percent pay gap relative to White men, staff could place lower priority on this case or require more information to be convinced that the pay gap is meaningful.
As “professional” is the largest and most sex and race/ethnicity diverse occupation in the Silicon Valley technology sector sample, it is not surprising that calculating sex and race/ethnicity pay gaps across the four target establishments is most feasible for professionals. If EEOC received a charge from a Black male professional in Establishment 1 alleging race/ethnicity discrimination in pay, EEOC analysts could calculate the –51.3 percent pay gap for Black men professionals compared to White men professionals and decide to pursue further, directing staff and resources toward investigation. However, a similar charge from an Asian male professional in Establishment 3 may not yield such priority attention, given that the pay gap of –4.7 percent is considerably smaller.
Examining within-job pay gaps at targeted establishments may also
___________________
4 Of course, inferential statistics assume random sampling from a population. Thus, EEOC could reasonably calculate pay gaps for smaller cell sizes. In this case, threats to inference would be about precision in the measurement of occupation and the width of pay bands rather than sample size.
TABLE 7-4 Comparisons of Pay Gaps Across Selected Establishments, by Race/Ethnicity, Sex, and Occupation: Silicon Valley Technology Sector, 2018a
| Mean Pay Gap ($)b | Percent Pay Gapb | Establishment | ||||
|---|---|---|---|---|---|---|
| 1 | 2 | 3 | 4 | |||
| Executives | –4,389 | –1.6 | – – | 1.1 | –1.8 | –0.9 |
| White Men (reference) | 0 | 0.0 | – – | 0.0 | 0.0 | 0.0 |
| White Women | –10,777 | –3.9 | – – | 2.4 | 0.0 | – – |
| Black/African American Men | –2,889 | –1.0 | – – | – – | – – | – – |
| Black/African American Women | –33,365 | –12.1 | – – | – – | – – | – – |
| Hispanic Men | –8,345 | –3.0 | – – | – – | – – | – – |
| Hispanic Women | –12,481 | –4.5 | – – | – – | – – | – – |
| Asian Men | –4,476 | –1.6 | – – | – – | 0.0 | –2.5 |
| Asian Women | –17,440 | –6.3 | – – | – – | 0.0 | – – |
| All Other Races Men | –12,013 | –4.4 | – – | – – | – – | – – |
| All Other Races Women | –25,929 | –9.4 | – – | – – | – – | – – |
| Managers | –13,613 | –5.7 | –5.9 | –5.8 | –0.9 | –4.5 |
| White Men (reference) | 0 | 0.0 | 0.0 | 0.0 | 0.0 | 0.0 |
| White Women | –14,708 | –6.1 | –16.9 | –2.6 | – – | – – |
| Black/African American Men | –37,584 | –15.7 | – – | – – | – – | – – |
| Black/African American Women | –36,566 | –15.3 | – – | – – | – – | – – |
| Hispanic Men | –29,784 | –12.4 | – – | – – | – – | – – |
| Hispanic Women | –46,106 | –19.3 | – – | – – | – – | – – |
| Asian Men | –19,060 | –8.0 | –3.3 | – – | 5.1 | 5.4 |
| Asian Women | –21,052 | –8.8 | –16.8 | –37.6 | 11.5 | –24.2 |
| All Other Races Men | –27,054 | –11.3 | – – | – – | – – | – – |
| All Other Races Women | –43,269 | –18.1 | – – | – – | – – | – – |
| Professionals | –14,205 | –7.6 | –10.0 | 8.4 | –8.1 | –19.5 |
| White Men (reference) | 0 | 0.0 | 0.0 | 0.0 | 0.0 | 0.0 |
| White Women | –35,596 | –19.0 | –19.6 | 21.0 | –18.8 | –31.3 |
| Black/African American Men | –50,660 | –27.1 | –51.3 | – – | – – | – – |
| Mean Pay Gap ($)b | Percent Pay Gapb | Establishment | ||||
|---|---|---|---|---|---|---|
| 1 | 2 | 3 | 4 | |||
| Black/African American Women | –66,247 | –35.4 | – – | – – | – – | – – |
| Hispanic Men | –30,311 | –16.2 | 4.6 | – – | –27.8 | – – |
| Hispanic Women | –57,337 | –30.7 | – – | – – | – – | –52.3 |
| Asian Men | –3,379 | –1.8 | –8.8 | 9.4 | –4.7 | –21.6 |
| Asian Women | –31,250 | –16.7 | –21.7 | 17.8 | –18.8 | –35.2 |
| All Other Races Men | –36,162 | –19.3 | – – | – – | – – | – – |
| All Other Races Women | –62,934 | –33.6 | – – | – – | – – | – – |
| Technicians | –7,625 | –9.2 | –7.1 | 9.1 | –27.9 | –25.6 |
| White Men (reference) | 0 | 0.0 | – – | 0.0 | 0.0 | 0.0 |
| White Women | –17,494 | –21.1 | – – | –5.2 | – – | – – |
| Black/African American Men | –9,294 | –11.2 | – – | – – | 9.6 | – – |
| Black/African American Women | –24,229 | –29.2 | – – | – – | – – | – – |
| Hispanic Men | –8,853 | –10.7 | – – | – – | – – | –22.2 |
| Hispanic Women | –23,885 | –28.8 | – – | 5.6 | –7.7 | – – |
| Asian Men | –5,873 | –7.1 | –2.8 | – – | –33.9 | –29.1 |
| Asian Women | –15,015 | –18.1 | –27.1 | 19.6 | –52.4 | –24.5 |
| All Other Races Men | –9,528 | –11.5 | – – | – – | – – | – – |
| All Other Races Women | –21,772 | –26.3 | – – | – – | – – | – – |
SOURCE: Panel generated from Component 2 employer, establishment, and employee files for 2018, “green flags” only.
NOTE: Excludes data based on all rules in Appendix 6-1. Data limited to Silicon Valley in the NAICS codes specified in Appendix 7-1. (– –) Data suppressed due to no observations in the SRO cell or fewer than three observations.
a Percentage difference within each column relative to White men at top of column.
provide EEOC analysts with information on how widespread disparities might be. For example, an Asian woman technician in Establishment 4 brings a charge of sex and race/ethnicity discrimination in pay. The data show that Asian women technicians make –24.5 percent less than White men technicians. Given the magnitude of this gap, EEOC analysts might look to the pay of Asian women relative to White men in other job categories of Establishment 4. Indeed, in Establishment 4, White men also out-earn Asian women professionals (–35.2%) and Asian women officials/managers (–24.2%); and there are no Asian women executives. Investigating race/ethnicity differences further, data show that Asian men’s wages lag considerably behind White men’s wages among executives (–2.5%), professionals (–21.6%), and technicians (–29.1%) but not managers (5.4%). Based on this pay gap snapshot of Establishment 4, EEOC analysts could decide to direct resources to further investigate the possibility of systemic pay bias against Asian women and men, soliciting individual-level pay records to assess whether these raw pay gaps can be explained by differences in work hours or human-capital characteristics.
The raw pay gap analysis shown in Table 7-4 focuses on within-job pay differences at focal establishments. However, if discriminatory processes are involved in assigning specific sex and race/ethnicity groups to specific job categories, with different pay, then EEOC analysts may also want to examine between-job segregation using composition data (i.e., present in both Component 1 and 2 data) and between-job differences in pay (i.e., unique to Component 2 data) together. Such analyses would be relevant for charges involving allegations of bias in job assignment and pay, in which women or race/ethnicity minority workers may be assigned to job categories with lower pay.
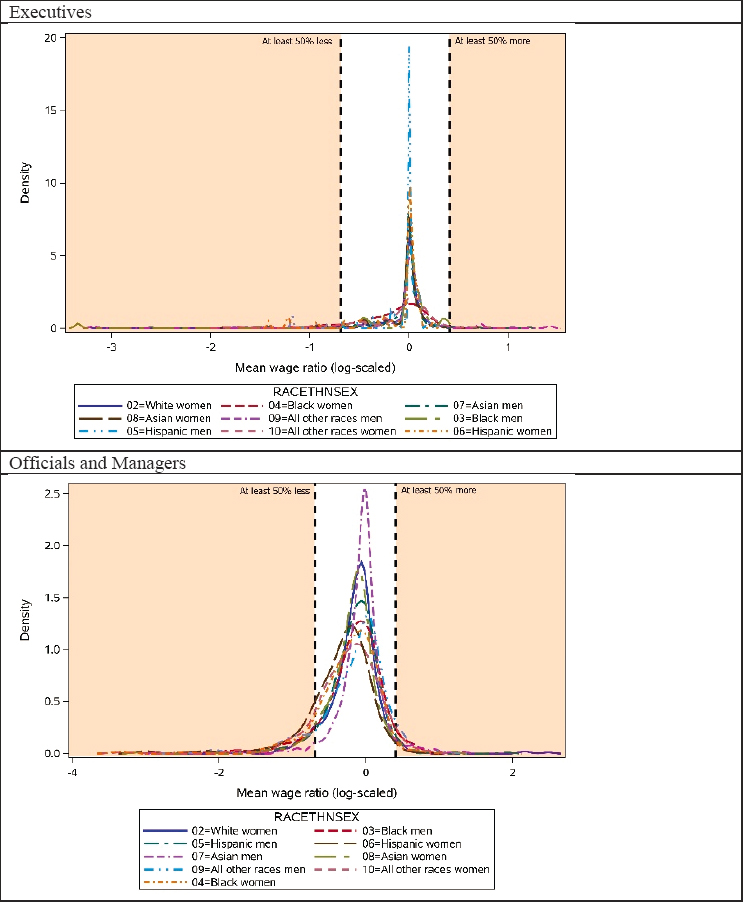
Wage Distributions and Outlier Analysis
To explore the extent to which there are outlier establishments that depart substantially from peer establishments, density plots of sex and race/ethnicity groups’ pay relative to White men were examined. The objective of this exercise was to illustrate how Component 2 data visualizations might enhance EEOC’s systemic enforcement efforts. Figure 7-3 provides density plots of the ratio of each sex and race/ethnicity group’s annual pay compared to that of White men for each of the four target occupations in the Silicon Valley technology sector. The distributions shown are log-scaled to facilitate presentation and minimize skew. Values of zero indicate equal annual pay between White men and the sex and race/ethnicity group, values of greater than zero indicate pay greater than that of White men for the target sex and race/ethnicity group, and values of less than zero indicate pay less than that of White men for the sex and race/ethnicity group. Shaded
SOURCE: Panel generated from Component 2 employer, establishment, and employee files for 2018.
NOTE: Excludes data based on all rules in Appendix 6-1. Data limited to Silicon Valley in the NAICS codes specified in Appendix 7-1. The statistics shown are the natural log of the ratio of a group’s pay compared to that of White males. A value of zero represents equal pay.
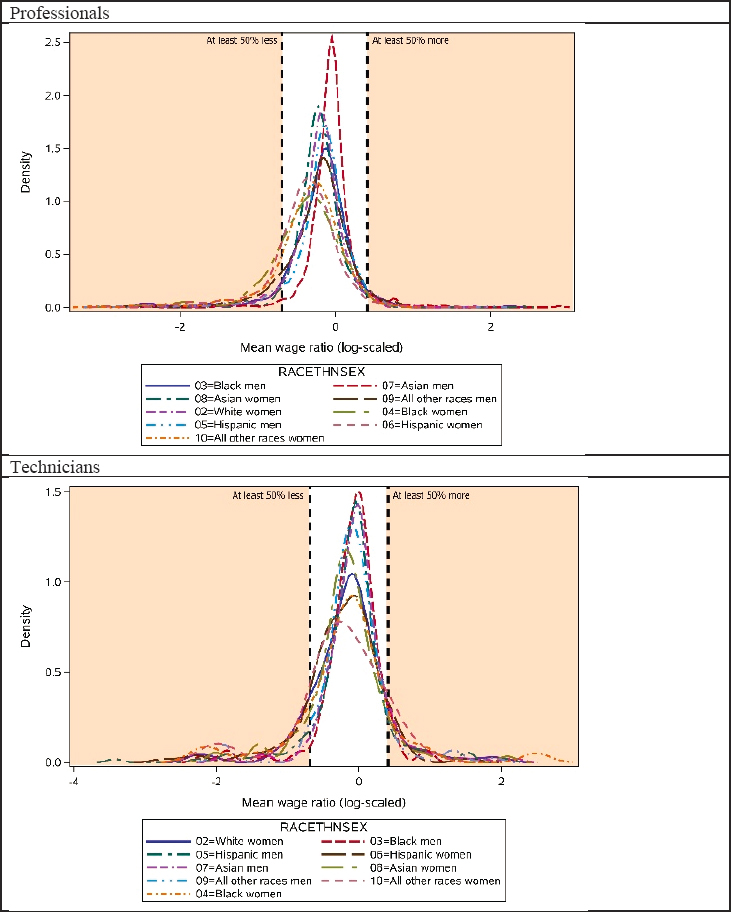
areas to the left and right of the vertical lines demarcate density regions for which each sex and race/ethnicity group makes at least 50 percent less than White men (shaded area to left of vertical line) and at least 50 percent more than White men (shaded area to the right of vertical line), respectively.
Examining density plots is useful for visualizing differences in pay by occupation or sex and race/ethnicity, as well as for identifying high pay-disparity contexts in specific local labor markets for purposes of systemic enforcement. At first glance, analysts might note the relative shape of the curves across the four job categories. For instance, data are concentrated around zero for the executive category, suggesting smaller pay differences between White men and other sex and race/ethnicity groups. In contrast, density curves for technicians show greater dispersion, suggesting more differentiation in wages for sex and race/ethnicity groups relative to White men. As suggested above, the relatively smaller disparities for executives are likely due to measurement issues, including limited pay-band differentiation among executives, the top-coding of the highest pay band, and less heterogeneity in jobs, compared with the other job categories. The plots highlight this lack of dispersion among executives relative to the other job categories.
Analysts might also examine density plots to identify sex and race/ethnicity groups that experience the largest differences in wages in a specific occupation, industry, or local labor market. For example, among professionals in the Silicon Valley technology sector, the curve for Black women is centered to the left of zero, with a substantially larger portion of the tail falling in the 50 percent or less region, as compared to data for other sex and race/ethnicity groups of professionals. This might flag technology professionals as a high pay-disparity context for Black women, and might draw regulatory attention to those establishments in which Black women are making more than 50 percent less than similarly skilled White men. Of course, 50 percent is a somewhat arbitrary large cutoff and EEOC needs to consider how large a pay gap to use for identifying outlier establishments.
Relatedly, such visualizations could be used to direct analysts to specific establishments in which pay disparities are exceptionally large. Outlier establishments or those that fall in the far-left tail of the distributions could be identified as high-disparity establishments and assessed further for potential systemic discrimination and/or commissioner charges. This does not suggest that simply falling in the left tail of the distribution warrants investigation, but the data could provide one way to explore local labor markets and direct systemic enforcement efforts toward high-disparity contexts. Analysts could then marshal additional data from establishments to adjust the raw pay disparities with individual-level information.
Comparison of Target Establishment Pay Gaps to Local Labor-Market Averages
Targeted establishments’ pay differentials can also be interpreted in comparison to local labor-market/industry peers. Any disparity in pay between similarly situated workers based on sex, race, color, national origin, or religion is prohibited under Title VII of the Civil Rights Act of 1964 and The Equal Pay Act of 1963. Yet without information on human capital, it is impossible to know whether raw pay gaps are due to legitimate differences in hours worked, tenure, experience, education, or other factors; or due to pay bias. In the absence of individual-level data, comparisons to peer establishments may give analysts an initial indicator of how a targeted establishment’s pay practices deviate from local labor-market/industry averages and the potential for bias. For instance, if White women professionals, on average, tend to work fewer hours than White men professionals, then a gap unadjusted for hours worked would show up throughout the industry. Yet, if a targeted establishment’s pay gap by sex for White women professionals relative to White men exceeds the local labor-market average, this might suggest that the establishment’s gap is due to more than just differences in hours worked and could invite further scrutiny on the part of regulators.
Table 7-4 enables such comparisons between the four hypothetically targeted establishments and Silicon Valley technology sector labor-market averages. The first two columns of Table 7-4 provide mean pay gaps, expressed in dollars and percentages, for each sex and race/ethnicity group relative to White men for the Silicon Valley technology sector sample, taken from the baseline gaps in Table 7-3. Simple comparisons can be made between the relative magnitude of gaps for sex and race/ethnicity groups in the four targeted establishments and the baseline gaps for each group in the local labor market.
Returning to the example of White women professionals, Establishment 1 shows a –19.6 percent pay gap for White women professionals relative to White men professionals, while the local labor-market average gap by sex for White professionals is –19.0 percent. A t-test (not shown in tables) shows that the mean annual wage of White women professionals is not significantly different from White women professionals at local labor-market peers. Of course, the lack of significant differences would not itself indicate that Establishment 1 is free of pay bias, but that there may be larger industry-wide factors at play (e.g., differences in hours worked, full-time versus part-time status, job assignment) driving the pay gap for White women professionals at both Establishment 1 and in the local labor market. However, for Hispanic women professionals in Establishment 4, the pay gap of –52.3 percent relative to White men is substantially larger than the corresponding local labor-market average pay gap of –30.7 percent. A comparison of
means shows that Hispanic women professionals’ mean wages at Establishment 4 is significantly different from the local labor-market mean (p < .05). This might suggest to analysts that pay differentials for Hispanic women professionals at Establishment 4 are exceptional and not due to industry-wide patterns of Hispanic women’s work hours or job duties.
Again, small SROP cells make this exercise difficult for many sex and race/ethnicity pay-gap comparisons. However, analysts could aggregate across sex and race/ethnicity groups to calculate establishment-level pay gaps and facilitate meaningful comparisons with local labor-market baselines. For instance, complaints from managers of sex discrimination in pay might lead analysts to calculate occupation-specific gaps for women of all race/ethnicity groups relative to men of all race/ethnicity groups. Or a claim of ethnicity discrimination from a male Hispanic technician may lead analysts to calculate ethnicity pay gaps for all Hispanic technicians, regardless of sex, relative to White technicians, or even for all technicians of color relative to White technicians. In these ways, regulatory agencies can collapse across sex and race/ethnicity categories according to the bases and issues named in charges.
Importantly, if EEOC is examining an individual claim of pay disparity, tests of statistical significance would be less appropriate than simple comparisons of the magnitude of disparities relative to average wages for the target occupation in that establishment. The question whether an individual has been treated improperly takes precedence over general patterns of pay disparity, though the presence of such patterns would also be informative.
DISCUSSION
Implications for Suitability of Component 2 Data for Intended Enforcement Uses
As presented here for the Silicon Valley technology sector and four target establishments, Component 2 pay data can be used to calculate average annual wages and pay gaps between sex and race/ethnicity groups by occupation at the local labor-market and establishment levels. However, such gap analyses are only possible if data coverage, quality, and sample/cell size criteria are met. Based on the analysis presented, this section summarizes suitable enforcement uses of Component 2 data given the current data-collection instrument and data quality/coverage/size standards, unsuitable enforcement uses, and enforcement uses that could be realized if the current instrument were improved and/or redesigned.
Suitable Uses of Current Component 2 Data
Charge investigations:
during charge investigations, Component 2 data could be suitable for calculating raw sex and race/ethnicity pay gaps by occupation for establishments that are charged. Pay-gap comparisons should be guided by the bases (sex, race, color, national origin) and job/employment issues named in the charge(s), and theses bases will typically require more detailed data than will be available through the Component 2 data. Component 2 data are also suitable for establishing local labor-market/industry average pay gaps and making comparisons between targeted establishments and local averages using tests of significance. However, these pay-gap analyses and comparisons are only possible if the targeted establishment is contained in Component 2 data, shows consistent data, and contains plausible responses (see Chapters 4 and 5). Moreover, there must be sufficient within-job-category differentiation in pay (i.e., at least two pay bands per SRO cell) and sufficient representation of sex and race/ethnicity groups (i.e., at least two groups). If these data coverage/quality/size criteria are met, analyses of targeted establishments’ pay gaps could serve as a first step in charge investigations, help assign investigative priority to charges, and/or inform requests for additional data, such as requests for individual-level information on pay, hours worked, tenure, and other human-capital variables to calculate adjusted gaps.
If exact pay data are available from an establishment that generates a pay-discrimination charge, it is also possible to use Component 2 data to make comparisons to peer establishments in the same industry and locality. Such comparisons will be less statistically uncertain than comparisons relying on Component 2 data, for both the focal establishment and comparison statistics.
Focus systemic discrimination investigations:
Component 2 data could be suitable for calculating raw local labor-market and/or industry-wide pay gaps by sex, race/ethnicity, and for identifying outlier establishments. Such analyses could be used to flag high pay-disparity contexts to inform national or regional enforcement plans and/or to identify outlier establishments (i.e., those that show exceptionally large raw gaps) for further consideration. Again, analysts must be attuned to data coverage and quality issues, as some labor markets may not be well covered in Component 2 data. For the Silicon Valley technology sector, 21 percent (264/1,210) of establishments were filtered out due to data quality issues. Other industries, especially those populated by smaller establishments, will lose more data due to quality issues. Excessive filtering will compromise assessments of industry/labor-market gaps and data utility for systemic enforcement. Many
of these quality issues can be remedied in future data collections, enhancing the utility of future data collections for enforcement activity.
Employer self-assessment:
Component 2 data could be suitable for employer self-assessment of raw pay gaps but not for finer-grained pay-equity or job-segregation analyses. Establishment profiles, such as those presented in Table 7-4, could be utilized by employers to identify SRO cells with large raw pay gaps for further assessment. Analysts could then consult individual-level human resource information systems data on hours/weeks worked, tenure, education, job duties, and other factors that affect pay, to adjust raw gaps identified by Component 2 data profiles.
Unsuitable Uses for Current Component 2 Data
Hourly wages:
given the aggregated format for collecting hours worked in the current Component 2 data, the panel uncovered issues when converting annual pay to hourly wage rates, as well as reporting errors associated with the collection of hours-worked data. When there are multiple workers in the same SROP cell, it is challenging to accurately apportion the number of hours worked among workers. The straightforward strategy of assuming equal hours worked for employees in the same SROP cell results in implausible hourly wage values for some SRO groups. Extensive cleaning of existing data and automated checks on future data collections may eliminate some implausible values. However, the panel suggests caution when converting annual pay to hourly wage rates. The use of current Component 2 data for enforcement purposes, as outlined above, would be better served to focus on annual wage estimates rather than hourly wage rates, unless analysts undertake careful cleaning of the hours-worked data before use. Further statistical analyses of the error structure of hours-worked data are also called for. The panel notes that critical information on hours worked is lost when examining raw annual pay gaps without adjusting for hours worked. Regression-based adjustment of annual pay gaps might also be explored in the future.
Pay bands and pay differentiation:
lack of variation in pay (i.e., overly wide pay bands) compromises the enforcement utility of Component 2 data, especially with respect to calculating pay gaps at targeted establishments. This problem is more acute for small establishments and for job categories that lack differentiation in pay (i.e., the highest- and lowest-paying job categories). In the Silicon Valley technology sector context, lack of pay differentiation was most problematic for computing pay gaps for executives.
However, in other industries, such as retail, the issue will impact low-wage job categories, such as service workers. Component 2 data are thus not suitable for calculating pay gaps, for enforcement or for employer self-assessment purposes, at targeted establishments in which sex and race/ethnicity groups in the same occupation are concentrated in a single pay band.
Sex and race/ethnicity representation:
the lack of representation of specific sex, race, and ethnicity groups, especially when examining sex and race/ethnicity intersectionally, impacts the utility of Component 2 data for enforcement purposes. In job categories with low sex and race/ethnicity diversity, such as executives in the Silicon Valley technology sector, it is impossible to calculate pay gaps for targeted establishments due to few or no workers in specific SRO cells. This reflects underlying issues of representativeness, segregation, and promotion opportunities for historically disadvantaged groups, and itself may be the focus of charges involving bias in hiring, promotion, or job assignment. However, the implication for the utility of Component 2 data for enforcement is that, for a substantial share of charges, calculating sex and/or race/ethnicity pay gaps and making peer comparisons will be impossible due to few or no workers in relevant SRO cells. This problem will be especially pronounced for charges filed against small establishments, against establishments in (race/ethnicity) homogenous labor markets, for charges involving high-level jobs, and/or intersectional charges (i.e., race/ethnicity and sex). In short, Component 2 data are not suitable for calculating pay gaps, for enforcement purposes or for self-assessment purposes, at targeted establishments in which there is little or no sex and race/ethnicity diversity within jobs. Comparisons of individual-level pay with aggregate pay gaps at the establishment level are still possible but cannot be contextualized relative to sex, race/ethnicity, and occupation peers when few or no peers exist.
Potential Uses if Data Design/Collection/Access Were Improved
Pay-data improvements:
the enforcement utility of Component 2 data is limited by the current use of overly wide pay bands and the subsequent lack of variation in pay for some job categories in some establishments. As detailed in Chapter 3, an alternative way to collect pay information is to collect individual-level wage data. For enforcement purposes, individual-level wage data would capture a much broader range of wages for each occupation and would provide more accurate measures of pay gaps. Analysis and enforcement of pay gaps, especially in the highest- and lowest-paying jobs, would be substantially improved.
Hours-worked data improvements:
the panel determined that the hours-worked data collected as part of the current Component 2 instrument generated implausible values when converting annual pay to hourly wage rates in the mock enforcement exercise. As hours worked is a crucial factor in determining wages, accurate collection of hours-worked data is critical. In the panel’s judgment, to improve the enforcement utility of current Component 2 data, protocols associated with initial data-collection efforts should be used to scrutinize hours-worked data submitted by establishments of interest to immediately query firms as to their accuracy, and to carefully clean submitted data for implausible values. To improve the enforcement utility of hours-worked data in future data collections, EEOC could collect hours and weeks worked during the snapshot period for Fair Labor Standards Act non-exempt and exempt workers separately—by collecting information on weekly or annual hours worked for non-exempt workers and on part-time/full-time status and weeks worked for exempt workers (see Chapter 3). This would permit calculation of more accurate pay gaps and would enhance enforcement utility.
SUMMARY
In this chapter, the utility of Component 2 data, as collected, was evaluated for use in EEOC enforcement processes. A mock analysis of a specific labor market, the Silicon Valley technology sector, and four hypothetically targeted establishments was conducted. Using Component 2 annual pay data, average pay gaps between specific sex and race/ethnicity groups relative to White men in four job categories were calculated for the entire Silicon Valley technology sector labor market and for the four targeted establishments. At the local labor-market level, all sex and race/ethnicity groups earned less than White men in the same occupation and women in each race/ethnicity group earned less than their race/ethnicity male peers. Pay gaps were then profiled at the four targeted establishments and t-tests were used to compare pay gaps at targeted establishments to corresponding local labor-market averages.
Though this mock analysis proved feasible and informative for the Silicon Valley technology sector labor market and the four establishments profiled, small SROP cell sizes posed challenges for calculating pay gaps at targeted establishments. Moreover, lack of variation in pay bands and lack of sex and race/ethnicity diversity (especially for executives) made estimating within-job pay gaps at targeted establishments difficult.
CONCLUSIONS
Conclusions based on the findings of this chapter are presented below.
CONCLUSION 7-1: After cleaning, 2017–2018 Component 2 data could be used, with limitations, as an initial step to prioritize investigations and the allocation of resources: (1) to calculate raw annual pay gaps for establishments under investigation by individual charges; (2) to make comparisons between investigated establishments and peer establishments in the same industry and metropolitan area, county, and/or core-based statistical area; and (3) for systemic investigations.
CONCLUSION 7-2: The 2017–2018 Component 2 data have limited utility in analyzing pay differences within establishments that lack variation in employee characteristics of pay, sex, race/ethnicity, and occupation.
CONCLUSION 7-3: Without extensive cleaning, 2017–2018 Component 2 hours-worked data are unsuitable for calculating hourly wages.
CONCLUSION 7-4: The 2017–2018 Component 2 data are unsuitable for direct determinations of bias or reasonable cause for enforcement purposes.
CHAPTER APPENDIXES
APPENDIX 7-1
NAICS Codes Used for Selecting High Tech Sample
| 4-Digit Code | Industry Label |
|---|---|
| 3254 | Pharmaceutical and Medicine Manufacturing |
| 3333 | Commercial and Service Industry Machinery Manufacturing |
| 3341 | Computer and Peripheral Equipment Manufacturing |
| 3342 | Audio and Video Equipment Manufacturing |
| 3344 | Semiconductor and Other Electronic Component Manufacturing |
| 3345 | Navigational, Measuring, Electrometrical, and Control Instruments Manufacturing |
| 3346 | Manufacturing and Reproducing Magnetic and Optical Media |
| 3364 | Aerospace Product and Parts Manufacturing |
| 3391 | Medical Equipment and Supplies Manufacturing |
| 5112 | Software Publishers |
| 5179 | Other Telecommunications |
| 5191 | Other Information Services |
| 5413 | Architectural, Engineering, and Related Services |
| 5415 | Computer Systems Design and Related Services |
| 5417 | Scientific Research and Development Services |
| 5419 | Other Professional, Scientific, and Technical Services |
APPENDIX 7-2
Zip Codes and Cities Included to Focus on Silicon Valley
| 94002 (Belmont) | 95032 (Los Gatos) | 94404 (San Mateo, Foster City) |
|---|---|---|
| 94005 (Brisbane) | 95033 (Los Gatos) | 94536 (Fremont) |
| 94010 (Burlingame, Hillsborough) | 95035 (Milpitas) | 94538 (Fremont) |
| 94014 (Daly City, Colma) | 95050 (Santa Clara) | 94539 (Fremont) |
| 94015 (Daly City) | 95051 (Santa Clara) | 94541 (Hayward) |
| 94018 (El Granada) | 95054 (Santa Clara) | 94542 (Hayward) |
| 94019 (Half Moon Bay) | 95070 (Saratoga) | 94544 (Hayward) |
| 94020 (La Honda) | 95110 (San Jose) | 95119 (San Jose) |
| 94022 (Los Altos, Los Altos Hills) | 95111 (San Jose) | 95120 (San Jose) |
| 94024 (Los Altos, Los Altos Hills) | 95112 (San Jose) | 95121 (San Jose) |
| 94025 (Menlo Park) | 95113 (San Jose) | 95122 (San Jose) |
| 94027 (Atherton, Menlo Park) | 95116 (San Jose) | 95123 (San Jose) |
| 94028 (Menlo Park, Portola Valley) | 95117 (San Jose) | 95124 (San Jose) |
| 94030 (Millbrae) | 95118 (San Jose) | 95125 (San Jose) |
| 94037 (Montara) | 94065 (Redwood Shores) | 95126 (San Jose) |
| 94040 (Mountain View) | 94066 (San Bruno) | 95127 (San Jose) |
| 94041 (Mountain View) | 94070 (San Carlos) | 95128 (San Jose) |
| 94043 (Mountain View) | 94080 (South San Francisco) | 95129 (San Jose) |
| 94044 (Pacifica) | 94085 (Sunnyvale) | 95130 (San Jose) |
| 94061 (Redwood City, Woodside) | 94086 (Sunnyvale) | 95131 (San Jose) |
| 94062 (Redwood City, Woodside) | 94087 (Sunnyvale) | 95132 (San Jose) |
| 94063 (Redwood City) | 94089 (Sunnyvale) | 95133 (San Jose) |
| 94545 (Hayward) | 94301 (Palo Alto) | 95134 (San Jose) |
| 94555 (Fremont) | 94303 (Palo Alto, East Palo Alto) | 95135 (San Jose) |
| 94560 (Newark) | 94304 (Palo Alto) | 95136 (San Jose) |
| 94587 (Union City) | 94305 (Palo Alto) | 95138 (San Jose) |
| 95002 (Alviso, San Jose) | 94306 (Palo Alto) | 95139 (San Jose) |
| 95008 (Campbell) | 94401 (San Mateo) | 95140 (San Jose) |
| 95014 (Cupertino, Monte Vista) | 94402 (San Mateo) | 95148 (San Jose) |
| 95030 (Los Gatos, Monte Sereno) | 94403 (San Mateo) |
SOURCE: https://silicon-valley-homes.com/idx/listings/zip-codes/
| Establishment or employee characteristics | Original sample (n = 1,210) |
Analysis sample (n = 946) |
|---|---|---|
| Mean number of employees | 275.19 | 314.16 |
| Mean number of pay bands | 7.63 | 8.08 |
| Percent distributions | ||
| Sex | ||
| Male | 70.47 | 70.51 |
| Female | 29.53 | 29.49 |
| Race/ethnicity | ||
| Asian | 50.90 | 50.40 |
| Black/African American | 2.03 | 2.01 |
| Hispanic | 4.98 | 4.99 |
| White | 39.57 | 40.05 |
|
American Indian/Alaska Native, Native Hawaiian or Other Pacific Islander, and Two or More Races |
2.52 | 2.54 |
| Job categories | ||
| Executive | 3.48 | 3.30 |
| First/midlevel | 22.21 | 22.02 |
| Professionals | 69.80 | 70.61 |
| Technicians | 4.52 | 4.07 |
| Federal contractor | ||
| Yes | 85.72 | 86.45 |
| No | 14.28 | 13.55 |
| Submission status | ||
| Single establishment | 7.24 | 5.02 |
| Consolidated report | 92.76 | 94.98 |
| Mode of administration | ||
| Web | 19.77 | 17.31 |
| Upload | 80.23 | 82.69 |
| Industry | ||
| Manufacturing | 39.06 | 38.74 |
| Information | 30.64 | 31.36 |
| Professional, Scientific, and Technical Services | 30.29 | 29.90 |
SOURCE: Panel generated table from EEO-1 Component 2 data, 2018.
NOTE: Analysis sample excludes data based on all rules in Appendix 6-1. Data limited to Silicon Valley in the NAICS codes specified in Appendix 7-1.


