
6
Data Infrastructure for Studying Mobility
As discussed by other speakers in the workshop, data are critical to studying mobility, and emerging sources of data can be leveraged to improve understanding. In this session, speakers discussed the use of administrative data and non-traditional data, as well as best practices for data governance.
ADMINISTRATIVE DATA
There is a long history of studying mobility in the United States, said Katie Genadek (U.S. Census Bureau). She shared a series of articles from over the years that looked at mobility, including a 1962 paper that exam-
ined the proportion of men whose occupation was in the same occupation group as their fathers1 and a 1974 paper on patterns of intergenerational mobility of females through marriage.2 Mobility research, she said, is often driven in part by the availability of data. For example, occupational change has been used as a metric for mobility in part because historical data on occupation is widely available. Social and occupational mobility surveys (such as the General Social Survey) are a major source of data in this area, said Genadek, although they have limitations, including expense, small sample size, and limited geographic coverage. Administrative data, on the other hand, is already obtained, has wide geographic coverage, and may include relationship information. Genadek offered three examples of recent work relying on administrative data to study social mobility.3
The real opportunity, however, is in linking administrative data to survey data. Combining these two sources of data, said Genadek, adds demographic characteristics, socioeconomic variables, and detailed family information to administrative data, as well as additional outcomes of occupation, educational attainment, and housing. Genadek identified four recent examples of research that links administrative data with survey data.4 Commonly used sources of administrative data include Social Security Administration records and tax records; commonly used sources of survey data include the Census, the American Community Survey, the Current Population Survey, and the Survey of Income and Program Participation.
Administrative records have both benefits and drawbacks, said Genadek. They generally have good coverage of the population, although it is more difficult to link individuals who are transient or who do not have a social security number. It is easiest to link taxpayers, workers, individuals
___________________
1https://www.census.gov/library/publications/1964/demo/p23-011.html
2 Glenn, N.D., Ross, A.A., and Tully, J.C. 1974. Patterns of intergenerational mobility of females through marriage. American Sociological Review, 39, 683.
3 Chetty, R., Hendren, N., Kline, P., and Saez, E. 2014. Where is the land of opportunity? The geography of intergenerational mobility in the United States. The Quarterly Journal of Economics, 129(4), 1553-1623; Mitnik, P., Bryant, V., Weber, M., and Grusky, D. 2015. New Estimates of Intergenerational Mobility Using Administrative Data. SOI Working Paper, Statistics of Income Division, Internal Revenue Service; Larrimore, J., Mortenson, J., and Splinter, D. 2015. Income and Earnings Mobility in U.S. Tax Data (July 30, 2015). FEDS Working Paper No. 2015-061, http://dx.doi.org/10.17016/FEDS.2015.061
4 Mazumder, B. 2014. Black–White differences in intergenerational economic mobility in the United States. Economic Perspectives, 38(1). Akee, R., Jones, M.R., and Porter, S.R. 2019. Race matters: Income shares, income inequality, and income mobility for All U.S. Races. Demography, 56(3), 999-1021; Song, X., and Coleman, T. 2020. Using Administrative Big Data to Solve Problems in Social Science and Policy Research. University of Pennsylvania Population Center Working Paper (PSC/PARC), 2020-58; Chetty, R., Friedman, J., Hendren, N., and Stepner, M. 2020. The Economic Impacts of COVID-19: Evidence from a New Public Database Built Using Private Sector Data. NBER Working Paper No. 27431. Cambridge, MA: National Bureau of Economic Research.
on Medicare, individuals receiving government assistance, and men who have registered for the draft. Genadek shared a map that shows the percentage of population that can be linked to administrative records (see Figure 6-1); there are obvious gaps and areas where linkages are more difficult. Another challenge is that linkages with administrative data are generally only available for more recent generations; Genadek noted that there are also data before 1940, but there is a significant gap between 1950 and 2000. One solution to this issue is building out the U.S. Census Bureau’s data linkage infrastructure; Genadek said she is currently working on this project. Another new resource is representative survey samples linked to lifetime Social Security Administration data.5 These data have existed for years, but are now available to everyone, she said. Also available are large-scale U.S. Census linkages; Genadek noted that around 72 percent of young people in the 1940 Census can be linked forward to the 2000 Census. What was missing, however, are the data from the years 1950-1990. Capturing these data was challenging, she said, because the names are handwritten, the forms are stored on microfilm reels, and the data are highly restricted. Fortunately, researchers found that names could be efficiently recovered from these records, and they could be captured with sufficiently high quality to be linked into the existing systems. Now, a project is underway to use this approach to scan the microfilm reels with Census records from 1960 to
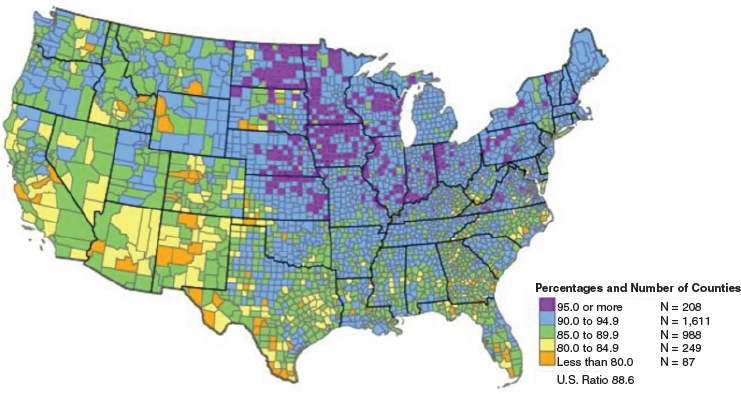
SOURCE: 2010 Census Match Study Report. https://www.census.gov/content/dam/Census/library/publications/2012/dec/2010_cpex_247.pdf
___________________
5 Genadek, K.R., Hoyakem, C., and Pendergast, P.T. 2021. The Summary Earning Record and Detailed Record Extracts. Working Paper Number ADEP-WP-2021-15. https://www.census.gov/library/working-papers/2021/econ/earnings-record-extracts.html
1990, and to link the records to current data. Genadek said that the longitudinal infrastructure available in 2026 should include all linked decennial censuses, as well as surveys and administrative records. All of these data are available through the Federal Statistical Research Data Centers.
NONTRADITIONAL DATA SOURCES
School and Neighborhood Data
At this workshop, speakers have discussed the utility of educational data for examining social mobility, and how neighborhoods have a large impact on social mobility, said Daniel Botting (Impact Tulsa). Impact Tulsa, he said, is an organization committed to improving mobility for all students in the Tulsa region, with a focus on education. The network of public schools and nonprofits, businesses, and community leaders works on the “cradle-to-career” continuum from kindergarten to employment. Part of this work, said Botting, was using information from the Opportunity Atlas to examine the Tulsa community and to communicate with leaders about what is needed. While the Opportunity Atlas was a great starting point, he said, there was a need to better understand how neighborhood factors affect student outcomes in the current moment—not years later. Impact Tulsa created a tool called the Child Equity Index (CEI) in order to understand the social and environmental conditions that contribute to or hinder student opportunity, as well as to be able to identify and address schools and neighborhoods with higher needs. Botting said they wanted to move beyond “simply blaming schools” and move toward investing in community factors that matter.
The CEI uses data on a wide variety of student demographics, Botting explained, paired with neighborhood statistics on factors such as crime, unemployment rates, walkability, access to transit and grocery stores, land use, and life expectancy (see Figure 6-2). All of these data were used to build a model to estimate the impact of these factors on student academic outcomes, such as test scores and attendance. Botting expressed the hope of expanding the model in the future to look at data points such as graduation or college attendance.
When the CEI was created, said Botting, “we found exactly what we thought we would find.” Neighborhoods matter for academic outcomes, and in some cases, neighborhood factors have the same impact as a student being economically disadvantaged (a well-established predictor of academic success). Botting shared a map of Tulsa that shows to what extent neighborhoods have a positive or negative impact on student outcomes (see Figure 6-3).
The neighborhood patterns found by the CEI are quite similar to the patterns found using the Opportunity Atlas. This means, said Botting, that education data paired with neighborhood data are an early indicator of
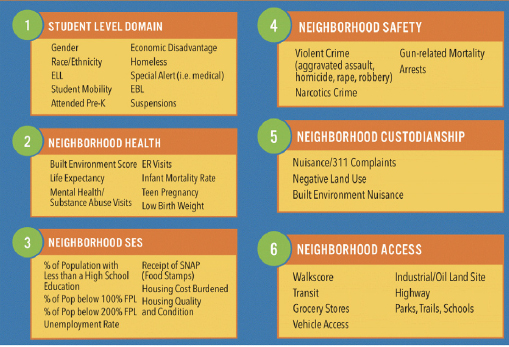
NOTE: ELL = English language learner; EBL = emergent bilingual learner; ER = emergency room; FPL = federal poverty level; SES = socioeconomic status; SNAP = Supplemental Nutrition Assistance Program.
SOURCE: Workshop presentation by Daniel Botting, February 15, 2022.
social mobility. This not only makes the issue of social mobility more accessible to constituents, but it also enables researchers and policy makers to intervene early and to test the impact of these interventions. As anyone who has worked in education or politics knows, said Botting, there is a strong desire to get immediate results and “little patience” for programs that take years to bear fruit. Pairing these data can show the value of community investment in shorter-term educational outcomes and longer-term social

SOURCE: Workshop presentation by Daniel Botting, February 15, 2022.
mobility. In addition, the CEI can be used to inform policy decisions such as the busing of students, school vouchers, and other interventions aimed at changing educational outcomes.
While pairing education and neighborhood data has great potential for research and action, said Botting, there have also been challenges. First, getting the data is difficult. Educational data are held by individual school districts, and many of these do not have the resources, funding, or time to pull the data themselves. Neighborhood-level data come from many different sources and different levels, including counties, cities, police departments, hospitals, and county health systems. Bringing together these multiple data sources was “time-consuming and difficult,” and there is a need to streamline the accessibility and usability of these data. Another challenge is a lack of consistent longitudinal data collection in education. Tests are constantly changing, he said, and the tests cannot always be compared with one another. Furthermore, data may vary across state lines or even district lines, with different categorization of characteristics such as race and ethnicity.
Botting closed by sharing side-by-side maps of historical redlining, the CEI, and the Opportunity Atlas, and noted that the patterns in Tulsa have remained similar for decades. The same neighborhoods are “good” or “bad” in each map, showing both the persistence and the root of the problem. Many of today’s inequalities, said Botting, stem from racist policies and systems of the past. “This doesn’t even begin to capture” the impact of major events such as the Tulsa race massacre, in which a White mob attacked and destroyed Black neighborhoods. Mobility is generational, said Botting, and the use of educational and neighborhood data can help researchers begin to understand and address some of the root causes.
Household Financial Data
The JPMorgan Chase Institute, said Fiona Greig, uses administrative data from the firm’s banking records to try to understand what is happening in the economy and with families. These data are de-identified, and include a variety of information such as balances, credit card activity, mortgages and home equity loans, individual transactions, and demographic characteristics. These data have a number of advantages, said Greig. The large sample sizes can offer insight into distributional, geographic, and other sub-group variation. High frequency longitudinal data are available on a range of outcomes, and the data are adaptable to changing economic and policy environments. Greig walked workshop participants through three examples of ways in which banking data can be used to study social mobility: the evolution of household cash balances during COVID-19, income growth during business cycles, and understanding the sources and consequences of racial wealth gaps.
Evolution of Household Cash Balances During COVID-19
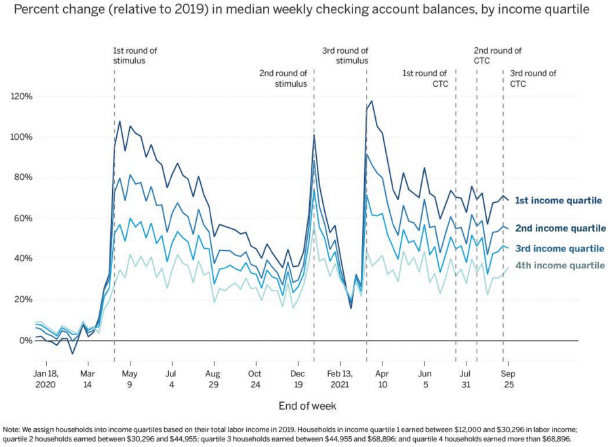
National data show that cash balances and liquid balances have grown during the COVID-19 pandemic, said Greig, but it is less clear from such data how this phenomenon played out for different types of families. The institute, which continually updated and published data to understand how different income groups fared over time, found that federal fiscal supports had a large impact, particularly for low-income families (see Figure 6-4). Median cash balances through September 2021 remained elevated for families, and there were significant jumps at each round of federal help.
Income Growth During Business Cycles
Greig’s second example focused on how macroeconomic environments and policies play into matters of inequality. Comparing the rates at which household incomes grew by income quartile between 2013 and 2021, Greig explained that after the Great Recession, high-income families experienced faster income growth than low-income families, but by the time the pandemic hit, this pattern had reversed (see Figure 6-5). At the same time, however, substantial downward income changes before the pandemic were most common among low-income households. The next step, said Greig, is
SOURCE: Workshop presentation by Fiona Greig, February 15, 2022.
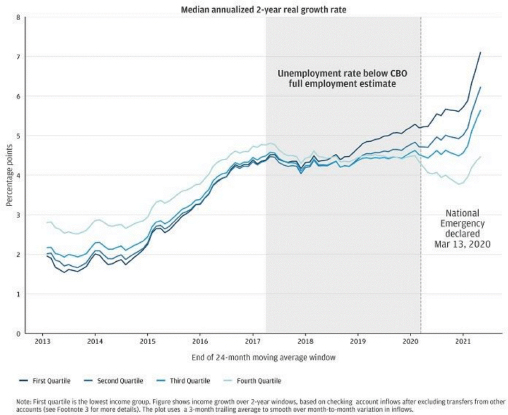
NOTE: CBO = Congressional Budget Office.
SOURCE: Workshop presentation by Fiona Greig, February 15, 2022.
to extend and examine these types of dynamics with other outcomes, such as wealth balances, refinancing, and home purchasing.
Understanding the Sources and Consequences of Racial Wealth Gaps
The share of families who have student loan debt has grown tremendously over the last couple of decades, said Greig. Black families are disproportionately likely to have debt; around 30 percent of Black families hold some sort of educational loan. Compared with White and Hispanic borrowers, Black borrowers are less likely to be making progress on their student loans, with sizable percentages either making no payments or on track to never pay off the loan. By pairing credit bureau data with checking account data, said Greig, it became clear that loan repayment is a “family affair.” Nearly 40 percent of individuals who are making student loan payments are doing so on someone else’s behalf (e.g., spouse, child, parent). Looking at this phenomenon by race, Black and Hispanic individuals were less likely than White individuals to either give or receive help in paying down student debt. This emphasizes the intergenerational nature of debt, said Greig; an individual borrows money for school because their family lacks the ability to pay, and then is also less likely to receive help in repayment.
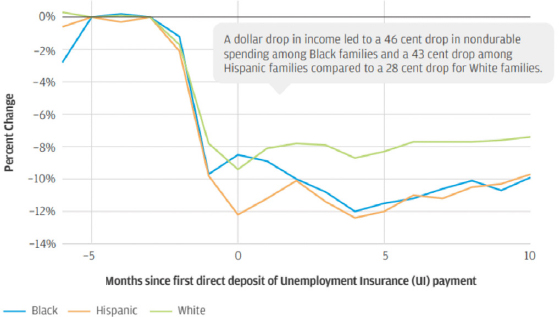
Another racial difference that can be explored with banking data, said Greig, is the impact of job loss on spending. The institute looked at the extent to which families reduced their spending when a family member lost a job involuntarily (pre-pandemic). Overall, there is a significant drop in consumption, she said, but there is a much larger drop among Black and Hispanic families compared with White families (see Figure 6-6). These differences can be explained by racial gaps in liquid and financial assets, which serve as buffers during times of income loss.
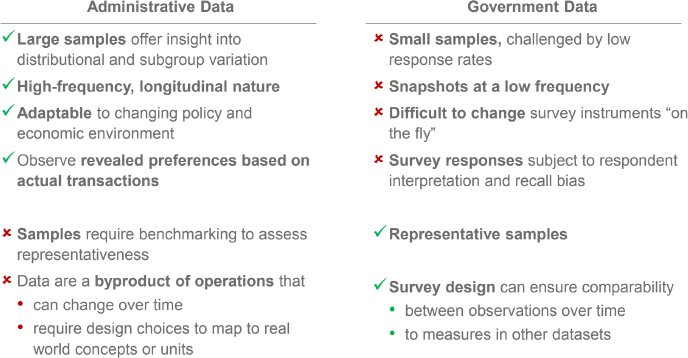
In closing, Greig compared administrative data with government survey data, noting that their comparative advantages and disadvantages underscore their value as a complement to one another (see Figure 6-7). For example, administrative data tend to have large sample sizes, whereas government surveys have small sample sizes. On the other hand, government data tend to have representative samples, whereas administrative data require using benchmarking to assess representativeness.
DATA GOVERNANCE
There are competing goals for the data held by federal statistical agencies, including survey, census, and administrative data, said Katharine Abraham (University of Maryland, College Park). The data need to be made available in order to inform decisions, but there is also a need to protect the privacy of data subjects. The challenge, she emphasized, is to develop models for data infrastructure and data access that best serve both goals. Abraham described two models for data infrastructure. The first is a data warehouse, in which data assembled from different sources are permanently housed in a single
SOURCE: Workshop presentation by Fiona Greig, February 15, 2022.
SOURCE: Workshop presentation by Fiona Greig, February 15, 2022.
location. The second is a data facility, in which core data are permanently housed in a single location and data needed for specific projects are brought in as needed but not permanently retained. In its final report, the Commission on Evidence-Based Policymaking recommended a data facility rather than a data warehouse. While not storing data permanently complicates the ability to replicate and extend prior analyses, Abraham said, there are concerns about the real and perceived privacy risks of the data warehouse model.
There are also different models for data access and dissemination. Federal agencies make data available in a variety of ways, including published tabulations, publicly available microdata files, and confidential microdata files available through the Federal Statistical Research Data Centers and other agencies. Abraham said that she “can’t emphasize enough” how much progress has been made in the past 20-25 years with respect to making data available to researchers while protecting privacy. Statistical agencies are required by law to protect data subjects, and different methods are used to do so. For microdata, methods include coarsening categorical variables, top-coding continuous variables, noise infusion, and data swapping. For tabular releases, approaches include cell suppression, noise infusion, swapping in underlying microdata, and cell value rounding. The exact methods used are not generally made public. Privacy considerations also govern the release of research results generated behind the statistical agency firewall.
There is a growing recognition, Abraham said, that the privacy protection methods applied historically may be inadequate. The typical statistical disclosure methods are not as private as they seem; a determined hacker may
be able to glean confidential information from existing releases. Abraham warned that if there were a breach of promised privacy protections, the surrounding publicity could have “very negative consequences” for the federal statistical system. In order to address these weaknesses, the U.S. Census Bureau has begun to adopt disclosure avoidance methods based on differential privacy. Use of these methods is not yet widespread but Abraham expects that it will grow. An implication of these increased privacy protections, said Abraham, is that there will be decreased access to microdata in the form of public use files.
In order to ensure that researchers retain access to necessary data, there will be a need for a new access and dissemination model. This model, said Abraham, could use a tiered access system in which users work with synthetic data to run their models, and then have the results checked against data behind the firewall to verify whether the results are reasonable. If this initial step is unsuccessful, the researcher could apply for access to the original data behind the firewall. For this model to work, however, there need to be changes such as a more streamlined process for applying for microdata access, expanded access capacity, and improved capacity to evaluate the privacy implications of proposed data releases.
Some initial steps have been taken toward a new model for access and dissemination, said Abraham. The Foundations for Evidence-Based Policymaking Act of 2018 directed the creation of standardized data access procedures, and established an Advisory Committee on Data for Evidence Building; the committee is considering an implementation plan for a National Secure Data Service (i.e., a data facility). Moving forward, said Abraham, difficult questions related to privacy will need to be addressed. The two major issues, in her view, are creating a balance between privacy and access and how the “privacy budget” will be allocated. The differential privacy methods being used by the U.S. Census Bureau give a way to characterize the tradeoff between privacy and access, but the question of the balance is a policy question, not a technical one. Each release of information uses up some of the “privacy budget,” and there need to be conversations about the implications of decisions made, as well as what data are highest priority for release. One way to answer these questions, Abraham suggested, could be to establish a review committee that would guide what projects are undertaken.
Abraham said that as a researcher, she is not “particularly happy” that data may become more difficult to access. In conversations such as this workshop, however, it is important to consider not just what data are available but also the privacy implications of making data available. Abraham said that she is “optimistic” privacy protections can be strengthened while preserving the value of the data, but that it will be a challenge.
DISCUSSION
Following the presentations, C. Matthew Snipp (Stanford University) moderated a discussion with the speakers and workshop participants.
Tension between Access and Confidentiality
Snipp opened by reflecting on the history of social science research within the federal government. Over the past 50 years, there has been a “historic devolution” in the government’s capacity for conducting basic social research, he said. According to Snipp, agencies today barely have the capacity to conduct research or plan operations; for example, the U.S. Census Bureau struggled to conduct tests of new systems that were planned for the 2020 Census. During this period, there has been growing reliance on outside researchers, and initiatives that encourage researchers to access federal data and to share data across agencies. However, at the same time, there have been growing concerns about privacy and confidentiality of federal data, particularly Census data. These concerns have resulted in new policies and practices, such as differential privacy, in order to protect data. Given the tension between confidentiality of the data and the importance of conducting social research, Snipp asked speakers to comment on how they think this tension will be resolved.
Abraham began by recalling a previous U.S. Census Bureau director who believed that the U.S. Census Bureau “didn’t have any business doing basic research;” to the contrary, Abraham said it is critical for agencies that produce data to also conduct research. If there are not people at the agency working with the data, they are not going to fully understand the data they are collecting, she said. Fortunately, there is “significant research” going on at all of the agencies, but the idea that they should not be conducting research persists. Genadek agreed that the U.S. Census Bureau is currently very supportive of both external and internal researchers, and that innovative research tools—such as linked data infrastructure—are being created with the full support of the U.S. Census Bureau and other government agencies.
Regarding the tension between confidentiality and access, Abraham continued, the laws are very strict and the agencies have little wiggle room. Some of the laws may not seem to make sense, but these protections are a policy decision rather than an agency decision. Greig agreed that there is a constant tension between access and privacy, and said that “not a day goes by” that JPMorgan Chase Institute is not asked for access to their data. For example, the institute has discussed the possibility of publishing spending data that could be added into national statistics. While this seems possible, she said, what seems impossible is committing to doing this over time on a continual basis. One challenge is that the aggregation standards applied to data in order
to protect privacy may have to change over time; for example, if there is a big shift in retail activity to specific retailers, the whole series of data needs to be re-aggregated. This creates temporal comparison challenges if the application of the standards results in different levels of aggregation over time.
Agency Cooperation
There is a great deal of valuable data held by the federal government, said Fabian Pfeffer (University of Michigan). For example, the U.S. Census Bureau population data—particularly if linked with other data—have the potential to greatly advance research on mobility and racial inequalities. Pfeffer asked speakers to comment on the potential for cooperation between agencies, and between agencies and outside researchers, given concerns about privacy. Abraham said that new approaches to privacy do have the potential to restrict how and what data get released; for example, estimates might be released with more noise infused, or certain data may not be released at all. The issue of agencies working with one another is very important, she said, and there may be a need to revisit the structure of the federal statistical system. When agencies produce statistics based on surveys designed for that purpose, “it didn’t really matter” that the agencies were separate entities. With the increasing use of administrative data and nontraditional sources of data, however, it has become more important to coordinate and systematize the research efforts of various agencies.
Confidentiality Versus Granularity
Earlier in the workshop, Jennifer Lee (Columbia University) discussed the need for granularity in data in order to capture the heterogeneity in the Asian American population. Such approaches as differential privacy, said Snipp, can “seriously distort” small areas and small populations. Snipp asked Abraham whether there is middle ground between confidentiality and granularity. “I am not sure that there is,” Abraham replied. There is noise in the data already, and differential privacy makes the data noisier, but there may not be a solution because of the legal constraints. Abraham suggested that reconsidering what type of data need to be kept confidential could be a solution, but this is not possible under the current rules.
Potential for Combining Multiple Data Sources
A workshop participant wondered if there was a “parallel universe” in which all of the data from the projects presented in this session could be integrated. “We could evaluate the outcomes in the Tulsa kids using the decennial data, or look at their spending at JPMorgan,” he said, and asked
panelists for their thoughts. Genadek responded that this is a “definite possibility.” The U.S. Census Bureau has a history of bringing in data from researchers, and facilitates the provision of these data to other researchers. However, she said, the proprietary nature of data and the different rules around them make sharing challenging. “It’s a beautiful vision” to see all these data together, but it may not be possible in the near future. Botting replied that Impact Tulsa would love the opportunity to bring in data from other sources to help them get new details and new insight into what is happening in a child’s life. For example, Botting said, the data they use now only classifies a child as “economically disadvantaged” or “not economically disadvantaged.” Being able to see if the household had a bank account with $1 or $10,000 would be extremely useful. Greig said that the JPMorgan Chase Institute is actively exploring the possibility of collaborating with outside data providers, but there are a few challenges and questions that first need to be answered. Specifically, who is responsible for keeping data secure, what are the boundaries on who else can use the data, and what is the purpose of the collaboration? If these challenges can be addressed, said Greig, the opportunity is obvious and the potential for impact is very clear.
Botting shared an example of how Impact Tulsa was able to make a difference during the pandemic. When schools went virtual, many students did not have reliable internet access. Impact Tulsa served as an intermediary to pair data from school districts with data from local internet providers to identify students who needed internet. The schools were then able to reach out and provide them with a hot spot or city-sponsored internet. This is a “bright spot” that shows what can be done with “a lot of work and a lot of commitment.”
How to Improve Local Data
Snipp asked Botting to elaborate on how local data could be improved—specifically, how to ensure more consistency to facilitate longitudinal research. Commitment and investment from the state is critical, responded Botting. If state agencies choose to change the tests used, they could choose to make it possible to compare the tests with each other, but this takes money. Researchers need to make sure that politicians and state educational agencies understand that having longitudinal data is valuable so that they are willing to invest in the tools that make it possible, he concluded.
Most Critical Needs
Snipp asked speakers to briefly identify their top priorities for data or methods that could advance the study of social mobility. Ideas included the following:
- Data that link generations and are paired with identifiers around race and other characteristics. (Greig)
- Data that examine spending patterns and the implications for welfare. (Greig)
- Linked Census data. (Genadek)
- Consistent state-level education data with a streamlined process for gaining access. (Botting)
This page intentionally left blank.


