
7
Seed Suppliers
INTRODUCTION
This chapter reports on findings of the Committee from its survey of firms that supply native seed and native plants (seedlings and vegetative materials). As with the state agency buyer survey, methodology details appear in Chapter 2.
The supplier survey sought to explore supply-side observations from the Committee’s 2020 interim report (see Box 1-2). In particular, the survey explored the research questions that emerge from the interim report’s Observations 3, 5, 6, 7, and 8:
- How do timeframe, quantity, and quality affect the production decisions of native seed suppliers?
- What factors affect buyer costs of production for native seed?
- How and to what degree do communication, market and production risk, and the design of contracts with buyers affect what and how much native seed suppliers elect to produce?
- How adequate are suppliers’ storage facilities for native seed?
- How do the factors above vary by region of the country (West vs. East) and scale of production?
The chapter begins by characterizing the firms that supply native seed by size, region, product mix, and source of seed genetics. It proceeds to examine the buyers and contract arrangements used, as well as how suppliers anticipate likely demand. Given time lags for seed production and the time and cost of producing locally adapted native seed, the chapter examines how suppliers cope with risky production conditions and uncertainty about which native seed species will have markets at the end of the production cycle. The chapter reports supplier responses on the share of year-end unsold native seed inventories and the adequacy of storage facilities to keep seed in good condition. The chapter closes with suppliers’ views on the challenges to expanding the supply of native seeds and native plants.
BUSINESS ACTIVITIES OF FIRMS—PRODUCTS OFFERED
As discussed, the Committee’s goal for the supplier survey was to focus on businesses that sell native seed and/or plants, either exclusively or as part of their broader offerings. At the beginning of the survey, respondents were asked several questions about the seed and plants they sell. Among the firms contacted, 81 percent said that
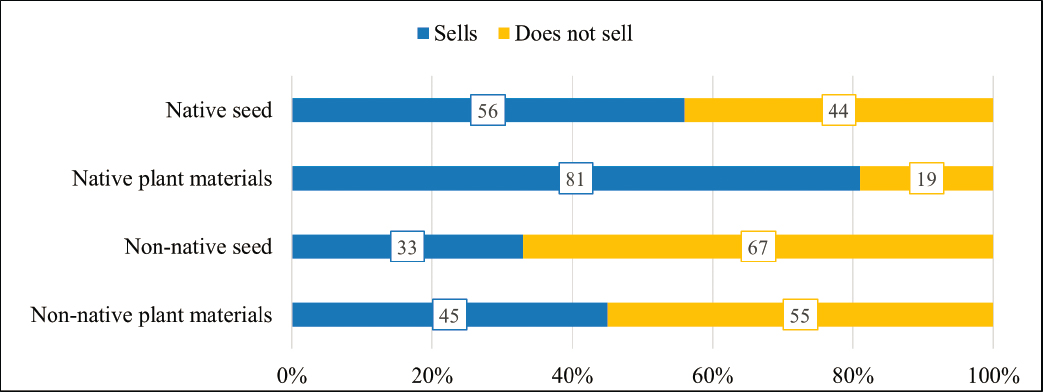
they sell native plants, while 56 percent indicated that they sell native seed, 33 percent sell non-native seed, and 45 percent sell non-native plants (Figure 7-1). Because the intent of the survey was to learn about the experiences of suppliers of native seeds and plants, respondents who said that they do not sell natives of either seed or plants were deemed ineligible and not asked further questions about their business.
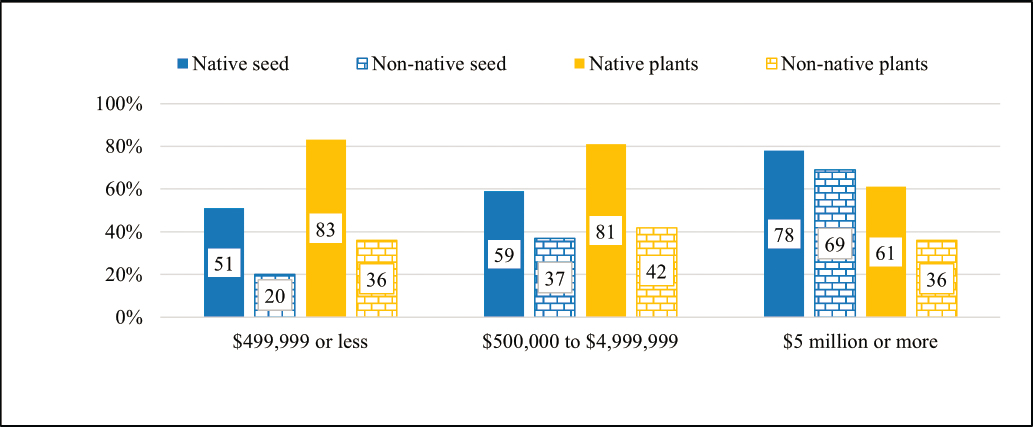
Among the eligible respondents, businesses from the West were more likely than those in the East to sell non-native seed (38% vs. 29%), but for other types of seed or plant material, the answers from East and West suppliers were similar.1 To obtain a sense of the size of the businesses included in the survey, suppliers were asked to provide an estimate (choose from six categories) of their average annual sales and operating revenues during the period 2017–2019. Suppliers with larger sales revenues were more likely to sell seed (native and non-native) than businesses with smaller sales. This may be related to a customer base that includes private landowners that buy native and non-native seed for hay or rangeland. Smaller businesses were more likely to sell native plants than larger businesses (Figure 7-2).
___________________
1 The committee used the same definition of East and West as for the survey of state departments. East includes AL, AR, CT, DE, FL, GA, IA, IL, IN, KS, KY, LA, MA, MD, ME, MI, MN, MO, MS, NC, ND, NE, NH, NJ, NY, OH, OK, PA, RI, SC, SD, TN, TX, VA, VT, WI, WV; West includes AK, AZ, CA, CO, HI, ID, MT, NM, NV, OR, UT, WA, WY.
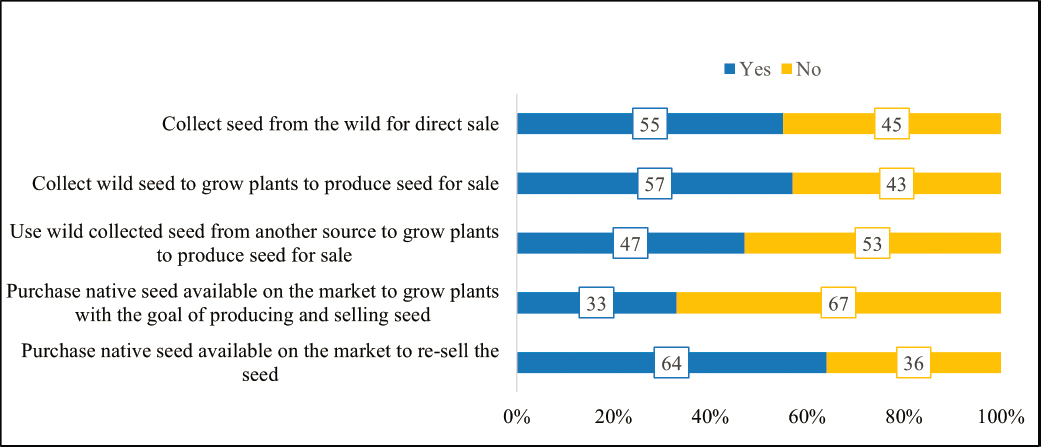
Suppliers who sold native seed were asked questions about where they obtain the seed they sell (Figure 7-3). More than half sell seed they have collected from the wild, and about two-thirds purchase seed on the market to resell directly. This suggests that many suppliers may be seed consolidators, or that buy seed to expand their range of product offerings. Fifty-seven percent will plant seed they wild collected to grow plants to increase seed for sale, and one-third will use seed they purchased on the market for that purpose. A little less than half will do the same with wild-collected seed obtained from another source, such as a collaborating organization.
Suppliers who said they sold native seed were asked whether they sold several different categories of native seed (Figure 7-4). Approximately two out of three (68%) reported selling “Uncertified seed of claimed wild origin” and two out of three (65%) sell “Certified source-identified seed.”
This question was further examined for differences in regions. Around 70 percent of western suppliers and 61 percent of eastern suppliers indicated they sold certified Source-Identified seed. Suppliers from the West were more than twice as likely to sell “Seed types meeting Bureau of Land Management (BLM) requirements” than
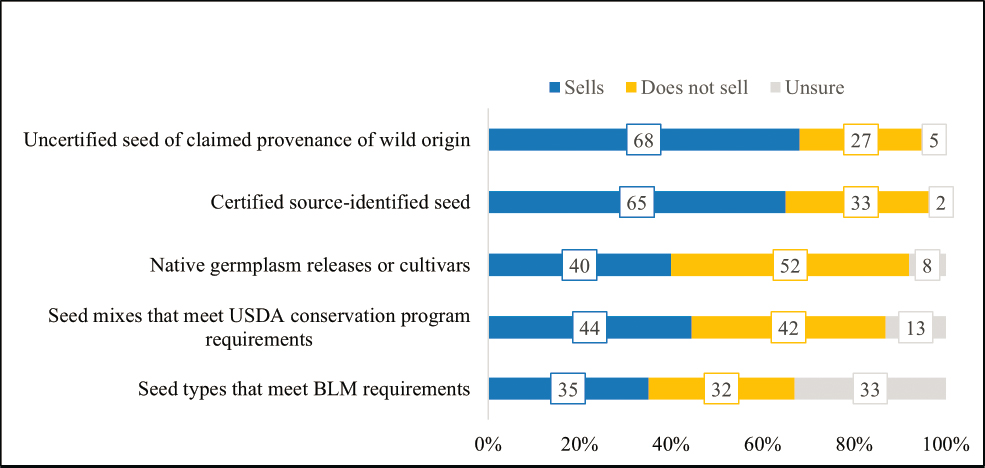
Eastern suppliers (49% vs. 22%). About half (48%) of suppliers from the East and two out of five (40%) of Western suppliers said that they sell “Seed mixes complying with USDA conservation programs.”
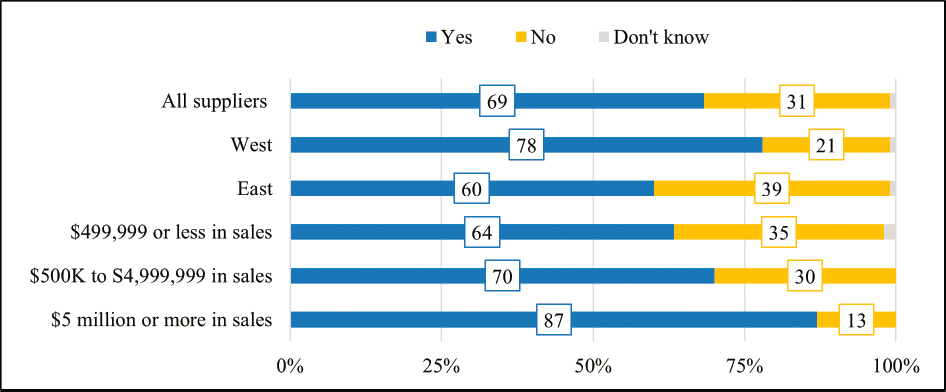
Native plant and seed suppliers were asked if they sold plants or seeds from different locations, to match different geographic conditions or seed zones, as in different ecotypes of the same species. This question was summarized by region and by sales revenue (Figure 7-5). While nearly 70 percent of suppliers overall offered plants or seed of this nature, they were more likely to be offered by suppliers with the largest sales revenue (87%). Western suppliers were more likely than eastern suppliers (78% vs. 60%) to offer plants or seeds matched to different geographies or seeds zones.
Suppliers were asked the percent of their total native seed sales that were represented by native seed of different plant types (grasses, forbs, shrub, trees, or other). Figure 7-6 shows a profile of suppliers and the concentration of product types as a proportion of their total native seed sales, ranging from 0 percent of their total sales to 100 percent of sales on the x-axis. For example, the first set of bars on the left shows that almost 60 percent (58%) of growers reported that seeds of native trees represented 0 percent of total sales. The set of bars on the far right of the graph shows that seeds of native trees make up 100 percent of the total native seed sales of about 8 percent of suppliers.
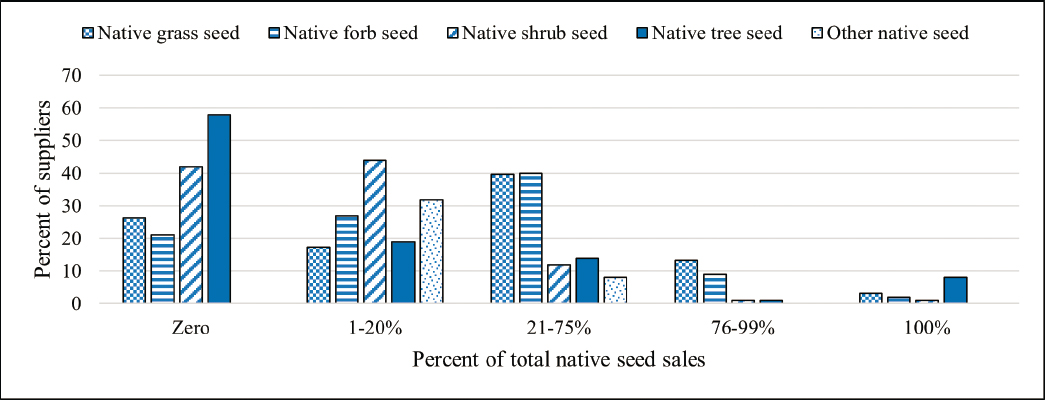

In the middle set of bars, 40 percent of suppliers said that seed of native grasses and forbs made up between 21 and 75 percent of total sales. Much lower proportions of suppliers said seeds of native shrubs, trees, or “other” made up between 21 and 75 percent of total sales. The figure suggests that seeds of native shrubs and native trees represented a smaller proportion of total sales, relative to grasses and forbs, for the majority of suppliers in the survey. The means (M) and medians (Mdn) for the supplier responses to the question about what percentage of their total native seed sales were represented by each category were as follows: native grass seed, M=37, Mdn=30; native forbs seed, M=32, Mdn=25; native shrub seed, M=9, Mdn=2; native tree seed, M=17, Mdn=0; other native seed, M=5, Mdn=0.
Similarly, suppliers of native plants (as opposed to native seed) material were asked the percent of their total native plant sales that were represented by each native plant material of different type (native grasses, forbs, shrubs, trees, or other). Figure 7-7 shows a profile of suppliers and the concentration of product types as a proportion of sales (expressed in groups of increasing proportion).
The bars in the middle of the figure show that about half (49%) of the suppliers indicated that native shrub plant material made up 21 to 75 percent of their total plants sales. Forty-three percent and 35 percent of suppliers, respectively, said that native forbs and native trees made up 21 to 75 percent of their total sales. Forbs appear to be sold as much in plant form as seed, given that 40 percent or more suppliers indicate they make up between 21 and 75 percent as a percent of sales of both seeds and plants. The mean and median for the supplier responses to the question were as follows: native grasses, M=18, Mdn=10; native forbs, M=25, Mdn=20; native shrubs, M=25, Mdn=25; native trees, M=35, Mdn=25; other native plants, M=10, Mdn=1.
Business Activities of Suppliers—Other Services
Suppliers were asked in an open-ended question if they sell services and if so, to specify the services they offer. Thirty-six percent of those that answered the question said they provide services. Seed cleaning and installation (site preparation and planting of seeds and trees) were the two most frequently offered services, each mentioned by approximately one in three of those who said that they offered services in addition to selling seed or plants. Other services mentioned included consulting and design, seed collection, ecological restoration, and contracting growing. A few suppliers said that they offer landscaping and weed management.
Business Activities of Suppliers—Clients
The survey asked suppliers to indicate what relative portion of their annual sales were represented by sales to different buyers. Figure 7-8 shows the importance of private contractors to most suppliers—over 60 percent of suppliers said that private contractors represent a major portion of their sales. Approximately one in four
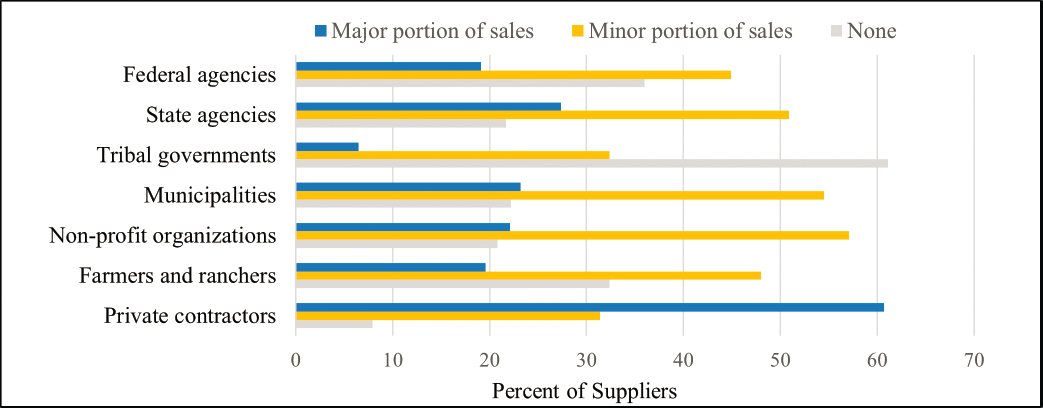
suppliers said that state agencies were a major portion of sales. About the same fraction of suppliers (23% and 22%, respectively) indicated that municipalities and not-for-profit organizations were a major portion of sales. About 19 percent of suppliers said that farmers and ranchers and federal agencies represented a major portion of sales, and even fewer (7%) said that tribal governments were a major portion of sales. As states, municipalities, tribes, and the federal government often contract out seeding work, the importance of contractors in sales may obscure the true “buyers” of seed for seeding projects.
Business Activities of Suppliers—Communications
Suppliers were asked about possible methods for communicating with potential buyers about what their business offers (Figure 7-9). The great majority of suppliers indicated that a company website (85%) and/or word of
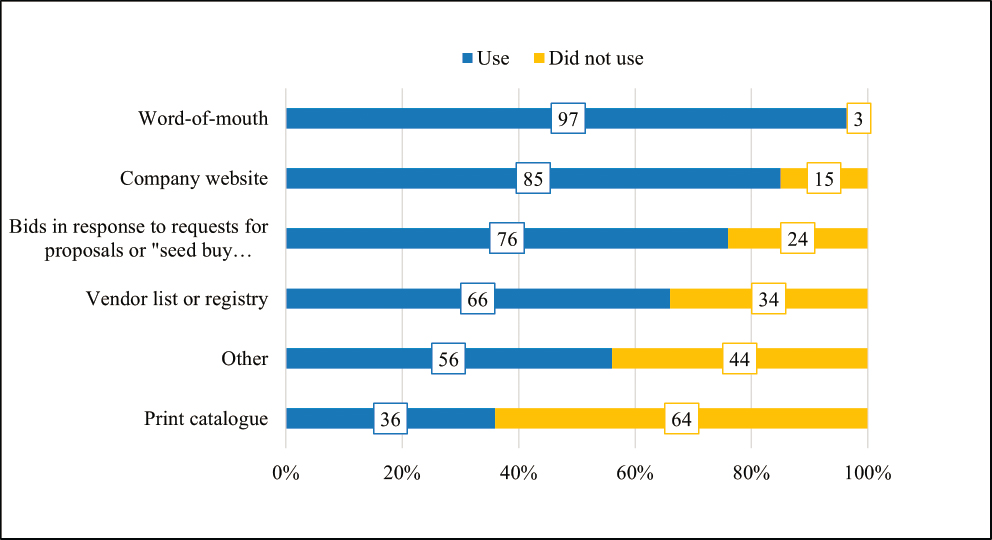
mouth (97%) were used. Three out of four suppliers communicate through their bids to Requests for Proposals and two out of four mentioned vendor registries.
When asked to specify what “other” methods suppliers use to communicate with potential buyers, social media was the most frequent method mentioned, along with emails and newsletters. Some suppliers also mentioned trade shows, seed associations, and native seed groups. A few said that their long history in the business and long-standing customers serve as a means of communication with potential buyers.
Business Activities—Contracting Arrangements
The survey asked suppliers whether they used certain types of contracting arrangements:
- “Bids on consolidated seed buys,” which are responses to public procurement requests made by government agencies;
- “Spot market sales of available seed or plants,” which are exchanges between buyers and sellers that do not specify any conditions of sale or production;
- “Marketing contracts,” which specify the type, price, quantity, and delivery date of seed or plants and guarantee a purchaser for that seed or plants; and guarantee a purchaser for that seed or plant materials; and
- “Production contracts” which share some production costs and/or production risks by providing flexibility in the quantity delivered and/or delivery date.
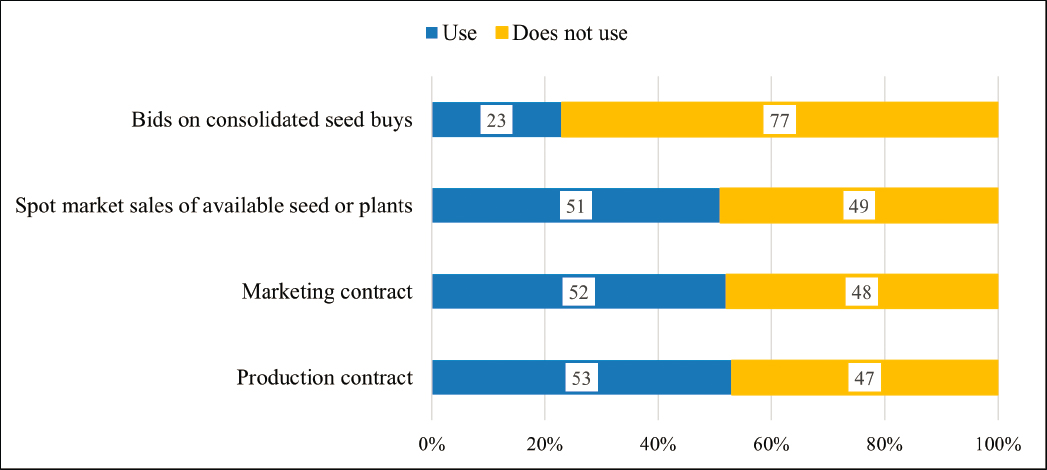
Figure 7-10a shows that about 23% of all suppliers bid on consolidated seed buys. Each of the other three types of contracting arrangements are used by about half of all suppliers. Thus, slightly less than half as many suppliers bid on consolidated seed buys than use any of the other contracting arrangements. BLM operates the consolidated seed buys to obtain seeds largely to address post-wildfire needs in the West.
Approximately half of the suppliers who provided an answer to the questions about contracting arrangements said that they use more than one type. Utilizing multiple contracting types may reflect differences in buyer and/or supplier preferences. It may also reflect differences in suppliers’ revenues and regional markets.
The analyses were also examined by location of the supplier in the United States. Figure7-10b shows that about one in four (24%) suppliers in the West and one in five (21%) suppliers in the East indicated that they bid on consolidated seed buys, which is surprising because the BLM consolidated seed buys typically seek species and ecotypes for use in the West. Suppliers in the West were more likely to use marketing and production contracts
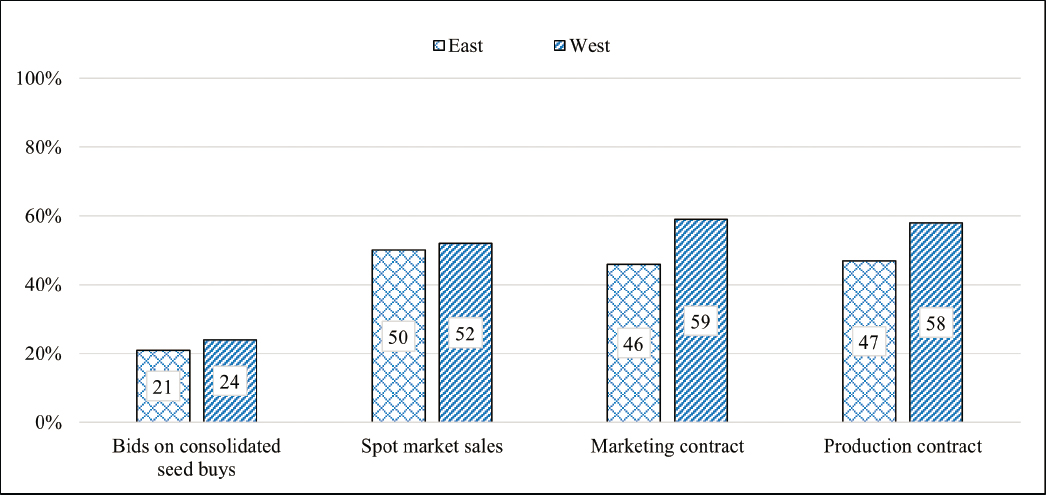
than suppliers in the East. Suppliers in the West appeared slightly less likely to sell via spot market sales than to sell using marketing and production contracts. In contrast, suppliers in the East appeared slightly more likely to sell via spot markets than to sell using marketing and production contracts.
The analyses were next summarized by categories of sales revenue. Figure 7-10c shows that a higher percent (57%) of firms in the category of highest annual sales revenue ($5 million or more) bid on consolidated seed buys versus suppliers with mid-size or smaller revenues (26% and 13%), respectively. The same is true for spot
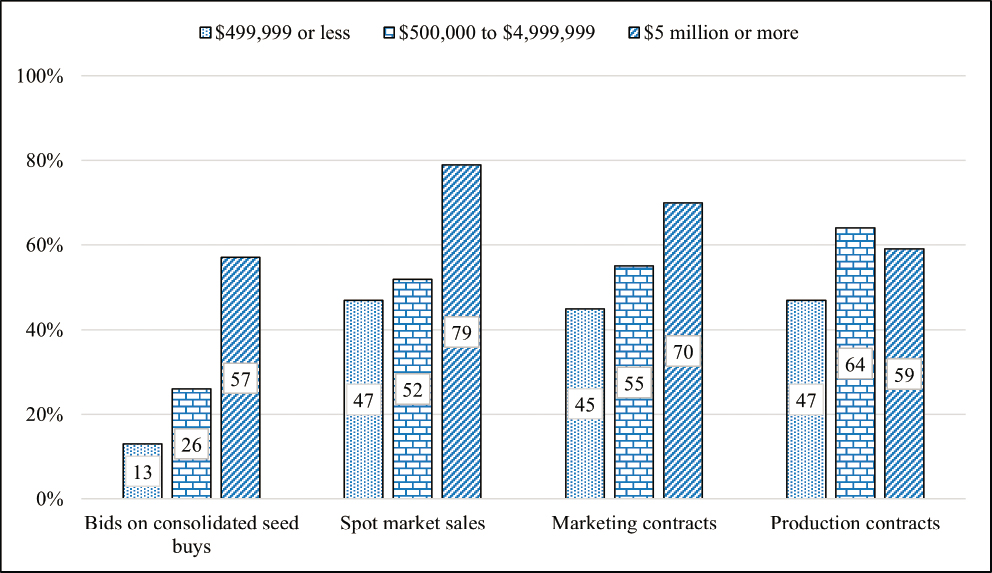
market sales and marketing contracts: a higher percentage of firms in the highest annual sales revenue category use these arrangements as compared to the other sales categories: (79% for the $5 million or more vs. 52% and 47% for the next two lower categories, respectively) and marketing contracts (70% for the $5 million or more vs. 55% [mid] and 45% [small]). A larger percentage of suppliers in the category of middle-sized sales revenue ($500,000 to $4,999,999) said that they use production contracts (64%) than those in the largest sales category (59%) or smallest sales category (47%) sales. Thus, it appears that suppliers with middle-sized sales revenues were more likely to engage in risk-sharing contracting arrangements than large or small suppliers were. In general, the largest respondents are more likely to utilize multiple contracting arrangements. Twenty-eight percent of large suppliers used all four, while only 14 percent of mid-size firms and 8 percent of small firms did.
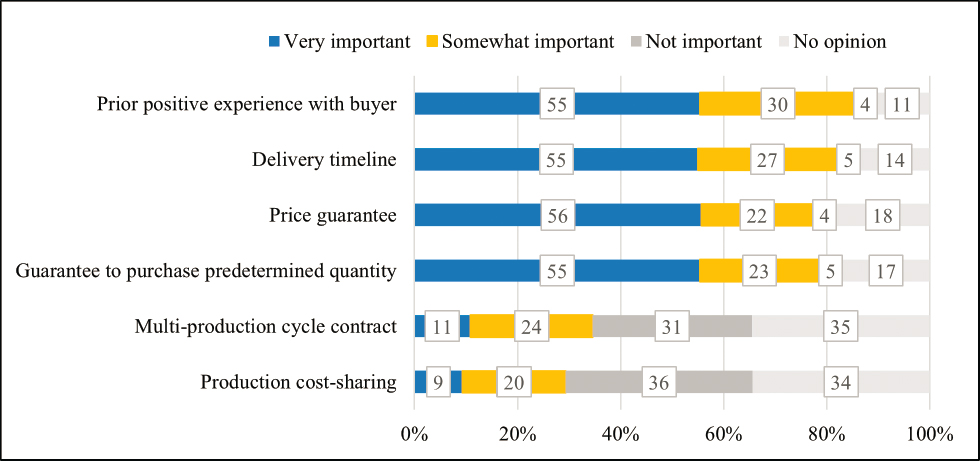
The survey asked suppliers how important different contract characteristics are to them (Figure7-11a). A prior positive experience with a buyer and delivery timeline were both identified as “important” or “somewhat important” to over 80 percent of suppliers. A price guarantee and the guaranteed purchase of a predetermined quantity of seeds or plant material were similarly important. In contrast, a much smaller proportion of suppliers (35% and 29%, respectively) found that multi-production-cycle contracts or production cost-sharing was important or somewhat important. Guaranteeing a sufficiently high price can substitute for sharing the expected production cost. However, a higher price may not necessarily substitute for sharing production risk, which depends on the relative magnitude of price compared to production cost and also the supplier’s attitude toward risk. Due to the substitutability across price guarantee, purchase quantity guarantee, and production cost-sharing that are characteristics of marketing and/or production contracts, a substantial majority of respondents deemed market factors a significant consideration.
Responses to this question were also disaggregated by the location and sales revenue categories of the supplier. Suppliers from the East and West were generally similar in their views on the importance of these characteristics. A slightly higher proportion of western suppliers (83%) than eastern growers (76%) indicated that a purchase guarantee for a predetermined quantity was important or somewhat important. As shown in Figure 7-11b, for most contract characteristics, suppliers in the highest sales category were most likely to state that the characteristic was important or somewhat important. However, approximately three out of four or more respondents in all sales revenue categories said that price guarantee, purchase guaranteed for predetermined quantity, delivery timeline, and prior positive expertise with the buyer were somewhat or very important characteristics.
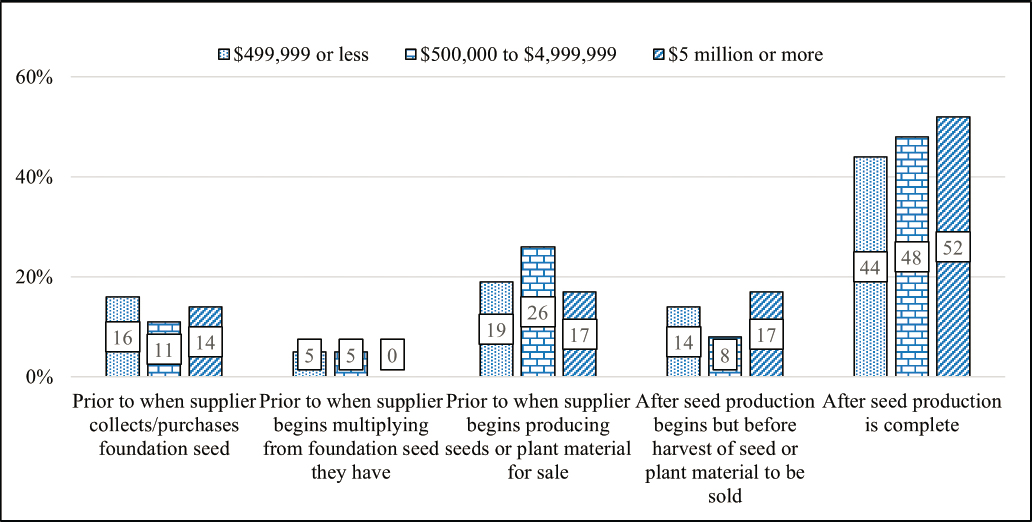
When suppliers were asked about the timing of signing a contract relative to when they would start to produce native seeds or plant material for sale, about half (47%) of all suppliers indicated they normally sign a contract after seed production is complete. This suggests they have seed stored and ready for testing and delivery.
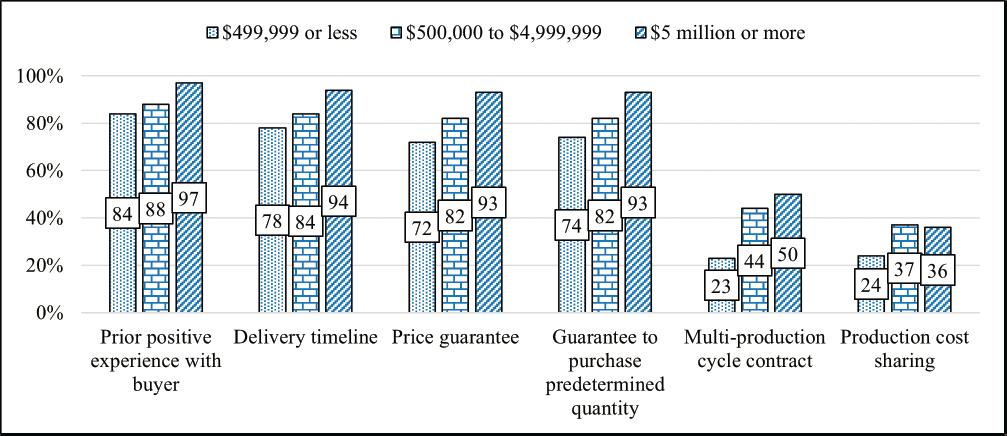
Figure 7-12 shows some nuances for groups of suppliers for the three categories of overall sales, and this might further vary by plant species. The first two sets of bars in Figure 7-12 should be interpreted with caution, as suppliers were asked about “foundation seed” as a proxy for any seed used as starting material for production; however, the term has specific meaning with respect to seed certification.
Business Activities of Suppliers—Anticipating Demand
Suppliers were asked about the role different types of information play in how they anticipate future demand for native seed or plants in order to plan ahead. Figure 7-13 shows that “past purchases or requests from buyers” plays a major (56%) or moderate (28%) role for nearly all suppliers. More than half said that “demand for urban
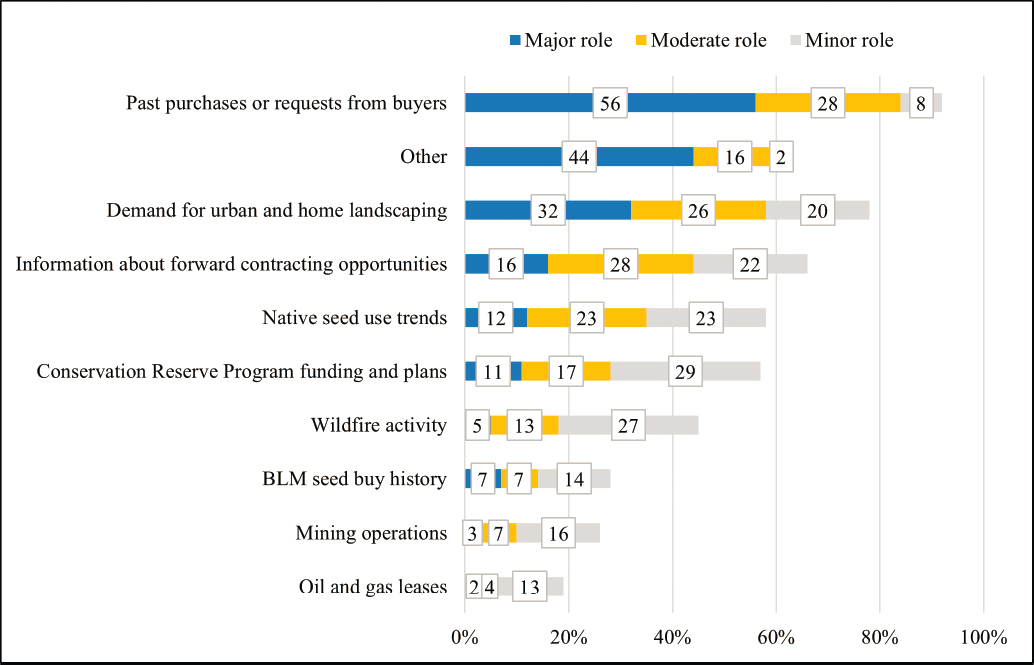
and home landscaping” plays a major (32%) or moderate (26%) role. The broad range of responses in the “Other” category reflected suppliers’ interest in monitoring developments and opportunities related to native seed and plants both locally and nationally. Notably, the Conservation Reserve Program administered by the US Department of Agriculture (USDA) plays major and moderate roles for a larger share of suppliers in our survey than either wildfire activity or Bureau of Land Management (BLM) seed buy history.
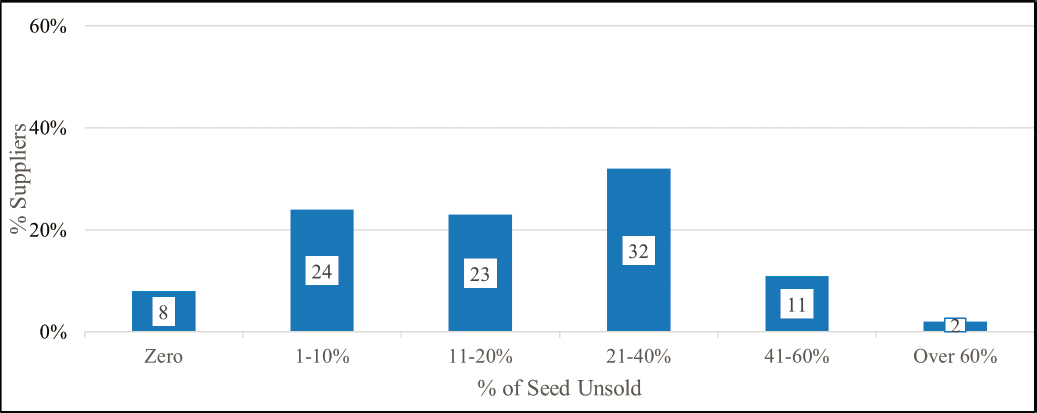
Not being able to accurately anticipate demand can result in unsold seed, and suppliers were asked to provide an estimate of approximately what percentage of their inventory of native seed and plants was left unsold at the end of the marketing year during 2017–2019. Seventy-seven percent of the responding suppliers said that the percentage of native seed and plants left unsold was about what they anticipated. About 10 percent indicated that there was more left than anticipated, and 13 percent indicated that it was less than they had anticipated. Figure 7-14 shows the approximate percentage of inventory unsold at the end of the marketing year.
Interestingly, pairing these responses with buyers’ responses about the availability and price of desired native seed and plants suggests that suppliers are able to market seed by anticipating buyers’ willingness to substitute. Moreover, demand for seed that is an acceptable second choice for many buyers may be more predictable than demand for more specialized seed, which is more limited and potentially more variable. Of the respondents who replied that less than or about what they anticipated was left unsold, 44 percent considered insufficient demand a major or moderate challenge and 74 percent deemed unpredictable demand a major or moderate challenge. Another potential reason that the great majority of suppliers were on target at selling inventory may be that most have adequate storage (see below) and planned for inventory carryover.
Responses were examined by the three categories of overall sales. Among middle-sized suppliers ($500,000 to $4,999,999 in sales) 18 percent indicated that there was less left unsold than they anticipated, compared to 10 percent among small-size suppliers and 14 percent among large suppliers. It is not immediately clear why middle-size suppliers had less unsold than they anticipated. This could be related to the markets served and business models of middle-sized companies.
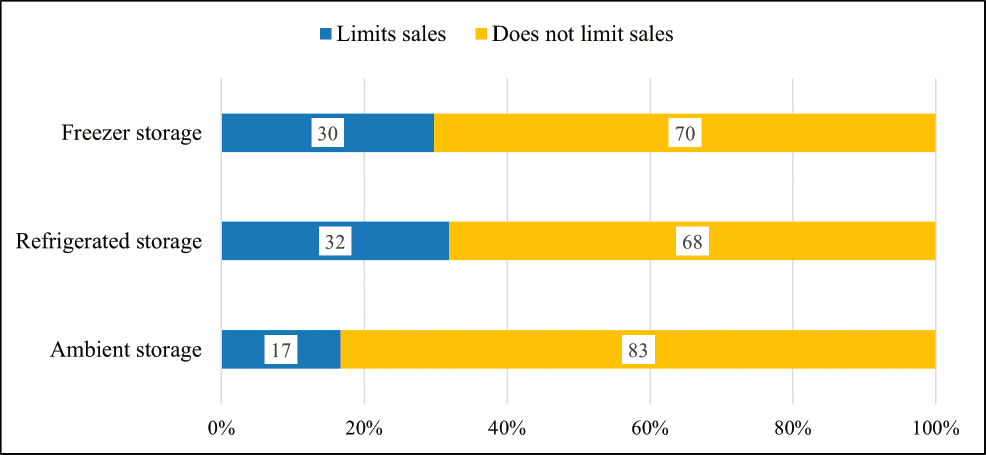
Suppliers were asked about the extent to which the availability (or lack thereof) of different types of storage (freezer storage, refrigerated storage, and ambient storage) limits the quantity of seed they can sell. Approximately 30 percent of the responding suppliers said that the lack of freezer storage and/or refrigerated storage (32%) limits their sales (Figure 7-15a). There were no differences between how suppliers in the East and West answered this question. However, as shown in Figure 7-15b, storage is more of a limiting factor for quantity of seed potentially sold relative to the size of the suppliers (based on annual sales). In particular, nearly 40 percent of smaller firms said that they are constrained by limits on refrigerated storage.
CHALLENGES FACED BY SUPPLIERS
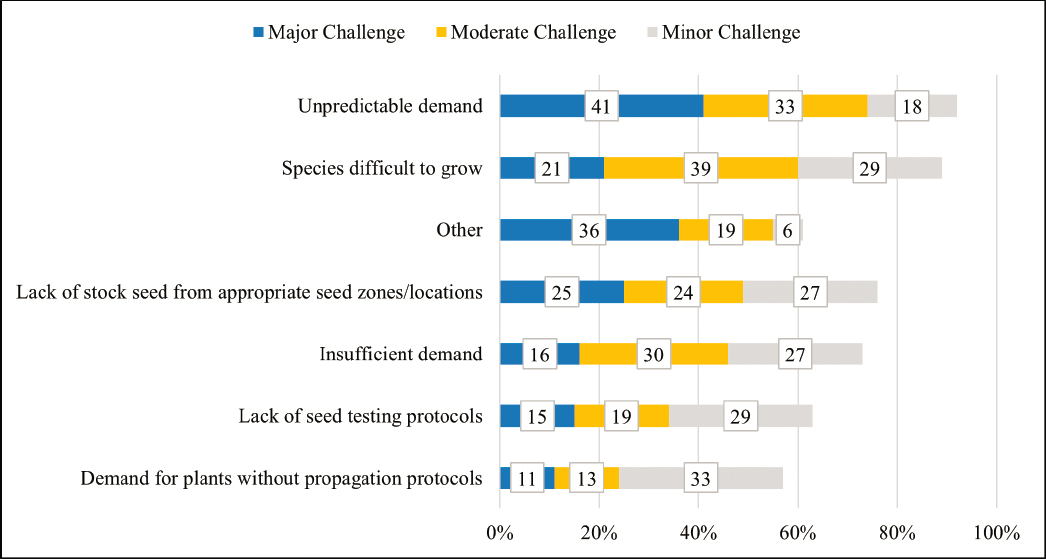
Respondents were asked about the challenge they face as suppliers of native seed or plants. Figure 7-16a shows that unpredictable demand was described as a major or moderate challenge by 74 percent of suppliers. Given the large share of suppliers who responded that the quantity of native seed or plant materials left unmarketed

was either about or less than what they expected, this suggests that they believed that their sales could have been higher if they had been better able to anticipate demand for particular species or species by seed zone. Over half of the respondents (60%) indicated that “difficult-to-grow species” are a major or moderate challenge, and half (49%) mentioned the lack of stock seed from appropriate seed zones or other specified locations are a major or moderate challenge. Insufficient demand was a major or moderate challenge for a little under half of the suppliers (46%). As with responses regarding unpredictable demand, the responses about insufficient demand are likely based on specific species or species by seed zone rather than overall seed output. Fewer respondents mentioned lack of seed testing protocols (34%) and demand for plants without propagation protocols (24%) as a major or moderate challenge.
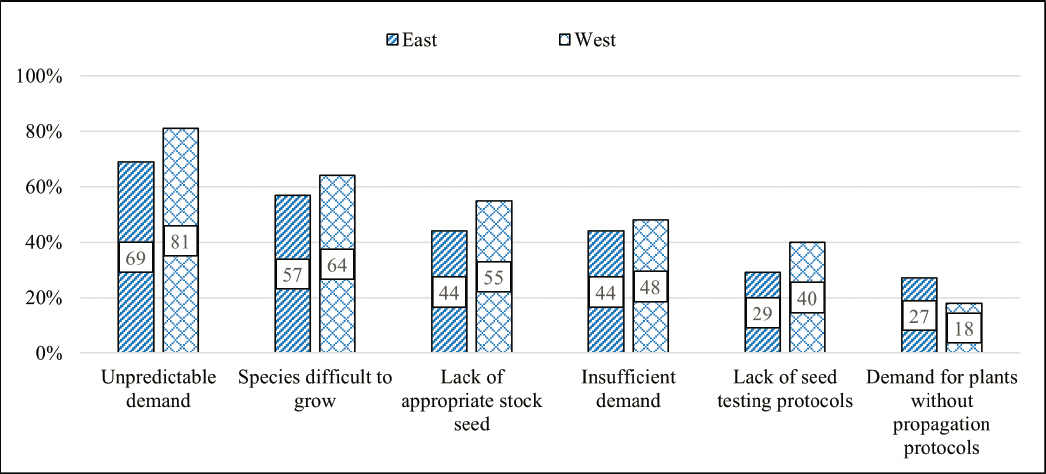
This question was also summarized by total sales categories and location of supplier, Figures 7-16b and 7-16c, respectively. Generally, larger suppliers and suppliers in the West were more likely to describe most of these
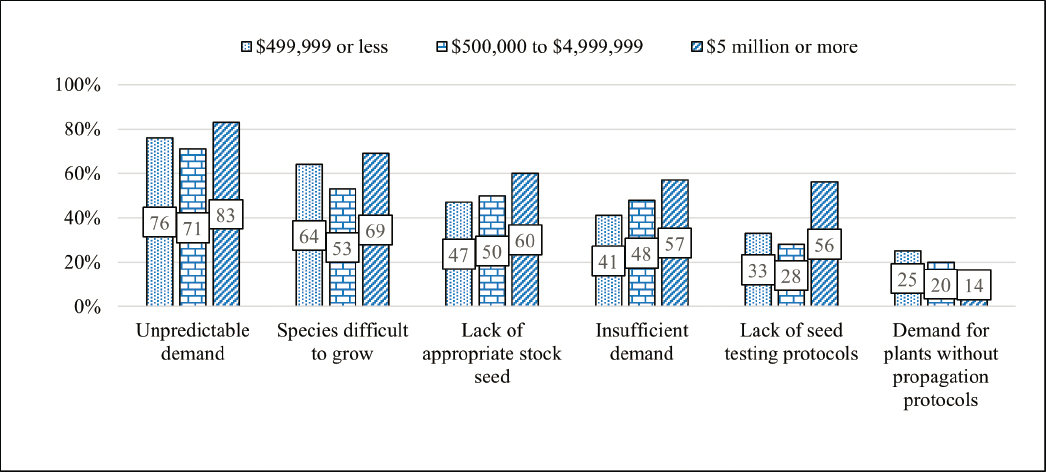
challenges as a major or moderate problem. Demand for plants without propagation protocols seemed to be an exception that was more likely to be a challenge to smaller suppliers and suppliers in the East.
Ability to Expand Capacity
To better understand capacity, suppliers were asked whether they could expand their operations in response to anticipated higher demand. Specifically, suppliers were asked about ability to (1) wild-collect more seed; (2) grow more native plants with the goal of producing and selling native seed; and (3) grow and sell more native plants. Suppliers were also asked about perceived barriers and disincentives that might stand in the way of expanding in these areas.
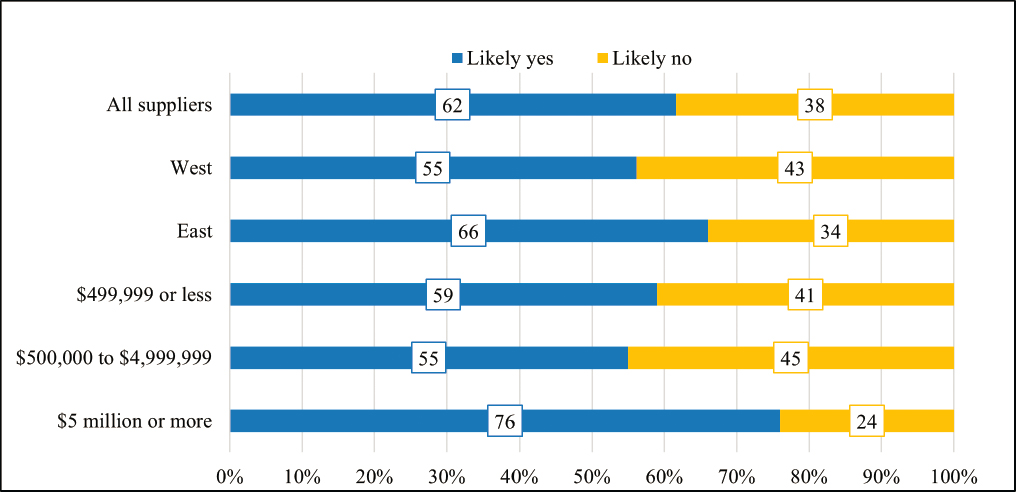
In response to the question “If you were to anticipate higher demand for directly wild-collected native seed, would your business be able to expand to collect more seed?” Sixty-two percent of suppliers said, “Likely yes” and 38 percent answered “Likely no.” A higher percentage of suppliers in the East (66%) thought they could expand their business than in the West (55%). Seventy-six percent of the suppliers with the highest annual sales felt they could expand their wild-seed collection efforts. Figure 7-17 presents responses to this question for all suppliers, and by the overall sales categories and by the location of the supplier.
When asked about barriers or disincentives to wild-collecting native seed, 71 percent of suppliers said that major barriers exist. Table 7-1 provides a summary of the types of barriers that were described by the respondents and the number of respondents that mentioned this barrier. Because access to land is a barrier
TABLE 7-1 Supplier Perspectives on Major Barriers and Disincentives to Wild-Collecting Native Seed
| Barrier | Count |
|---|---|
| Access to land | 62 |
| Availability of seed on the land | 26 |
| Labor | 22 |
| Depletion of the resource | 17 |
| Cost | 13 |
| Time | 12 |
| Markets | 10 |
| Knowledge | 10 |
| Environmental factors | 7 |
| Ethical reasons | 6 |
| Quality of seed | 6 |
| Resources available | 4 |
| Other | 2 |

for many, the largest suppliers may have more access to private land from which to collect than companies with lower revenues.
In response to the question “If you were to anticipate higher demand, would your business be able to expand to grow more native plants with the goal of producing and selling native seed?”, 75 percent said “Likely yes” and 25 percent said “Likely no.” Larger suppliers were more likely to respond affirmatively. Figure 7-18 presents responses to this question for all suppliers, and by the overall sales categories and by the location of the supplier.
When asked about barriers to growing native plants with the goal of producing and selling native seed, 43 percent of suppliers said that there were major barriers. Table 7-2 provides a high-level summary of the types of barriers
| Barrier | Count |
|---|---|
| Markets | 24 |
| Seed/plant viability | 14 |
| Cost | 14 |
| Availability | 8 |
| Space | 8 |
| Environmental factors | 7 |
| Labor | 6 |
| Knowledge | 6 |
| Time | 5 |
| Resources | 4 |
| Zoning Requirements | 3 |
| Permits | 3 |
| Other | 3 |
that were described by the respondents and the number of respondents that mentioned this barrier. Twenty-four cited reasons categorized as “market,” 14 cited “cost,” and 8 cited “availability.” Respondents may have cited more than one barrier. As noted earlier, cost and availability considerations are jointly driven by market forces. So, the dominant category of barrier to greater native seed supply appears to be the market-driven confluence of uncertain demand, high production costs, and availability of native plants as an input to the production process.
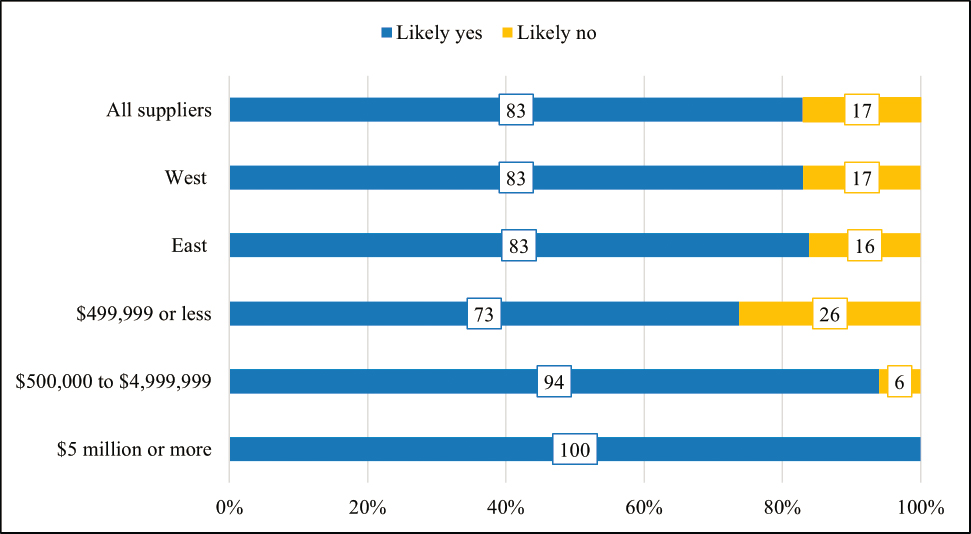
In response to the question “If you were to anticipate higher demand, would your business be able to expand to grow and sell more plant materials?”, 83 percent of suppliers said “Likely yes” and 17 percent said “Likely no.” The responses were similar among suppliers in the eastern and western states. The smallest suppliers were
TABLE 7-3 Supplier Perspectives on Major Barriers and Disincentives to Growing and Selling Plants
| Barrier | Count |
|---|---|
| Markets | 29 |
| Knowledge, education, perception | 13 |
| Cost | 10 |
| Viability | 9 |
| Labor | 8 |
| Availability | 8 |
| Time | 3 |
| Space | 3 |
| Environment | 4 |
| Permits | 1 |
| See previous comment | 5 |
| Other | 6 |
somewhat less likely to say that they could likely expand. Figure 7-19 presents responses to this question for all suppliers, and by the overall sales categories and by the location of the supplier.
In terms of barriers, 45 percent of the suppliers said that there were major barriers or disincentives to growing and selling plants. Table 7-3 provides a summary of the types of barriers that were described by the respondents and the number of respondents that mentioned this barrier. Similar to the types of barriers that surfaced in the responses about growing native plants with the goal of producing and selling native seed, the characteristics of the market were seen as the top barrier to growing and selling plants as well. Twenty-nine cited reasons categorized as “markets,” 10 cited “cost,” and 8 cited “availability.”
SUGGESTIONS FOR ADDRESSING THE CHALLENGES
The survey asked suppliers to provide suggestions that might help address the challenges they have encountered as suppliers of native seeds or plant materials. Table 7-4 provides a high-level summary of the types of suggestions and the number of respondents that provided these comments.
DISCUSSION
Suppliers are pivotal to the native seed supply chain. The strongest message that came from the survey was that suppliers need greater consistency and predictability from their buyers. In an open-ended question asking for final thoughts, some specific suggestions were that buyers should plan projects and communicate their seed needs on realistic timelines that account for the time needed to acquire and/or propagate material; that an information clearinghouse could be a useful mechanism for better connecting buyers and suppliers, thus reducing market friction; and that risk-sharing mechanisms such as contracting or down payments could help create a more stable business environment for suppliers. Several respondents pointed out that an unstable market is especially disadvantageous to small growers, who are important suppliers of diverse locally adapted native species.
TABLE 7-4 Supplier Suggestions to Address the Challenges Encountered
| Category | Description of the Types of Suggestions in the Category | Count |
|---|---|---|
| Planning | Better planning about native seed or plant needs (includes comments about how long it takes to grow a plant before it is ready to sell and disconnect between planning needs and time for a plant to grow). | 31 |
| Awareness, education | Need for more and/or better education around native seeds or plant materials. | 25 |
| Coordination | Better coordination or communication between entities. | 20 |
| Source | Need for more native seed/plant sources, and issues related to availability and production. | 15 |
| Funding | Need for more funding and/or consistent funding. | 14 |
| Policy | Changing policies that impact growing seed. | 10 |
| Markets or economics | Addressing economic or market concerns | 10 |
| Value shift | Need to change paradigms, philosophy, mindset, etc. | 9 |
| Seed specific | Suggestions specific to seed/climate change/germination/growing situation (coded as seed and not planning when it is about a specific type of seed or plant or crop). | 8 |
| Regional focus | More focus on regional/local seed production and/or sharing of collections. | 7 |
| Standards | Need for better standards, uniformity. | 7 |
| Labor | Addressing labor needs or requirements. | 5 |
| Access | Addressing issues of access (without reference to policies). | 4 |
| Other | Other responses not categorized elsewhere. | 2 |
The suppliers who responded to this survey most often anticipated demand not trying to predict wildfire frequency or what was previously requested by the BLM consolidated buys, but by more consistently growing markets such as the urban and landscaping sector, and the USDA Conservation Reserve Program. That does not mean that the seeds they supply to these markets would be appropriate for all restoration purposes, only that markets that are predictable and stable are able to get the focus of suppliers.
Another theme of the open-ended comments was that buyers are not always knowledgeable about the use of native plants in restoration and other uses. They may not be aware of which native plants to use in a given project, how to propagate these materials successfully, or even why it is important to use native species in restoration. There is confusion around seed zones, with some buyers being unaware of the need to use genetically appropriate material, while others have unrealistic expectations about how local the material should be. Better education of the personnel involved in seed buying and restoration, greater collaboration between buyers and knowledgeable suppliers, and a clear and agreed-upon system of seed zones were among the suggestions in this area. Even more broadly, suppliers suggested, a more thriving seed industry could emerge if agencies and their contractors, and the general public, had a better understanding of the importance of native plant species.
Multiple suppliers commented on the need for improved access to native seed collection sources on public lands, calling for a more streamlined permit process, protection of important source areas, and even the potential use of successfully restored sites for seed collection. Several growers also called for Plant Materials Centers to play a larger role in developing and distributing stock seed. The lack of stock seed of the local ecotypes desired by buyers is a barrier to their supply. Given that about two-thirds of suppliers sell seed of claimed wild origin, getting certified seed stock seed into the hands of producers would increase the confidence of seed users that the origins of the seed purchased has been verified.
In addition to establishing clear seed zones and an information clearinghouse, another function that suppliers suggested could be an improved system of seed testing, quality control, and labeling, which would protect high-quality suppliers. Some suppliers also called for technical assistance, such as the development of techniques for cleaning and propagation.
CONCLUSIONS
Conclusion 7-1: Suppliers view unpredictable demand as their leading challenge (75% of respondents). The problem is particularly acute among western suppliers of native seeds and plants (81%).
Conclusion 7-2: The top two technical challenges reported by suppliers are difficult-to-grow species of native plants (60%) and lack of stock seed from appropriate seed zones or locations (50%).
Conclusion 7-3: If they could reliably anticipate demand, the majority of suppliers who replied to these questions said that they could (1) expand wild collection of native seed (62%), (2) produce more native seed (75%), and (3) grow more native plants (83%).
Conclusion 7-4: Suppliers use past purchases to predict future demand, although suppliers also know that buyers will take substitutions, which creates a circular system that does not serve to expand the diversity of species and ecotypes for the market.
Conclusion 7-5: For increasing the supply of wild-collected native seed, the principal barrier is access to land. For expanding production of native seed and plant materials, 43 to 45 percent of suppliers reported barriers, with markets cited as the leading barrier in both cases.
Conclusion 7-6: Sixty-five percent of suppliers report that they sell certified Source-Identified seed. About the same percentage (68%) also sell seed of claimed wild origin or provenance.
Conclusion 7-7: Lack of refrigerator or freezer storage limited sales for roughly 30 percent of native seed suppliers.
Conclusion 7-8: Among supplier suggestions to address the challenges that they encounter, four of the top seven response categories were related to communicating demand to suppliers (i.e., planning, communication, funding, and markets or economics).
Conclusion 7-9: Some suppliers suggested that a more thriving seed industry could emerge if agencies and their contractors, and the general public, had a better understanding of the importance of native plant species.
Conclusion 7-10: Marketing or production contracts were used by half of supplier respondents. The most highly valued contract characteristics (described as “very important” or “somewhat important” by 75% or more of suppliers) were delivery timeline, price guarantee, and guarantee to purchase a predetermined quantity.


