
3
Background and History, Current Status, and Near-Term Future of Net Metering
INTRODUCTION
This chapter provides a review of net metering in the United States, from its beginnings in the early 1980s1 through its widespread use by states and utilities in the 1990s and 2000s. Topics presented in this chapter include:
- Trends in adoption of net metering and related solar support policies
- Trends in adopting variants and alternatives to net metering in states, and their relative popularity
- Trends in deployment and costs for distributed solar generation and storage systems
- Trends and tensions in the relationship between electricity market structures, net metering policy adoption, and the introduction of solar-supporting policy mechanisms, as well as related developments and changes in energy and electricity system policy objectives
- Findings and recommendations
TRENDS IN THE ADOPTION OF NET METERING AND RELATED SOLAR SUPPORT POLICIES
The earliest state adopters of net metering did so for a number of reasons. According to a 1998 study by National Renewable Energy Laboratory (NREL) researchers:
___________________
1 Eligible technologies and system sizes varied among the states, but typically provisions were included for small-scale photovoltaics and wind energy. Many states included other generating technologies, such as biomass, combined heat and power (CHP), small or micro-hydroelectric, and solar thermal electric. As reported in this chapter, 97 percent of all net metering participation has been for solar photovoltaic (PV) systems, with very small numbers of other technologies making up the remainder, mostly small wind and small or micro-hydroelectric systems. For state-by-state details of eligible technologies and other rules, see NC-CETA (North Carolina Clean Energy Technology Center). 2022a. “Database of State Incentives for Renewables & Efficiency® (DSIRE).” https://www.dsireusa.org.
The main objective for states implementing net metering programs [was] to encourage private investment in renewable energy resources. Other goals include[d] stimulating local economic growth, diversifying energy resources, and improving the environment.2
Since then, other objectives have been added by states, including giving customers options for producing their own power and managing their energy bills, driving down the costs of renewables as the markets expand and technologies improve, and producing power with lower carbon emissions.3 Net metering policies supported electricity customers’ adoption of solar and other eligible behind-the-meter (BTM) resources and helped to satisfy these objectives.
Through the early 2010s, net metering was widely accepted as one of the key policies for supporting small residential and commercial distributed generation resources, most notably for solar photovoltaic (PV) systems. As shown in Table 3-1, 7 states initiated net metering programs in the 1980s, followed by 14 more states in the 1990s, and then another 21 states in the early 2000s.4
Net metering policies spread to many jurisdictions because net metering was a relatively easy to understand and administer tariff for serving early adopters of BTM distributed generation (DG) technologies. Almost all participating jurisdictions limited the total program size to small percentages of utility customers or utility load (initially not more than 1 percent in several states), such that any mismatch between benefits and costs would result in only de minimis shifting of benefits and costs between utility shareholders and customers, or between participating and non-participating customers.5
___________________
2Wan, Y.H., and H.J. Green. 1998. “Current Experience with Net Metering Programs.” CP-500-24527. Golden, CO: National Renewable Energy Laboratory. Paper presented at WINDPOWER ’98, Bakersfield, CA. https://www.nrel.gov/docs/legosti/old/24527.pdf.
3 Many states have made formal commitments to reduce greenhouse gas emissions associated with energy production and use. NRRI (National Regulatory Research Institute). 2022b. “State Clean Energy Policy Tracker.” https://www.naruc.org/nrri/nrri-activities/clean-energy-tracker.
4 The term “state” is used here to refer to states or other regulatory jurisdictions, like the District of Columbia. Seven states started net metering programs in the 1980s: Massachusetts and Wisconsin (1982), Minnesota and New Hampshire (1983), Iowa (1984), Maine (1987), and Oklahoma (1988). See Stanton, T., and D. Phelan. 2013. “State and Utility Solar Energy Programs: Recommended Approaches for Growing Markets.”NRRI 13-07. Silver Spring, MD: National Regulatory Research Institute. https://pubs.naruc.org/pub/FA86BBED-D69F-C1EC-D308-0BB2CDAF5E37.
5 See Stanton, T. 2019. “Review of State Net Energy Metering and Successor Rate Designs.” NRRI 19-01. Silver Spring, MD: National Regulatory Research Institute. https://pubs.naruc.org/pub/A107102C-92E5-776D-4114-9148841DE66B (hereafter Stanton 2019). Net metering was generally understood to be a“rough-justice” policy: “When net metering was just getting started, the small number of participating customers multiplied by the small quantity of energy each would deliver to the grid, meant that any error associated with under- or over-estimating the true value [of net metering credits] would be small.”
TABLE 3-1 Timeline of Major State Actions on Net Metering Policy
| 1980s | 1990s | 2000s | 2010 | 2011 | 2012 | 2013 | 2014 | 2015 | 2016 | 2017 | 2018 | 2019 | 2020 | 2021 | 2022 |
|---|---|---|---|---|---|---|---|---|---|---|---|---|---|---|---|
| Cumulative number of jurisdictions with net metering policy in place at year end | |||||||||||||||
| 8a | 21a | 42 a | 43 a | 44 | 44 | 44 | 43 | 41 | 39 | 35 | 34 | 33 | 33 | 31 | 30 |
| Expanding technologies eligible for net metering (shown in parentheses when adding provisions for including energy storage) | |||||||||||||||
| 8 states |
(HI) | (CA) (CO) (NY) |
(AR) (MA) (SC) |
(ME) | (MS) | ||||||||||
| Increasing size limits for individual systems (shown in parentheses for increasing size limit for total net metering program capacity) | |||||||||||||||
| MA | 13 states |
CA NJ VA WV |
LA NV VA |
IL IN MA NY |
MN NY |
MA | NJ SC |
AR ME |
VA | CO HI IL MA MD |
(DE) MA MS |
||||
| Changing carryover rules and/or credit rates for monthly net excess generation | |||||||||||||||
| MA NH |
14 states |
VA WV |
MN NV |
NH NV |
MA | KY | DE | ||||||||
| Replacing net metering with successor tariffs [with square brackets indicating initiating a first NEM-type tariff] and (in parentheses for court orders reversing net metering replacement tariff) | |||||||||||||||
| [MS]b | HI (NV) |
AZ CA | HI (ME) MIc NYd UT |
(KS) | LA | NYd UT |
CT SC | IN | |||||||
a By year-end 2009, 41 states and the District of Columbia had adopted net metering policies. For the timeline of states initiating net metering, see K.M. Smith, C. Koski, and S. Siddiki, 2021, “Regulating Net Metering in the United States: A Landscape Overview of States’ Net Metering Policies and Outcomes,” The Electricity Journal 34(2):106901. For net metering policy changes prior to and shortly after 2010, see pp. 10 and 29 in T. Stanton, 2019, “Review of State Net Energy Metering and Successor Rate Designs,” NRRI 19-01, Silver Spring, MD: National Regulatory Research Institute, https://pubs.naruc.org/pub/A107102C-92E5-776D-4114-9148841DE66B, and pp. 8–21 in T. Stanton and D. Phelan, 2013, “State and Utility Solar Energy Programs: Recommended Approaches for Growing Markets,” NRRI 13-07, Silver Spring, MD: National Regulatory Research Institute, https://pubs.naruc.org/pub/FA86BBED-D69F-C1EC-D308-0BB2CDAF5E37.
b Mississippi calls its program net metering, but the provisions meet the definition of net-energy billing.
c The Michigan Public Service Commission issued an order approving a successor tariff design in 2017, but successor tariffs are being approved and implemented in individual utility rate cases following that decision.
d The New York Public Service Commission adopted a successor tariff for large commercial and community DG systems in 2017 and a successor tariff for other DG systems in 2020.
NOTE: See Appendix B for more details and links to official documents.
Although details might not have been explicitly addressed in authorizing legislation or in regulatory orders approving net metering tariffs, some industry participants believed net metering to be a temporary and participation-limited option. Many state programs were initiated in what were generally understood to be uneconomic or pre-economic markets, where solar PV installation costs were high compared to retail utility rates and returns on investment for participating customers were small, if any. Thus, rapid growth and expansive participation was not necessarily anticipated. In many jurisdictions, sunset clauses or trigger mechanisms calling for the review and resetting of policies were included in laws and rules, in case participation did reach specific limits in terms of capacity or numbers of participating customers. Even in jurisdictions with multiple types of taxpayer and ratepayer incentives, in the early stages of net metering programs only small numbers of potential consumers were adopting net metering systems.6 As described in Chapter 1 of this report, net metering essentially involves customer generators reducing their utility bill at the retail rate for each kilowatt-hour of energy generated and used onsite. However, net metering programs differed, especially in terms of:
- Eligible generating technologies and the maximum size of eligible generators, usually related to the capacity needed to serve the customer’s annual average energy usage
- Statewide program or utility system caps on participation usually expressed in percentage caps on participating capacity or numbers of customers
- Treatment of exported generation, including variations in the rate of compensation, if any, for that exported generation7
Gradually, solar PV technology improved, system costs declined, and financing options for distributed solar became more attractive to more customers. At the same time, net metering policies combined with multiple solar support mechanisms and financial incentives in many jurisdictions to further improve the customer economics for solar. As a result, larger numbers of customers began adopting BTM DG, particularly solar, and participating in net metering programs. Furthermore, with the declining costs of battery
___________________
6Taylor, M., J. McLaren, K. Cory, T. Davidovich, J. Sterling, and M. Makhyoun. 2015. “Value of Solar: Program Design and Implementation Considerations.” NREL/TP-6A20-62361. Golden, CO: National Renewable Energy Laboratory. https://www.nrel.gov/docs/fy15osti/62361.pdf. Taylor et al. characterize markets for solar PV as non-economic when the lifecycle cost of PV energy is substantially higher than the price of utility-delivered energy, as pre-economic (or transitional) when the PV cost and grid price are converging, and as grid-competitive when PV cost is lower than grid price. As they note, combinations of net metering and other solar incentive and support policies in many jurisdictions gradually shifted markets in many utility service territories toward grid-competitive status, attracting increasing numbers of participating customers. See also Stanton 2019, pp. 4–7, note Stanton uses “uneconomic” instead of “non-economic.”
7Smith, K.M., C. Koski, and S. Siddiki. 2021. “Regulating Net Metering in the United States: A Landscape Overview of States’ Net Metering Policies and Outcomes.” The Electricity Journal 34(2):106901.
storage, growing numbers of customers are pairing BTM DG with storage. Storage introduced new complexities to existing net metering policies, and several states (including Arkansas, California, Hawaii, Maine, Massachusetts, Mississippi, New York, and South Carolina) have clarified net metering rules to specify that paired systems are eligible, frequently with stipulations that energy delivered from batteries can receive net metering credits only if the batteries are charged from the qualifying BTM DG facility.
Net metering policy in the United States was frequently implemented at the same or nearly the same time as other state policies regarding clean and renewable energy financial support and as energy portfolio standard goals or requirements for some or all electric utility companies (and for competitive load serving entities in restructured states that allow retail competition). These are typically called renewable portfolio standards (RPS) or clean energy standards (CES). These policies established increasing quotas for electricity supplies from qualifying sources of generation and let markets and utility competitive bidding practices establish the prices for procuring and delivering those supplies. Qualifying technologies (including whether solar counted toward their goals), percentage goals, and target years differed widely among the states, but in the committee’s judgment the practice most often directed utilities to produce or procure electricity that would add approximately 1 percent of new qualifying resources each year.8Figure 3-1 is a map summarizing the applicable portfolio policies in the states and territories. As shown in Figure 3-1, 15 jurisdictions are striving to achieve 100 percent of electricity production from qualifying resources by 2050 or sooner. A related policy in many U.S. states was to allow or to mandate that regulated utilities would offer green or renewable energy premium pricing programs, where customers could voluntarily participate in utility rate offerings with higher than the minimum and up to as much as 100 percent of supply from clean or renewable resources.9
___________________
8 As experience was gained and costs fell as more net metering systems were installed, many states revisited their renewable or clean energy portfolio standards and increased the rates of additions-per-year. Gradually, many states enacted new laws and rules, increasing annual new clean energy capacity goals or mandates. In addition, many states have also made formal commitments to reduce greenhouse gas emissions associated with energy production and use. See NRRI. 2022b. “State Clean Energy Policy Tracker.” https://www.naruc.org/nrri/nrri-activities/clean-energy-tracker.
By 2022, 41 states, the District of Columbia, and all 4 major U.S. territories had implemented renewable or clean energy goals or mandates, and 47 states, the District of Columbia, and all 4 territories had implemented net metering policies or had already enacted net metering alternatives. Both energy portfolio standards and net metering or net metering alternatives were in place in 35 states plus the District of Columbia and the 4 major territories. See NC-CETA. 2022a. “Database of State Incentives for Renewables & Efficiency® (DSIRE).” https://www.dsireusa.org.
9NREL. 2022b. “Energy Analysis, Voluntary Green Power Procurement.” https://www.nrel.gov/analysis/green-power.html.
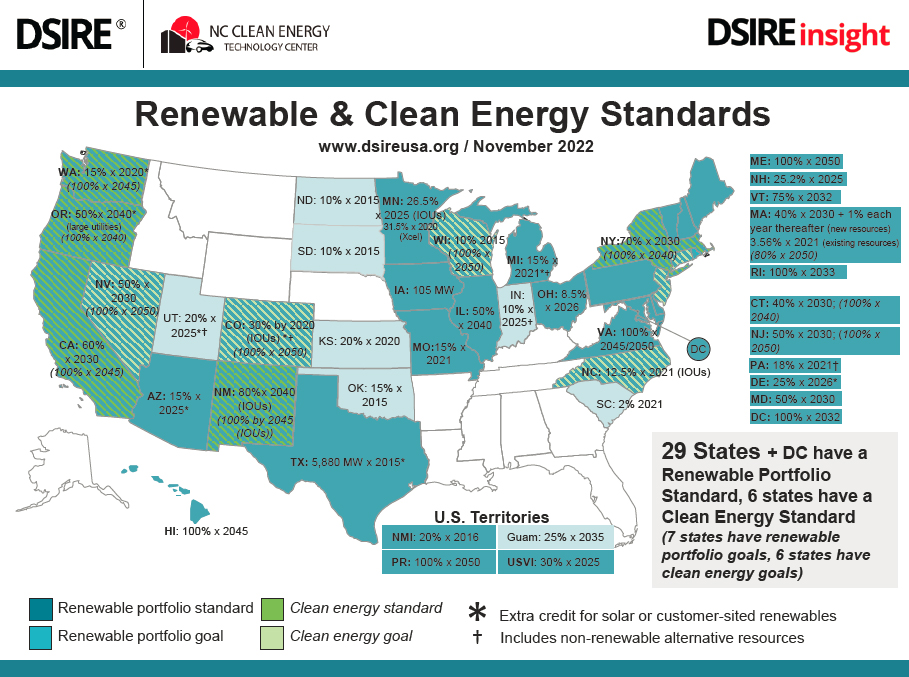
SOURCE: NC-CETC (North Carolina Clean Energy Technology Center), 2022a, “Database of State Incentives for Renewables & Efficiency® (DSIRE),” https://www.dsireusa.org.
In specific states and utility service territories, rapid growth in customer-sited PV capacity increased pressure for modifying rate structures. Efforts have been made in many areas to adjust net metering variants and alternatives so that returns on investment for self-generation would not be excessive when considering multiple categories of benefits and costs associated with the self-generation, and the combinations of both utility rate treatment and the available federal, state, and sometimes also local solar support policies. In order to broaden participation by more consumers, many states added provisions for what was typically called aggregated or virtual net metering (VNM).10
___________________
10 See the discussion of virtual net metering in Chapter 1 and Box 3-1.
TRENDS IN THE ADOPTION OF NET METERING VARIANTS AND ALTERNATIVES
The timeline presented in Table 3-1 illustrates this history of jurisdictions adopting net metering policies, followed by a gradual decline in traditional net metering as more jurisdictions modified their net metering policies and several opted for new kinds of DG tariffs. The number of states with net metering is shown declining, starting in the mid-2010s, as multiple jurisdictions adopted successor or replacement tariffs, as well as alternatives to ratemaking support for DG, sometimes particularly for solar or solar-plus storage.
By 2022, nearly every U.S. regulatory jurisdiction had considered at least some variants or alternatives to net metering.11 These efforts arose in different ways: some state legislatures, such as California, directed regulators to transition to net metering variants and alternatives; utility regulators in other states, like Hawaii and New York, initiated regulatory proceedings to design variants; and utilities in some states, including Arizona, filed proposed net metering successor tariffs with their public utilities commissions. Many states had included in net metering enabling legislation sunset clauses or trigger mechanisms directing regulators to consider net metering variants, alternatives, and successors once participation levels reached pre-established program or utility system caps. By the end of 2021, as shown in Figure 3-2, reforms in net metering policy had already been implemented or were under active consideration in over half of all U.S. states, and several jurisdictions had already established and begun to implement net metering rate design variants, including several jurisdictions adopting what are often called net metering replacement tariffs.12 Arizona, California, Hawaii, Indiana, Louisiana, Michigan, New York, South Carolina, and Utah had adopted variants to replace traditional net metering offerings. Other states, including Alabama, Mississippi, and South Dakota offer variants to traditional net metering, without previously having had in place a traditional net metering retail rate compensation structure. Georgia also fits into this latter category, except for a small net metering pilot program in 2020–2021 for customers of Georgia Power Company (offering net metering to 5,000 rooftop solar customers, up to 32 megawatts [MW] of newly installed total capacity).13
___________________
11 See NC-CETC. 2022c. “The 50 States of Solar: Q4 2021 Quarterly Report and 2021 Annual Review.” https://nccleantech.ncsu.edu/wp-content/uploads/2022/01/Q4-21-Solar-Exec-Summary-Final.pdf, pp. 7, 9, and 14.
12NC-CETC. 2022b. “The 50 States of Solar: 2021 Policy Review and Q4 2021 Quarterly Report.” January. https://nccleantech.ncsu.edu/the-50-states-reports, p. 7.
13GPSC (Georgia Public Service Commission). 2020. “Order Approving the Renewable and Non-Renewable Resources Tariff (RNR-10) with Modifications.” GPSC Docket No. 42516, Document Filing #181467. https://psc.ga.gov/search/facts-document/?documentId=181467.
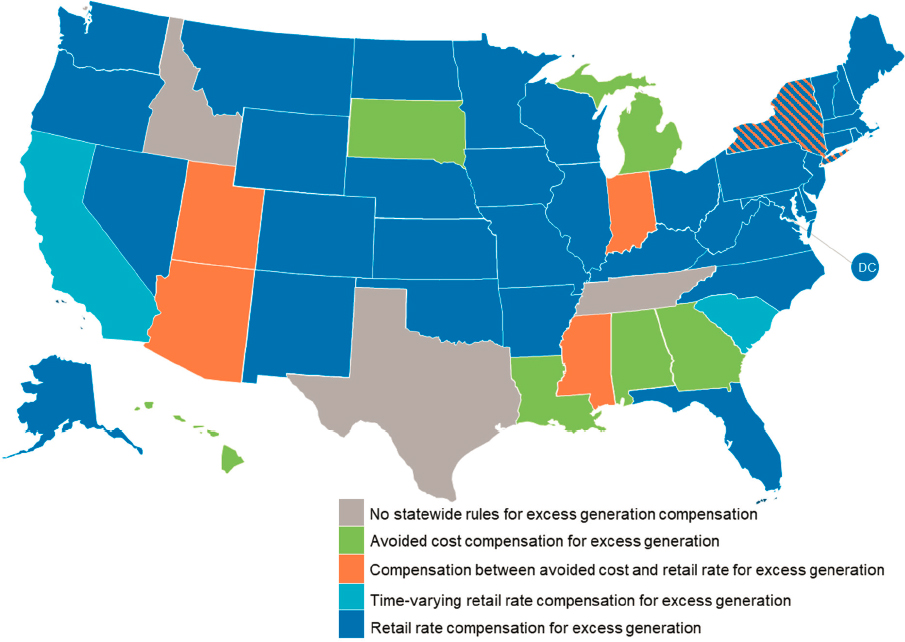
NOTES: Illinois is set to transition to compensation at the energy supply rate in 2025. Idaho and Texas do not have statewide rules for DG compensation, but several Idaho utilities and Texas competitive electric service providers do offer net metering for their participating customers.
SOURCE: NC-CETC (NC Clean Energy Technology Center), 2022d, “The 50 States of Solar: Q3 2022 Report,” https://www.dsireinsight.com/publications.
Of states adopting net metering variants, the most common approach has been to implement a net billing structure, where netting intervals are shorter than the billing period and credit rates for exported energy differ from the retail rate. Most states that have approved a net billing structure are utilizing a netting interval of 1 hour or less; however, jurisdictions apply many variations of net billing credits. Inflow/outflow structures, where the kWh inflow and the kWh outflow are separately measured and priced, could be considered a form of net billing, where the netting is effectively performed on an “instantaneous” basis. Some states have elected to use a wholesale avoided cost rate as the compensation rate for excess generation, while others apply one or more adders or multipliers to the wholesale avoided cost rate. The latter group includes several states
adopting their own value-of-solar (VOS) or value of distributed energy resources (VDER) rates.14 For example:
- New York. For larger customer-generators, calculates credits using a VDER methodology
- Arizona is gradually reducing its credit rate by 10 percent per year until reaching the avoided cost, based on the recent contract cost of utility scale solar resources15
- California and South Carolina have adopted variants to traditional net metering, applying time-varying retail credit rates
- Massachusetts uses geographically variable retail credit rates that depend on costs associated with the specific distribution circuit where each DG project is interconnected16
Concerns about the potential for utility costs to be shifted from net metering customers to non–net metering customers continue as a major consideration in both legislative changes and regulatory proceedings exploring and implementing net metering variants and alternatives.17 Separately from the net metering credit interval and rate, several states and utilities have attempted to address cost shifting issues primarily by assigning additional fees to customer-generators or in some cases to only those on net metering rates or those with BTM solar. Types of charges include demand charges, standby charges, fixed system use charges, and in a few cases minimum bills.18 Although
___________________
14 Personal communications with North Carolina Clean Energy Technology Center, November 2022. “DSIRE Insight Distributed Solar Policy Data. Value of Solar Studies” (spreadsheet); and NC-CETC. 2022b. “The 50 States of Solar: 2021 Policy Review and Q4 2021 Quarterly Report.” January. https://nccleantech.ncsu.edu/the-50-states-reports, pp. 25–27.
In its review of distributed solar valuation studies, North Carolina Clean Energy Technology Center identifies 40 studies completed between 2005 and 2022. Studies have been completed in 26 different jurisdictions. In at least 16 of the jurisdictions, studies were undertaken by state public utility regulatory authorities or legislative working groups. However, not all the studies are used in establishing utility compensation rates for BTM DG. Minnesota and New York are basing compensation on the results of value-based studies for some BTM DG customers, but other states have not yet adjusted rates to reflect the findings of completed studies. Two other jurisdictions, Maryland and Missouri, are presently completing value-based studies. Table B-4, in Appendix B, lists the cost and benefit categories included in recently completed value-based studies.
15Arizona Corporation Commission. 2017. “Decision No. 75859.” Docket No. E-00000J-14-0023. January 3. https://docket.images.azcc.gov/0000176114.pdf?i=1614371719161.
16 For more information see https://www.mass.gov/guides/net-metering-guide#-2.-net-metering-credit-calculation-and-billing and https://www.mass.gov/files/220_cmr_18.00_final_12-1-17_1.pdf. This credit also only applied to net excess generation, so after net metering has already taken place.
17 See further discussion of cost shifting in Chapters 4 and 5, including consideration that benefits of BTM DG supported by net metering can more than offset any costs.
18 See Chapter 1 for discussion of ratemaking and definitions of terms.
several proposed fees for DG customers have been rejected by regulators or overturned by courts, certain investor-owned utilities in five states—Alabama, Arizona, New York, South Carolina, and Texas—have such fees in effect as of December 2022.19
TRENDS IN DEPLOYMENT AND COSTS FOR DISTRIBUTED SOLAR GENERATION AND STORAGE
Deployment Trends for Customer-Sited Generation and Storage
DER encompass a broad range of technologies—including DG, storage, energy efficiency, and demand response—that may be installed onsite or BTM by an electricity customer or connected directly to the utility’s distribution network (in front of the meter). Net metering applies to customer-sited BTM generation and storage, with rules determining how participating customers are credited for electricity exported to the utility network. This section provides an overview of deployment trends for customer-sited generation and storage, as context for later discussions of the economic and equity implications of net metering.
Technology Trends
In aggregate, 72 gigawatts of customer-sited generation were installed in the United States as of year-end 2021, representing 5.6 percent of total U.S. electric generating capacity (albeit a smaller percentage of total electricity generation, given the lower capacity factor of solar compared to most other forms of generation).20 As shown in Figure 3-3, that total consists almost entirely of PV and combined heat and power (CHP) systems, in roughly equal shares, with the remainder consisting of small quantities of wind, hydro, and other thermal (non-CHP) resources. As indicated in the figure, net metering
___________________
19NC-CETC. 2023. “The 50 States of Solar: 2022 Policy Review and Q4 2022 Quarterly Report.” https://nccleantech.ncsu.edu/the-50-states-reports. For more information on each state see AL - https://www.alabamapower.com/content/dam/alabama-power/pdfs-docs/Rates/RGB.pdf; AZ - https://docs.tep.com/wp-content/uploads/714-TEP-Rider-14-RCP_P2.pdf; NY - https://www.nyserda.ny.gov/-/media/Project/Nyserda/Files/Programs/NY-Sun/Overview-of-Customer-Benefit-webinar-presentation.pdf; SC - https://p-cd.duke-energy.com/-/media/pdfs/for-your-home/rates/dep-sc/leaf-no-502-schedule-r-stou.pdf; TX - https://www.epelectric.com/files/html/Rates_and_Regulatory/TX%20Rates/Section%201%20-%20Sheet%2004.0%20-%20Schedule%2001%20Residential%20Service%20Rate.pdf.
20 Percentage calculation is based on 72 GW (in alternating-current capacity) and a total 1273 GW (AC) nameplate capacity of U.S. utility-scale plus distributed electric generating plants through 2021, as reported by EIA. 2022c. “Electric Power Annual.” November 7. https://www.eia.gov/electricity/annual.
and customer-sited solar are inextricably linked: almost all customer-sited solar is net-metered (92 percent), and almost all net-metered generation is solar (97 percent).21 Although net metering policies in many states preceded the early years of this century, almost all customer-sited PV capacity has emerged since 2010, as shown in the yellow color in Figure 3-3.22 That growth occurred as solar PV costs fell (as discussed later in this chapter), other supportive policies proliferated, and markets matured.23
Compared to customer-sited PV, customer-sited storage has been deployed at a much smaller scale to date, with just over 1 gigawatt installed in the United States as of the end of 2021 (see Figure 3-4). Virtually all that capacity has been built since 2017, consisting mostly of battery storage co-installed with solar PV. Nationally, about 10 percent of new residential PV installations and 5 percent of new commercial PV installations in 2021 were paired with storage.24 This recent growth can be attributed to a combination of declining costs for lithium-ion battery storage technologies, policy incentives, and new sources of demand. One source of demand has been for backup power, most notably in California, where storage installations accelerated in the wake of wildfire-related Public Safety Power Shutoff (PSPS) events. Those trends are especially pronounced in the northern part of the state, where PSPS events have been most frequent.25 A similar spike in paired PV-plus-storage occurred in Texas, following the extended power outages associated with winter storm Uri in February 2021.26
Importantly, demand for battery storage has also been driven by net metering reforms. Nowhere is this more evident than in Hawaii, where more than 80 percent of new PV installations are now paired with battery storage.27 Since October 2015, when the State
___________________
21 For additional data, see https://sgp.fas.org/crs/misc/R46010.pdf.
22 Additional data sourced from https://irecusa.org/resources/annual-u-s-solar-market-trends-report.
23 In contrast, commercial and industrial CHP is not net-metered and dates back much further in time, with most existing capacity installed between 1980 and 2005.
24Barbose, G.L., N. Darghouth, E. O’Shaughnessy, and S. Forrester. 2022. Tracking the Sun: Pricing and Design Trends for Distributed Photovoltaic Systems in the United States. Berkeley, CA: Lawrence Berkeley National Laboratory. https://emp.lbl.gov/tracking-the-sun.
25Barbose, G.L., S. Elmallah, and W. Gorman. 2021a. Behind the Meter Solar + Storage: Market Data and Trends. Berkeley, CA: Lawrence Berkeley National Laboratory. https://emp.lbl.gov/publications/behind-meter-solarstorage-market-data.
26Wood Mackenzie and Solar Energy Industries Association. 2022a. “US Solar Market Insight: 2021 Year-in-Review.” https://www.woodmac.com/reports/power-markets-us-solar-market-insight-2021-year-in-review-150013339.
27Bai, J., D. Shuai, and E. Tian. 2022. “Solar PV Battery Installations in Honolulu: 2021 Update.” Research and Economic Analysis Division, Department of Business, Economic Development and Tourism, State of Hawaii. https://files.hawaii.gov/dbedt/economic/data_reports/reports-studies/Solar_PV_Battery_Installation_2022May.pdf.
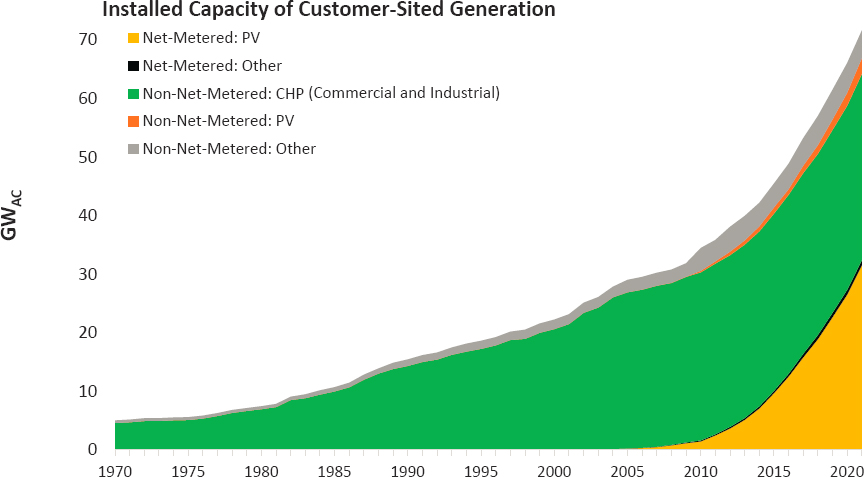
NOTES: The figure aggregates data from several separate EIA datasets. Data for net-metered systems come from EIA Electric Power Annual, “Table 4.10. Net metering customers and capacity by technology type, by end use sector” (EIA 2022a). For the purpose of this figure, we exclude capacity associated with virtual net metering, which often consists of offsite projects. Data for small (<1 MW) non-net-metered systems are from EIA Electric Power Annual “Table 4.9.B. Total capacity of non-net-metered distributed generators by technology type and by sector” (EIA 2022a). For the purpose of this figure, we exclude capacity directly connected to the utility distribution network. Finally, data for large (≥1 MW) non-net-metered systems are from EIA Form-860 and consist of projects identified as commercial or industrial sectors (EIA 2022b). As such, the CHP totals exclude a sizable amount of capacity owned by independent power producers.
SOURCES: Data from EIA, 2022a, “Annual Electric Power Industry Report, Form EIA-861 Detailed Data Files,” November 18. https://www.eia.gov/electricity/data/eia861; EIA, 2022b, “Annual Energy Outlook,” March 3, https://www.eia.gov/outlooks/aeo/index.php.
Public Utilities Commission limited the number of new solar PV customers to send excess power to the electric grid for credit, battery-connected PV system then become a more attractive option. As that transition has progressed, customers have increasingly paired new solar installations with storage, which they use to reduce exports and maintain full retail rate offsets for as much of their PV generation as possible. As a result, revenue impacts to the utility are similar to what would have occurred under traditional net metering. (See Chapter 4 for further discussion.)
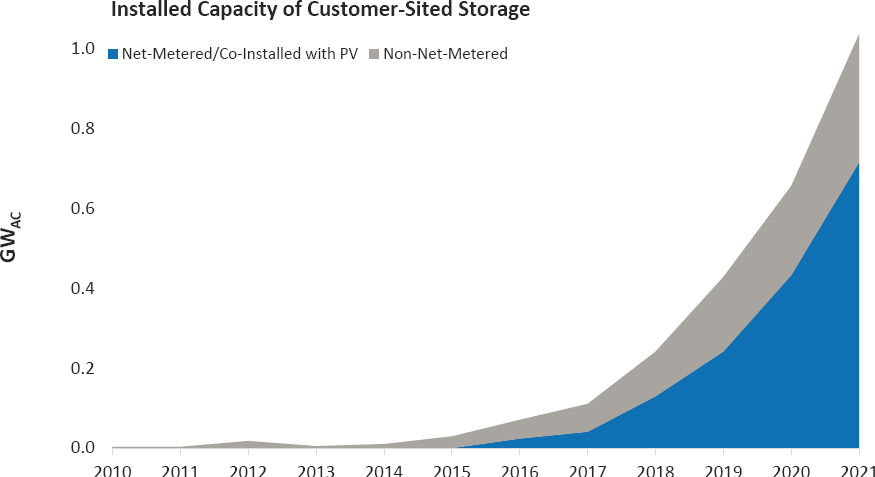
NOTES: The figure aggregates data from several separate EIA datasets. Data for net-metered storage co-installed with PV are from EIA Electric Power Annual, “Table 4.10. Net metering customers and capacity by technology type, by end use sector.”a Data for small (<1 MW) non-net-metered storage are from EIA Electric Power Annual, “Table 4.9.B. Total capacity of non-net-metered distributed generators by technology type and by sector.”a For the purpose of this figure, we exclude capacity directly connected to the utility distribution network. Finally, data for large (≥1 MW) non-net-metered storage are from EIA Form-860 and consist of projects identified as commercial or industrial sector.b
a EIA. 2022b. “Annual Energy Outlook.” March 3. https://www.eia.gov/outlooks/aeo/index.php.
b EIA. 2022e. “Form EIA-860 Detailed Data with Previous Form Data (EIA-860A/860B).”June 2. https://www.eia.gov/electricity/data/eia860.
SOURCES: Data from EIA, 2022b, “Annual Energy Outlook,”March 3, https://www.eia.gov/outlooks/aeo/index.php; EIA, 2022e, “Form EIA-860 Detailed Data with Previous Form Data (EIA-860A/860B),” June 2, https://www.eia.gov/electricity/data/eia860.
Sectoral and Geographic Trends for Customer-Sited PV
The total installed capacity of customer-sited PV in the United States is split roughly 60/40 between the residential and commercial and industrial (C&I) sectors, but growth in recent years has skewed more heavily toward the residential market. In 2021, 75 percent of annual capacity additions were installed by residential customers (see Figure 3-5). In general, C&I customers tend to be more price-sensitive, and the C&I market has seen more volatility as state-level policies and incentives ebb and flow, resulting in relatively flat growth since 2016. These numbers do not include the relatively small but burgeoning community solar sector (see Box 3-1).
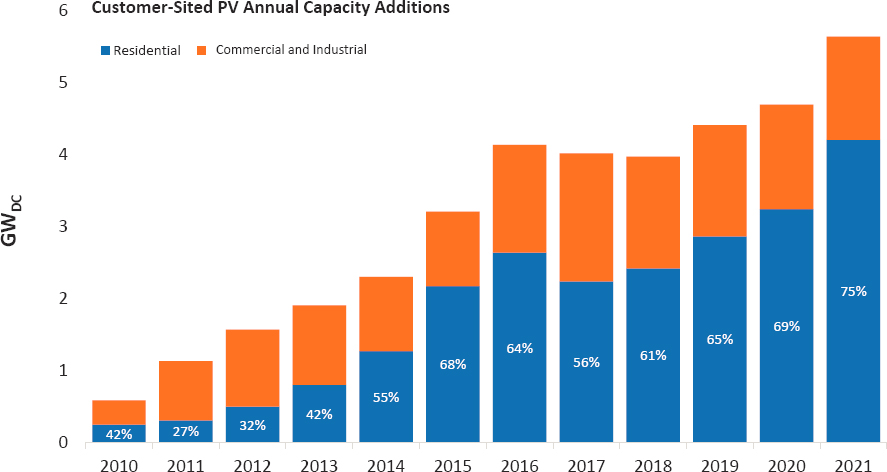
NOTES: Data for the commercial and industrial sector exclude community solar. Note that Wood Mackenzie and Solar Energy Industries Association reports capacity in DC units; for that reason, and others, the values cannot be compared directly against the EIA-based totals in previous figures.
SOURCE: Data from Wood Mackenzie and Solar Energy Industries Association, 2022a, “US Solar Market Insight: 2021 Year-in-Review,” https://www.woodmac.com/reports/power-markets-us-solar-market-insight-2021-year-in-review-150013339.
At the national level, BTM DG market penetration levels are still in the low single-digits. In the residential sector, roughly 3.2 million customer-sited PV systems were installed by the end of 2021, representing 2.3 percent of all U.S. residential electricity customers and 4.6 percent of all owner-occupied, detached single-family homes, which constitute most adopters.28 Within the C&I sector, roughly 120,000 systems were installed through 2021, equivalent to 0.6 percent of all U.S. C&I electricity customers. C&I PV adopters come
___________________
28Barbose, G.L., S. Forrester, E. O’Shaughnessy, and N.R. Darghouth. 2021b. Residential Solar-Adopter Income and Demographic Trends: 2021 Update. Berkeley, CA: Lawrence Berkeley National Laboratory. https://emp.lbl.gov/publications/residential-solar-adopter-income-and; Wood Mackenzie and Solar Energy Industries Association. 2022a. “US Solar Market Insight: 2021 Year-in-Review.” https://www.woodmac.com/reports/power-markets-us-solar-market-insight-2021-year-in-review-150013339. The 4.6 percent number is derived by dividing 3.2 million by the total number of owner-occupied detached single-family homes, which is from the 2021 American Community Survey Table B25032, available here: https://data.census.gov/table?t=Owner/Renter+(Tenure)&d=ACS+1-Year+Estimates+Detailed+Tables&tid=ACSDT1Y2021.B25032.
from all industry sectors, albeit with some concentration among schools, warehouses, and big-box retail stores.29
Penetration levels vary dramatically across states and regions, reflecting policy conditions, electricity prices, and solar insolation levels. For the residential market, participation levels are highest in Hawaii, where 20 percent of residential electricity customers had installed PV by the end of 2021, followed by California at 10 percent (see Figure 3-6 for percentages of participation in other states). Other high-penetration states are primarily in the desert southwest, with abundant sunshine, and the northeast, where electricity prices are relatively high and additional financial incentives are available (often in the form of renewable energy certificates used for RPS compliance).30 Two states (Arizona and Nevada) had reached the 5 to 10 percent penetration threshold, while 7 other states—in either the southwest or northeast—and the District of Columbia surpassed 3 percent penetration. Ten more states spanning a somewhat more diverse geography, including several states in the northwest and southeast, had penetration rates of 1–3 percent. The remaining 29 states all had PV penetration levels less than 1 percent of residential customers as of year-end 2021.
Cost Trends for Distributed PV and Storage
The impacts of net metering on DG adoption, and their implications for future net metering policies, must be viewed in the context of a broad set of market conditions and deployment drivers for DG. Chief among those drivers in the committee’s judgment has been declining costs, particularly for rooftop PV, and to a lesser extent for distributed storage as well.
As shown in Figure 3-7, residential solar PV system costs have fallen by 69 percent ($8.50 per Watt) over the past two decades, while large commercial system costs fell by 77
___________________
29Hoen, B., J. Rand, and S. Elmallah. 2019. Commercial PV Property Characterization: An Analysis of Solar Deployment Trends in Commercial Real Estate. Berkeley, CA: Lawrence Berkeley National Laboratory. https://emp.lbl.gov/publications/commercial-pv-property. Wood Mackenzie and Solar Energy Industries Association. 2022a. “US Solar Market Insight: 2021 Year-in-Review.” The 0.6 percent number is derived by dividing 120,000 by the total number of U.S. C&I electricity customers (from EIA Electric Power Annual, Table 2.1).
30Barbose, G. 2021. U.S. Renewables Portfolio Standards 2021 Status Update: Early Release. Berkeley, CA: Lawrence Berkeley National Laboratory. https://emp.lbl.gov/publications/us-renewablesportfolio-standards-3.
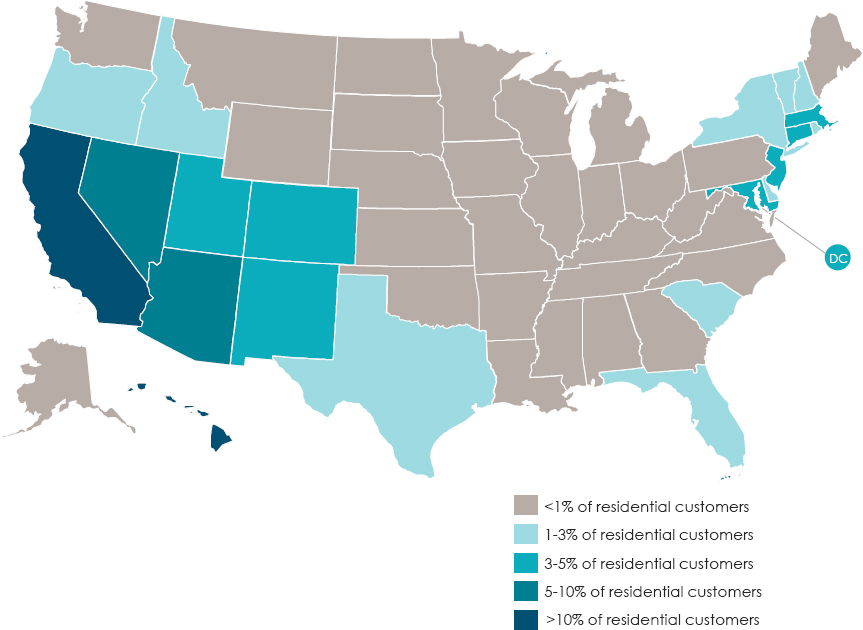
NOTES: Penetration refers to the percentage of residential customers with distributed PV systems. As noted earlier, 92 percent of distributed PV is net-metered, and 97 percent of all net metered capacity is PV; thus, the chart effectively shows the penetration of all net-metered DG by residential customers.
SOURCES: Values are calculated from statewide residential PV system counts (Wood Mackenzie 2022a) and from the total number of residential electricity customers in each state (EIA 2022c).
percent.31 That drop in system level costs has been driven to a significant degree by the cost of PV modules, which fell by $4.20/W over the same period while inverter prices fell by $0.90/W over the past two decades, also contributing to total PV system cost reductions.32 The remainder of system-level cost declines are associated primarily with the various business process or “soft” costs, including installation labor, customer acquisition
___________________
31Barbose, G., N. Darghouth, E. O’Shaughnessy, and S. Forrester. 2022. Tracking the Sun: Pricing and Design Trends for Distributed Photovoltaic Systems in the United States. Berkeley, CA: Lawrence Berkeley National Laboratory. https://emp.lbl.gov/tracking-the-sun.
32 Most of the decline in module costs occurred during the period from 2008–2012 when global annual PV module manufacturing capacity expanded more than sevenfold, from roughly 8 to 60 GW. (Bloomberg New Energy Finance [BNEF], global PV module manufacturing capacity.)
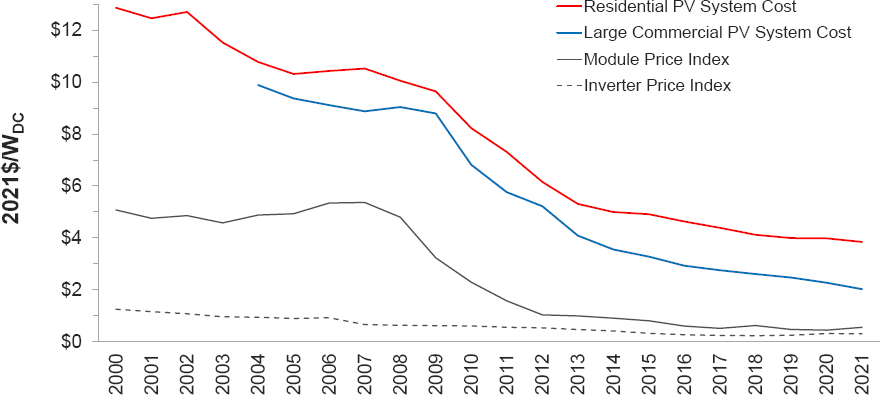
NOTE: Non-residential PV system cost data are based on customer-sited systems larger than 100 kW; historical data for those systems are available only as far back as 2004.
SOURCE: Data from G. Barbose, N. Darghouth, E. O’Shaughnessy, and S. Forrester, 2022, Tracking the Sun: Pricing and Design Trends for Distributed Photovoltaic Systems in the United States, Berkeley, CA: Lawrence Berkeley National Laboratory, https://emp.lbl.gov/tracking-the-sun.
costs, permitting and inspection costs, as well as installer profit. Those soft costs now constitute most of the total cost of customer-sited PV systems.33
Distributed storage costs have also fallen, albeit over a much shorter and more recent timeframe than for rooftop PV. As shown in Figure 3-8, residential storage costs decreased by 23 percent ($0.80/W) since 2014, while commercial storage costs decreased by 37 percent ($0.90/W).34 Much of the decline in the total cost of energy storage systems is due to the drop in the cost of lithium-ion battery packs, as global production has ramped up.
TRENDS AND TENSIONS IN NET METERING AND ASSOCIATED SUPPORTING POLICIES
Discussions about net metering and broader policies addressing DG and other DER are occurring within a multifaceted policy environment, where many pressing, interrelated
___________________
33 Soft costs are the non-hardware costs associated with energy supply systems. They include, for example: “design, siting, permitting, installation, interconnection, and financing. They also include the sales, general, and administrative expenses solar companies incur for customer acquisition, workforce training and certification, supply chain and inventory control, and operating overhead.” See EERE. 2022b. “Soft Costs.” https://www.energy.gov/eere/solar/soft-costs.
34 Data are sourced from Wood Mackenzie. 2022. “U.S. Energy Storage Market Monitor.”
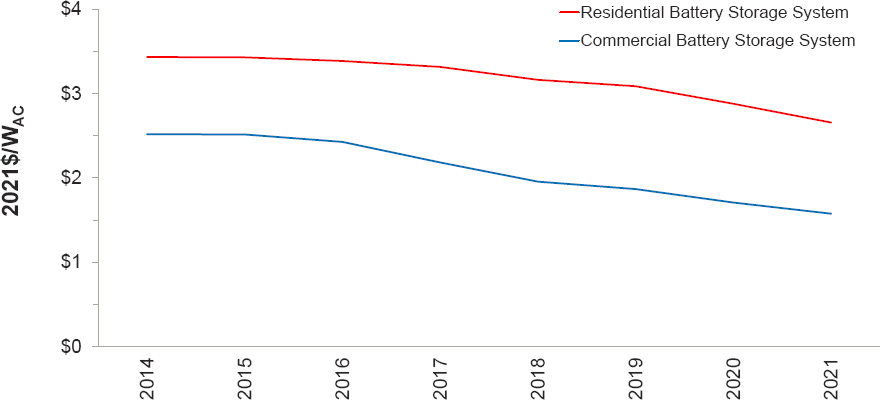
NOTE: Costs are based on 2-hour duration lithium-ion batteries.
SOURCE: Data from Wood Mackenzie, 2022, “U.S. Energy Storage Market Monitor.”
challenges are facing the public utility industry, its regulators, policymakers, and customers. The primary challenges and trends include:
- The need for major, rapid changes in energy supplies and demands to meet formal climate-change commitments made by government agencies, utilities, and many utility customers.35
- The need for major investments in the transmission and distribution system to replace aging assets, help achieve new policy goals (e.g., interconnecting DG and remote grid scale renewables), and meet changing customer expectations and demands, including those related to the adoption of BTM DER.36
- The need to address grid operational and stability challenges arising as a result of the increasing deployment of variable-output sources of generation, such as wind and solar, both at the distribution and transmission levels.37
___________________
35 See Fox-Penner, P. 2020. Power After Carbon: Building a Clean, Resilient Grid. Cambridge, MA: Harvard University Press. https://www.hup.harvard.edu/catalog.php?isbn=9780674241077, pp. 3, 7–8, 22–27 and Chapter 6; and NRRI. 2022b. “State Clean Energy Policy Tracker.” https://www.naruc.org/nrri/nrri-activities/clean-energy-tracker.
36 The Department of Energy is presently engaged in a National Transmission Planning Study. See DOE Grid Deployment Office. 2022. “National Transmission Planning Study.” https://www.energy.gov/gdo/national-transmission-planning-study.
37Impram, S., S.V. Nese, and B. Oral. 2020. “Challenges of Renewable Energy Penetration on Power System Flexibility: A Survey.” Energy Strategy Reviews 31:100539.
- The opportunity to address these grid challenges through new and emerging technologies for infrastructure modernization and integration of distributed clean energy resources and energy storage.38
- Changing utility rate designs that better reflect underlying costs and influence consumer behaviors, including decisions to adopt DG and other DER.39
- Increasing explicitly stated directives from governors and legislators for state energy regulatory commissions to address equity, environmental justice, and closely related values (see Chapter 5 for further discussion).
- Changing drivers of electricity consumption—energy efficiency reducing usage on the one hand and electrification of transportation, buildings, and industry increasing it on the other.
The broader context also includes growing interest in utility business models and regulatory innovation, particularly as new and emerging technologies are deployed (see Chapter 7). This context also includes increasing challenges associated with the siting and community acceptance of all energy-related infrastructure.40 While all of these are important issues, thorough treatment of them is beyond the scope of this report. What is most important for readers to understand is that existing net metering policies interact with these challenges and trends, and those interactions simultaneously help shape the environment in which policymakers are considering net metering and its variants and alternatives.
Some publicly available data can shed light on some of these drivers, including information collected at the utility-specific and jurisdiction levels by the Department of Energy’s Energy Information Administration41 and by North Carolina State University’s NC Clean
___________________
38DOE Grid Modernization Initiative. 2020. “Grid Modernization Updated GMI Strategy 2020.” https://www.energy.gov/sites/prod/files/2021/02/f82/GMI_Strategy_FINAL%20as%20of%201.20.21.pdf; and EIA. 2021b. “Solar Generation Was 3% of U.S. Electricity in 2020, But We Project It Will Be 20% by 2050.” https://www.eia.gov/todayinenergy/detail.php?id=50357.
39 The Behavior, Energy & Climate Change Conference (BECC) focuses on energy consumers and rate designs intended to change usage patterns. See BECC (Behavior, Energy and Climate Change). 2022. “About BECC.” https://beccconference.org/about-becc. For performance-based regulation, see Littell, D., C. Kadoch, P. Baker, et al. 2017. Next-Generation Performance-Based Regulation: Emphasizing Utility Performance to Unleash Power Sector Innovation. NREL/TP-6A50-68512. Golden, CO: National Renewable Energy Laboratory; Sappington, D.E.M., and D.L. Weisman. 2021. “Designing Performance-Based Regulation to Enhance Industry Performance and Consumer Welfare.” Electricity Journal 34(2):106902; Weisman, D. 2018. “A Report on the Theory and Practice of Performance-Based Regulation.” SSRN. https://ssrn.com/abstract=3765691.
40Wilkinson, F. 2022. “How Copake, New York, Fought and Then Accepted a Solar Farm.” Bloomberg, March 20. https://www.bloomberg.com/opinion/articles/2022-03-20/how-copake-new-york-fought-and-then-accepted-a-solar-farm.
41EIA. 2022d. “Electricity: Form EIA-861M (formerly EIA-826) Detailed Data.” https://www.eia.gov/electricity/data/eia861m.
Energy Technology Center.42 Additional information should be collected and made available to the public in order for researchers, analysts, utilities, policymakers, and others to more fully understand the drivers and outcomes of BTM DG and storage deployment, net metering and net metering variants adoption, electricity production, and interactions with the utility grid.43
INTERNATIONAL EXPERIENCES WITH DG-PV COMPENSATION POLICIES
Other countries, notably many countries in Europe, and a few in Asia, as well as Australia and Canada, used a different primary renewable and solar energy support policy, known as a feed-in-tariff (FIT; described as a net metering variant in Chapter 1).44 With this approach, regulators and administrators establish long-term contract prices for energy from qualifying energy sources that are intended to provide reasonably attractive rates of return on investment. The FIT price is set high enough to attract investing, and then the quantity adjusts in response to market interest. The general objective for a FIT is to “provide a stable investment framework, thus lowering the investment costs and the costs for the final consumers.”45
By the end of 2008, 50 countries had implemented feed-in tariffs, either nationwide or in at least some specific jurisdictions, and by 2010 FITs had spread to 63
___________________
42 The NC Clean Energy Technology Center Hosts the Database of State Incentives for Renewables & Efficiency® (DSIRE). See NC-CETA. 2022a. “Database of State Incentives for Renewables & Efficiency® (DSIRE).” https://www.dsireusa.org.
43 For example, utilities typically do not provide information about (and in some cases may not even have their own visibility into) customers’ exports of power into the local distribution grid. More granular reporting of such information about individual BTM systems’ exports to the grid (e.g., the timing and quantities of exports) would be helpful for understanding the impacts of net metering and DG on utilities and on both participating and non-participating utility customers.
44UNEP (United Nations Environment Programme). 2012. “Feed-In Tariffs as a Policy Instrument for Promoting Renewable Energies and Green Economies in Developing Countries.” https://unfccc.int/files/documentation/submissions_from_parties/adp/application/pdf/unep_us___ws2.pdf, UNEP states. “The most prevalent national renewable energy policy in the world is the feed-in tariff (FIT). As of early 2011, 50 countries had some form of FIT in place, with more than half of these being in developing countries” (p. vi). See also Organisation for Economic Co-operation and Development (OECD). 2022. “Renewable Energy Feed-In Tariffs.” https://stats.oecd.org/Index.aspx?DataSetCode=RE_FIT.
45Mendonça, M., and D. Jacobs. 2009. “Feed-In Tariffs Go Global: Policy in Practice.” Renewable Energy World. https://www.renewableenergyworld.com/baseload/feed-in-tariffs-go-global-policy-in-practice. See also Glemarec, Y., W. Rickerson, and O. Waissbein. 2012. Transforming On-Grid Renewable Energy Markets. A Review of UNDP-GEF Support for Feed-In Tariffs and Related Price and Market-Access Instruments. Washington, DC: Department of Energy, Office of Scientific and Technical Information. https://www.osti.gov/biblio/22090461, p. 6.
jurisdictions.46 Researchers observed that FITs succeeded in opening up opportunities for solar PV and wind generation in many countries.47
Nevertheless, observers cautioned that FITs require substantial “supervision and control,”48 and that poorly designed and implemented FITs could “backfire” and even “stunt” the industry,49 resulting in “unintended and counterproductive outcomes”50 including potential boom and bust cycles. Experiences in Germany and Spain demonstrated problems with FITs: changes in market conditions in Germany resulted in substantial added costs for utility customers; in Spain, FIT policies were associated with a noteworthy boom and bust cycle.51 It appears that the Spanish FIT was overly generous in compensating solar PV from 2005 through 2008, resulting in internal rates of returns to investors are estimated to have been between 10 to 15 percent, as opposed to the targeted rate of 5 to 9 percent. Then, as shown in Figure 3-9, major revisions to the FIT policy stopped new PV installations entirely in 2009 PV returned to something less than 2007 levels for the next few years.
In order to reduce costs while continuing growth, Germany shifted toward a policy combining FITs with auctions, intending to introduce more competition into markets for renewable energy. Germany first introduced auctions in 2014, and then shifted entirely to an auction-based process beginning in 2016.52
___________________
46Patel, S., and G. Reitenbach. 2010. “The Feed-In Tariff Factor.” Power, September 1. https://www.powermag.com/the-feed-in-tariff-factor; Taylor, M., J. McLaren, K. Cory, T. Davidovich, J. Sterling, and M. Makhyoun. 2015. “Value of Solar: Program Design and Implementation Considerations.”NREL/TP-6A20-62361. Golden, CO: National Renewable Energy Laboratory. https://www.nrel.gov/docs/fy15osti/62361.pdf. See also Zachary, J. 2010. “Feed-In Tariffs Around the World.” Power, September 1. https://www.powermag.com/feed-in-tariffs-around-the-world.
47DeShazo, J.R., and R. Matulka. 2009. “Best Practices for Implementing a Feed‐In Tariff Program.” Los Angeles Business Council and UCLA Luskin Center for Innovation. https://innovation.luskin.ucla.edu/wp-content/uploads/2019/03/Best_Practices_for_Implementing_a_Feed-in_Tariff_Program.pdf.
48Barnea, G., C. Hagemann, and S. Wurster. 2022. “Policy Instruments Matter: Support Schemes for Renewable Energy Capacity in Worldwide Comparison.” Energy Policy 168.
49Aflaki, S., and A. Masini. 2020. “Optimizing Feed-In Tariffs to Boost Renewable Energy Production.” Jouy en Josas, Paris: HEC Paris. https://www.hec.edu/en/knowledge/articles/optimizing-feed-tariffs-boost-renewable-energy-production.
50DeShazo, J.R., and R. Matulka. 2009. “Best Practices for Implementing a Feed‐In Tariff Program.” Los Angeles Business Council and UCLA Luskin Center for Innovation. https://innovation.luskin.ucla.edu/wp-content/uploads/2019/03/Best_Practices_for_Implementing_a_Feed-in_Tariff_Program.pdf.
51del Rio, P., and P. Mir-Artiques. 2014. A Cautionary Tale: Spain’s Solar PV Investment Bubble. Winnipeg, Manitoba, Canada: International Institute for Sustainable Development. https://www.iisd.org/gsi/sites/default/files/rens_ct_spain.pdf.
52 Recent Facts About Photovoltaics in Germany, Harry Wirth, Fraunhofer ISE, download from https://www.ise.fraunhofer.de/en/publications/studies/recent-facts-about-pv-in-germany.html, version of May 15, 2021. For further information see https://www.iea.org/reports/germany-2020.
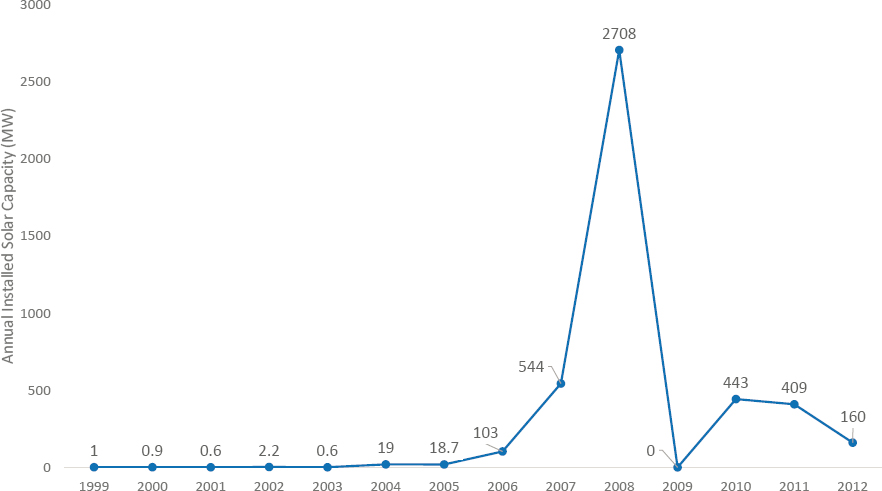
SOURCE: P. del Rio and P. Mir-Artiques, 2014, A Cautionary Tale: Spain’s Solar PV Investment Bubble, Winnipeg, Manitoba, Canada: International Institute for Sustainable Development, https://www.iisd.org/gsi/sites/default/files/rens_ct_spain.pdf. CC BY-NC-SA 4.0.
One aspect of FITs that received much positive attention was their potential for engaging community groups and small cooperatives that formed to invest in distributed energy resources, including wind, solar, and bioenergy. These projects resulted in combined benefits, including “boosting economic growth, strengthening market institutions, reducing poverty, creating new jobs, improving the local environment and health conditions, and mitigating global environmental risks.”53 Large numbers of such groups of small investors formed in part because the FIT compensation rates were generous, but
___________________
53Glemarec, Y., W. Rickerson, and O. Waissbein. 2012. Transforming On-Grid Renewable Energy Markets: A Review of UNDP-GEF Support for Feed-In Tariffs and Related Price and Market-Access Instruments. Washington, DC: Office of Scientific and Technical Information, Department of Energy. https://www.osti.gov/biblio/22090461. See also DeShazo, J.R., and R. Matulka. 2009. “Best Practices for Implementing a Feed-In Tariff Program.” Los Angeles Business Council and UCLA Luskin Center for Innovation. https://innovation.luskin.ucla.edu/wp-content/uploads/2019/03/Best_Practices_for_Implementing_a_Feed-in_Tariff_Program.pdf.
another important factor was the publicly announced prices that gave people time to design, site, and develop projects.54
FINDINGS
This chapter has focused on trends affecting the context for the committee’s examination of net metering: trends in the adoption of net metering as a billing mechanism to compensate BTM DG; the deployment of BTM DG in conjunction with net metering; and the cost of DG, most notably rooftop solar. The chapter also discusses tensions that have arisen as a result of these trends and states’ responses in examining and adopting net metering variants. The committee makes the following findings:
Finding 3-1: By the end of the 1990s, net metering programs were offered to some or all electricity customers in 21 states. As of 2021, 40 states, the District of Columbia, and all 4 major U.S. territories had in place traditional net metering or successor tariffs.
Finding 3-2: Among various types of DG technologies, solar PV has been the dominant form of BTM technology adopted in conjunction with net metering, and almost all customer-sited PV installed to date has occurred where customers take service under net metering.
Finding 3-3: Net metering—or some form of compensation to a customer for its exports of electricity to the grid—has been broadly viewed as an enabler of the adoption of rooftop solar. Net metering is one factor, albeit sometimes a major factor, among a much larger set of considerations that have affected customers’ interest in BTM technologies, including solar and storage.
Finding 3-4: Electricity prices, technology costs, public policies, DER deployment levels, industry structure, and other conditions in retail and wholesale electricity systems vary considerably across the jurisdictions where net metering has been adopted and have affected decisions in some places to transition net metering into variant approaches.
___________________
54Glemarec, Y., W. Rickerson, and O. Waissbein. 2012. Transforming On-Grid Renewable Energy Markets: A Review of UNDP-GEF Support for Feed-In Tariffs and Related Price and Market-Access Instruments. Washington, DC: Office of Scientific and Technical Information, Department of Energy. https://www.osti.gov/biblio/22090461, p. 13. See also DeShazo, J.R., and R. Matulka. 2009. “Best Practices for Implementing a Feed-In Tariff Program.” Los Angeles Business Council and UCLA Luskin Center for Innovation. https://innovation.luskin.ucla.edu/wp-content/uploads/2019/03/Best_Practices_for_Implementing_a_Feed-in_Tariff_Program.pdf, pp. 3–5, 29–32.
Finding 3-5: Considerable uncertainty exists with respect to a number of issues relating to the future of net metering and with little standardization of policies across jurisdictions.
Finding 3-6: Policymakers in various jurisdictions are considering how and the extent to which existing and future wholesale and retail market conditions, including the costs and potential benefits associated with solar PV and other DER, should affect decisions about net metering, DG, and DER policies. It remains to be seen whether and how differences in market acceptance and growth in markets for DG will interact with and guide policies and regulatory changes.
Finding 3-7: Information about how BTM technologies that export power to the grid perform and interact with the grid is important for improving understanding of these interactions—both for local system operators but also for researchers, analysts, and others. Such information may be known to utilities, customers, and/or providers of BTM systems (e.g., the counterparty to a rooftop solar power purchase agreement) and is typically not available to others, often due to privacy, confidentiality, and/or technical reasons or even in a granular way to the customers with BTM technologies installed on their premises.
RECOMMENDATIONS
Recommendation 3-1: Utility regulators and decision makers of publicly owned utilities should work with stakeholders to explore and implement solutions to technical, legal, proprietary, or privacy concerns about the collection and release of information about the performance of behind-the-meter technologies and their interactions with the grid.
Recommendation 3-2: Data about participation in net metering and alternative and supplemental DG policies should be collected and reported so that policymakers can monitor how policies are interacting with energy market conditions in wholesale and retail, regulated and unregulated energy markets.


