
4
Economic Considerations Related to Net Metering
INTRODUCTION
The economics of net metering and its variants depend on the vantage point of different entities involved in the electricity system, which consist principally of:
- The distributed generation (DG) customer served on a net-metering tariff or other DG rates
- Other electricity customers (non-participants)
- The electricity system and utility that serves all those customers
- Society as a whole, including environmental and other effects that occur outside the boundaries of the electricity system
This chapter discusses the economic implications of net metering from these varied perspectives. These implications are based first and foremost on the benefits and costs of DG. From the perspective of the DG customer, the economic implications depend on how the level of compensation through net metering, along with other benefits, compares to the costs of DG ownership. From the perspective of the utility and nonparticipating customers, the economic implications depend on how the DG customer’s bill savings under the net metering tariff compare to the costs that the utility avoids by virtue of the DG systems. From the perspective of society as a whole, the economic implications further depend on environmental costs and other externalities of electricity production, which may be reduced by non-emitting DG resources. In addition to aggregate benefits and costs of net metering, there are distributional effects in terms of who, specifically, receives the benefits and who bears the costs. This chapter addresses those distributional effects broadly between DG customers and non-DG customers overall, while the next chapter, about equity considerations, addresses distributional effects among the distinct socio-economic groups that make up the utility’s customer base.
When evaluating these economic impacts, one must be careful to distinguish between the impacts of net metering and the impacts of DG. Net metering is a billing mechanism for customers with DG. Its function is to establish a customer’s billing determinants (e.g., the quantity of kilowatt-hours) and the rate at which they are billed each month. As such, net metering is intended to provide a direct economic value to participating customers
by compensating them for their DG production, based on the underlying rate structure. It also has distributional effects in terms of how the utility’s revenues are recovered across its customer base. However, net metering has no intrinsic benefits or costs from a societal perspective.1 Rather, those societal benefits and costs are properties of the DG adoption induced by net metering.
Insofar as net metering incentivizes customers to adopt clean DG, it can be evaluated as a clean energy policy support mechanism, and measured against some counterfactual—that is, what would have happened in the absence of net metering customers adopting those DG resources? Within this framework, there may be costs to net metering insofar as it induces either more or less DG than would be optimal, from a societal or power-system perspective. The economic merits of net metering can also be compared to other forms of clean energy policy support, which might deliver the same level of benefit at a lower or higher public cost or with more or less equitable distribution of those costs.
Specific topics examined in this chapter include:
- The economic implications of net metering and its variants from the perspective of DG customers
- The societal perspective, in which net metering and its variants can be evaluated in terms of economic efficiency
- The non-participant and utility perspective, where the effects of net metering and its variants on non-participant impacts are evaluated principally in terms of changes in retail rates
- A discussion of the many benefits and costs of DG that are relevant to assessing the economic efficiency and rate impacts of net metering and its variants
- Findings and recommendations
DG CUSTOMER PERSPECTIVE
Customer adoption of DG technologies is a complex behavior, driven by a combination of economic and non-economic factors. Utility bill savings are one key consideration in that adoption decision, though other factors may also play a central role, including the ability to hedge against future increases in electricity prices, incentives (e.g., the federal investment tax credit and renewable energy certificates), customer perceptions of the
___________________
1 One minor exception would be incremental metering and billing costs associated with net metering.
utility, environmental views, status value, social influences,2 and potential reliability and resilience benefits for DG resources that can provide backup power during grid interruptions, among other factors.3 For example, customers who identify as environmentalists may be willing to invest in solar in part because they value the opportunity to behave consistently with their values and protect the environment. Customers may also be willing to pay for solar given its ability to signal certain characteristics about themselves (e.g., environmentalism), a phenomenon known as conspicuous conservation.4 The impact of DG compensation rates on adoption behavior thus depends in part on the strength and relevance of those myriad other factors. Other attributes of the DG compensation structure, such as its simplicity or stability, may also affect its influence on customer adoption behavior.
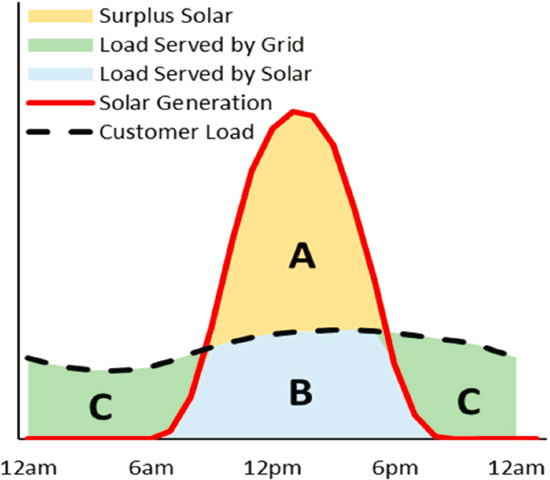
Compensation for behind-the-meter (BTM) DG production typically includes two components: electricity bill savings from reducing the quantity of electricity consumed from the grid (area B in Figure 4-1) plus any bill credits provided for surplus DG production exported to the grid (area A), which are applied against the utility billing charges for the customer’s residual usage (Area C), and may be carried over to the following billing period, in whole or in part, depending on the provisions of the net metering or DG compensation tariff. A residential solar DG system sized to generate an amount equal to the host customer’s annual electricity consumption, and without battery storage, will typically export 60–70 percent of generation over the course of the year.5 Thus, the rules and pricing applied to exported generation can have a significant impact on the
___________________
2Bollinger and Gillingham (2012) find that for each additional residential rooftop installation in a California zip code, the likelihood of another installation increases by 0.78 percent. Similar effects have been observed in the United Kingdom (Richter 2014). This effect tends to be larger with greater public visibility and lower physical proximity (Wolske et al. 2020). Bollinger, B., and K. Gillingham. 2012. “Peer Effects in the Diffusion of Solar Photovoltaic Panels.” Marketing Science 31(6):900–912; Richter, L. 2014. “Social Effects in the Diffusion of Solar Photovoltaic Technology in the UK.” EPRG Working Paper 1332. University of Cambridge. https://www.eprg.group.cam.ac.uk/wp-content/uploads/2013/12/1332-Final.pdf; Wolske, K.S., K.T. Gillingham, and P.W. Schultz. 2020. “Peer Influence on Household Energy Behaviours.” Nature Energy 5:202–212.
3Moezzi, M., A. Ingle, L. Lutzenhiser, and B. Sigrin. 2017. A Non-Modeling Exploration of Residential Solar Photovoltaic (PV) Adoption and Non-Adoption. Golden, CO: National Renewable Energy Laboratory. https://www.nrel.gov/docs/fy17osti/67727.pdf.
4Griskevicius, V., J.M. Tybur, and B. Van den Bergh. 2010. “Going Green to Be Seen: Status, Reputation, and Conspicuous Conservation.” Journal of Personality and Social Psychology 98:392–404. The same phenomenon has been observed with hybrid car adoption: Prius buyers are willing to pay $430–$4,200 more than equivalent hybrid models that lack the distinctive body styling of the Prius for status signaling; see Sexton, S.E., and A.L. Sexton. 2014. “Conspicuous Conservation: The Prius Halo and Willingness to Pay for Environmental Bona Fides.” Journal of Environmental Economics and Management 67:303–317.
5Forrester, S., G. Barbose, and C. Miller. 2022. “Private vs. Public Value of U.S. Residential Battery Storage Operated for Solar Self-Consumption.” iScience 25(8):104714.
SOURCE: S. Forrester, G. Barbose, and C. Miller, 2022, “Private vs. Public Value of U.S. Residential Battery Storage Operated for Solar Self-Consumption,”iScience 25(8):104714, https://doi.org/10.1016/j.isci.2022.104714. BY-NC-ND 4.0.
customer-economics of investing in solar DG and by extension, on the level of adoption induced and the resulting benefits and costs for the broader electric systems.
Traditional net metering credits all DG production (areas A and B in Figure 4-1) based on the volumetric energy rate of the customer’s retail electricity tariff. The compensation provided through net metering is thus inherently linked to the structure and pricing of the customer’s underlying retail rates. Electricity tariffs that charge customers primarily through volumetric energy-based charges, with little or no fixed customer charges or demand charges, provide higher levels of compensation for DG production, all else being equal.6 Electricity tariffs with time-varying (e.g., time-of-use or hourly) energy rates may provide higher or lower levels of DG compensation, depending on how well the timing of DG production coincides with peak prices.
Customers considering DG have three broad options: (1) continue as a full-service customer of the electric utility without DG; (2) become a partial-service customer,
___________________
6 Electricity tariffs that charge customers in volumetric rates for their use of the distribution and transmission system may also enable DG customers to avoid paying for their use of or share of support for this infrastructure, which provides broad “resilience” service for all customers as long as they are connected to the grid.
self-generating a portion of their own needs and relying on the utility as necessary for the balance of their needs; and (3) fully disconnect from the grid, self-supplying the entirety of their electricity needs with DG and potentially battery storage or fossil backup generation, or both. In the case of BTM solar generation, the customer-economics of these three options has evolved over time, as a result of changes in both technology costs as well as net metering rules and rate structures. This evolution and possible futures are illustrated by the cases shown in Figure 4-2, which, it should be noted, present points along a continuum and not a menu of discrete choices.
- Case 1: Under traditional net metering structures, the customer-economics of becoming a partial requirements customer with solar DG depends on how the levelized cost of solar DG (net of tax credits and other incentives) compares to the volumetric portion of the customer’s electricity rate, given that all DG production is compensated at that rate. Historically, solar DG was more expensive than volumetric rates in most regions, and so the least-cost option for most customers was to remain as full-service utility customers.
- Case 2a: As solar DG costs have declined, partial requirements service under net-metering tariffs has increasingly become economic, particularly in regions with high solar insolation, high electricity rates that consist primarily of volumetric charges or other attractive state- or utility-level incentives. Those states with the highest penetration levels (as shown previously in Figure 3-6) are indicative of where the customer economics for solar DG has been most favorable.
- Case 2b: Utilities and regulators in several states have considered, and in some cases implemented, modifications to the compensation structure for solar DG. Two modifications that have been frequently considered are net billing structures and time-varying rates. Both of these methods are intended to incentivize customers to shift the timing of their solar DG production—in the case of net billing rates, to those times when it can be used to directly serve onsite load, and in the case of time-varying rates, to those times when it has the greatest value to the electricity system. Under these types of compensation structures, partial requirement service may be most economical for customers that install battery storage along with solar DG, to store solar production to offset consumption at those times of day that maximize the customer’s utility bill savings.7
- Case 3: Utilities and regulators in some jurisdictions have also considered modifications to DG compensation structures consisting of either higher fixed charges
___________________
7 Under net billing, customers will use batteries to maximize self-supply by storing excess solar production when it exceeds consumption, provided that the compensation for export is lower than the retail price for electricity. Under time-varying rates, customers will charge their batteries from solar DG (or potentially from the grid, if allowed) when retail prices are low and discharge their batteries when retail prices are high.
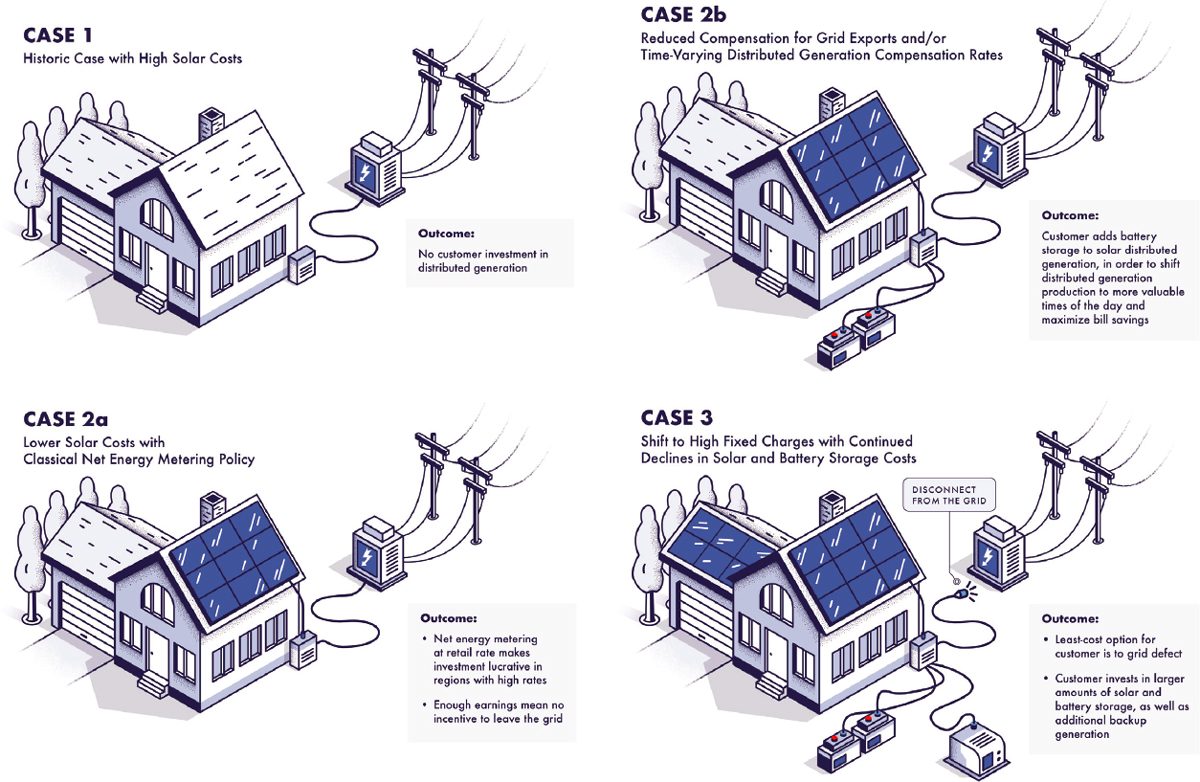
- or grid-access fees for solar DG customers that they cannot avoid. As a result, where those billing components are high enough, some customers may find it most economical to disconnect from the grid and provide their electricity service needs solely through some combination of solar DG, batteries (or electric vehicles with bidirectional charging), and backup generators. In disconnecting from the grid, the customer’s resources would also be unavailable to provide services to the grid. Box 4-1 discusses the customer decision-making process to disconnect from the grid in more detail.
THE SOCIETAL PERSPECTIVE: ECONOMICALLY EFFICIENT PRICING
As discussed in Chapter 7, utilities and regulators balance various competing objectives when developing retail electricity rates. One of those key objectives is to send price signals to customers so that they can make economically efficient decisions about their consumption. According to standard economics theory, economic efficiency dictates that prices should be set equal to social marginal cost:
- Social Marginal Cost (SMC) is the incremental cost to the company supplying an additional unit of the good or service plus the costs of any externalities, such as pollution, that result from that incremental supply. The concept of externality costs is described further later in this chapter.
If price reflects the SMC, then consumers deciding whether to buy the product are accurately comparing the value they would receive from the product with society’s cost of providing an additional unit of it. In contrast, prices below the SMC will lead consumers to purchase some quantity of the good that they value at less than society’s cost of supplying them, whereas prices above SMC will lead consumers to forgo consumption when the value they would receive is greater than society’s cost of supply. Both cases result in reduced economic value.8
This concept of SMC can be differentiated from the private marginal cost incurred by the supplier of the good or service:
- Private Marginal Cost (PMC) is the incremental cost to the company supplying an additional unit of the good or service, excluding costs of any externalities.
___________________
8 In economic textbook terms, this is referred to as “deadweight loss.”
In general, SMC is greater than PMC. Environmental damage costs can be internalized through regulatory mechanisms, such as emission control requirements or cap-and-trade programs, at least partially closing the gap between SMC and PMC. However, to the extent externalities remain, pricing at the PMC will tend to induce an economically inefficient over-consumption of the good or service from a societal perspective.
Within the context of electricity pricing, economic efficiency dictates that volumetric energy prices faced by consumers should reflect the SMC, that is, the incremental costs of producing and delivering electricity to the point of use, including environmental externalities.9 These marginal costs differ between the short and long-run, as certain types of costs that are fixed in the short run may be variable over longer timeframes. In practice, electricity prices usually do not accurately reflect this SMC. This can occur for several reasons, which tend to work in opposite directions. First, under cost-of-service ratemaking, electricity prices are set to recover only the costs incurred directly by the utility in producing and delivering electricity, and therefore exclude any externalities. At the same time, electricity rates, particularly for residential customers, often recover both fixed and variable costs through volumetric energy charges.10 Those prices may therefore be greater than the utility’s PMC, and depending on the size of the externalities, potentially greater than the SMC as well. The combination of these effects differs across the United States (e.g., environmental externalities in regions that rely heavily on coal-fired electricity generation are different than in regions that rely predominantly on low- or zero-carbon electricity). As a result, the marginal electricity prices faced by residential customers may either be higher or lower than the SMC of producing and delivering electricity.
The implication of the above discussion for net metering, which compensates customers for DG production based on the volumetric energy price, is that it may either overcompensate or under-compensate DG, depending on whether prices are above or below SMC. That misalignment, in turn, can lead to either an over- or under-investment of DG resources on the part of customers, from a societal perspective.
___________________
9 To be sure, there are a variety of limitations to and constraints on regulators’ ability to price electricity at SMC. First, externality costs must be estimated, and those estimates are often uncertain and may evolve over time, for reasons discussed later in this chapter, in the section titled “Environmental and Other Externalities.” Second, regulators have a variety of objectives in setting electricity rates, including simplicity and predictability, which must be balanced against the goal of economic efficiency. Those tradeoffs are discussed further in Chapter 7. Third, pricing electricity at the SMC will typically result in either an under- or over-recovery of utility costs, depending on how SMC compares to utility’s average cost of service. Other revenue recovery or crediting mechanisms are therefore needed to ensure that the utility is able to recover its costs.
10 This has been done traditionally for many policy reasons including, but not limited to, simplicity of rate design, encouraging conservation, and sometimes in an effort to avoid inequitable outcomes such as imposing high fixed charges on lower-income customers.
In regulatory settings involving net metering and compensation levels for DG, the concept of SMC is sometimes discussed instead in terms of “avoided costs,” that is, the net costs avoided by each unit of DG production. These cost impacts are discussed later in this chapter, along with key considerations in how they can be quantified for the purpose of evaluating and designing DG compensation rates. The key question, from the perspective of the economic efficiency of net metering, is whether the volumetric energy component of the customer’s retail electricity tariff is greater or less than the total of those avoided costs, including any externalities.
As described in Chapter 1, a variety of options exist for utilities and regulators to better align DG compensation with SMC/avoided costs, in cases where net metering either over- or under-compensates DG production. Some of those options involve changes to the underlying retail electricity rate structure, which affects compensation for both the portion of DG production exported to the grid as well as the portion self-consumed by the host customer. In cases where volumetric energy prices exceed the SMC (including externalities), higher customer charges or demand charges could help to bring volumetric energy rates into closer alignment with SMC. And in all cases, even where volumetric energy prices closely approximate SMC on an annual average basis, introducing time-varying electricity prices that closely mirror the temporal profile of SMCs will provide more economically efficient compensation for DG of all types and will likely encourage DG production during the times of day when it is most valuable. Time-varying rates have taken on even greater relevance as battery storage has become less expensive, by providing customers with more flexibility in the timing of their consumption and production.
As discussed in Chapter 7, utility ratemaking is guided by a number of principles, which may at times conflict with the goal of setting economically efficient rates. Thus, while utilities and regulators may strive to implement prices that better correspond to SMC, there are often limitations to doing so.11 The two primary variants of net metering—net billing and buy-all or sell-all rates12—offer a means to implement more efficient DG compensation rates without relying solely on changes to underlying retail rate structures. Both variants allow utilities and regulators to specify the price paid for DG production, which can be set directly at the SMC, inclusive of externalities and with the appropriate temporal and spatial differentiation, to capture key variations in marginal costs.
___________________
11 For example, volumetric energy prices based on SMC may lead to an over- or under-recovery of the utility’s cost of service, depending on the level of fixed customer charges imposed.
12 See Figure 1-1.
In the case of buy-all and sell-all rates, which apply to the totality of DG production, setting the tariff for both consumption (buy-all) and production (sell-all) at a time- and locationally varying SMC provides an economically efficient price signal for DG investment and operation. Net billing sets only the rate for exported DG production, and thus the effective compensation rate that a customer considers when making the DG investment decision will be some average of the net billing rate for exports and the volumetric energy rate of the customer’s retail rate. Setting the net billing rate at the SMC will thus bring the effective DG compensation rate closer to, but not equal to, the economically efficient level. The asymmetric pricing structure of net billing, where one price applies to the portion of DG self-consumed by the customer and another price applies to the portion exported to the grid, may incentivize customers to install battery storage for the purpose of capturing the value differential between self-consumption and export prices.13
UTILITY AND NON-PARTICIPANT RATE IMPACTS
Separate from any assessment of its economic efficiency, net metering and other DG compensation mechanisms also have distributional impacts in terms of who receives the associated benefits and who bears the costs. Among the different entities affected, the electric utility is impacted primarily in two ways: (1) first, by the effects of DG resources on the utility’s costs (both positive and negative) and the attendant impacts on its revenue requirements; and (2) second, by any lost revenues associated with retail electricity sales displaced by BTM DG resources. These impacts, in turn, flow to utility shareholders and utility ratepayers in distinct ways. Shareholder impacts are discussed briefly in Chapter 7, while the remainder of this section focuses on the impacts to utility ratepayers—in particular, the set of utility ratepayers not enrolled in net metering or other DG tariffs, often termed “non-participants.”
Non-participant impacts are typically defined in terms of the effect on utility rates: that is, whether and to what extent the DG compensation mechanism leads to an increase or a decrease in electricity rates for non-participants. As a general matter, the rate impacts of any DG compensation mechanism are a function of how the reduction in the utility’s revenue requirements compares to lost revenues. If lost revenues are greater than the reduction in revenue requirements, the utility may need to raise its prices or institute other
___________________
13 Some assert that this form of “regulatory arbitrage” (Green, R., and I. Staffell. 2017. “‘Prosumage’ and the British Electricity Market.” Economics of Energy & Environmental Policy 6(1):33–50) is unlikely to represent an economically efficient application of battery storage (Forrester, S., G. Barbose, and C. Miller. 2022. “Private vs. Public Value of U.S. Residential Battery Storage Operated for Solar Self-Consumption.” iScience 25(8):104714).
charges in order to recover its costs; rates and bills for non-DG customers will therefore rise. Conversely, if the reduction in revenue requirements exceeds lost revenues, then rates and bills for non-participants may decline.
In assessing non-participant rate impacts of the DG compensation mechanism, a key definitional issue is the time horizon of the analysis. In the short run, a utility may have large, fixed costs associated with depreciation and interest expenses of past investments. During this period, DG production may have a relatively small effect on utility revenue requirements, because they are largely based on past investments. As a result, the lost revenue effect outweighs the cost reduction effect.
Over the longer term, BTM DG may defer or avoid future capital expenditures (e.g., related to new generation capacity or transmission and distribution equipment), or in some cases, DG may impose additional costs (e.g., distribution network upgrades needed to integrate distributed resources). However, such effects are highly specific to each situation, as discussed further in the next section. Reductions or deferrals in future capital expenditures will further reduce utility revenue requirements; all else being equal, the non-participant rate impacts will be correspondingly lower and, in some circumstances, could be negative (i.e., non-participants see rate decreases).14
Under net metering, assessing the non-participant rate impacts can be viewed as a comparison between the volumetric energy rate (i.e., the price at which DG production is compensated under net metering) and the utility’s (private) marginal costs during the hours when DG production occurs. The non-participant rate impacts of net metering are thus highly dependent on the customer’s underlying retail rate structure as well as the temporal profile of the utility’s marginal costs. Under the predominant rate structure for residential customers consisting of flat (non-time-varying) volumetric energy charges, with small fixed customer charges and no demand charge, the volumetric energy rate will generally exceed the utility’s marginal costs in most hours.15 Net metering tariffs coupled with this type of rate structure will therefore often lead to some rate increase for
___________________
14Satchwell, A., A. Mills, and G. Barbose. 2015a. “Quantifying the Financial Impacts of Net-Metered PV on Utilities and Ratepayers.” Energy Policy 80(May):133–144.
15 The large, fixed costs of electricity grids are associated with the characteristics of its historically being a natural monopoly. A natural monopoly is a market in which total costs of supplying the commodity are lower if it is supplied completely by one firm, rather than by multiple firms. Typically, a natural monopoly occurs when the costs of new entry are high because of the need for a large, fixed investment, with low incremental costs and limited substitutable goods. As a result of this cost structure, the marginal cost of supplying additional output is below or very low compared to the average cost, which averages in all the fixed costs.
non-participants, though any such analysis requires consideration of the specific timing of DG production and utility marginal costs in those hours.16
Non-participant rate impacts can be mitigated either through changes to the underlying rate structure or by transitioning away from traditional net metering. In general, rate structures with time-varying volumetric energy prices closely coinciding with the temporal profile of the utility’s marginal costs will tend to minimize non-participant rate impacts.17 Setting volumetric energy rates at the utility’s marginal cost generally necessitates the use of fixed customer charges or demand charges in order to ensure utility cost recovery. However, increasing fixed charges can also mute the price signals that encourage customers to pursue energy efficiency and exacerbate equity issues for low-income customers by raising their effective rate (e.g., the less electricity a customer uses the more she pays per kWh).18 Alternatively, non-participant rate impacts also can be mitigated by replacing traditional net metering with either net billing or buy-all and sell-all rates, setting the price for DG production to reflect the utilities’ marginal costs, or by applying additional fees or charges on net-metering customers. As noted previously, in the case of net billing tariffs, customers may install battery storage so that they can use their DG production to meet the onsite loads. In doing so, most DG production will continue to be compensated at the volumetric rate of the customer’s retail electricity tariff, leading to similar non-participant rate impacts as would occur under traditional net metering.
Important to note is that the goals of minimizing non-participant rate impacts and maximizing economic efficiency stand in some degree of conflict with one another. This is because non-participant rate impacts are minimized when DG compensation is based on PMC, while economic efficiency is maximized when DG compensation is based on SMC, which exceeds PMC. Setting DG compensation at the socially optimal level, which reflects externalities, will thus often engender some rate increase for non-participants. This represents one potential point of tension that regulators and utilities must consider in setting electricity rates. (See Chapter 7 for further discussion.)
___________________
16Lawson, A.J. 2019. Net Metering: In Brief. CRS Report R46010. Washington, DC: Congressional Research Service.
17 Overall, the impact of time-varying rates on customers’ bills will depend on their ability to shift the timing of their consumption from higher to lower cost time periods. As discussed in Chapter 5, certain groups of customers, such as low-income customers, may have a limited ability to respond to time-varying rates.
18Pearce, J.M., and P.J. Harris. 2007. “Reducing Greenhouse Gas Emissions by Inducing Energy Conservation and Distributed Generation from Elimination of Electric Utility Customer Charges.” Energy Policy 35:6514–6525.
Finally, an essential consideration when evaluating the non-participant rate impacts of net metering or other DG compensation mechanisms is the absolute magnitude of the impact, which depends critically on the level of DG penetration in any given region. As shown in Chapter 3, net-metered solar penetration at the end of 2021 in most states was below 1 percent of all residential customers, and in all but 4 states was below 5 percent. In regions with low levels of net metering participation, effects on non-participants’ bills will be small, and in some cases de minimis, regardless of how widely DG compensation rates diverge from the utility’s marginal costs. As net metering participation rates climb, however, rate impacts may become more salient.
Figure 4-3 presents a simple illustrative schematic showing how rate impacts depend on the interplay between distributed solar penetration levels (denominated as total distributed solar generation as a percent of total electricity consumption), the DG
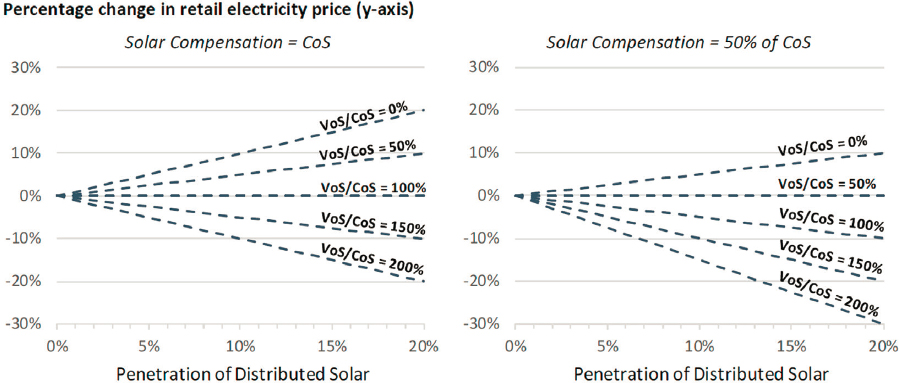
NOTES: CoS refers to the utility’s average cost of service, VoS refers to the avoided utility costs from solar, and Penetration refers to distributed generation as a percentage of total customer load. Solar Compensation is denoted as a fraction of the CoS and represents the average compensation per kWh of solar generation provided to the customer, net of any fees and inclusive of bill savings from directly offsetting load. The dashed lines are meant to capture a wide range in avoided costs (characterized as VoS), expressed as a percentage of CoS, ranging from a VoS of zero to a VoS that is double the utility’s CoS. Most avoided cost/VoS studies fall somewhere in that range (ICF 2018).a
a ICF Consulting. 2018. Review of Recent Cost-Benefit Studies Related to Net Metering and Distributed Solar. Washington, DC: ICF Consulting. https://www.energy.gov/sites/default/files/2020/06/f75/ICF%20NEM%20Meta%20Analysis_Formatted%20FINAL_Revised%208-27-18.pdf.
SOURCE: G. Barbose, 2017, Putting the Potential Rate Impacts of Distributed Solar into Context, Berkeley, CA: Lawrence Berkeley National Laboratory, https://emp.lbl.gov/publications/putting-potential-rate-impacts.
compensation rate (denominated in normalized terms as a percentage of the utility’s average cost of service, or CoS), and the utility’s avoided costs, denoted in Figure 4-3 as the value of solar (VoS) to the utility (and equivalent to the concept of private marginal cost introduced earlier). For example, compensating DG at a price equal to the utility’s full average CoS (as under a traditional net metering tariff with flat volumetric rates) and where the utility avoided cost (or VoS) is just 50 percent of the CoS (as might occur if half of the utility’s costs are fixed and half are variable) would result in about a 10 percent increase in average retail rates once penetration levels reach 20 percent of customer load.
ESTIMATING THE ELECTRICITY SYSTEM AND BROADER SOCIETAL IMPACTS OF DG
Estimating the benefits and costs of DG first requires identifying a comprehensive list of impacts, then evaluating the incremental value of each of these impacts relative to a counterfactual scenario without a particular DG resource. For example, the carbon emissions reductions from installing additional DG are equal to the amount of generation from carbon-emitting resources that DG displaces. Calculating this requires an estimate of how much carbon-emitting generation would have occurred absent the DG. This section first explains the key considerations for a robust analysis, identifies the major categories of DG impacts, and explains how each of these major impacts of DG could be calculated.
Key Considerations in Evaluating Future DG Impacts
A robust counterfactual-based DG analysis is location-specific, contains adequate temporal detail, applies best available load and power supply forecasts to estimate future impacts of DG, accounts for relevant policy goals, and helps determine long-term benefits and costs of DG through its lifetime. These considerations are explained in detail next.
Regional specificity: DG installation in a specific location will primarily affect electricity purchase, resource build, and grid operation of the utility that serves that location.19 The baseline should therefore be constrained to the utility territory in which the DG is going to be installed. Moreover, each utility has its own unique rate structure which is the foun-
___________________
19DOE. 2007. The Potential Benefits of Distributed Generation and the Rate-Related Issues That May Impede Its Expansion: Report Pursuant to Section 1817 of the Energy Policy Act of 2005. Washington, DC: Department of Energy. https://www.energy.gov/sites/prod/files/oeprod/DocumentsandMedia/1817_Report_-final.pdf.
dation for the net metering tariff it offers. Multiple utility territories (e.g., in organized markets with central dispatch of generation) could be combined to develop a common counterfactual with careful consideration of the load each utility serves, its electricity grid needs, clean energy legislation and regulation, and other policy goals for which each utility is accountable. There may be instances where DG affects specific parts of the distribution grid (e.g., individual feeders and circuits) being analyzed, and in that case the geographical boundary of the baseline will be smaller than a utility service territory.
Temporal detail: Energy use varies with time, and the effect of a DG resource is, among other things, a function of a region’s energy use profile and the DG’s generation load-shape, which vary by hours of the day and seasons of the year. Moreover, in increasingly renewable grids, energy prices and carbon emissions vary significantly with time (related to what type of generation is being displaced).20 This means that the economic and environmental benefits of DG will also vary with time. The counterfactual baseline scenario may therefore include this level of temporal detail to be able to capture the different streams of DG benefits. Many states, such as California21 and New York,22 account for this time-varying impact of different DG and DER.
Load forecast: An estimate of current and future demand for electricity consumption is needed to determine what future loads DG will meet and how these loads would be met absent the DG. The forecast will need to consider any shifts in seasonal peaks, as when a utility foresees moving from winter to summer peaking or vice versa.
Fuel and technology cost forecasts: Fuel and technology forecasts are necessary for rigorous estimates of avoided energy generation, capacity, and environmental costs, each of which is explained later in this section. Fuel forecasts—generally natural gas and coal—are necessary to estimate the costs of future energy generation from fossil resources, as the costs of operating these fossil resources are a key determinant of wholesale prices of
___________________
20 Kaffine, D.T., J.M. Brannin, and J. Lieskovsky. “Emissions Savings from Wind Power Generation in Texas.” The Energy Journal 34(1):155–175.
21 See CPUC hourly avoided costs calculator: CPUC. 2021b. “IDER Cost-Effectiveness, Avoided Cost Calculator.” https://www.cpuc.ca.gov/industries-and-topics/electrical-energy/demand-side-management/energy-efficiency/idsm.
22 See New York’s solar value stack calculator: NYSERDA (New York State Energy Research and Development Authority). 2022b. “Solar Value Stack Calculator.” https://www.nyserda.ny.gov/All-Programs/NY-Sun/Contractors/Value-of-Distributed-Energy-Resources/Solar-Value-Stack-Calculator.
electricity. Fossil fuel cost forecasts also can include future carbon emissions liabilities.23 Similarly, the forecasts of clean energy technology (solar, wind, and battery storage) installed costs are necessary for determining the future costs of clean energy generation and capacity. Established sources of these forecasts include, but are not limited to, National Renewable Energy Laboratory’s Annual Technology Baseline (ATB)24 and the Energy Information Administration’s short term energy outlook.25
Applicable policy goals: The baseline economic conditions related to how a utility plans to meet its future electricity demand depend in part on the policies, especially clean energy mandates, with which it needs to comply. Currently, 29 states plus the District of Columbia have some form of renewable portfolio standards (RPS) or clean energy standards (CES) that requires utilities to meet a predetermined fraction of electricity sales from renewable or zero carbon resources, or both, in some cases with a pre-determined set-aside for DG.26 Counterfactuals of resource-build and operation will differ for those states that have such policies versus those that do not. Therefore, while there may be more non- or low-emitting generation in states with strong clean energy goals, the carbon emission reduction of incremental DG in those states may be less than in states and grids without such goals.
Time horizon of analysis and the quantity of DG being analyzed: The amount of DG being analyzed and the time horizon over which it is analyzed dictate whether its impacts are only on the operating margin or whether it significantly affects the make-up of the grid, in terms of both generation resources as well as transmission and distribution infrastructure (discussed in Chapter 6). For example, a large amount of distributed solar and storage adoption may mean that less supply-side solar and storage will be contracted. The time horizon of the counterfactual should be equal to or longer than the estimated useful life of the DG being evaluated.
___________________
23Allen, M. 2003. “Liability for Climate Change.” Nature 421(6926):891–892; Gundlach, J. 2020. “Climate Risks Are Becoming Legal Liabilities for the Energy Sector.” Nature Energy 5:94–97; Heidari, N., and J.M. Pearce. 2016. “A Review of Greenhouse Gas Emission Liabilities as the Value of Renewable Energy for Mitigating Lawsuits for Climate Change Related Damages.” Renewable &Sustainable Energy Reviews 55:899–908; Krane, J. 2017. “Climate Change and Fossil Fuel: An Examination of Risks for the Energy Industry and Producer States.” MRS Energy & Sustainability 4:E2.
24NREL. 2022a. “Annual Technology Baseline (ATB): 2022 Electricity ATB Technologies.” https://atb.nrel.gov/electricity/2022/technologies.
25EIA. 2022f. “Short-Term Energy Outlook.” https://www.eia.gov/outlooks/steo/report/natgas.php. For additional information on CONE see the 2021 National Energy Technology Laboratory (NETL) report: NETL. 2021. “Energy Technology Systems and Market Analyses.” https://netl.doe.gov/sites/default/files/netl-file/21TPG_Brewer.pdf.
26North Carolina Clean Energy Technology Center. 2022a. “Database of State Incentives for Renewables & Efficiency® (DSIRE).” https://www.dsireusa.org.
Discount rates: Discount rates reflect the time value of money and are used when valuing the benefits and costs of BTM DG over time. Discount rates have the effect of placing greater value on earnings or savings incurred sooner rather than later. The higher the discount rate, the lower the value placed on future impacts, compared to present-day impacts.
The appropriate discount rate depends on the perspective of the entity being analyzed. The discount rate for a utility is often set at the utility’s weighted average cost of capital (WACC), or its “time value of money.” If a utility made investments at a future date, the utility would forego some return on investment that it otherwise could have realized if it made the investment now. The WACC for U.S. electric utility companies has generally been around 8 percent.27 The level depends in part on interest rates. Societal costs are generally evaluated with a lower social discount rate, indicating that future societal damages due to present-day carbon and air pollution emissions are not discounted as much as private investment. Social discount rates are usually in the range of 1 to 3 percent.
Ideally, analysts could apply the relevant discount rate to each stream of avoided costs or benefits. When calculating the present value of a utility’s future avoided wholesale electricity purchases, a utility WACC can be used. When calculating the present value of the social cost of carbon, a societal discount rate should be applied. The choice of discount rate has equity implications regarding the value given to impacts on future generations, as discussed in Chapter 5.
MAJOR ELECTRIC SYSTEM AND SOCIETAL IMPACTS OF DG
Many studies exist that explain each stream of DG benefits and costs in detail, along with available methods to quantify them.28 This section summarizes existing research, focuses on the major streams of benefits and costs of DG, defines them, presents the general methods for quantification, and recommends key considerations when estimating these
___________________
27 The U.S. average ROR from 53 jurisdictions, which are all around 8 percent, is available at Quackenbush, J.D. 2019. Cost of Capital and Capital Markets Primer for Utility Regulators. Washington, DC: National Association of Regulatory Utility Commissioners, p. 25. https://pubs.naruc.org/pub.cfm?id=CAD801A0-155D-0A36-316A-B9E8C935EE4D.
28CPUC. 2022c. “Decision on Transportation Electrification Policy and Investment.” Proposed Decision, Rulemaking 18-12-006. https://docs.cpuc.ca.gov/PublishedDocs/Efile/G000/M497/K622/497622010.PDF; Hayibo, K.S., and J.M. Pearce. 2021. “A Review of the Value of Solar Methodology with a Case Study of the U.S. VOS.” Renewable and Sustainable Energy Reviews 137:110599; NESP. 2022b. “The National Standard Practice Manual (NSPM).” https://www.nationalenergyscreening-project.org/national-standard-practice-manual; SMUD and E3. 2020. Value of Solar and Solar + Storage. Sacramento, CA: Sacramento Municipal Utility District and E3. https://www.smud.org/-/media/Documents/Rate-Information/2022-2023-Rate-Action/VOSstudy.ashx.
benefits and costs. The three main categories of benefits and costs discussed here are electricity system impacts, environmental and other externalities, and broader economy-wide effects.
Electricity System Impacts
The first set of benefits and costs discussed are those that occur within the boundaries of the electricity system. In many contexts, these benefits may be referred to as “avoided costs” of distribution, transmission, and generation though DG may also create additional costs (e.g., related to grid integration). A full accounting of electricity system impacts includes both the avoided and additional costs associated with DG deployment. The electricity system impacts discussed below include the effects of DG on energy generation costs, generation capacity costs, transmission and distribution capacity costs, and line losses, among other costs.
Energy generation costs: DG displaces electricity generation from other sources, thereby avoiding the costs related to the production of that electricity (primarily fuel and variable operating and maintenance costs). The specific electricity generation displaced by DG is a function of when the DG operates, where it is located, the quantity installed, and the period of the analysis (i.e., short-run or long-run).
In the short run, displaced generation is based on the existing fleet of generation resources in a region that serves the customers participating in net metering. In regions with organized wholesale power markets and with relatively low levels of DG penetration, the energy generation costs that DG avoids over the short run can be determined using hourly wholesale energy market prices. This wholesale energy market price generally represents the operating cost of the most expensive generating resource serving at any given time, which is the resource that DG would partially or fully displace.29 In regions without organized wholesale power markets, or where DG penetration is large enough to impact the set of plants operating on the margin, some type of simulation is often required in order to predict what generation resources would have been operating but for the DG resources, in each hour of the year, and to then estimate the costs of producing electricity from these resource types.
Over the longer-term, displaced generation may need to be based on some set of projections or assumptions about the future resource mix in the study region, taking into
___________________
29 During periods of scarcity or when imperfect competition exists, wholesale energy prices may rise above marginal operating costs.
consideration key economic and policy drivers for new generation build-out and retirement as well as underlying load growth.
Generation capacity costs: Maintaining a reliable grid requires sufficient electricity generation and demand response capacity at every point in time to meet customer and system needs.30 To the extent DG reduces the need for generation capacity to maintain system reliability, it avoids the cost of building or contracting for that capacity. This avoided capacity benefit is again a function of the timing of DG operation, the electric demand profile31 of a utility’s customers, and available alternative resources to meet this demand.
Traditionally, avoided generation capacity costs from DG are determined by estimating how much DG would reduce demand at the time of system peak demand. However, as renewable penetration increases, capacity may be more valuable at times other than when system peak demand occurs. For example, in California and other areas with relatively high solar penetration, peak demand may still occur in the afternoon, but capacity is often most needed in the evening when solar starts to go offline but electricity demand does not decrease commensurately.32 For this reason, the capacity value of solar generation (whether DG or utility-scale) tends to decline as solar penetration in a region increases. The intermittency of solar generation due to cloud cover may also reduce its capacity value. Pairing solar with storage, as has become common in both utility-scale and distributed applications, can help to mitigate both of those issues and enhance the capacity value of the combined resource.
The avoided capacity benefit that accrues to DG is equal to the amount of capacity that DG can defer multiplied by the per-unit cost of that deferred capacity. In regions with organized forward capacity markets, prices observed in those markets can be used to define the per-unit cost of avoided capacity. Otherwise, marginal capacity resources can be identified either through power sector modeling to determine what resources need
___________________
30 This reliable capacity amount is usually estimated through stochastic models that determine the amount of capacity needed to maintain system-wide reliability under numerous electric demand and supply scenarios. Junlakarn, S., R. Diewvilai, and K. Audomvongseree. 2022. “Stochastic Modeling of Renewable Energy Sources for Capacity Credit Evaluation.” Energies 15(14):5103.
31 The electric demand profile is the aggregate amount of electric power demanded by all end users in a utility’s territory over time.
32 This phenomenon is popularly referred to as the duck curve because of the shape formed by gross and net-of-solar demand curves across a day. See Denholm, P., M. O’Connell, G. Brinkman, and J. Jorgenson. 2015. Overgeneration from Solar Energy in California: A Field Guide to the Duck Chart. Golden, CO: National Renewable Energy Laboratory. https://www.nrel.gov/docs/fy16osti/65453.pdf. Due to capacity constraints moving later in the day, the addition of BTM solar capacity with similar output and availability profiles diminishes each MW’s ability to avoid generation capacity.
to be built for capacity, or as is commonly practiced, through less involved methods such as selecting lowest cost capacity resources based on recent market data.33
Transmission capacity costs: Transmission buildout is driven partly by asset age and condition, and partly by capacity needs (i.e., ensuring that electricity customers can be reliably served at all times). Increasingly, a significant amount of planned transmission capacity expansion is being driven by the need to access and integrate remote renewable generation.34
DG may defer the need for transmission upgrades if it can defer or avoid construction of specific transmission projects. However, unless DGs are planned and implemented to completely meet these location-specific capacity clean energy needs, or both, they may not eliminate the need for individual transmission projects.35
Even where DG is installed in an unplanned manner, it may still reduce overall demand in the system in a manner that could defer long-term transmission buildout. Some jurisdictions, like California,36 account for the possibility of this benefit by assigning a long-run transmission investment reduction benefit for unplanned DG adoption by calculating transmission upgrade costs per unit increase in peak demand through either historic data or utility investment projections; these per-unit transmission ($/MW) upgrade costs
___________________
33 The most common method of calculating avoided capacity cost is based on the net cost of new-entry (Net-CONE). Net-CONE is determined by first identifying the most likely, oftentimes lowest cost, capacity resource that would be procured to meet system needs and then subtracting the value of non-capacity benefits it provides the system (such as energy and ancillary services). Although natural gas combustion turbines have traditionally been the lowest net cost capacity resource in most of the country, decreasing battery storage costs combined with clean energy laws in many jurisdictions (which may make it unlikely for new gas peaker plants to be built) are changing this landscape. See SMUD (Sacramento Municipal Utility District) and E3. 2020. Value of Solar and Solar + Storage. Sacramento, CA: Sacramento Municipal Utility District and E3. https://www.smud.org/-/media/Documents/Rate-Information/2022-2023-Rate-Action/VOSstudy.ashx, p. 23. As the number of renewables on the grid increases, identifying marginal capacity resources using simplified methods may lead to skewed results, because both outstanding capacity needs and identifying the resource that can meet system capacity needs most cost-effectively depends on the interaction between regional electricity demand and renewable production characteristics.
34Joskow, P.L. 2020. “Transmission Capacity Expansion Is Needed to Decarbonize the Electricity Sector Efficiently.” Joule 4(1):1–3.
35 This brief compiles examples of non-wires-alternative projects implemented in specific locations to defer specific investments: Chew, B., E.H. Myers, T. Adolf, and E. Thomas. 2018. “Non-Wires Alternatives, Case Studies from Leading U.S. Projects.” Smart Electric Power Alliance, Peak Load Management Alliance, and E4TheFuture. https://e4thefuture.org/wp-content/uploads/2018/11/2018-Non-Wires-Alternatives-Report_FINAL.pdf.
36E3. 2022. “2022 Distributed Energy Resources Avoided Cost Calculator Documentation: For the California Public Utilities Commission.” https://www.cpuc.ca.gov/-/media/cpuc-website/divisions/energy-division/documents/demand-side-management/acc-models-latest-version/2022-acc-documentation-v1a.pdf, pp. 42–45.
are then assigned to peak hours that drive the need for incremental transmission capacity to serve electric demand. DG that saves or generates electricity during these peak demand times is assigned a proportional amount of avoided transmission benefit. Other jurisdictions, like Georgia,37 currently attribute no avoided transmission cost to DG solar.
Regions with ambitious clean energy goals will likely need additional transmission to bring large amounts of renewables online economically. However, not many jurisdictions currently attempt to determine whether DG has another incremental transmission benefit that would accrue from avoiding transmission investments that could be needed to meet clean energy policy goals. One way to determine this benefit is to model and compare the transmission buildout necessary to meet future electricity demand and clean energy goals with and without DG. The difference in transmission buildout in that instance would provide an estimate of the impact of DG. Because transmission needs are location and time specific, however, the type, amount, and quantity of DG resources will drive the results of this analysis. This is a complex system analysis task. Sacramento Municipal Utility District’s (SMUD’s) recent value of solar and storage study simplified this by estimating the transmission upgrade costs necessary to bring more supply side solar projects online and then allocated this avoided cost to distributed solar.38
Distribution and sub-transmission capacity and other costs: Like transmission upgrade and buildout, distribution system upgrades primarily are necessitated by either peak demand growth39 or because equipment is at the end of its useful life. DG can avoid distribution costs in two ways.
First, DG can defer the need for distribution upgrades to meet growing electricity demand by reducing peak demand growth on distribution circuits. To realize this benefit, DG needs to consistently reduce demand at the right time and locations, for example, at circuits that are near capacity. As most DG is adopted and operated by customers, it can be hard to apply DG to defer distribution capacity needs in specific locations because a
___________________
37 The Georgia Public Service Commission has adopted the following “framework” regarding the costs and benefits of solar resources: “During the winter, the system peaks generally occur just before or at dawn and after dusk. For these reasons, solar generation will not have an appreciable impact on deferring future transmission capacity investments.” GPSC (Georgia Public Service Commission). 2017. “A Framework for Determining the Costs and Benefits of Renewable Resources in Georgia.” GPSC Docket No. 40161, Document Filing #167588. https://psc.ga.gov/search/facts-document/?documentId=167588, p. 17.
38SMUD (Sacramento Municipal Utility District) and E3. 2020. Value of Solar and Solar + Storage. Sacramento, CA: Sacramento Municipal Utility District and E3. https://www.smud.org/-/media/Documents/Rate-Information/2022-2023-Rate-Action/VOSstudy.ashx, pp. 32–33.
39 Peak demand growth in a specific distribution feeder will impact that specific feeder only. However, data to conduct such disaggregated analysis are hard to obtain and the analysis is itself complex. Simplifying assumptions are often applied to understand the aggregate probability of distribution upgrades needed due to aggregate growth in peak demand.
predetermined quantity of peak-load-reducing DG (e.g., community solar with storage) needs to be installed at that circuit once a need for an upgrade is identified and that DG needs to be installed and operational before the circuit gets overloaded. New York State Energy Research and Development Authority’s (NYSERDA’s) solar value stack40 includes a locational system relief value that applies to specific parts of the grid; the California Public Utilities Commission’s (CPUC’s) distribution deferral analysis41 identifies distribution upgrades that can be deferred by planned DGs.
California also accounts for the possible benefit that, in the long-run, unplanned customer-adopted DG has the aggregate effect of deferring distribution upgrades that otherwise would have been needed.42 To account for these nonspecific deferrals, analysts can develop a correlation between peak load and distribution upgrade costs and then assign an on-average distribution system avoided cost to DG based on how much peak demand they reduce.43
Second, to the extent wear and tear of distribution equipment is a function of current flowing through the equipment, reducing electricity flow through these circuits permanently means that the equipment will likely last longer than if DG were not installed. This second impact is smaller because its value is the difference in present value of savings realized from deferring a project further out in time. However, growth of solar and other DG for which a utility has not planned can also increase the need for distribution upgrades and thus impose additional costs on utility customers.44
Transmission and distribution line losses: When DG reduces the amount of electricity that travels through transmission and distribution lines, it also reduces the amount of electricity lost, in the form of heat, in delivering that electricity from supply-side generation. These line losses should be accounted for when determining how much energy and peak
___________________
40NYSERDA. 2022c. “The Value Stack.” https://www.nyserda.ny.gov/All-Programs/ny-sun/contractors/value-of-distributed-energy-resources.
41 See California Public Utilities Commission’s (CPUC’s) Distribution Planning and Distribution Investment Deferral Framework here: CPUC. 2021a. “Distribution Planning.” https://www.cpuc.ca.gov/industries-and-topics/electrical-energy/infrastructure/distribution-planning.
42E3. 2022. “2022 Distributed Energy Resources Avoided Cost Calculator Documentation: For the California Public Utilities Commission.” https://www.cpuc.ca.gov/-/media/cpuc-website/divisions/energy-division/documents/demand-side-management/acc-models-latest-version/2022-acc-documentation-v1a.pdf, pp. 49–54.
43 Care should be taken when combining the benefits of on-average distribution system avoided costs with specific distribution system deferral avoided costs, to avoid both double counting and undercounting the aggregate distribution system benefits that accrue to DGs.
44 Recent research conducted at Stanford attributed two-thirds of the average distribution network price increase between 2003 and 2016 in California to required distribution system upgrades due to adoption of unplanned distributed solar by customers. See Wolak, F.A. 2018. The Evidence from California on the Economic Impact of Inefficient Distribution Network Pricing. Cambridge, MA: National Bureau of Economic Research. https://www.nber.org/papers/w25087.
capacity needs DG can avoid. The total energy DG avoids is equal to the total energy saved or generated onsite, plus the amount of electricity that would have been lost in the form of heat through the transmission and distribution system.45 Transmission and distribution line losses can either be calculated through detailed power flow modeling or via simplified engineering estimates.46
Other electricity system impacts: DG can also provide other electricity system benefits like ancillary services and financial risk reduction. “Ancillary services” is a catch-all term for services, in addition to electricity generation and capacity, that generation and storage resources provide the grid to maintain stability. These include voltage response, frequency response, spinning reserves, and operating reserves. Not all DG provide all these ancillary services; for example, dispatchable storage can provide frequency response, but distributed solar by itself typically cannot.
Alternatively, DG can also cause overloading of circuits (e.g., with distributed solar that could increase the need for fast frequency response and reserves on those circuits). Because the magnitude of this ancillary service avoided cost is small, this avoided cost is generally estimated by studying historic values of ancillary services and then projecting them forward or through detailed production cost modeling that estimates the value of future ancillary services.47
To the extent a utility replaces exposure to the wholesale gas market with customer-adopted DG, it reduces the risk of future fuel price volatility. This avoided cost is a function
___________________
45 Line losses are a function of the square of the power flowing through the wire, the total resistance of the wire, and inversely proportional to the square of the voltage flowing through the wire. So, increases in voltage for a given quantity of power can reduce the line loss (note—this is how high voltage transmission minimizes line losses). During times of peak demand the amount of power flowing through the grid is relatively higher than other times; line losses avoided by DGs are thus greater during times of greater demand.
46 Many jurisdictions use standard or average line loss factors to estimate line losses avoided by DG; these are then applied to the DG load-shape (i.e., the timing of generation) to determine the total amount of electricity and peak demand purchases from supply side resources the utility would otherwise have to make. For example, the SMUD value of solar study applies line loss factors ranging between 2.5 percent and 6 percent to determine the gross energy and capacity impact of DGs (SMUD and E3 2020, pp. 34–46). The Georgia Framework (GPSC 2017, p. 17) specifies that “Transmission energy losses should be included as a benefit and should be included through use of the projected Avoided Energy Costs. Transmission capacity losses should be included as a benefit for distributed resources”; however, transmission losses are described as difficult to value, and no methodology is prescribed.
47 For example, the Sacramento Municipal Utilities Department Value of Solar study found that avoided costs for all ancillary services are at most $0.65 per MWh (which is a fraction of a percent of retail rates). To the committee’s knowledge, studies do not estimate the value of individual avoided ancillary service costs from DG. For additional information on ancillary business models, see Wu, K., Y.M. Zhang, R. Hardison, and E. Weber. 2021. Business Models to Accelerate the Utilization of Distributed Energy Resources. NREL/TP-6A20-79549. Golden, CO: National Renewable Energy Laboratory. https://www.nrel.gov/docs/fy22osti/79549.pdf.
of the amount of exposure a utility has to fuel price volatility, the load shape and pattern of production of each DG, and the probability that the DG will reliably produce electricity or reduce load through its useful life.
Finally, there are other technological costs and benefits of integrating wide-spread DG adoption. As explained further in Chapters 5 and 6, DG can provide both individual and grid-level resilience benefits, and its grid resilience and economic value can be maximized through infrastructure that can help control DG operation. However, this infrastructure, including communications and cybersecurity, will require distribution investment with associated costs.
Environmental and Other Externalities
When DG displaces fossil fuel power plant operation, it can reduce both carbon emissions and pollution that would have occurred if the fossil power plant would have operated, as well as upstream environmental impacts of fossil fuel production and use. To the extent DG mitigates the build out of large-scale renewables, fossil power plants, and associated transmission (as discussed above), it can also reduce any associated environmental harm. These are among the societal environmental externalities that can accrue to a DG resource.
The price of electricity generally does not account for this societal cost or externality of greenhouse gas emissions or other pollutants from fossil-fuel power plants. Some states, like California, Connecticut, Delaware, Maine, Maryland, Massachusetts, New Hampshire, New Jersey, New York, Oregon, Rhode Island, Vermont, Virginia, and Washington have clean energy goals and/or carbon cap-and-trade programs that directly or indirectly internalize some of the cost of carbon emissions.48 Whether and to what extent to include externalities in utility avoided costs is a policy decision based on the laws and policy priorities of the jurisdiction in question. How to internalize these externalities and include them in avoided costs is an economic question that regulators are tasked with resolving.49
DG and supply side clean energy resources can avoid air pollution and carbon emissions. The avoided costs of these externalities should be treated consistently. Inconsistency in
___________________
48Center for Climate and Energy Solutions. 2023. “U.S. State Carbon Pricing Policies.” https://www.c2es.org/document/us-state-carbon-pricing-policies; NCSL. 2021. “State Renewable Portfolio Standards and Goals.” https://www.ncsl.org/energy/state-renewable-portfolio-standards-and-goals.
49 The National Standard Practice Manual, for example, explains how to value carbon when assessing DER. NESP. 2022b. “The National Standard Practice Manual (NSPM).” https://www.nationalenergyscreeningproject.org/national-standard-practice-manual.
how these externalities are valued among resources could lead to inefficient investment and thus raise electricity prices more than necessary.
Other externalities such as the monetary value of reduced land use and private customer resilience50 may exist as well. These values have not yet been well studied, and policymakers should consider whether and to what extent these externalities should be accounted for when developing net metering policies and compensation levels.
Greenhouse gas (GHG) reduction: This section explains one major category of externalities avoided by DG, carbon and air pollution, and the different approaches to quantify and monetize these externalities. The avoided social cost of GHG emissions from clean electricity consumption is equal to the product of the total GHG emissions abated by the DG and an estimate of the cost of carbon (further explained below). The total carbon emissions abated by DG is a product of the load shape of the DG times the marginal carbon emissions of the electricity grid through the useful lifetime of the DG.51
The marginal carbon dioxide (CO2) emissions from a grid depend on the resource mix of the grid.52 A grid with only fossil fuel resources will have predictable marginal emissions factors, generally equal to the emissions factors of gas-fired peaker plants during peak hours and equal to the emissions from load-following plants at other times. The marginal emissions of a grid with an increasing number of renewables will vary significantly with time; they will also evolve over time. When renewables are on the margin, DG will not abate carbon emissions; when a mix of renewables and fossil-fired generation is on the margin, then the amount of CO2 emissions DG will abate will be greater than zero, but less than if only fossil-fired generation was on the margin.
___________________
50 Resilience from combined solar and storage systems is an important benefit for customers dependent on electricity to power medical equipment and other vulnerable populations, as well as any customers facing frequent electricity outages. As currently structured, net metering is too broad a tool to ensure that these specific customers receive the resilience benefits of DG. Policymakers may want to consider alternative solutions for providing solar and storage to these customers, particularly reducing the barrier posed by their installation costs (see Chapter 5).
51 The load shape of the DG, or its time-varying electricity production, is generally estimated through engineering calculations or through measurement and verification, or both. For example, the electricity generation shape of distributed rooftop solar is a function of the solar irradiation on the solar panel and can be easily estimated through standard tools once the properties of a solar panel are known. The load shape of combined solar and storage installation is more uncertain as it depends on the operating profile of the storage system, which can be programmed by the end-user. See, for example, PVWatts® by the National Renewable Energy Laboratory: NREL. 2020. “PVWatts® Calculator.” https://pvwatts.nrel.gov.
52Holland, S.P., M.J. Kotchen, E.T. Mansur, and A.J. Yates. 2022. “Why Marginal CO2 Emissions Are Not Decreasing for US Electricity: Estimates and Implications for Climate Policy.” Proceedings of the National Academy of Sciences 119(8):e2116632119.
The committee believes that an estimate of the marginal emissions for the very near-term can be developed through wholesale energy market data where available.53 Estimates of future emissions abated by DG require an estimate of future grid operations as explained above. There are two main methods to set a price of carbon emissions: the damage and social cost of carbon and the marginal abatement cost of carbon.
The Social Cost of Carbon (SCC) is an estimate of the net economic cost of future damages that would be caused by incremental CO2 emissions.54 The SCC is calculated using a combination of complex global models that collectively forecast and quantify future damages due to increased temperature and then monetize these damages.55 These models produce a range of possible future damages. The present value of this range is dependent on the discount rate being applied. The Interagency Working Group’s 2016 Technical Support Document56 aggregated the range of SCCs.57
The Marginal Abatement Cost (MAC) is the cost of reducing the last ton of carbon to comply with a predetermined carbon reduction target. For example, California has a mandate for the electricity sector, per Senate Bill 100, to get to zero carbon electricity sales by 2045.58 The California Public Utilities Commission (CPUC) conducts capacity expansion modeling59 to determine the total cost and the marginal cost of meeting this
___________________
53 Ideally these emissions estimate would vary by location to accurately represent the emissions factors of power plants displaced. See, for example, work done by PJM on locational marginal emissions: PJM. 2022. “Locational Marginal Emissions Introduction.” https://www.pjm.com/-/media/committees-groups/forums/emerging-tech/2022/20220614/item-3---locational-marginal-emissions-introduction.ashx.
54 For more information on the social cost of carbon, see NASEM. 2017. Valuing Climate Damages: Updating Estimation of the Social Cost of Carbon Dioxide. Washington, DC: The National Academies Press.
55 Although there are many damages hard to quantify and monetize, such as increased likelihood of wildfires and flooding that these models either omit or incompletely account for (see Table 2, p. 4 in Institute of Policy Integrity. 2017. The Social Cost of Greenhouse Gases and State Policy. New York: Institute for Policy Integrity), and future damage valuations are uncertain, these are the best available estimates of the global social cost of carbon emissions.
56Interagency Working Group on Social Cost of Greenhouse Gases, United States Government. 2016. “Technical Support Document: Technical Update of the Social Cost of Carbon for Regulatory Impact Analysis—Under Executive Order 12866.” https://www.epa.gov/sites/default/files/2016-12/documents/sc_co2_tsd_august_2016.pdf, p. 4.
57 These aggregated values range from $14 to $148 in 2020 per metric ton of carbon dioxide to $31 to $254 per ton in 2050, with a mean value of $50 in 2020 and $83 per ton in 2050. See Paul, I., P. Howard, and J.A. Schwartz. 2017. The Social Cost of Greenhouse Gases and State Policy. New York: Institute for Policy Integrity, New York University School of Law. https://policyintegrity.org/files/publications/SCC_State_Guidance.pdf.
58 For more information on Senate Bill (SB) 100, see California Energy Commission. 2023. “SB 100 Joint Agency Report.” https://www.energy.ca.gov/sb100.
59 See CPUC avoided cost calculator documentation at pp. 30–31: E3. 2022. “2022 Distributed Energy Resources Avoided Cost Calculator Documentation: For the California Public Utilities Commission.” https://www.cpuc.ca.gov/-/media/cpuc-website/divisions/energy-division/documents/demand-side-management/acc-models-latest-version/2022-acc-documentation-v1a.pdf.
target to the electricity sector in each year and applies the estimate of marginal cost, also called the shadow price of carbon, to develop a cost of clean energy compliance, called the GHG Adder, that is used as an avoided cost for all DG.
For regions with binding carbon reduction targets, the MAC represents the price on carbon that will help attain binding carbon reduction targets most cost-effectively. Accordingly, regulators and/or utilities should internalize the MAC into avoided costs.60 For regions without binding targets, the value of carbon included in utility avoided costs is a policy choice. The SCC, which is a global measure of carbon damage, and estimates of MAC from different levels of carbon reduction, can help inform this decision.
Air pollution: The existing electric grid in the United States relies, in part, on combustion of gas, coal, oil, and biomass resources which can produce health-damaging air pollutants in addition to greenhouse gasses. These pollutants include particulate matter (PM2.5 and PM10), nitrogen oxides (NOx), sulfur dioxide (SO2), volatile organic compounds (VOCs), and heavy metals among others. NOx and SO2 further react in the atmosphere to produce more PM2.5 and ozone. Exposure to air pollution, especially PM2.5, is associated with cardiovascular and respiratory health impacts for exposed populations. These include, but are not limited to, asthma exacerbations, adverse birth outcomes, heart attacks, and increased mortality.61
The distribution of public health impacts of power plant emissions—or the benefit of a reduction in emissions—depends on the location of each power plant, the magnitude of geographic area affected by the emitted pollutants, and characteristics of the populations exposed to the pollutants (discussed further in Chapter 5).
To determine this health impact, analysts multiply the energy profile of DG with an emissions factor that represents the expected density of pollutants from the generation mix
___________________
60 The MAC applied to DG should (1) be aligned with the spending the utility would have to make to meet their carbon goals if customers did not adopt DGs going forward, and thus (2) put DGs on an even playing field with supply side renewables which the utility would purchase absent DGs.
61 The vast majority of the monetary valuation of health impacts from criteria air pollution exposure are a result of PM2.5 caused mortality risk (Massetti, E., M. Brown, M. Lapsa, I. Sharma, J. Bradbury, C. Cunliff, and Y. Li. 2017. Environmental Quality and the U.S. Power Sector: Air Quality, Water Quality, Land Use and Environmental Justice. ORNL/SPR-2016/772. Oak Ridge, TN: Oak Ridge National Laboratory. http://info.ornl.gov/sites/publications/files/Pub60561.pdf). See also Fann, N., A.D. Lamson, S.C. Anenberg, K. Wesson, D. Risley, and B.J. Hubbell. 2012. “Estimating the National Public Health Burden Associated with Exposure to Ambient PM2.5 and Ozone.” Risk Analysis: An International Journal 32(1):81–95.
on a regional grid that DG will replace.62 The difference in emissions between the two scenarios is a function of the quantity, load shape, and location of the DG installed. Atmospheric dispersion modeling of these emissions can then help evaluate air pollutant concentrations where people live under each scenario. This can then be coupled with concentration-response models to estimate the epidemiological impacts of air pollutant emissions reductions associated with DG.63 Some jurisdictions simplify this analysis by first calculating the average hourly emissions of the electric grid being evaluated. The aggregate load shape of the DG in question is then applied to these hourly emissions factors to determine the total amount of emissions abated by the DGs. Care should be taken when adding the avoided costs of health damage to avoided costs of carbon reduction to make sure that these two avoided costs are appropriately additive and are not being double counted.64
___________________
62 In its most simplistic form, this emissions factor can be estimated by developing a grid average marginal emissions factor using the makeup of the resources that participate in the wholesale market. A more detailed and relatively more accurate set of emissions factors can be determined through a detailed production cost model of a regional grid both with and without the DG.
63 Certain models, such as the U.S. Environmental Protection Agency’s (EPA’s) Co-Benefits Risk Assessment Model (COBRA), then assign a monetary value to these modeled health outcomes using such measures as the Value of a Statistical Life. See EPA. 2023. “CO-Benefits Risk Assessment Health Impacts Screening and Mapping Tool (COBRA).” https://www.epa.gov/cobra. To reduce the computational costs of air dispersion modeling, standardized emission factors and benefits are sometimes applied to avoided emissions. For example, EPA has standardized monetized values for every ton of avoided emissions for PM2.5 and PM2.5 precursors: EPA (U.S. Environmental Protection Agency). 2022. “Sector-Based PM2.5 Benefit per Ton Estimates.” https://www.epa.gov/benmap/sector-based-pm25-benefit-ton-estimates. Studies relying on these methods have been used to estimate human health benefits from DG or other clean energy resources, for example: Mantegna, G., A. Burdick, S. Price, A. Olson, M.M. Kinnon, and S. Samuelsen. 2021. Quantifying the Air Quality Impacts of Decarbonization and Distributed Energy Programs in California. San Francisco, CA: E3, and Irvine, CA: Advanced Power and Energy Program. https://www.ethree.com/wp-content/uploads/2022/01/CPUC-Air-Quality-Report-FINAL.pdf.
64 If a utility takes a SCC approach to monetizing carbon, then taking a damage cost approach to avoided health impacts and including them as an avoided cost for DG would be appropriate as long as these externalities are consistently included in payments for all clean energy resources that beget the same benefits. MAC estimates also account for the costs of abating pollutants of fossil power plant operation. For example, in California, utilities are required to contract with carbon-free resources and procure a certain amount of DER to meet California’s clean energy mandates and the state’s carbon dioxide reduction goals. These clean energy contracts displace power plant operation. When power plant operation is displaced, carbon dioxide emission, other air pollutants, and methane leakage are reduced; they all represent avoided costs attributable to displacement of power plant operation. Therefore, the MAC also accounts for the abatement of these pollutants.
Economy-wide Effects
In addition to the direct effects on the electricity system and environmental externalities, net metering and other policies that encourage DG deployment may lead to broader economy-wide effects. These effects are often challenging to precisely quantify in monetary terms, and as such are often left outside the scope of formal benefit-cost analysis but may nevertheless be relevant to policy discussions around the merits of net metering and other DG deployment policies.
The first of these broader economy-wide implications is the potential for helping to drive down the costs of certain DG resources by accelerating their deployment. This effect is sometimes described as the “learning curve,” and has been a key rationale for net metering and other policies aimed at supporting the deployment of clean energy technologies in the early stages of market development, before the technologies and their associated value chain businesses have reached some threshold scale.65 For rooftop solar, a portion of the overall cost of an installed system is associated with hardware components that are procured in global markets, and their cost trajectories reflect growth in both global supply and demand. Other costs, such as installation labor, reflect local conditions, which can be more readily influenced through local policies, such as net metering. Another potential economy-wide effect of net metering is its impact on energy security. In the case of rooftop solar, the underlying fuel source (the sun) is, in some sense, a domestic source, requiring no foreign fuel sources.
Finally, net metering and other DG support policies have sometimes been advanced for their employment and workforce development impacts. According to the latest Solar Jobs Census, roughly 135,000 individuals were employed in residential and commercial solar installation and development in 2021, representing roughly 50 percent of all domestic jobs in the U.S. solar industry, which in turn represent about 40 percent of all jobs in the U.S. electric power sector.66 Net metering and other forms of DG policy support have contributed to employment growth in the U.S. solar industry. Assessing the net effects on jobs requires consideration of jobs lost or displaced in other energy sectors; indirect effects associated with changes in energy prices; and job quality (e.g., pay, benefits, safety, and security), as well as concerns about distributional impacts—jobs gained and lost may occur in different locations or among different populations. These distributional issues are discussed further in Chapter 5.
___________________
65 See, for example, van Benthem, A., K. Gillingham, and J. Sweeney. 2008. “Learning-by-Doing and the Optimal Solar Policy in California.” The Energy Journal 29(3):131–151.
66IREC. 2019. “Solar Jobs Census 2019.” https://irecusa.org/resources/national-solar-jobs-census-2019.
FINDINGS
Finding 4-1: Net metering can provide a compelling financial incentive for customers to install DG in areas with relatively high retail electricity rates, while in regions with low electricity prices, it may be insufficient on its own to motivate significant levels of adoption.
Finding 4-2: From the perspective of society overall, whether net metering provides an economically efficient level of compensation for DG depends on how the volumetric energy portion of the customer’s retail electricity tariff compares to the marginal cost of producing and delivering electricity, including environmental externalities, at the time and location where DG production occurs.
Finding 4-3: Both volumetric electricity prices and the marginal cost of producing and delivering electricity can, and do, vary significantly from one situation to another, reflecting broad regional differences in the generation resource mix and policies, localized factors, and the temporal profile of individual DG resources. As a result, in some regions net metering may overcompensate DG, while in other regions it may under-compensate DG, relative to an economically efficient level.
Finding 4-4: The social marginal costs of generating and delivering electricity, including externalities, are likely to change significantly over time, particularly with modifications in the generation mix and its cost characteristics. Any assessment of the economic merits of net metering, and its potential rate impacts to non-participants, must consider these dynamic factors.
Finding 4-5: The major components of social marginal costs of generating and delivering electricity are the avoided costs of electric generation, capacity, deferred transmission and distribution infrastructure, avoided line losses, and decreases in greenhouse gases and air pollution resulting from reduced fossil plant operation.
Finding 4-6: Utilities and regulators can develop more economically efficient DG compensation, either by modifying the retail rate structures so that volumetric energy charges better align with social marginal costs or by modifying the net metering mechanism to transition to net billing or buy-all and sell-all tariffs with compensation levels reflective of social marginal costs.
Finding 4-7: Setting DG compensation at a level reflective of social marginal costs may induce higher or lower levels of DG deployment than would occur under a traditional
NEM structure with volumetric rates that recover both fixed and variable costs. The direction of the impact depends on the level of social marginal costs, which vary by location and point in time, and how those compare to volumetric retail rates.
Finding 4-8: The absolute magnitude of any rate impacts associated with net metering scale with the penetration of DG resources. As shown earlier in Chapter 3, in most U.S. states, less than 1 percent of residential customers are currently taking service under a net metering tariff. Where this is the case, rate impacts are minimal.
Finding 4-9: The rate impacts of net metering on non-participating customers depend on how the cost impacts to the utility compare to the revenue impacts. When net metering is coupled with retail rate structures that recover fixed utility costs via the volumetric energy (cents/kWh) component, revenue reductions will generally exceed utility cost reductions, leading to upward pressure on non-participant rates for the utility to recover its costs.
Finding 4-10: When net-metered DG displaces fossil fuel power plant operation, environmental benefits are realized due to decreased greenhouse gas emissions and air pollution. The benefits of reduced carbon emissions accrue globally, while the health benefits of reduced air pollution are region specific as they accrue to customers downwind of the displaced output from affected power plants.
Finding 4-11: Environmental benefits achieved by net-metered DG may also be accomplished through other policies and technologies, potentially at a lower cost to nonparticipating customers.
Finding 4-12: Utilities and regulators balance many competing objectives when setting rates and DG compensation structures. There may be scenarios where some level of non-participant rate impacts is deemed acceptable when it advances other ratemaking objectives (e.g., economic efficiency) or policy goals.
RECOMMENDATIONS
Recommendation 4-1: Regulators should strive to develop retail rate structures—for both DG and non-DG customers—with usage-based energy prices that correspond as closely as possible to the social marginal cost of producing and delivering electricity, inclusive of time- and location-specific environmental or other externality costs (insofar as they are not already internalized), while recognizing
other competing rate-design objectives. Under this condition, net metering will generally result in economically efficient levels of investment in DG technologies, albeit with some rate impacts to non-participating customers.
Recommendation 4-2: In the absence of economically efficient rate structures for all customers, the alternative solution may be to implement changes to the net metering mechanism—either buy-all or sell-all, or net billing tariffs—for DG customers, with DG compensation levels set at, or near, the social marginal cost of electricity production and delivery.
Recommendation 4-3: When evaluating the economic implications of current or proposed changes to net metering rules, decision makers should consider specific conditions in their jurisdiction (e.g., the generation mix and costs, DG penetration levels, clean energy policies, etc.), while also anticipating how those conditions may evolve over the lifetime of DG resources. Environmental benefits should be carefully weighed alongside any rate impacts to non-participating customers.
Recommendation 4-4: In some cases, additional compensation for DG customers may be warranted above and beyond what can be provided through net metering or other DG tariffs. In these circumstances, any additional incentives for DG customers should be provided through transparent incentives designed to achieve a specified outcome (e.g., to encourage adoption by low-income customers, to relieve constraints in specific localized regions of the grid, to meet legislative DG targets, etc.) and, if appropriate, funded from sources outside of electricity rates.
Recommendation 4-5: In determining DG compensation, policymakers should explicitly account for the environmental and other externalities that DG reduces when it displaces fossil fuel generation. To fairly compensate DG for this clean energy attribute, policymakers should consider whether to do so based on the monetary value of the environmental externalities that the DG is likely to abate or the cost to achieve the same reduction in environmental harms through alternative technologies or policies.
Recommendation 4-6: Utilities should work with regulators and stakeholders to identify the types and formats of information (such as heat maps and avoided-cost calculations) that the utility should provide publicly about their distribution systems and their provision of electricity service so that suppliers and potential customers of behind-the-meter generation can see the benefits and costs that
behind-the-meter technologies can provide to the local electric system. Regulators and decision makers of publicly owned utilities should ensure that such information is provided to the public in easily understandable and accessible ways.
Recommendation 4-7: To the extent possible, BTM DG compensation rates should be location- and time-based, tied to available distribution capacity, to indicate where that DG would have the greatest value (e.g., in relieving or avoiding distribution constraints and/or displacing local generation with high emissions). Considering the locational value of solar can have particular value to low-income customers who often live in areas with emitting generation and poorer air quality.


