2
Racial Disparities in Victimization, Offending, and Involvement with the Criminal Justice System
Experiences with crime and the criminal justice system differ greatly by race and ethnicity in the United States. Whether one measures differences in victimization, in serious criminal offending, in homicide clearance, in being stopped by the police, in arrest rates, in pretrial detention, or in representation within the populations of those under community supervision, sentenced to jail, or sentenced to prison, in each case a clear racial hierarchy emerges. Crime and criminal justice outcomes are often worse for members of the nation’s racial and ethnic minority groups, especially for African Americans. These differential outcomes are closely connected to structural racism across multiple domains in society.
Victimization rates show clear racial disparities. American Indian people and African Americans are the most likely to be victimized by serious violent offenses, followed by Hispanic people and, finally, by non-Hispanic White and Asian people. While inter-racial disparities in nonlethal violent victimization have narrowed considerably over the past decade, racial disparities in murder rates remain stubbornly high, with the murder rate for African Americans relative to other groups increasing sharply during the 2020 pandemic. Disparities and trends in disparities in property crime victimization are qualitatively similar. There are also racial/ethnic disparities in offending rates and arrest rates, with arrests for serious felonies higher among African Americans and to a lesser extent Hispanic people as compared to White people.
Explanations for observed disparities in victimization, criminal offending, and criminal justice involvement often focus on sources of structural socioeconomic inequality, including differences in neighborhood conditions,
exposure to concentrated disadvantage, personal poverty, and other measures of socioeconomic status. To illustrate disparities in one such measure, Figure 2-1 displays patterns of poverty according to the proportion of a neighborhood’s residents that are poor, using data for 2019, for the entire United States. The figure presents separate distributions for members of different racial/ethnic groups, ordered from groups with the highest average neighborhood poverty rates to those with the lowest average rates. It reveals large differences experienced by different racial and ethnic groups, with concentrated poverty particularly high in areas where African Americans, American Indian people, and Hispanic people disproportionately reside. Prior studies attempting to assess the degree to which racial disparities in victimization and offending are attributable to systematic inequality tend to find that inter-group differences in neighborhood characteristics, personal poverty, and exposure to high-risk peers explain a substantial part of Black/White disparities and often all Hispanic-White disparities (Light and Ulmer, 2016; Krivo and Peterson, 1996). See Chapter 3 for a fuller discussion. Later chapters further explore research on the socioeconomic determinants of the inter-racial/ethnic disparities in victimization and involvement with criminal justice.
In this chapter, we document the current levels of racial disparities in these outcomes as well as trends over recent decades. First, the chapter documents racial differences in victimization, offending, and arrests. It then discusses what is known about how police behavior as well as patterns of interaction between police and different communities may contribute to the observed disparities. After exploring data on public safety and policing, the chapter discusses racial disparities in criminal justice outcomes that reflect processes that occur after individuals are arrested. It documents racial disparities in time served in jail while cases are being resolved before documenting racial disparities in rates of imprisonment. It also addresses racial disparities in charging, plea bargaining, and sentencing, paying specific attention to historical and continuing disparities in death sentences and executions.
Finally, the chapter documents racial differences in rates of community supervision (i.e., probation or parole supervision), noting that a growing body of evidence suggests that, in many jurisdictions, probation and parole supervision do little to help the formerly incarcerated and recently convicted establish steady employment and stable housing while making great efforts to find technical reasons to re-incarcerate those under supervision. Throughout, we focus on careful documentation of existing disparities and trends and document evidence that the racial bias exhibited by some police officers, prosecutors, probation officers, parole officers, and other state actors in the criminal justice system contributes to these disparities.
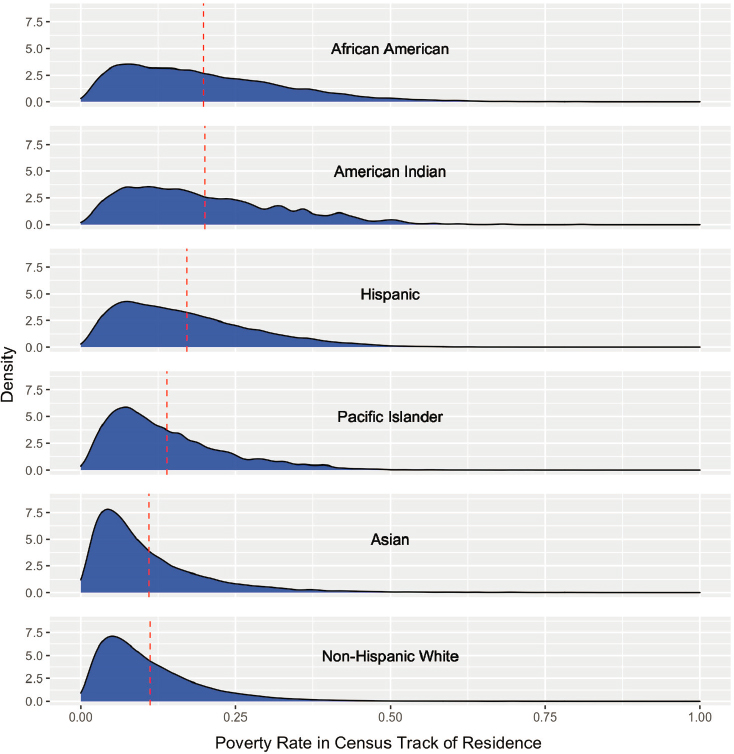
NOTE: The dashed line indicates the proportion of poor in the neighborhood of the average resident.
SOURCE: Tabulations from the 2019 American Community Survey summary files, https://www.census.gov/programs-surveys/acs/data.html
Of course, the information presented in this chapter is necessarily incomplete. For example, if police agencies report crime rates separately by race and by gender, but not also by race and gender combined, it is difficult to track offending by and victimization against women of color disaggregated from those rates for men in the same racial group or for women overall. Similarly, detailed data are routinely reported for certain decision
points (e.g., pretrial detention and death sentences) but not for others (e.g., diversion and informal processing), so the data give an incomplete picture of the points in the system where racial disparities occur.
Moreover, research on racial disparities is heavily focused on Black versus White; there is comparatively little research documenting and analyzing disparities faced by other racial groups. This is due to both researcher focus and data availability. American Indians and Pacific Islanders, in particular, are often left out of reported data even though the little available information suggests they face significant disparities in violent victimization, police encounters, and incarceration. Some of this data invisibility is due to small overall population numbers. American Indian people are one to two percent of the national population (their share increased to 2.9% in the 2020 census) and one to two percent of the population in most states. Observable disparities show up in states and localities with larger concentrations of American Indians but may not show up in national datasets. Another problem is inconsistency in how racial categories are defined and reported, a problem that is discussed in further detail in Chapter 10.
VICTIMIZATION
There are two principal measures of crime in the United States. First, the Uniform Crime Reporting (UCR) program relies on the reporting of crimes to individual police agencies, which subsequently report them in summary form to the Federal Bureau of Investigation (FBI). Second, the U.S. Census Bureau in conjunction with the U.S. Bureau of Justice Statistics (BJS) conduct the annual National Crime Victimization Survey (NCVS), which each year asks a representative sample of U.S. residents about criminal offenses they have experienced in the past year, including contextual information regarding the nature of the offense; whether the offense was reported to the police; and for violent offenses, characteristics of the person perpetrating the crime. Both sources tend to focus on more serious offenses, often referred to as Part 1 felony offenses (sometimes referred to as index crimes), though data pertaining to less serious offenses such as simple assaults and low-value larcenies (both offenses often charged as misdemeanors) are also collected.
Geographic variation in violent and property crime rates as measured in the UCR data has shown higher crime rates in urban areas relative to suburban areas, a positive correlation between the proportion of a jurisdiction’s residents that are racial and ethnic minorities and crime rates, and a positive correlation between the proportion of residents who are poor and crime rates (Kneebone and Raphael, 2011). However, this research has also demonstrated that over the past three decades the strength of these associations has weakened considerably, as have the differences in crime rates between urban and suburban cities.
To focus more precisely on differences in victimization, in the subsequent sections we analyze data that allow us to identify the race/ethnicity of specific crime victims. The NCVS allows us to document inter-group differences in victimization for serious offenses using large-scale surveys of victims. In addition, we use data from the Supplementary Homicide Reports (a separate data series produced under the FBI UCR program) to study differences in murder rates.
First, we present data on property crimes and nonlethal violent crimes, and then we discuss homicide victimization. In doing so, we find clear racial disparities in victimization rates: American Indians and African Americans are the most likely to be victimized by serious violent offenses, followed by Hispanic people and last of all by non-Hispanic White and Asian people. While inter-racial disparities in nonlethal violent victimization have narrowed considerably over the past decade, racial disparities in murder rates remain large and some have grown wider, with the murder rate for African Americans relative to other groups increasing sharply during the 2020 pandemic. Disparities and trends in disparities in property crime victimization are qualitatively similar.
Property and Nonlethal Violent Crimes
Table 2-1 and Table 2-2 present property crime and violent crime victimization rates, respectively. The tables combine the 2012 through 2019 NCVS surveys to increase the sample size with an eye on generating more accurate estimates for smaller groups. The NCVS asks respondents about property crime experienced by anyone in their entire household (burglary, motor vehicle theft, other theft), so property crime victimization rates are typically reported as the number of incidents per 1,000 households. We use the race/ethnicity of the household head to classify the race/ethnicity of the household, acknowledging that race/ethnicity may vary within households. Violent crime victimizations are measured for all household members ages 12 and older; thus, violent crime victimization rates are measured as the number of incidents per 1,000 individuals.
Table 2-1 reveals that the lowest property crime victimization rates are among Asian/Pacific Islander and White households, and the highest rates are among American Indian and multi-racial households. Black households experience an overall property crime rate that is roughly 1.14 times that among White households, while Hispanic households experience an overall rate that is 1.28 times that among White households. The largest proportional disparities occur for motor vehicle theft, though this crime occurs relatively infrequently relative to home burglaries and other thefts.
Table 2-2 presents estimates for violent crime victimization rates. The NCVS defines serious nonlethal violent offenses to include the offenses of
| All Property Offenses | Burglary | Motor Vehicle Theft | Other Theft | |
|---|---|---|---|---|
| White | 111.8 | 21.2 | 3.4 | 87.2 |
| Black | 127.0 | 29.4 | 6.0 | 91.6 |
| Amer. Ind./Aleut. | 246.1 | 64.9 | 10.1 | 171.2 |
| Asian/PI | 85.1 | 12.7 | 4.0 | 68.4 |
| More than one race | 270.8 | 57.5 | 9.4 | 203.9 |
| Hispanic | 143.4 | 24.8 | 7.9 | 110.8 |
NOTE: The race/ethnicity categories used in this table are mutually exclusive.
SOURCE: Figures are tabulated from the concatenated National Crime Victimization Survey files, https://doi.org/10.3886/ICPSR38136.v1
| All Serious Violent Offenses | Rape | Robbery | Aggravated Assault | |
|---|---|---|---|---|
| White | 6.8 | 1.5 | 1.8 | 3.5 |
| Black | 8.9 | 1.0 | 3.4 | 4.5 |
| Amer. Ind./Aleut. | 16.5 | 3.8 | 6.6 | 6.1 |
| Asian/PI | 4.5 | 1.2 | 1.6 | 1.7 |
| More than one race | 22.8 | 6.9 | 5.6 | 10.4 |
| Hispanic | 8.6 | 1.4 | 3.0 | 4.2 |
NOTE: The race/ethnicity categories used in this table are mutually exclusive.
SOURCE: Figures are tabulated from the concatenated National Crime Victimization Survey files, https://doi.org/10.3886/ICPSR38136.v1
rape, robbery, and aggravated assault. American Indians and those classified as multi-racial experience by far the highest victimization rates for these offenses, with American Indian women having a uniquely high rate of sexual victimization. For example, among American Indians the number of rapes per 1,000 is more than double the number among White people, the robbery rate is more than triple the rate among White people, and the aggravated assault rate is 1.74 times the rate among White people. Black and Hispanic respondents experience higher rates of robbery and aggravated assault relative to White respondents as well, though the differences
are smaller than those observed for Native Americans. Asian respondents experience the lowest violent crime victimization rates.1 While most violent victimization is intra-racial, violent victimization of American Indians—including sexual violence—is more likely to be inter-racial.
Homicide Victimization
Figure 2-2 presents the national homicide rate for 1990 through 2020. Overall, the U.S. murder rate has declined considerably from a peak rate during that period of 9.8 per 100,000 in 1991 to the pre-pandemic level of five per 100,000 in 2019. The rate fell by more than a third during the late 1990s and fell roughly 20 percent between 2006 and 2014 before jumping up sharply between 2014 and 2016. However, the homicide rate increased by almost 30 percent between 2019 and 2020 to reach a high point for the 21st century.
Several sources of early counts suggest that homicide rates have stabilized at these higher levels. Rosenfeld and Lopez (2021) study 22 cities and find that homicide rates continued to increase during the first three quarters of 2021. Overall, they find that between the first nine months of 2020 and the first nine months of 2021, homicide rates in these cities increased by four percent. The FBI has posted preliminary homicide counts for 2021 for roughly 170 cities with populations over 100,000; the total population in these cities equals roughly 49 million. The population-weighted murder rate in these cities increased by one-tenth of one percentage point between 2020 and 2021.2
Table 2-3 presents homicide victimization rates by race and sex for 1990, 2000, 2010, and 2015. Men drive the racial differences in these rates. White and Asian people face the lowest risk of death from homicide, and for these groups the ratio of male-to-female homicide victimization rates is never more than 3:1 from 1990 forward. However, among Black people, Native Americans, and Hispanic people the rates of homicide victimization are higher, and the ratio of male-to-female rates is always above three; among Black people this ratio is roughly 5:1 or greater in every year.
In all racial groups, we see noteworthy declines in homicide victimization rates between 1990 and 2010 for both men and women. Among men, these rates fell by more than one-third within each racial group, and these steep proportional declines within all racial groups greatly diminished racial
___________________
1 For both property and violent crime victimization rates, Black/White and Hispanic-White differences were much smaller in the 2010s than in the 1990s.
2 These figures are based on tabulations of the FBI quarterly reports; see https://crime-data-explorer.fr.cloud.gov/pages/explorer/crime/quarterly
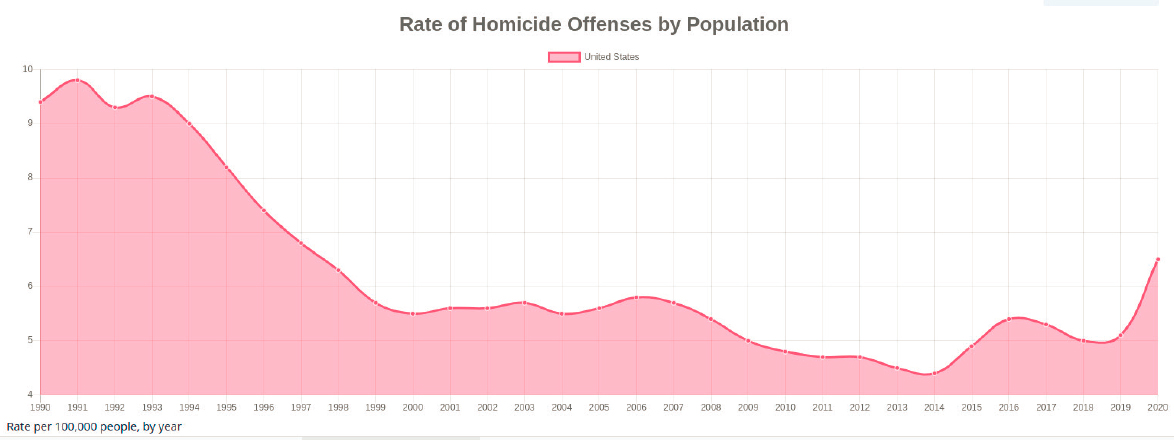
SOURCE: Data from Federal Bureau of Investigation, Crime Data Explorer, https://crime-data-explorer.app.cloud.gov/pages/explorer/crime/crime-trend
TABLE 2-3 Homicide Rates for Males and Females, by Race (Age-Adjusted), 1990, 2000, 2010, 2015
| Homicide Rates for Males by Race (Age-Adjusted) | ||||
|---|---|---|---|---|
| 1990 | 2000 | 2010 | 2015 | |
| White | 5.6 | 3.6 | 3.3 | 3.6 |
| Black | 63.1 | 35.4 | 31.5 | 35.4 |
| Native American | 16.7 | 10.7 | 8.8 | 9.8 |
| Asian | 4.3 | 2.6 | 2.2 | 2.3 |
| Hispanic | 27.4 | 11.8 | 8.7 | 7.9 |
| Homicide Rates for Females by Race (Age-Adjusted) | ||||
| 1990 | 2000 | 2010 | 2015 | |
| White | 2.5 | 1.9 | 1.8 | 1.7 |
| Black | 12.5 | 7.1 | 5.0 | 4.9 |
| Native American | 4.6 | 3.0 | 2.5 | 2.5 |
| Asian | 2.8 | 1.7 | 1.2 | 1.0 |
| Hispanic | 4.3 | 2.8 | 1.8 | 1.8 |
NOTE: White is defined as White and not-Hispanic.
SOURCE: Data from National Center for Health Statistics, http://www.cdc.gov/nchs/hus/contents2016.htm#029
gaps in rates of homicide victimization. We see similar patterns among women, but the changes in these racial gaps are much less dramatic.
Nonetheless, Black men remain an outlier. In 2015, the Black/White ratio in homicide victimization rates was 9.8. This ratio is lower than the corresponding ratio for 1990 but higher than the ratio in 2010. Data from the Centers for Disease Control and Prevention (CDC) show that this increase can be attributed to a large jump in homicide victimization rates among Black men between 2014 and 2015 (from 30.6 to 35.4). It appears that the spike in the overall homicide rate between 2014 and 2016, which Figure 2-2 documents, involved a relative surge in homicide victimization among Black men. In 2014, the rates for Black and White men, respectively, were 30.6 and 3.3. Between 2014 and 2015, these rates rose to 35.4 and 3.6, which were also the rates in 2000. What this means is that in a single year, 14 years of declines in the Black/White gap in homicide victimization rates among men were reversed.
The most recent data on homicide victimization demonstrate two facts concerning the recent increase in homicide rates: (1) the increases were broad-based geographically, with similar patterns observed across the country, and (2) the increases were extremely concentrated among specific
demographic groups. Table 2-4 presents data from the CDC Underlying Causes of Death file on homicide rates for 2019 and 2020 by gender, race, and ethnicity for five states: California, Florida, Illinois, New York, and Texas. While homicide levels vary considerably across states, we observe similar inter-group disparities within state and year as well as similar relative patterns of increase between 2019 and 2020. Within year and state, homicide victimization rates for males are multiple times those for females,
| Panel A: Non-Hispanic Black | ||||
|---|---|---|---|---|
| Male | Female | |||
| 2019 | 2020 | 2019 | 2020 | |
| California | 35.0 | 48.8 | 4.5 | 7.2 |
| Florida | 37.4 | 43.6 | 5.0 | 6.2 |
| Illinois | 69.8 | 104.3 | 8.4 | 11.2 |
| New York | 20.5 | 34.6 | 2.7 | 4.0 |
| Texas | 32.5 | 42.2 | 5.0 | 7.1 |
| Panel B: Non-Hispanic White | ||||
| Male | Female | |||
| 2019 | 2020 | 2019 | 2020 | |
| California | 3.4 | 4.5 | 1.5 | 1.5 |
| Florida | 4.4 | 4.6 | 2.1 | 2.4 |
| Illinois | 2.7 | 2.5 | 1.5 | 1.0 |
| New York | 1.2 | 1.8 | 1.0 | 0.7 |
| Texas | 4.8 | 6.0 | 2.0 | 2.9 |
| Panel C: Hispanic | ||||
| Male | Female | |||
| 2019 | 2020 | 2019 | 2020 | |
| California | 9.1 | 12.2 | 1.5 | 1.8 |
| Florida | 6.0 | 7.0 | 2.4 | 2.0 |
| Illinois | 8.9 | 15.1 | - | - |
| New York | 5.6 | 8.6 | 1.6 | 1.6 |
| Texas | 8.2 | 10.3 | 2.0 | 2.4 |
NOTE: Homicide rates are not reported for Hispanic women in Illinois by CDC due to small number of cases and lack of reliability.
SOURCE: Data from the Underlying Causes of Death 1999–2020 dataset and downloaded through a query from the CDC Wonder data tool, http://wonder.cdc.gov/ucd-icd10.html
and there are enormous racial/ethnic disparities. African American males experience the highest homicide rates by far for all states, followed by Hispanic males, and then African American females. Between 2019 and 2020 very large increases occurred in homicide victimization rates that were concentrated among African Americans, with especially large increases among Black males.
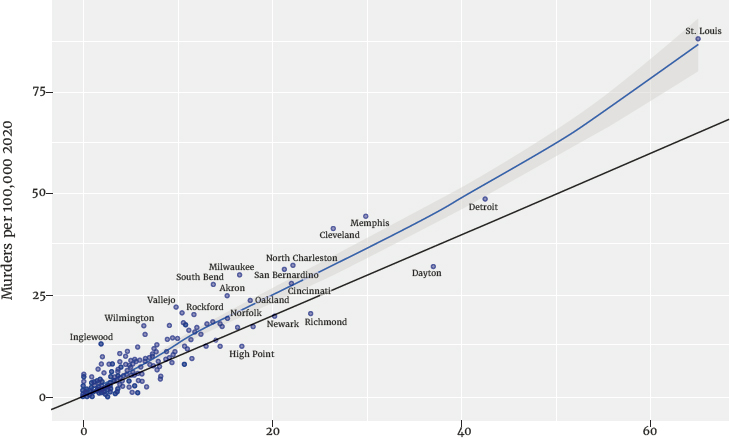
Murder rates are much higher in cities than in rural areas, and both Black and Hispanic citizens are overrepresented in urban centers relative to rural areas. Thus, the recent sharp rise in murder rates in U.S. cities may generate growing racial disparities in homicide victimization over time. Figure 2-3 shows that there are enormous differences in murder rates across cities, but since 2019 murder rates have grown in the vast majority of cities. Figure 2-3 presents a scatter plot of the 2020 murder rates against the 2019 murder rates for large cities (populations over 100,000) included in the most recent quarterly crime reports published by the FBI. The solid black line shows coordinates where the y-axis value equals the x-axis value. Hence, points above the line display cities where the homicide rate has increased, while points below the line display cities where the homicide rate has decreased. The blue line fits the observed relationship between city-level murder rates in these two years.
SOURCE: Tabulations from the FBI Quarterly Crime Reports, https://crime-data-explorer.app.cloud.gov/pages/explorer/crime/quarterly
Several patterns stand out. First, the rise in the murder rate between 2019 and 2020 is broad-based, with most points lying above the black line. Second, the increases appear to be larger in cities that were already suffering from high murder rates. Third, while most cities have murder rates in both years below 10 per 100,000, there is a cluster of cities with extremely high murder rates by both national as well as international standards.3
In sum, racial and ethnic minority groups experience higher victimization rates in the United States. With the exception of homicide victimization, racial disparities in victimization have narrowed considerably over the past three decades. However, American Indians continue to face higher levels of violent victimization compared to all other groups. Racial disparities in murder rates have grown since 2010, including during the periods when overall homicide rates rose sharply, from 2014 to 2016 and again from 2019 to the present.
DIFFERENCES IN ARRESTS AND CRIMINAL OFFENDING
Arrest rates are consistently higher among African Americans than among other racial and ethnic groups. While these disparately higher rates may reflect differences in baseline offending rates by group (see Chapter 4), they may also be partly due to differences in enforcement, driven for example by greater police deployment in minority neighborhoods or by differential treatment of African American suspects by police. Several researchers have demonstrated that there are higher numbers of police per capita in cities with larger minority populations (Chen et al., 2022; Carmichael and Kent, 2014; Stults and Baumer, 2007). Moreover, Chen and colleagues (2022) demonstrate that within cities, officers spend disproportionate amounts of time in predominantly Black census blocks, relative to the population density and to limited measures of location-specific criminal activity.4 Such differential exposure to policing may lead to higher arrest rates in minority neighborhoods relative to arrest rates for comparable behavior in White neighborhoods (see Chapter 4).
___________________
3 The World Bank collects homicide data from around the world to facilitate international comparisons. While the data are incomplete and do not contain values for all years (often reporting the most recent complete year for a nation), the highest recorded value is for El Salvador (measured in 2018) with a murder rate of 52 per 100,000. The two other northern triangle Central American countries had murder rates in 2018 of 39 (in Honduras) and 23 (in Guatemala). Note that these are among the highest national murder rates in the world. See https://data.worldbank.org/indicator/VC.IHR.PSRC.P5?most_recent_value_desc=true
4 Specifically, Chen and colleagues (2022) condition on distance to the nearest homicide in 2016 and total homicide by census block in addition to a number of other measures of block-level socioeconomic status and proxies for social cohesion. They still find a partial correlation with racial composition.
At the same time, clearance rates—the rates at which offenses are solved by an arrest or the identification of the offender via some other means—are lower for serious crimes that involve Black victims. To the extent that crimes are committed within race, these lower clearance rates may signal that, at least for some crimes, arrest rates understate the relative Black offending rates.
This section reviews the data on racial disparities in arrests. While we discuss disparities across racial and ethnic groups, we pay particular attention to evidence that high arrest rates in Black communities may reflect forms of over-policing and that, for some crimes, low clearance rates suggest that police are failing to provide accountability in Black communities. The number of stops by police in African American communities often appears to be greater than one would expect given the high relative proportions of stops that end with no more than a warning and the often-lower search discovery rates associated with these stops, providing evidence that minority communities are over-policed.
However, arrest rate differentials reveal very large disparities across groups in arrests for the most serious felony offenses, with the offense disparities aligning more closely with disparities in offender race as perceived by surveyed crime victims. African Americans are overrepresented among those arrested for Part 1 felony offenses. American Indian people are also overrepresented among arrests, though this largely reflects arrest disparities for less serious offenses.5 Further, overall levels of violence by police against African American citizens are higher than expected given levels of contact with police. Added to this, we also find evidence that minority communities are under-protected, with data on clearance rates suggesting that serious crimes committed and reported in African American communities often going unsolved.
Moreover, American Indians are most heavily overrepresented in arrests for a handful of nonviolent, mostly alcohol- and drug-related offenses. When understood in context with the relatively high rates of detention and incarceration in this population, a picture emerges of Native people coming into the system at the front end for low-level offenses but being treated more punitively at the back end.
Several studies find evidence of either a differential likelihood of contact or a difference in the nature of contact with law enforcement, holding
___________________
5 For example, using detailed arrest data by race/ethnicity and offense from the FBI for 2019 (https://ucr.fbi.gov/crime-in-the-u.s/2019/crime-in-the-u.s.-2019/tables/table-43) and population totals from the U.S. Census Bureau for 2019 (https://www.census.gov/newsroom/presskits/2020/population-estimates-detailed.html), we tabulate that the numbers of arrests per 100,000 for drunkenness or disorderly conduct (both non-index offenses) stand at 669.7 for American Indians, 218.5 for African Americans, and 118.7 for White people. As a percentage of total arrests, arrests for these two categories account for 6.3 percent of White arrests, 5.4 percent of Black arrests, and 17 percent of American Indian arrests.
constant underlying behaviors. In a juvenile justice context, Crutchfield and colleagues (2012) find that African American eighth graders are nearly twice as likely to have contact with police as White eighth graders, a difference that is only partly explained by differences in self-reported criminal conduct. Raphael and Rozo (2019) find that arrests of Black youth are more likely (than arrests of other youth) to result in a formal booking as opposed to an informal disposition (e.g., counseling and a call to the parents), holding charges constant.
Disparities in arrest rates may be driven by (1) racial disparities in baseline offending rates, (2) disparities in reports to the police by the race of the perpetrator, (3) disparities in the arrest probability conditional on having committed an offense (i.e., members of one group more likely to get a pass relative to members of another group), and (4) disparities in the likelihood that an innocent person is arrested for something they did not do. Rather than disentangling these underlying contributors, prior efforts to assess the relative contributions to arrest rate disparities of differential offending rates as opposed to the other possible contributing factors have relied on comparisons of victim reports to official arrests. For example, Beck (2021) demonstrates that African Americans are overrepresented among people arrested for serious nonfatal violent offenses, comprising 12.5 percent of the resident population and 36.1 percent of arrests for nonfatal felony person offenses (33% if simple assaults are included). Beck also finds that while African Americans account for 28.9 percent of offenders as reported by victims, they constitute roughly 35 percent of offenses reported to the police, reflecting a higher likelihood that offenses where the perpetrator is perceived to be African American are officially recorded (Beck, 2021). Hence, comparisons of arrest compositions to results from victimization surveys suggest that both race disparities in offending as well as disparities in the likelihood of reporting contribute to differences in officially recorded arrests. Such comparisons are not possible for property offenses nor for drug offenses, as there are no victim reports that one could use to benchmark the racial composition of offenders.
Arrests
To examine patterns in arrests by race it is useful to see arrest rates broken down by offense category as well as race over a substantial period. Figure 2-4 presents arrests per 100,000 persons by race for the years 1980 through 2019.6 The figure presents separate time series for adult index violent
___________________
6 Tabulations from the Office of Juvenile Justice and Delinquency Prevention arrest tool; see https://www.ojjdp.gov/ojstatbb/crime/ucr_trend.asp?table_in=. The UCR arrest data do not present separate tabulations for Hispanic arrests.

SOURCE: Data from Office of Juvenile Justice and Delinquency Prevention Statistical Briefing Book. Trends in the number of arrests by race for all offenses. Released on July 08, 2022. https://www.ojjdp.gov/ojstatbb/crime/ucr_trend.asp?table_in=2
offenses (murder, rape, robbery, and aggravated assault), adult index property offenses (burglary, larceny, motor vehicle theft), and adult non-index crime arrests (all the other categories, which are generally less serious offense categories). The figure also provides a separate time series for juvenile arrest rates (all offenses combined).
The patterns are fairly consistent across these arrest categories. For adults, non-index offenses are clearly the most numerous, followed by arrests for property offenses and violent offenses. Disparities in arrest rates between African Americans and all other groups are largest during the late 1980s and early 1990s but have narrowed over the past three decades. The decline in the Black/White ratio in arrest rates has accompanied a very large decline in the absolute disparity, reflecting a decline in the arrest rate for Black Americans, greater than 50 percent, in the two decades from the late 1990s. We see a similar narrowing in juvenile arrest disparities. Despite this narrowing, race disparities persist in 2019, with the highest arrest rate being that for African Americans, followed by American Indian, White, and Asian people.
Patterns of Offending by Race
While it is not possible to pin down the exact contribution of different factors to racial disparities in arrest rates, reported offense patterns from victimization surveys provide some insights. Table 2-5 presents the results from victim responses pertaining to the race/ethnicity of the offender as perceived by the victim. The NCVS asks this question only of victims who have experienced a violent crime. The table presents the distribution of offenses by the perceived race/ethnicity of the offender for all serious violent offenses as well as for those individual crimes that are defined as serious violent offenses. The final column presents the race/ethnicity distribution of survey respondents, which provides an estimate of the composition of the resident population of the country ages 12 and older. Here we use all offenses occurring from 2012 through 2019.
The numbers in Table 2-5 are quite similar to those reported in Beck (2021), with the small differences relative to Beck’s tabulations likely attributable to our aggregation of multiple years of the NCVS surveys. African Americans are overrepresented among offenders for serious violent offenses, constituting 25.2 percent of all such serious offenses, while African Americans made up just 12.2 percent of survey respondents. White people are underrepresented as perceived by violent crime victims, while Hispanic people are roughly represented in proportion to their representation among the general population.
| Serious Violent | Rape | Robbery | Aggravated Assault | Distribution of Survey Respondents | |
|---|---|---|---|---|---|
| White | 40.6 | 47.2 | 31.4 | 43.5 | 63.9 |
| Black | 25.2 | 15.8 | 35.3 | 22.9 | 12.2 |
| Other | 5.7 | 5.8 | 6.7 | 5.0 | 7.7 |
| Hispanic | 16.7 | 16.2 | 15.8 | 17.4 | 16.2 |
| Unknown | 11.9 | 15.0 | 10.8 | 11.2 | — |
| Total | 100.0% | 100.0% | 100.0% | 100.0% | 100.0% |
NOTE: The race/ethnicity for perceived offenders accounts for incidents where there are multiple offenders and follows the coding scheme employed by the U.S. Bureau of Justice Statistics.
SOURCE: Figures tabulated from the concatenated National Crime Victimization Survey files for 1993–2019, https://doi.org/10.3886/ICPSR38136.v1
Table 2-6 presents a finer breakdown of these data by showing the fractions of offenders by race given the race of a victim. The columns in Table 2-6 sum to one. Among both Black and White people, most victims report that they were attacked by an offender of the same race. One would expect to see this pattern among White people even if all attacks were random, since they account for more than 60 percent of the population. However, attacks are not random. African American victims of serious violent crime report roughly 65 percent of the time that they are victimized by a Black person. White victims report being victimized by a White person roughly 56 percent of the time. Victims in other groups do not report that the majority of offenses are within group, but Hispanic victims report that 40 percent of those who attacked them were Hispanic.
Examining cross-group victimizations, we see that 16.6 percent of White victims report being victimized by a Black person, while 8.3 percent of Black victims report being victimized by a White person. The White victimization rate of 6.8 (per thousand) is just over three-fourths of the Black victimization rate (see Table 2-2). The White victimization rate attributable to Black offenders is about 50 percent greater than the Black victimization rate attributable to White offenders.
The White population is about five times larger than the Black population. Thus, there are (16.6 × .75 × 5) = 62.25 White victims of Black offenders for every 8.3 Black victims of White offenders—that is, about 7.5 times as many. Given that the Black population is about one-fifth the size of the White population, these results imply that Black people are roughly 35 times more likely to commit violent offenses against
| All Serious Violent Offenses | ||||||
|---|---|---|---|---|---|---|
| Offender race/ethnicity | Victim Race/Ethnicity | |||||
| White | Black | Am. Ind | Asian/PI | More than one race | Hispanic | |
| White | 55.7 | 8.3 | 63.0 | 14.3 | 54.3 | 19.5 |
| Black | 16.6 | 64.8 | 7.4 | 24.6 | 21.3 | 22.9 |
| Other | 4.2 | 4.7 | 19.9 | 28.1 | 8.4 | 5.3 |
| Hispanic | 12.8 | 7.1 | 3.4 | 9.4 | 7.9 | 40.4 |
| Unknown | 10.6 | 15.1 | 6.2 | 23.7 | 8.1 | 12.0 |
NOTE: Columns sum to 100 percent.
SOURCE: Figures tabulated from the concatenated National Crime Victimization Survey files for 1993–2019, https://doi.org/10.3886/ICPSR38136.v1
White people than White people are to commit violent offenses against Black people.
We use the term “roughly” because the NCVS measures of victimization rates are noisy, and implied inter-racial victimization rates jump around from year to year. Even though we are using eight years of data, 2012–2019, our calculations should not yield a precise estimate of the ratio of inter-racial offending rates by race.7 We also note that, in a world where all offenders choose victims at random, the ratio between the probability of a Black person victimizing a White one and the probability of the converse is simply the ratio of Black-to-White offending rates times the ratio of White-to-Black population shares. If we use Black/White arrest ratios associated with violent crime as proxies for Black/White ratios of violent offense probabilities, we expect this product to be at least 15 in recent years, and for earlier years to be often more than 20. In sum, we expect the likelihood that Black persons violently offend against White persons to be much larger than the probability of the converse simply because racial differences in offense rates are significant and racial differences in population shares are large (see, e.g., Messner and South, 1992, 1986; O’Brien, 1987; Sampson, 1984).
We have also analyzed inter-racial offense patterns by crime category. From this it is clear that one crime, robbery, drives the high overall rate of violent victimization by Black people against White people. Twenty-four percent of White robbery victims are robbed by a Black offender, but only five percent of Black robbery victims are robbed by a White offender.8 This pattern may be expected, since White people in large cities are typically more affluent than the average resident. In addition, O’Flaherty and Sethi (2019) argue that racial stereotypes also play an important role. They argue that White people possess stereotypical beliefs that cause them to view Black people as more dangerous than they are. Furthermore, they argue that these fears make White victims less likely to resist Black robbers. Finally, they argue that Black robbers select White victims because they know White people have exaggerated fears of Black people and are therefore unlikely to resist robbery attempts by Black people. They argue that racial stereotypes
___________________
7 We have made similar calculations using published reports from BJS. Using these results and weighting each yearly inter-racial offending rate equally, we estimate that Black citizens are 23 times more likely to victimize White people than White people are to victimize Black people. For some years, we could not find annual criminal victimization reports that cover the race of offenders. We did find suitable annual reports for 2018, 2019, and 2020. BJS also produced a special report, Race and Hispanic Origin of Offenders, 2012–2015, NCJ 250747; see https://bjs.ojp.gov/library/publications/race-and-hispanic-origin-victims-and-offenders-2012-15
8 For other violent crimes, rape, simple assault, and aggravated assault, the fraction of Black offenders in the population of events involving White victims ranges from 10.5 to 15.6 percent, and the Black population share is more than 12 percent.
about Black men create excessive fear among White people, and this fear invites the encounters with Black robbers that White people want to avoid. They cite ethnographic work among Black robbers to support their claims.
Glenn Loury (2021) discusses models of the processes that transform biased perceptions into realized group differences in behavior. These models describe information traps. Members of a minority group may behave in a different way than a majority group but not because they are inherently different. Rather, they may find it in their own interests to behave differently because they know that the majority group believes they are different. However, this rational response to stereotypical beliefs may strengthen these beliefs.
White offenders do account for a large portion (63%) of the violent offenses against American Indians. Since the American Indian population is small, these offenses account for a small part of the overall White offense rate. This result may imply a high rate of White people offending against American Indian victims in border-town communities. Alternatively, because more than half of American Indian and Alaska Native people (78% in the 2010 census) do not live on reservations or tribal lands, and unlike other groups Native people living in cities tend not to live in spatially segregated communities, inter-racial offending may also reflect the experiences of Native people living among White people and other groups in cities. Or, if rates of inter-racial sexual and domestic violence are especially high, this may also reflect racial-sexual patterns, including both intermarriage rates and the use of sexual violence as a tool of racial domination.
Table 2-2 shows that American Indian people are almost twice as likely as Black people to report being the victim of violence, but Figure 2-4 shows that they are much less likely than Black people to be arrested for violent crimes. These large differences between relative arrest rates and relative victimization rates create a puzzle for those who view violent offenses as predominately intra-racial acts, but the fact that White people commit 63 percent of all violent crimes against American Indian people may help us understand these patterns. American Indian arrest rates for violent crimes may be low relative to their violent victimization rates because American Indian people are often the victims of White offenders.
Researchers cannot collect reports from homicide victims concerning the races of their attackers. However, the Supplementary Homicide Reports do provide information on the race and ethnicity of the offender when the offense is cleared by arrest or some other means. We use this information in Table 2-7 to document the distribution of murder victims by the Race/ethnicity of the person committing the murder for each racial/ethnic group observable in the Supplementary Homicide Report data with available offender information. Again, we use all murders occurring between 2000 and 2019.
The results in Table 2-7 reveal that murders are even more likely to occur within race. Approximately 55 percent of incidents involving American Indian victims, 52 percent of those involving Asian victims, 90 percent of those involving Black victims, 74 percent of those involving Hispanic victims, and 79 percent of those involving White victims are intra-racial murders. African Americans are overrepresented among reported assailants when the murder victim is Asian (19.6% of offenders) and when the victim is White (16.34% of offenders). Similar to the results in Table 2-6, we see that 16.3 percent of White victims were murdered by a Black person while roughly eight percent of Black victims were murdered by a White person.
However, these results do not have the same implications for interracial offense rate differences. The raw count of White victims of violent crime is more than three times higher than the raw count of Black victims, but the raw number of Black homicide victims is significantly greater than the number of White victims. For example, in 2020, there were 9,913 Black homicide victims and only 7,029 White victims. Thus, the number of murders involving White victims and Black offenders is less than 50 percent greater than the number of murders involving Black victims and White offenders. Rates of homicide by Black offenders against White victims are greater than the rates of homicide by White offenders against Black victims, but the ratio of these rates is much smaller than the comparable ratio for all violent offenses.
Our comparisons of inter-group differences in arrest rates to patterns from victimization surveys and homicide incident reports suggest that the relatively high arrest rates in Black communities may reflect relatively high offending rates. However, as reported by Beck (2021), violent offenses
| Victim Race/Ethnicity | Offender Race/Ethnicity | ||||
|---|---|---|---|---|---|
| American Indian | Asian | Black | Hispanic | White | |
| Amer. Indian | 55.48 | 0.87 | 12.95 | 5.58 | 25.13 |
| Asian | 0.62 | 51.81 | 19.60 | 6.54 | 21.42 |
| Black | 0.13 | 0.40 | 89.18 | 2.33 | 7.96 |
| Hispanic | 0.39 | 0.89 | 12.20 | 74.27 | 12.24 |
| White | 0.72 | 0.78 | 16.34 | 3.56 | 78.59 |
NOTE: Rows sum to 100 percent.
SOURCE: Figures tabulated from the concatenated National Crime Victimization Survey files for 1993–2019, https://doi.org/10.3886/ICPSR38136.v1
where the victim indicates an African American assailant are more likely to be reported to the police and thus arguably more likely to result in an arrest. We conclude this section by documenting the proximate determinants of reporting rates for serious violent offenses.
Appendix Figures 2A-1 and 2A-2 present estimated disparities in the proportion of offenses reported to the police relative to offenses involving White offenders. We indeed see considerably higher reporting rates for offenses involving African American offenders, but the reporting rates given Hispanic offenders are not statistically different than reporting rates given White offenders. We examine potential reasons for this Black/White difference in reporting rates.9 Since we only see statistically significant disparities relative to White offenders when the offender is perceived to be Black, we focus on the Black/White reporting disparities.
Controlling for victim race explains roughly half the disparity in reporting rates between incidents involving Black and White offenders. This reflects at least two facts: (1) as we discuss more below, African American victims are discretely more likely to report offenses to the police; and (2) offenders who are perceived to be African Americans are greatly overrepresented in incidents involving African American victims. Controlling for offense type, on the other hand, does not narrow the disparity.
In sum, African Americans are overrepresented among offenders for serious violent offenses; White people are underrepresented as perceived by violent crime victims; and Hispanic people are roughly represented in proportion to their representation among the general population. Inter-group differences in arrest rates to victimization rates suggest that the relatively high arrest rates in Black communities may reflect relatively high offending rates. However, variation in likelihood of reporting crimes to the police may also explain some of these differences. Moreover, a large body of evidence establishes the historical and contemporary social pathways through which racially inscribed inequality leads to both crime and criminal justice involvement, and assessments of offending, violence, and victimization need to be situated in an understanding of the social drivers of crime, which are discussed at length in Chapter 3.
___________________
9 Specifically, the first set of disparities in Figure 2A-2 report the regression coefficients on race/ethnicity dummies from a linear probability model where the dependent variable is an indicator that the offense was reported and the explanatory variables are dummy variables for perceived offender race/ethnicity (with White offenders the omitted category). The second set of disparities are the coefficients on the offender race/ethnicity dummies after adding a complete set of indicators for the race/ethnicity of the crime victim. The final set of disparities report similar coefficients that additionally add indicator variables for the type of serious violent offense.
INTERACTIONS WITH POLICE OFFICERS
As described above, both victimization rates and offending rates tend to be higher among African American and American Indian people and to a lesser extent among Hispanic people. We also see higher arrest rates among African American and American Indian people, although we did not report arrest rates for Hispanic people. The arrest rates for African Americans remain quite high relative to other groups, and homicide victimization rates among African American men are likely more than 10 times the rates among White men and rising.
These patterns raise two concerns about interactions between police and Black communities: (1) Are high arrest rates in these communities, at least in part, the result of an excessive police presence? (2) Are police engaging with Black communities in ways that do not produce public safety? In sum, are Black communities both over-policed and poorly served?
Police officers frequently stop members of the public. In 2018, 11.1 percent of the U.S. population, 16 or older, were stopped by police (BJS, 2020). These stops may arise because officers observe suspicious activity, minor infractions like traffic violations, or serious crimes in progress. Police officers stop and search African Americans at rates that are higher than those observed for other racial and ethnic groups. While this pattern may be expected given higher rates of offending among African Americans, most stops do not result in arrests. Furthermore, although police rarely use force during stops, they are more likely to use force when they stop African Americans, even when the stop does not begin because police believe that a crime is in progress.
Over the past two decades, a large body of research has focused on understanding these stop disparities and the degree to which they reflect differential scrutiny applied to African American drivers and pedestrians. Much of this literature has focused on stops involving searches of either one’s person or one’s vehicle, focusing on whether observed differences in search rates reflect differential scrutiny or differential underlying base rates of offending across groups. An earlier National Academies of Sciences, Engineering, and Medicine report on proactive policing provides an extensive review of this technical research (the National Academies, 2018). While we will touch upon this specialized literature below, in this section we focus on documenting basic facts about differences in the incidence and nature of interactions between police and the public. A more extensive discussion of policing in minority communities can be found in Chapter 4.
Many state, county, and local law enforcement agencies routinely collect information about traffic and pedestrian stops and have specific reporting requirements pertaining to incidents where force is used. That being
said, data collection is far from uniform, and departments vary considerably in terms of the data they collect, the degree to which data are publicly shared, and the level of disaggregation with which stop and incident data are shared with the public (e.g., summary data vs. incident-level records). Combined with the fact that there are over 19,000 law enforcement agencies in the United States, it is difficult to provide a complete portrait of disparities in interactions with law enforcement.
Nonetheless, there have been several efforts to compile and harmonize police stop and other incident data from various departments, sometimes by research organizations and sometimes by media outlets. Moreover, several state legislatures have now undertaken efforts to implement uniform reporting requirements for all law enforcement agencies in their states. Here we draw on these various projects to document what we generally know about differences in interactions with police. While we do not have data on all police agencies, the patterns we document are typical of the patterns documented in this body of research.
Basic Patterns Regarding Stops, Searches, and Search Outcomes
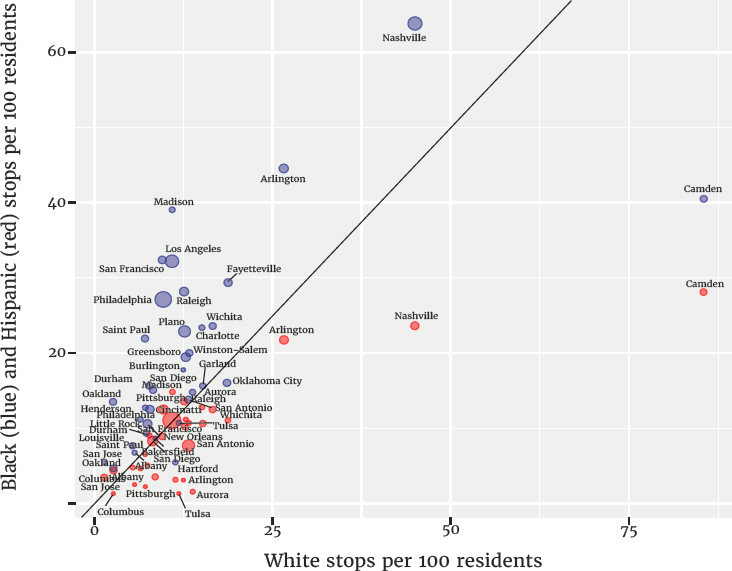
The Stanford Open Policing Project has compiled and harmonized stop-level data for several large city police departments as well as state police agencies for nearly half of all U.S. states.10 We use these data to document differences in the rates at which Black, Hispanic, and White members of the public are stopped by police. The data cover various years during the 2010s and are averaged to generate average stops per year per 100 residents. Figure 2-5 presents a scatter plot of Black stops per 100 residents against White stops per 100 residents (blue dots) as well as Hispanic stops per 100 residents against White stops per 100 residents (red dots) for 34 large cities from across the country. Each point corresponds to a city, with the marker size proportional to the number of Black (Hispanic) stops made in the specific city. The scatter plot includes a diagonal black line marking coordinates that would indicate equal stop rates across groups. Hence, points that lie above the line indicate that the stop rate for African Americans (Hispanic people for the red markers) exceeds that for White people, while points lying below the line indicate relatively lower stop rates for Black or Hispanic people.
The plot reveals that Black stop rates are higher than White stop rates across nearly all included departments. The disparities range from slightly higher rates (e.g., in Albany [NY] and Louisville [KY]) to stops rates for African Americans that are nearly three to four times those for White people (e.g., in St. Paul [MN], Madison [WI], Los Angeles [CA], and San Francisco
___________________
SOURCE: Data from Stanford Open Policing Project, https://openpolicing.stanford.edu/
[CA]). In contrast, Hispanic stop rates tend to be lower than White stop rates in most cities, with a few exceptions. Figure 2-6 presents similar comparisons for 22 state police agencies. The patterns are similar: state police tend to stop African Americans at higher rates relative to White people and stop Hispanic residents at relatively low rates.
The Stanford data do not include detailed information regarding what occurred during the stops or their outcomes. However, the State of California is in the process of rolling out a uniform stop data collection form across all law enforcement agencies in the state that includes detailed information about the nature of stops, actions taken by officers during the stops, and the ultimate outcome. The most recent year of publicly available data (2019) includes stop records for the 15 largest agencies in the state, covering a large portion of the state’s population and several of the country’s top 10 largest

SOURCE: Data from Stanford Open Policing Project, https://openpolicing.stanford.edu/
cities.11 We use these data to dig into the details of what happens during traffic stops and the outcomes of these stops.12 The committee restricts the analysis to traffic stops (basically excluding calls for service). In all tabulations
___________________
11 As of 2019, the Racial Identity and Profiling Act (RIPA) data include all traffic stops made by the California Highway Patrol, the Los Angeles Police Department, the San Diego Police Department, the Oakland Police Department, the Sacramento Police Department, the Long Beach Police Department, the Fresno Police Department, the San Francisco Police Department, and the San Jose Police Department, as well as county sheriff departments for the counties of Los Angeles, Orange, Riverside, San Bernardino, Sacramento, and San Diego.
12 Similar to the patterns observed in the Stanford Open Policing Project data, RIPA data for California reveal that the proportion of stops that involve African Americans is roughly 2.5 times the African American population share. Similarly, Hispanic and White people are underrepresented among those stopped relative to their population share.
to follow, we present separate estimates for the California Highway Patrol, the one statewide agency in the data that accounts for a large share of stops disproportionately on the state’s freeway system, and other law enforcement agencies, primarily municipal police departments and county sheriffs that focus on local law enforcement. We also present separate tabulations for the broad race/ethnicity categories included in the data where stop totals are sufficient in number and interact race with gender in all of our tabulations.13 Appendix Figures 2A-3 through 2A-5 present the results.
These data reveal a number of important patterns. Traffic stops for non-moving violations are highest for African Americans, both for California Highway Patrol stops as well as stops made by local agencies. To begin, the proportion of stops for equipment violations is particularly high for Black males when the stops are made by local law enforcement (nearly 30% of stops), exceeding the comparable rate for White males by nearly 10 percentage points. In addition, among stops made by local law enforcement, roughly 17 percent of Black males are ordered to exit their vehicles, compared to 12 percent of Hispanic males and slightly over five percent of White males. Further, fully one-fifth of local stops of Black males involve either a curbside or backseat detention, compared with approximately 16 percent of stops involving Hispanic males and 10 percent of stops involving White males. We see a similar pattern of disparities in the proportions of stops that involve vehicle searches or the use of handcuffs.
We see different patterns when we examine the ultimate outcomes of these stops. Here, we bin outcomes into four categories: (1) the stop resulted in no more than a warning; (2) the stop resulted in a traffic citation or a misdemeanor citation and release in the field; (3) the stop resulted in an actual arrest and booking; and (4) a residual category for other possible outcomes (e.g., contacted the legal guardian of the person stopped, referred the person to a school counselor, executed a psychiatric hold). Given the very small proportion of stops that fall under the fourth (“other” outcome) category, we focus our discussion on the first three outcome contrasts.
California Highway Patrol stops are most likely to result in a citation, but citation rates are lowest for Black males. Many California Highway Patrol stops end with no more than a warning, with the highest rates for White males and females (roughly 30 and 28% of stops), followed by Black males and females (roughly 28 and 25% of stops). For local law enforcement, more than 60 percent of stops of Black males result in no more than a warning.
___________________
13 For gender, we focus on cisgender males and females, though the data do include information on whether the officer perceives the stopped citizen to be gender nonconforming. These latter stops are a very small percentage of stops made by officers in the data.
Local law enforcement stops Black men at high rates, and given these stops, local law enforcement is more likely (than other officers) to interrogate drivers, search vehicles, handcuff motorists, and so on. However, among the stops that occur, local law enforcement is also most likely to simply let the driver go with a warning if the driver is a Black man. In fact, Black men stopped by local law enforcement are about 20 percentage points more likely to be let go with a warning than White men who are stopped.
Hit-Rate Analyses of Stops Involving Searches
The differential stop rates documented above do not necessarily imply that police agencies across the country are discriminating against African Americans. There is a long literature on police stops discussing the likely problems associated with benchmarking stops against residential populations. Among the many issues that researchers and policy makers have raised in interpreting these data are: (1) differences in staffing and police deployment across areas of the city, (2) differences between the population at risk of being stopped by the police and the resident population of a given city, and (3) movement of individuals across city boundaries for work and recreational activities that may create disparities between the racial composition of the resident population and the racial composition of the daytime population of specific cities. For these reasons, research has focused on the results of stops in an attempt to detect differential scrutiny.
Appendix Figure 2A-5 shows that stops of Black and Hispanic drivers do result in arrests more often than stops of White drivers, but arrests may in part reflect subjective decisions made by officers. The principal outcome test explored in a larger research literature compares the contraband discovery rates of searches for Black and Hispanic people to the rates for White people. The logic behind this comparison is the following. Suppose that officers only search people when those people cross some internal suspicion threshold that the officer has regarding the likelihood that they possessed illegal drugs, weapons, or some other form of contraband. Suppose further that for some race/ethnicity groups, this internal threshold is lower; that is to say, there will be members of the lower threshold group whom the officer will search and individuals from another group who exhibit similar behavior who are not searched. This greater scrutiny should lead to relatively lower contraband discovery rates, as it takes less to arouse the suspicions of officers for members of the group being discriminated against. Hence, a simple empirical test of discrimination in searches against one group is to test whether contraband discovery rates (often referred to as the hit rate associated with a search) are lower for the group in question.
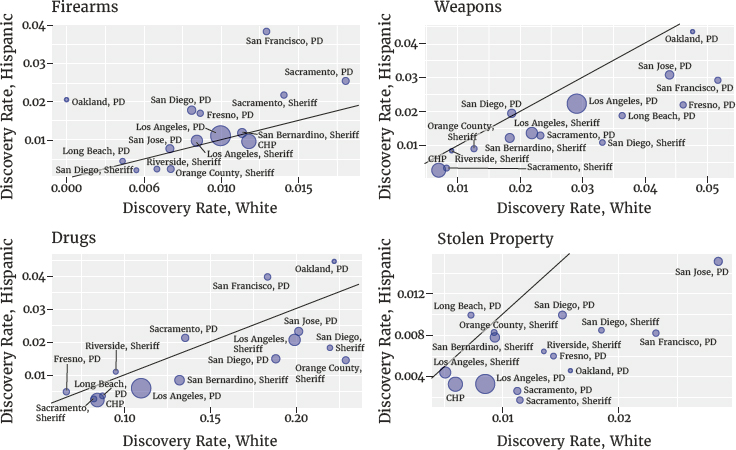
The annual reports of California’s RIPA board consistently show hit rates for all stops in the dataset combined that are slightly lower (and
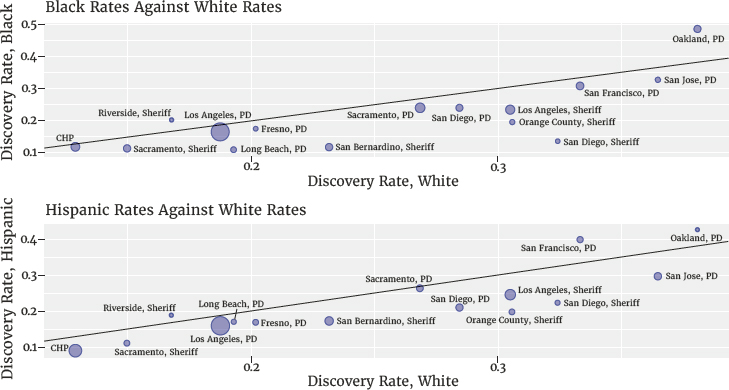
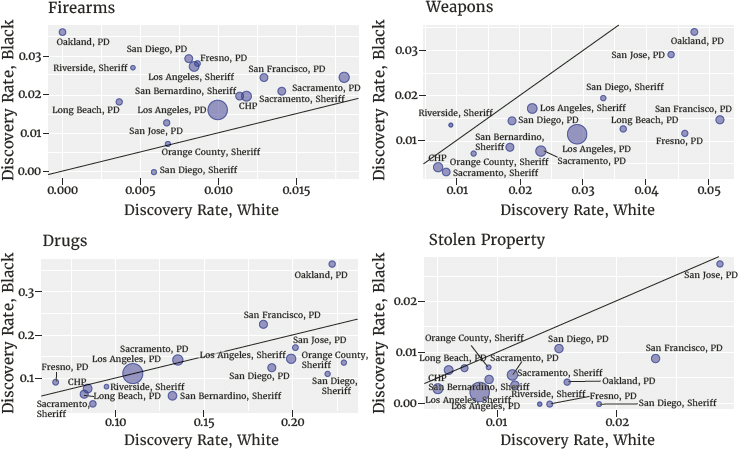
statistically distinguishable) for racial and ethnic minorities relative to White hit rates (RIPA Board, 2020). Figure 2-7 illustrates this fact. The top panel presents a scatter plot of the contraband discovery rate for searches of Black people against the comparable rates for searches of White people, while the bottom panel presents the comparable scatter plot for Hispanic hit rates against White hit rates. The data reveal that, for most agencies, searches of Black and Hispanic people made during police stops are less likely to yield contraband relative to searches of White people. Figures 2-8 and 2-9 break the data down by type of contraband. The exception to the lower minority hit-rate rule involves firearms discoveries. For African Americans, firearm discovery rates are generally higher than the discovery rates for White people, though for most agencies these rates fall in the one-to-three percent of searches range. Firearm discovery rates also tend to be higher among Hispanic people who are stopped compared to White people, but here the difference is less pronounced.
Lofstrom and colleagues (2021) provide a more detailed analysis of racial disparities in hit rates conditional on being searched using 2019 RIPA data. The authors confirm the basic finding in the RIPA annual reports of a slightly lower hit rate for searches of Black and Hispanic stops (with the differences statistically significant). However, they also find that conditioning on the age and gender of the member of the public, the reason for the stop (e.g., moving violation, pedestrian stop), and the basis for the search (e.g., probation parole, reasonable suspicion) widens the disparities. This
SOURCE: Data from Open Justice, California Department of Justice, Racial and Identity Profiling Act database, https://openjustice.doj.ca.gov/
SOURCE: Data from Open Justice, California Department of Justice, Racial and Identity Profiling Act database, https://openjustice.doj.ca.gov/
SOURCE: Data from Open Justice, California Department of Justice, Racial and Identity Profiling Act database, https://openjustice.doj.ca.gov/
suggests that the hit rates for Black searches are even lower relative to White searches for similarly situated stop and search incidents.
Simoiu and colleagues (2017) produce similar hit rate comparisons using the city and state agencies from the Stanford Open Policing Project for stops of Black, Hispanic, and White people where searches are conducted. For Black/White comparisons, they document that there are agencies where hit rates are higher for searches of White people, agencies where they are higher for searches of Black people, and many agencies where they are comparable. A scatter plot of Black hit rates against White hit rates generally reveals similar rates on average across groups, despite the uniformly higher search rates for African Americans. By contrast, Hispanic hit rates for the departments analyzed are uniformly lower than the corresponding hit rates for White searches. The National Academies (2018) review a large literature of department-specific studies that find evidence both suggesting discrimination and suggesting no discrimination based on this particular test.
The hit rate test for search is of course imperfect, for both methodological as well as legal and policy reasons. Regarding methodology, many have pointed out that it is entirely possible for officers to hold African Americans to a higher level of scrutiny and still observe comparable hit rates for Black and White searches. This would be the case if the distribution of Black and White people across risk tranches were such that African Americans were more concentrated in higher risk categories beyond the reasonable suspicion thresholds used by officers.14 Beyond this methodological contention, the hit-rate test is based on a behavioral model of policing that assumes that officers are attempting to maximize contraband discoveries by making group-based probabilistic assessments of the likelihood that someone is carrying. If this is indeed true, behavior aimed at maximizing discovery rates for a fixed number of searches may be unconstitutional, to the extent that Black individuals would otherwise not be searched if they were White. The chapter has documented that Black people are stopped by the police at much higher rates than White people, and among those stopped they are searched at much higher rates. With these two facts in mind, equal hit rates between Black and White searches still leave in their wake a larger swath of the African American population who have been searched by police officers, had nothing discovered, and then been released with just
___________________
14 This is commonly referred to as the inframarginality problem and was first pointed out in the empirical literature debating whether differential mortgage default rates might be used to test for discrimination against Black borrowers by financial institutions. This inframarginality problem prompted Simoiu and colleagues (2017) to develop a methodology for directly inferring whether officers apply differential thresholds to Black motorists who are stopped. The authors find evidence of systematically lower thresholds applied to African Americans and Hispanic people (implying higher scrutiny of minority drivers) for nearly all municipal and state law enforcement agencies included in the Stanford Open Policing Project data.
a warning. Combined with differences in being asked to exit the vehicle, being detained on a curb, and so on, one would imagine that the differential incidence of unproductive searches might create worse relations between local police departments and minority community members.
These tensions between public safety and notions of fairness are not unique to the subject of police stops and vehicle searches. Persico (2009) provides an in-depth treatment of the statistical challenges that face researchers when they attempt to identify bias in police decision by using data that describe racial differences in the outcomes of police decisions, such as patrol locations, stops, searches, and arrests. He shows how difficult it is to formulate convincing statistical tests for bias.
Uses of Force and Police-Involved Shootings
Use-of-force incidents involving police vary in severity and the likelihood of lethality (Alpert and Dunham, 2004). Recent experience has demonstrated that uses of force that are commonly classified as “less serious” can and do result in the death of civilians. Nonetheless, use-of-force incidents are often categorized into less lethal uses of force (e.g., control holds, strikes, the use of chemical sprays or conducted-energy devices [tasers], deployment of a police dog) and lethal force (discharges of firearm).
Use-of-force incidents are relatively rare, with the most lethal uses of force very rare. For example, roughly 2.8 percent of U.S. residents ages 16 and older in 2018 reported experiencing a nonfatal threat or having force used upon them by a police officer in the past year (Harrell and Davis, 2020). However, the data that are available clearly indicate that racial and ethnic minorities are often more than twice as likely as others to experience official use of force (Harrell and Davis, 2020; see also Paoline et al., 2018).
The Police-Public Contact Survey (an addendum the NCVS)15 permits a national-level characterization of these disparities. The most recent year for these data is calendar year 2018. In their analysis of these 2018 data, Harrell and Davis (2020) estimate that while two percent of non-Hispanic White people experience either a threat of force or a less lethal use of force, for minorities the comparable figures are 5.34 percent of Black people, 4.8 percent of Hispanic people, and 1.9 percent of people in an “other” category. For Black and Hispanic people, the relatively higher rates are statistically distinguishable from those for White people concerning experiencing a threat; being handcuffed, pushed, grabbed, hit, or kicked; and having a weapon pointed at them. Weisburst (2019) uses data on response-to-resistance reports for Dallas from 2013 through 2016. The data clearly reveal that African Americans are overrepresented relative to the resident
___________________
15 See https://bjs.ojp.gov/data-collection/police-public-contact-survey-ppcs
population of Dallas among individuals who experience a nonlethal use-of-force incident with the police. Weisburst also notes that the proportion of these incidents experienced by African Americans exactly equals the proportion of arrests of African Americans, but this result is difficult to interpret. Weisburst’s use-of-force definition involves more than simply detaining or handcuffing. She restricts attention to “pushing, grabbing, joint locks, takedowns, and taser use.” If officers always arrest any person that they plan to document using this type of force against, possibly as a way of justifying their decisions to use such force, the patterns Weisburst documents do not constitute evidence against the hypothesis that officers are more likely to use nonlethal force against Black defendants, holding constant the nature of their encounters. Some arrests may be the result of the officer’s decision to use force rather than an indicator that force was justified. These results add to the body of evidence showing high rates of police violence experienced by Black and Hispanic segments of the population (e.g., Geller et al., 2021; Paoline et al., 2018; Ross, 2015; Jacobs, 1998).
A variety of research strategies have been used to study more serious applications of force by police, including shooting and lethal force. Police shootings have been studied experimentally, and in observational studies with police and media reports. Experimental studies have examined “shooter bias,” the tendency to shoot Black or other minority members of the public (Correll et al., 2002). Shooter bias studies examine the effect of race on shoot/don’t shoot decisions in videogame-like simulations. A large number of studies find that experimental subjects are faster and more accurate when shooting an armed Black man compared to an armed White man, and they are faster and more accurate at choosing “don’t shoot” for an unarmed White man compared to an unarmed Black man. Police officers show greater speed and accuracy in correct decision making than community members, but some studies nevertheless show significant levels of racial bias. While reviews conclude there is less bias among police than community members (Cox and Devine, 2016; Correll et al., 2014), shooter bias can be mitigated further by training but increases when police are short of sleep or placed under conditions of high cognitive load (Correll et al., 2014; Ma et al., 2013). While these results are suggestive, it is also true that no studies provide direct evidence that the biases identified in these experiments contribute directly to racial differences in observed rates of death associated with police shootings.
A number of studies compare the use of lethal and nonlethal force and analyze racial disparities in lethal force. Analyzing several sources of micro-data on police encounters with members of the public from several cities, Fryer (2019) tests for racial disparities in the likelihood that less-lethal and lethal force are used conditional on a stop occurring. Using stop data from the New York City (NY) police department as well as national survey data
that queries members of the public regarding recent interactions with the police, Fryer documents sizable racial and ethnic disparities in use of force that cannot be attributed to observable characteristics of the stop. In the analysis of the New York City data, Fryer finds that part of the relatively high rate of use of less lethal force when Black and Hispanic people are stopped is attributable to differences in practice across precincts combined with average differences in where Black, Hispanic, and White people are stopped in the city. This finding suggests that differential policing practices in predominantly Black and Hispanic precincts explain part of the higher use-of-force probability faced by Black and Hispanic people conditional on being stopped.
Using a random sample of arrests for relatively serious offenses (e.g., attempted murder of a police officer, resisting arrest, interfering with an arrest) combined with data on police shootings in Houston, Fryer finds relatively lower likelihoods that such incidents involving Black and Hispanic people result in an officer-involved shooting relative to incidents involving White people. Based on these findings, Fryer concludes that there is evidence of disparate use of less lethal force but no evidence of disparate use of lethal force.
Several authors have contested Fryer’s interpretation of his findings, observing that police killings of Black and Hispanic individuals may result from police bias if the initial encounter with police resulted from bias (Durlauf and Heckman, 2020; Knox et al., 2020; Ross et al., 2018). In a comment on the study published in the Journal of Political Economy, Durlauf and Heckman (2020) note that Fryer’s results effectively test for a differential likelihood of being shot conditional on having been stopped for a small subset of offenses. To the extent that there are race disparities in the likelihood of being stopped (and that this disparity may in itself be the result of discriminatory practices), Fryer’s results do not rule out a relatively higher likelihood that Black people are at risk of being shot by the police relative to a White person with similar pre-stop and post-stop characteristics and behavior. From this perspective, a relatively low death rate conditional on incident characteristics “does not establish credible evidence on the presence or absence of discrimination in police shootings” (Durlauf and Heckman, 2020). The authors go on to note that a conclusion about the role of police bias requires data and an analysis of the process that leads to the police-public interaction in the first place.
Knox and colleagues (2020) provide a particularly nuanced analysis of the problems of testing for discrimination in administrative police data and the likely impact of the lack of information on the process generating stops. Suppose that stops can be grouped into (1) serious incidents where a stop will occur regardless of race, (2) incidents or activities observed by police where a stop will never occur regardless of race, and (3) incidents where Black people are stopped but otherwise similar White people exhibiting
similar pre-stop characteristics and behaviors are not stopped. Analyses that condition on a stop occurring ultimately compare outcomes for stops of White people from group (1) only to outcomes for stops of Black people from groups (1) and (3), leading to selection bias and likely unobserved differences between the average stopped Black person as well as the average stopped White person. Hence, selection bias may lead to mis-estimation of the race disparity in the use-of-force probability conditional on being stopped. Knox and colleagues employ external estimates of the proportion of stops in New York City data that are discriminatory against Black citizens to reanalyze the data and findings in Fryer, providing corrected bound estimates that adjust for the differential stop probability and the likely selection bias in terms of who is stopped. While Fryer’s original analysis finds substantial evidence of discriminatory use of less lethal force, the adjusted estimates presented in Knox and colleagues suggest substantially larger disparities.
There is at least one study that suggests that bias may be in part responsible for the relatively high relative rate at which Black people are shot by the police that avoids the selection bias issue. Hoekstra and Sloan (2022) analyze the outcomes of police who are dispatched through 911 calls in two large (unidentified) cities and test for differential use of force depending on the racial/ethnic composition of the area to which the officer is dispatched and how this interacts with officer race. Officers in these cities cannot turn down the dispatch request, and characteristics of the calls and the neighborhoods from which the calls for service originate are unrelated to officer characteristics. The study finds that calls from Black and Hispanic neighborhoods are more likely to result in the use of less lethal as well as lethal force. Moreover, they find evidence of a differential impact by officer race—that is, the effect of an increase in the proportion of the neighborhood that is minority on the likelihood of an officer-involved shooting is greater for White officers relative to Black officers.
At least part of the debate stems from the limited availability of data on the use of force and the reliance on police reports (Knox et al., 2020; Goff et al., 2016). A number of data collection efforts have emerged over the last few years that aim to independently record at the national level the number of police shootings and killings (Goff et al., 2016; Ross, 2015). A team of investigative reporters from the Washington Post maintain a database of all fatal incidents that involve police shooting citizens, beginning in January 2015. The committee employs the Washington Post data, in part because no national data source tracking killings by police is reliable. A 2019 study published in the Lancet indicates that the National Vital Statistics System does not provide data that allow researchers to construct accurate counts of citizens who die at the hands of police officers. Here, the chapter summarizes Washington Post data posted through the middle of July 2021.
The Washington Post data do not contain all incidents where citizens die as a result of encounters with police. For example, George Floyd is not one of the victims in this dataset because he was not shot. However, most citizen deaths during police encounters are shooting deaths. The results in Table 2-8 combine the Washington Post data on police shootings with population data from 2018 to create shooting deaths per 100,000 persons at the hands of police over the 6.5-year window covered in the newspaper’s data. Table 2-8 presents results by census region, by race, and by race within regions.
The data reveal stark racial disparities. Overall, Black citizens are roughly twice as likely as Hispanic people to be shot and killed by police and two and one-half times more likely than White people. Further, in every region of the country, Black citizens are significantly more likely to die in a police shooting.
We also see striking regional variation in the incidence of police shootings. Police shootings are four times more common in the West than in the Northeast, despite lower relative police staffing levels on the West Coast. Further, there are large differences in the rates of fatal police shootings in the West versus the Northeast within every race category. Note that these regional differences are so large that the rate of fatal police shootings among Black people in the Northeast is only four percent greater than the rate of fatal police shootings among White people in the West.
Relative rates of fatal police shootings by race follow regional patterns that may surprise some readers. Black people in the Northeast are least likely to be fatally shot by police, but the ratio of fatal police shootings among Black residents relative to White residents is greatest in the Northeast at 4.31. The ratio of deaths from police shootings among Black versus White
TABLE 2-8 Persons Killed by Police per 100,000, by Region and Race/Ethnicity, 2015–2021
| All | White | Black | Hispanic | |
|---|---|---|---|---|
| All | 2.41 | 1.48 | 3.75 | 1.81 |
| Northeast | 0.93 | 0.54 | 2.33 | 0.55 |
| Midwest | 1.64 | 1.07 | 4.43 | 0.98 |
| South | 2.65 | 1.85 | 3.38 | 1.28 |
| West | 4.14 | 2.24 | 7.36 | 2.94 |
NOTE: The database includes incomplete information on race and ethnicity; for example, in the data for 2021, race and ethnicity is unknown for almost half of the entries.
SOURCE: Tabulations based on the Washington Post database, nationwide and by broad regions within the United States (2022), https://www.washingtonpost.com/graphics/investigations/police-shootings-database/
people is also greater than four in the Midwest. The South has, by far, the lowest Black/White ratio of deaths from police shootings: 1.83.
Hispanic people are equally or less likely than White people to be shot and killed by police in the Northeast, Midwest, and South, and are most likely to be fatally shot by police in the West. This result holds whether we measure risk in levels, relative to the comparable risk for White people, or relative to the comparable risk for Black people. This elevated risk in the West drives the national disparity between White and Hispanic people in the risk of becoming the victim of a fatal police shooting.
The Washington Post data only provide descriptions of encounters that involved a shooting death. Thus, these data do not allow an analysis like Fryer’s (2019) that estimated the likelihood of police killing a Black or a White citizen conditional on characteristics of the encounter, nor can we assess whether the encounter itself resulted from police bias. However, the data we do have provide no evidence that contradicts Fryer. The data we review above indicate that Black citizens have much higher rates of violent offending. Furthermore, Black citizens are much more likely than White citizens to kill police officers. A 2020 report from BJS documents shootings of police by citizens during the period 2010–2019 (BJS, 2020). During these 10 years, 537 police officers were feloniously killed by citizens. In 303 cases, the assailant was White, and in 199 cases, the assailant was Black. Using 2015 estimates of national populations by race, we calculate the relative rates at which Black citizens versus White citizens kill police, and this ratio is greater than three. BJS does not report the Hispanic origin of offenders who kill police, so we cannot produce comparable results for Hispanic people. Further, the committee conjectures that most Hispanic assailants of officers are coded as White, which means that the report is likely overstating the relative rate at which White people kill police.
Table 2-8, describing population exposure to police shooting, indicates that, regardless of race, the risk of being shot is lowest in the Northeast, and among Black people the reduction in risk associated with relocation to the Northeast is quite large. In future work, researchers who seek to understand racial disparities in rates of police shootings need to confront the striking differences within race among different regions of the country.
The most complete data concerning the circumstances surrounding the shootings cover the incidents recorded in 2015. According to our correspondence, less than 10 percent of all police shootings occurred in settings where records document no threat to police officers. Furthermore, less than one percent of victims were fleeing from police on foot when they were shot.16
___________________
16 The committee thanks Amy Brittain for providing these results and information about the data collection process.
Nature of Interactions between Police and the Public
Additional research examines the nature of interactions between police and the public, beyond lethal and nonlethal force. This literature is summarized in depth in a report by the National Academies (2018), which reviews the way people evaluate their experiences with and impressions about what police do, how policing affects the way people orient toward the police as an institution (i.e., do they view policing as legitimate?), and how policing affects the ways that people behave toward the police, the law, and their communities (i.e., do the police behave in ways that strengthen the community’s collective efficacy and thereby facilitate the creation of social capital among members of the community? See the National Academies, 2018, p. 179).
A large literature finds that African Americans report more negative experiences in their interactions with the police than other groups (see, e.g., Voigt et al., 2017; Hetey et al., 2016; Epp et al., 2014). Across numerous studies, for example, African Americans report being treated less fairly and respectfully in their contacts with the police than White people (Peffley and Hurwitz, 2010; Tyler and Huo, 2002). Indeed, some have argued that racial disparities in perceived treatment during routine encounters help fuel mistrust of police. Using footage from body-worn cameras, Voigt and colleagues (2017) analyze the respectfulness of police officer language toward White and Black community members during routine traffic stops. They find that officers speak with consistently less respect toward Black versus White community members, even after controlling for the race of the officer, the severity of the infraction, the location of the stop, and the outcome of the stop. Similarly, Camp and colleagues (2021) use footage from traffic stops to examine how officers communicate to drivers and whether racial disparities in officers’ communication erode institutional trust in the police. Specifically, they consider the cumulative effects of an officer’s tone of voice, which is a subtle interpersonal cue, and demonstrate that nonverbal aspects of police interactions shape how individuals construe the police generally and that racial disparities in intonation undermine trust in institutions such as police departments. The authors further conclude that participants’ trust in the police and their personal experiences of fairness correlated with their perceptions of officer prosody across studies, illustrating a cycle through which interpersonal aspects of police encounters erode institutional trust across race (Camp et al., 2021).
EVIDENCE CONCERNING PUBLIC SAFETY DELIVERY
Given the evidence that some African American communities are policed too aggressively, it is important to examine the impact of aggressive police practices on public safety. It is difficult to give precise answers to
this question. Victimization rates for Black, Hispanic, and Native American people tend to be the same or higher than comparable rates for White people, but it is difficult to know what portion of these differences is due to failure by police or higher baseline offending rates in communities that have been historically disadvantaged. Moreover, it is difficult to precisely estimate the degree to which policing lowers crime rates, though existing empirical evidence (reviewed in Chapter 10) consistently finds that high police staffing levels reduce serious crime rates.
Data on clearance rates provide one benchmark for police performance. It is well known that murders involving White victims are considerably more likely to be cleared by arrest or by exceptional means17 relative to murders involving Black victims (Fagan and Geller, 2018). We document this pattern in Figure 2-10. Specifically, using data from the Supplementary Homicide Reports for all reported murders occurring from 2000 to 2019, we tabulate the proportion of cases where information is reported for an identified assailant.18 Technically, this does not necessarily mean that the case was cleared, since the assailant’s characteristics may be known even when an arrest has not been made and the case has not been cleared via exceptional means. Moreover, cases reported in the Supplementary Homicide Reports may be cleared following reporting of the incident. However, the disparities we observe in these data are consistent with race disparities in clearance rates reported in other data sources.19
___________________
17 Most homicides are cleared officially by the arrest of a suspect. In some instances, homicides are cleared without an arrest, often when the suspect dies on scene. This is called an exceptional clearance. Exceptional clearances also include, for example, declines to prosecute and refusals of cooperation by crime victims. Studies report that high rates of exceptional clearances have been reported for cases with female victims (e.g., Walfield, 2016; Jarvis and Regoeczi, 2009).
18 Note that clearance requires an arrest of a suspect or a clearance by other means (e.g., when the perpetrator dies at the scene). We use the fact that information was reported about the assailant in the Supplementary Homicide Reports (SHR) as a proxy for arrest. Note also that SHR can be updated in subsequent years when arrests are made at a point beyond the initial reporting into the SHR.
19 The Trace and Buzzfeed have assembled data on violent crimes inclusive of homicides in 22 cities along with information on whether the incidents are cleared by an arrest or exceptional means. These data cover violent offenses occurring roughly between 2010 through 2017. See https://github.com/the-trace-and-buzzfeed-news/local-police-data-analysis. We tabulated the percentage of homicides in these data cleared by arrest or some other means by the condensed victim-race category created by the Trace/Buzzfeed researchers. For the homicide incidents in these data, the percent cleared is approximately 48 percent for victims placed in the Black/Hispanic category, 60 percent for the victims placed in the other/unknown race category, and 65 percent for victims placed in the White category. While the clearance rates in these data are lower than the percentages of cases in the Supplementary Homicide Reports (SHR) with reports about offender characteristics, the cross-group disparities are quite similar. For example, the White-Black victim difference in the SHR data is 18 percentage points, while the White-Hispanic victim difference is 15 percentage points. By comparison, the difference in clearance rates between

SOURCE: Tabulations from the Federal Bureau of Investigation Supplementary Homicide Reports, https://ucr.fbi.gov/crime-in-the-u.s/2019/crime-in-the-u.s.-2019/topic-pages/expanded-homicide
Murders involving African American victims have the lowest clearance rate (roughly 62%), with clearance rates for Hispanic people the second lowest (also below 65%). Murders involving American Indian and White victims have the highest clearance rates, with over 80 percent of cases for both groups cleared.
Some advocates and researchers argue that crime rates are higher in African American communities than official data indicate because African Americans are reluctant to report crimes to the police. Further, some argue that clearance rates are low in African American communities because local residents refuse to cooperate with police. The first argument suggests that the lack of protection in African American communities is greater than the data imply. The second implies that clearance rates are low in African American communities for reasons beyond the control of the police, although some might contend that better police-community relationship in predominantly minority communities would improve cooperation.
We find limited evidence in favor of either argument. Even though there is clear evidence that police employ aggressive tactics in African American communities, African American crime victims are by far the most likely to
___________________
homicides involving White victims and homicides involving Black victims for the 22 cities in the Trace database stands at 17 percentage points.
report what happened to them to the police. We again use victimization survey data (from the NCVS) to document this fact. Given that the NCVS bases victimization rates on individual-level survey responses and asks about follow-up actions to a crime, we are able to measure whether the person experiencing the crime reports the offense to the police. We are also able to observe the demographics of the perpetrator of the offense, an issue that we will discuss in detail in the next section. Tables 2-9 and 2-10 present estimates of whether households or individuals who experience crimes report them to the police by the race/ethnicity of the victim.
In Table 2-9 we observe within each racial/ethnic group familiar patterns regarding difference in reporting across the different categories of property offenses. Motor vehicle thefts are the most likely to be reported to the police. This is not surprising, since motor vehicle thefts often result in insurance claims and the need for official documentation of the incident. Burglaries and other thefts are reported at lower rates. African American households have the highest overall reporting rates for property offenses, with the largest positive differential in reporting rates between Black households and other households being the rate observed for burglaries.
In Table 2-10 we see that African American victims of violent crime also have the highest reporting rates both overall and for each of the serious violent offenses except for rape. For all violent offenses, 66 percent of African American victims report the crime to the police compared to 56 percent of Hispanic victims, 52 percent of White victims, and 49 percent of American Indian victims.
Hence, minority victims of serious violent offenses are generally as likely if not more likely to report the incidents to police. When we consider
| All Property Offenses | Burglary | Motor Vehicle Theft | Other Theft | |
|---|---|---|---|---|
| White | 0.35 | 0.51 | 0.77 | 0.29 |
| Black | 0.37 | 0.60 | 0.78 | 0.27 |
| Amer. Ind./Aleut. | 0.33 | 0.50 | 0.62 | 0.25 |
| Asian/PI | 0.36 | 0.54 | 0.89 | 0.29 |
| More than one race | 0.29 | 0.38 | 0.55 | 0.25 |
| Hispanic | 0.34 | 0.52 | 0.77 | 0.26 |
NOTE: The race/ethnicity categories used in this table are mutually exclusive.
SOURCE: Figures tabulated from the concatenated National Crime Victimization Survey files, https://doi.org/10.3886/ICPSR38136.v1
| All Serious Violent Offenses | Rape | Robbery | Aggravated Assault | |
|---|---|---|---|---|
| White | 0.52 | 0.31 | 0.56 | 0.58 |
| Black | 0.66 | 0.46 | 0.69 | 0.68 |
| Amer. Ind./Aleut. | 0.49 | 0.66 | 0.39 | 0.49 |
| Asian/PI | 0.37 | 0.17 | 0.51 | 0.38 |
| More than one race | 0.37 | 0.13 | 0.49 | 0.47 |
| Hispanic | 0.56 | 0.29 | 0.57 | 0.64 |
NOTE: The race/ethnicity categories used in this table are mutually exclusive.
SOURCE: Figures tabulated from the concatenated National Crime Victimization Survey files, https://doi.org/10.3886/ICPSR38136.v1
racial differences in clearance rates, we must remember that clearance rates are incidents cleared divided by incidents reported. The low clearance rates we observe in minority communities are low rates of clearing crimes that someone, who was likely a member of the victim’s community, reported to police. This pattern is consistent with historical evidence of racial bias in police neglecting to pursue accountability among crime victims in Black communities. We cannot rule out the possibility that low clearance rates in minority communities may reflect racial differences in levels of cooperation with police. Residents of minority communities that are plagued by gang violence may fear retribution if they cooperate, and even if the risks of retribution are small, residents who live in communities where police rarely clear crimes, even homicides, may reason that the returns from cooperating are low while the risks are high.
Whether police can affect clearance rates through increased effort and resources devoted to working cases is an active debate among criminologists. A highly cited early study by Greenwood and Petersilia (1975) concluded that whether a homicide is cleared by arrest or exceptional means tends to be a function of conditions beyond the control of the police, such as whether someone is apprehended at the scene, whether witnesses come forward and are cooperative, and the nature of the incident (for example, whether the homicide derived from a domestic dispute as opposed to resulting from a robbery or a gang related conflict). While researchers have challenged this conclusion over the previous four decades (see, for example, Wellford and Cronin, 1999), until recently there has been little by way of
careful quasi-experimental or experimental research documenting a causal relationship between effort/resources and crime clearance.
However, a recent study by Cook and colleagues (2019) strongly suggests that policing and investigations are quite central to solving many homicides as well as nonfatal aggravated assaults involving a gun injury. Using detailed data for Boston (MA) on all gun homicides occurring between 2010 and 2014 as well as a random sample of cases where an aggravated assault victim is shot yet survives, the study first documents that these two sets of cases are statistically indistinguishable from one another along most dimensions, including characteristics of the victim and the nature of the incident. Their analysis implies that whether the victim of a gun assault dies is as good as random conditional on being injured by a firearm. However, incidents where the victim dies (or where it is deemed early on that the victim is likely to die) are treated differently. Homicide cases are worked by homicide detectives, who have lighter caseloads, have claim to crime laboratory and forensic investigatory resources that are typically not as available for nonfatal gun assaults, more carefully manage and collect evidence at crime scenes, and make more intensive efforts over the coming weeks, months, and sometimes years in pursing leads, identifying witnesses, and encouraging those with knowledge to come forward. The authors find very little difference in clearance rates between the two sets of cases occurring within two days or even two weeks of the incident. However, between two weeks and six months, and also between six months and a year following the incident, very large differences in clearance rates emerge, suggesting that the initial differences in resources devoted to the case as well as the sustained investigatory efforts increase the likelihood of an arrest.
The study by Cook and colleagues relies on data originally collected for a quasi-experimental evaluation of an effort by the Boston Police Department to increase homicide clearance rates. In 2011, the department conducted an extensive assessment of its homicide investigations with the aim of generating and implementing a set of recommendations that would increase department-level homicide clearance rates, which were far below the national average. Braga and Dusseault (2018) compare homicide investigation before and after the reforms were implemented and document that relative to the pre-reform period, post-period investigations had more homicide detectives assigned to each case, were more likely to have a homicide supervisor on scene, had more crime-scene response unit officers on the crime scene, increased the number of witness interviews after the crime scene investigation, were more likely to find latent prints on the scene, were more likely to have the forensic unit on the scene, were more likely to collect DNA evidence, and were more likely to use follow-up computer searches as part of the investigation. The study finds a notable pre-post increase in homicide clearance rates as well as an
increase relative to clearances for all other homicides in Massachusetts over the same period.
This latter research suggests that while incident circumstances are clearly important determinants of the likelihood of a clearance, there are factors under the control of police that—through sustained effort, careful crime scene processing, and careful and systemic management of the investigation and follow-up activities—can increase the likelihood of an arrest. Cook and colleagues (2019) additionally argue that devoting more resources to clearing nonfatal shootings (given the large disparity in clearance rates) may go long a way in reducing gun violence overall through a stronger deterrent and through interruption of retaliatory violence.
PRETRIAL DETENTION
According to BJS, the average jail population for 2019 was about 740,000 U.S. citizens. This large population of jail inmates is an important source of racial disparities in the criminal justice system. Between 2005 and 2019, per-capita jail populations for Black people averaged well over three times the rates for both White and Hispanic people.20 Further, a growing literature attributes part of this racial disparity in jail populations to the common practice of requiring defendants to post cash bail in order to be released from jail between their preliminary hearings and the resolution of their cases. A growing body of research indicates that the existing Black jail population would be significantly smaller in absolute and relative terms if the pretrial detention decisions generated by courts reflected only the relative risks that defendants will fail to appear in court or commit a new crime while waiting for their court dates. Cash bail expands jail populations, especially among economically disadvantaged groups, because it links release directly to a defendant’s capacity to pay bail, even in cases where defendants are charged with minor crimes and have no desire to flee prosecution. Monetary sanctions have been studied as being linked to broader patterns of racial and economic inequality (Harris et al., 2022; see Chapter 4 for more on fines and fees).
In 2019, the roughly 740,000 people in jail on any given day represented more than one-third of the roughly 2.1 million persons who were incarcerated on that day.21 Some of these jail inmates were serving short sentences associated with convictions for relatively minor offenses, but Sawyer and Wagner (2020) report that more than 500,000 of these persons
___________________
20 See Figure 1 in Jail Inmates in 2019 (Zeng, 2021). We draw on this report for the several descriptive statistics we discuss below.
21 See Table 1 in Correctional Populations in the United States, 2019–Statistical Tables (Minton et al., 2021).
had not yet been convicted of the charges brought against them.22 Thus, roughly one-fourth of the persons incarcerated in the United States were in a local jail or in the custody of the U.S. Marshals Service waiting for the resolution of a case.
This 500,000-person count for 2019 is a stock measure for the jail population on an average day. The total number of people who spent weeks or months in jail waiting for a verdict is likely much greater. Further, a significant fraction of those who spent weeks or months in jail waiting for a verdict were not denied bail outright. In many cases, judges set a cash bail amount that defendants are not able to raise. One of the challenges facing researchers in this area is the fact that researchers have no clear way to label cases where the judge set a cash bail expecting that the defendant would likely be released versus cases where the judge intended the bail amount to prevent release. However, in some jurisdictions, the majority of defendants in jail waiting for a verdict could be waiting at home if they had greater access to cash.23 Given the significant income and wealth differences between White defendants and Black or Hispanic defendants, cash bail is an institution that, by design, exacerbates racial disparities in incarceration.
In addition, research suggests that pretrial detention systems built around cash bail do not effectively detain the defendants who are most likely to flee or commit new crimes if released, and Kleinberg and colleagues (2018) claim that it is possible to shrink jail populations by at least one-fourth without increasing the rates at which defendants facing charges either fail to appear in court or commit new crimes. The authors employ data from New York City and argue that these gains are possible if New York courts replace cash bail systems with a pretrial system that bases release decisions on statistical measures of the risks associated with releasing each defendant. The authors study pretrial detention using data from late 2008 to late 2013. They use a machine learning algorithm to predict the probability that a given defendant will fail to appear in court or will commit a new crime if the court grants pretrial release. This estimation problem is challenging, because the data only contain the outcomes of interest for the select sample of defendants that bail judges released directly or set bail amounts such that the defendants were able to post the required amount and gain release.
Nonetheless, the authors provide compelling evidence that some judges release many risky defendants. Failure-to-appear rates and crime rates are high among defendants whom judges release even though the authors’
___________________
22 See https://www.prisonpolicy.org/reports/pie2020.html
23 For example, Cook County, IL, has been reforming its pretrial detention rules for several years. Yet, around 2010, judges in Cook County assigned cash bail to more than 80 percent of felony defendants.
algorithm correctly labels them as “risky.” It is impossible to determine whether these judges fail to understand that certain types of defendants are “risky” or whether they often guess wrong concerning a defendant’s capacity to pay a certain bail amount. However, these mistakes are so infrequent that the authors claim it is possible to shrink jail populations significantly without any costs to public safety by basing release decisions on algorithmic risk scores. This reform would result in the detention of more high-risk defendants and the release of a much greater number of low-risk defendants, who now often remain in jail because they do not have the resources to post even modest bail amounts.
At least four states, including New York, have recently begun or completed efforts to reform pretrial detention rules, and the elimination of cash bail is central to many of these reform efforts. Researchers are also actively studying the optimal way to create the risk scores that serve as the key input in proposed systems that are alternatives to cash bail. In Chapter 8, we return to these reform efforts and discuss how a growing research literature on pretrial detention can inform these efforts.
While there is little research on the racially disparate impacts of bail reform, there is existing research suggesting that reductions in pretrial detention are likely to disparately impact case outcomes for African American defendants. MacDonald and Raphael (2020) study the disparate impacts of a reform that narrowed the definition of felony offenses. In late 2014, California voters passed Proposition 47, which redefined a set of less serious felony drug and property offenses as misdemeanors. The authors examine how racial disparities in criminal court dispositions in San Francisco changed in the years before (2010–2014) and after (2015–2016) the passage of Proposition 47. The study decomposes racial disparities in court dispositions into components due to racial differences in offense characteristics, involvement in the criminal justice system at the time of arrest, pretrial detention, criminal history, and the residual unexplained component. Before and after Proposition 47 case characteristics explain nearly all of the observable race disparities in court dispositions. However, after the passage of Proposition 47 there is a narrowing of racial disparities in convictions and incarceration sentences that is driven by lesser weight placed on criminal history, active criminal justice status, and a reduction in the racial disparity in pretrial detention in effecting court dispositions. The findings from this study suggest that policy reforms that scale back the severity of punishment for criminal history and active criminal justice status for less serious felony offenses may help narrow racial inequalities in criminal court dispositions. Efforts to reduce the impact of racial inequalities in incarceration in other states should consider reforms that reduce the weight that criminal history, pretrial detention, and active probation status have on criminal defendants’ eligibility for prison for less serious drug and property offenses (Jordan et al., 2022).
PLEA BARGAINING, TRIALS, AND SENTENCING
After defendants are arrested, several outcomes are possible. The state’s attorney may drop the charges due to lack of evidence. A judge may dismiss the case because it fails to meet some legal standard. A trial may produce a verdict of guilty or not guilty. Yet, the most common outcome involves a plea agreement. The state’s attorney typically offers each defendant a promise that, if he or she enters a plea of guilty, the judge will assign a sentence that is known ex ante and much less severe than the expected sentence if the defendant insists on a trial and loses.
Many researchers worry that prosecutors offer less generous plea deals to Black defendants than to White defendants. This concern arises, at least in part, because Black defendants are much more likely to remain in jail between arrest and sentencing. Thus, in any court where it takes significant time to schedule and conduct trials, Black defendants are likely to find it more costly to demand a trial, and this gives prosecutors extra leverage when making plea bargain offers to Black defendants. The power of prosecutorial discretion in plea bargaining may be strongest in jurisdictions with presumptive sentencing guidelines (Piehl and Bushway, 2007).
Rehavi and Starr (2014) provide compelling evidence that prosecutors in federal courts discriminate against Black defendants by selecting initial charges that are both inflated and associated with long mandatory sentences. This practice gives them extra leverage that allows them to get Black defendants to accept less favorable plea bargains, which typically involve entering a guilty plea to slightly less serious charges. Tuttle (2019) also finds evidence that federal prosecutors discriminate against Black defendants facing drug charges, and similar to Rehavi and Starr (2014), he finds that prosecutors discriminate by manipulating the initial charge.
Jordan (2021) examines data from Cook County (IL). Here, the charging decision is not made by the prosecutor who constructs plea bargain offers, but Jordan still finds some evidence that is consistent with the view that prosecutors make less favorable plea bargain offers to Black defendants. However, Jordan also concludes that banning plea bargains and forcing all cases to be resolved through bench trials would likely harm Black defendants. Plea deals are a form of insurance, and Black defendants in Cook County often face initial charges that result in significant prison time if they are found guilty at trial.
Jordan (2021) concludes that, in Cook County, the most important source of racial bias in the plea-bargaining process is that police bring more weak cases against Black defendants. Cases that are so weak that the defendant would stand a good chance of winning at trial are much more common among Black defendants. However, because defendants are risk-averse, state’s attorneys can often get these defendants to plead guilty to some charge.
SENTENCING AND CORRECTIONAL TRENDS
The previous sections have shown that arrest decisions by police, charging decisions by police and state’s attorneys, and plea-bargaining practices by state’s attorneys all play a role in shaping the sentences that judges assign to convicted offenders. However, the priorities and preferences of judges also constrain the types of deals that a state’s attorney can offer, and the laws that govern sentencing constrain the sentencing decisions of judges whether a case ends with a guilty plea or a guilty verdict following a trial. Here, we discuss corrections populations while paying specific attention to the development of laws that govern sentencing.
Correctional populations in the United States fall into two broad categories: (1) people physically detained in either a local jail or state or federal prison, and (2) people who have been sentenced and are under some form of community corrections supervision. The former category includes both individuals who are detained while awaiting trial (commonly referred to as pretrial detainees) as well as sentenced individuals serving time in jail or prison. People in the latter category include both individuals who have been sentenced directly to community supervision, usually under threat of a prison or jail term should they violate the conditions of their sentence, as well as people who have been released from a prison or jail sentence yet are still under correctional supervision, effectively serving the remainder of their sentence in a non-carceral setting.
The steep increase in U.S. correctional populations during the last quarter of the 20th century has been widely studied (Neal and Rick, 2016; NRC, 2014; Raphael and Stoll, 2013). The principal factors driving the steep increase in prison, jail, and community corrections populations were punitive shifts in sentencing policy that both increased the proportion of felony sentences punished with a prison term and increased the length of prison terms for specific offenses. The specific forms these policy shifts took varied across correctional systems—that is, the various state and federal criminal codes governing sentencing—though there are common elements. Sentencing generally became more determinate (fixed rather than open terms with minimum and maximum sentences); more severe for defendants with a criminal history; laden with enhancements for factors such as using a firearm, being affiliated with a gang, or crossing a quantity threshold for controlled substances; and more subject to binding constraints associated with various mandatory minimum sentences.
Rates of incarceration grew for all groups during the late 1970s and 1980s as prison time became more likely given arrest for a broad range of offenses, and this shift in policy had a clear disparate impact on African Americans, who are arrested at higher rates than other groups. Figure 2-11 presents incarceration rates per 100,000 for several racial/ethnic groups
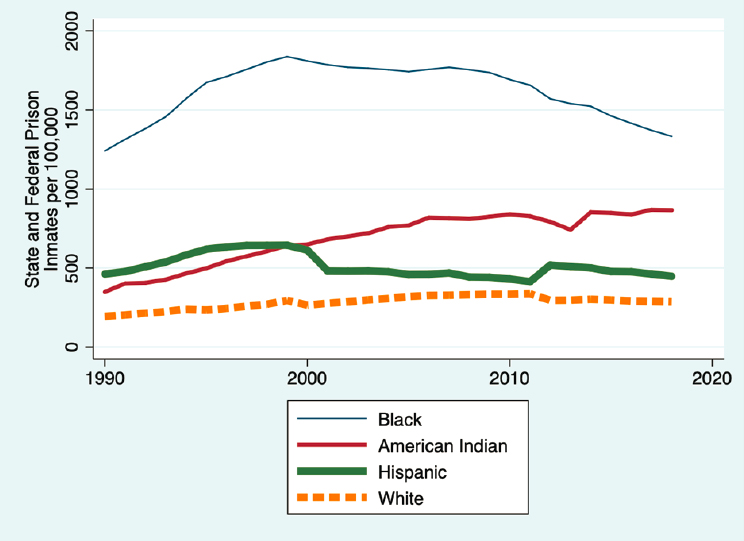
SOURCE: Data from the Bureau of Justice Statistics. Generated using the Corrections Statistical Analysis Tool, https://csat.bjs.ojp.gov/
reported in the National Prison Statistics database for the years 1990 through 2018.24 The Black prison incarceration rate peaks in 1999 at 1,837 per 100,000 and then declines each year until it reaches 1,333 per 100,000 by 2018, a 28 percent decline relative to the peak year. Over this period, the absolute Black/White disparity in incarceration rates also declines, from 1,524 per 100,000 in 1999 to 1,047 per 100,000 in 2018. Moreover, the Black/White incarceration rate ratio declines from 6.23 to 4.24.
Over this same period, the Hispanic/White incarceration rate differential narrows from 349 per 100,000 to 141 per 100,000, while the Hispanic/White incarceration rate ratio declines from 2.18 to 1.56. The one group for whom we see a trend in the opposite direction is American Indian people. For American Indian people we see a widening in both absolute and relative incarceration rates relative to White people, with
___________________
24 We tabulated incarceration rates, combining incarceration totals from the National Prison Statistics database for each year with population estimates of race interacted with ethnicity tabulation and publicly posted by the CDC.
the absolute incarceration rate differential increasing form 348 in 1999 to 579 in 2018 and the corresponding ratios increasing from 2.18 to 3.02.
As with arrest and victimization trends, trends in correctional population skew heavily toward males and people with less formal education. Prison populations tend to be older relative to the composition of arrests, given that many in prison are serving long terms for offenses committed at a relatively young age. While these patterns exist within racial groups, the gender and educational disparities are largest among African Americans, with less educated Black men experiencing the highest incarceration rates in the country.
EXECUTIONS
In 1972, the Supreme Court ruled in Furman v. Georgia25 that the death penalty as applied in Georgia law and in many other states was unconstitutional. A key argument against the existing statutes centered on the observation that juries had great discretion and little guidance when deciding whether to assign death or a term of confinement in prison as a punishment. Further, the history of death penalty verdicts left no doubt that jurors could and did use their discretion to discriminate against Black defendants. Steiker and Steiker (2016) report that between 1930 and 1967, state corrections systems executed 455 inmates convicted of rape.26 Of that total, 405 inmates were Black, even though the Black population was roughly 12 percent of the U.S. total over this period. Wolfgang and Riedel (1973) in their analysis of capital sentencing for rape concluded that “there has been a patterned systematic, and customary imposition of the death penalty… sentences of death have been imposed on blacks, compared to whites, in a way that exceeds any statistical notions of chance or fortuity” (p. 133).
Between 1972 and 1976, 35 states passed new death penalty laws that sought to address the process requirements spelled out in Furman v. Georgia. The U.S. Supreme Court, in a series of 1976 decisions, upheld most of these new laws. In 1977, the Supreme Court held in Coker v. Georgia27 that the death penalty for the rape of an adult woman was grossly disproportionate and excessive, and thus unconstitutional under the Eighth Amendment. In the years following Furman, the country moved from an abolition to a regulation regime. The death penalty enjoyed robust support in many state legislatures, but these new laws applied only to cases of murder with aggravating circumstances and required courts to reach
___________________
25 408 U.S. 238 (1972); see https://supreme.justia.com/cases/federal/us/408/238/
26 Our account of the legal history of death penalty litigation draws heavily on Chapter 2 of Steiker and Steiker (2016).
27 433 U.S. 584 (1977); see https://supreme.justia.com/cases/federal/us/433/584/
each death penalty verdict in a separate post-trial proceeding where judges or juries received guidance concerning the details of the crime and the characteristics of the defendant that should be considered when deciding whether to assign the extreme penalty of death.
In one of the 1976 decisions, Woodson v. North Carolina,28 the Supreme Court also ruled that states could not make the death penalty mandatory for any offense. The High Court argued that North Carolina could not simply make the death penalty mandatory as a way of addressing the concern it had raised earlier in Furman v. Georgia—about the capricious use of the death penalty—because the North Carolina law imposed the same death penalty on individuals who had committed crimes under greatly varying circumstances and given varied criminal histories. Since Black people are arrested for murder more than other groups, mandatory death penalties would likely have created even larger racial disparities in execution rates.
Further, even if one examines only the population of persons arrested for murder, allowing mandatory death sentences could have increased conditional racial disparities in the use of the death penalty. Prosecutors have discretion when choosing charges to file, and if juries feel any affinity for a defendant, they may be reluctant to find him (or her) guilty if he faces the death penalty. Thus, mandatory death sentences could have generated racially biased behavioral responses that made racial disparities in executions worse, holding constant racial disparities in homicide arrest rates.
Given the tighter regulation of death penalty cases after 1976, researchers have tried to determine whether racial bias still drives disparate application of the death penalty. Since 1976, corrections systems in the United States have executed 1,542 people.29 Thirty-four percent of these people were Black, and 56 percent were White. Over this period, Black persons were, on average, just over 12 percent of the U.S. population, meaning Black citizens have been overrepresented in the sample of executed persons by a ratio of almost 3:1. White and Hispanic people have been underrepresented. As of the fall of 2021, racial disparities in the number of people on death row are even more striking. More than 40 percent of the almost 2,500 people facing an execution sentence are Black; and both White and Hispanic persons are underrepresented. These ratios suggest racial bias in the application of the death penalty, but as we note above, arrest rates for violent crime are much higher among Black people than other racial groups, and no data exist on aggregate counts of arrests for offenses that are death penalty “eligible.”
However, a significant research literature addresses the question of racial bias using more granular data. The Supreme Court heard part of this
___________________
28 428 U.S. 280 (1976); see https://supreme.justia.com/cases/federal/us/428/280/
evidence in McCleskey v. Kemp30 (1987). Warren McCleskey, a Black defendant, received the death penalty for murdering a White police officer in Atlanta (GA). McCleskey later challenged the constitutionality of his death sentence on the grounds that statistical work by Baldus and colleagues (1983) showed that the races of both defendants and victims predicted the use of the death penalty in Georgia even after Furman. The Supreme Court’s 5–4 majority said that statistical patterns could not prove racial bias in the administration of the defendant’s particular sentence. Several years later, Baldus and colleagues (1990) published their findings from Georgia and other states. Using regression models that control for case characteristics, they conclude that Furman v. Georgia reduced but did not eliminate disproportionate use of the death penalty as a sentence for Black defendants, and evidence for this disparity is quite robust in cases involving White victims. Baldus and colleagues concluded that racial disparities in the capital cases they examined were concentrated in the middle of their seriousness scale—where prosecutors and judges had more discretion to decide whether to charge a case as a capital case or impose a death sentence.
Reviews of research on death penalty sentencing report that many studies find evidence that Black defendants are more likely than White defendants to receive the death penalty. However, the vast majority of credible studies find that the presence of a White victim enhances the likelihood of a death sentence, and this effect is stronger when a Black defendant is accused of killing a White victim (see, e.g., Baumgartner et al., 2015; U.S. General Accounting Office, 1990). Prosecutors have been found to be more likely to seek the death penalty in the case of Black defendants and White victims (Paternoster, 1984). Phillips and Marceau (2020) also argue that conditional on receiving a death sentence, prisoners are more likely to be executed if their victim was White. Some indication of how bias may be working against Black defendants is provided by psychological research. Among those accused of killing a White victim, Eberhardt and colleagues (2006) find that defendants with stereotypically Black features (e.g., broad nose, thick lips, dark skin) are more likely to receive the death penalty.
Existing evidence that the differences in the race of victims and defendants predict the use of the death penalty in otherwise comparable cases is particularly noteworthy, given the growing awareness that a nontrivial number of persons have been sentenced to death who are innocent. Since 1973, 186 persons on death row have been exonerated (Death Penalty Information Center, 2022a). In 2003, George Ryan ended his term as governor of Illinois by commuting 167 death sentences to life in prison. Ryan acted in response to evidence that a number of persons sentenced to death in Illinois were innocent persons who gave false confessions while being
___________________
30 481 U.S. 279 (1987); see https://supreme.justia.com/cases/federal/us/481/279/
tortured by police. Further, Gross and colleagues (2014) examined the arrival rate of exonerations for persons on death row and concluded that at least four percent of all persons sentenced to death are innocent.
Paternoster and colleagues (2003) examine death penalty cases in Maryland over the period 1978–1999. They find enormous variation across different counties in the willingness of prosecutors to seek the death penalty for similar cases. Significant county variation in the prosecution of capital murder cases has also been reported in Pennsylvania (Ulmer et al., 2020). Given the spatial segregation of population by race in the United States, such geographic variation in death penalty use could generate important racial disparities in execution rates given the characteristics of cases, even if no prosecutors exhibit racial bias when seeking the death penalty.
COMMUNITY SUPERVISION
In most states, probation and parole supervision are legal substitutes for incarceration. In some states, a probation sentence is legally a sentence that takes away an offender’s freedom but assigns him (or her) to serve the sentence in the community under the supervision of a probation officer rather than in a prison under the supervision of guards.
Probation populations have fallen since the Great Recession. The national population under community supervision reached a peak of almost 4.3 million in 2007 and then declined each following year. In 2019, just under 3.5 million persons were on probation. Thus, the probation population dropped by almost 20 percent between 2007 and 2019. However, the racial makeup of the population under probation supervision changed little from 2007 to 2019. In 2007, 55 percent of probationers were White, 29 percent were Black, and 13 percent were Hispanic. The racial composition of probationers in 2019 was almost identical (see Oudekerk and Kaeble, 2021). Still, the absolute reduction in rates has been favorable to Black men and women because they have a relatively high probation rate compared to White people.
The fall in probation populations is not surprising given the fall in arrest rates over this same period. However, probation populations did not fall quite as sharply as prison populations. This difference may, in part, reflect the fact that the Brown v. Plata31 (2011) Supreme Court decision placed limits on how many inmates could be housed in a single prison, given its size and design. Following this decision, states faced higher costs due to expanding prison populations during a period when many states faced budget problems. Hence, probation may be increasingly serving as a substitute for custodial sentences.
___________________
31 563 U.S. 493 (2011); see https://supreme.justia.com/cases/federal/us/563/493/
In contrast to prison and probation populations, parole populations have grown steadily in recent decades. Table 2-11 shows that parole populations continued to grow through the Great Recession and beyond. As the parole population grew, the fraction of White individuals grew slightly, while the fractions of Black and Hispanic individuals remained roughly constant. In both 2001 and 2019, Black men and women accounted for roughly 37 percent of parolees, which means that, as the parole population has grown, Black persons have remained more than twice as likely to be on parole as other groups.
The growth of parole populations stands out because the recent experiences with policy reform in California (the largest state in the nation) suggest that it is possible to (1) reduce incarceration rates, (2) narrow racial disparities, and (3) not increase crime rates by reforming parole practices as well as dialing back the punishment for lesser felonies. Between 1970 and 2000, prison incarceration rates in the state increased in lockstep with the overall national rate for the United States (see Figure 2-12). From the early 2000s on, however, there are notable departures with large relative decreases in California’s incarceration rates post 2010. Figure 2-13 presents long-term trends for California’s overall violent and property crime rates. Similar to national trends, California’s violent crime rate peaks in the early 1990s before declining to current historical lows. While the historical peak for property crime occurs in the early 1980s, the largest declines in property crime occur post 1990, with the rate declining by roughly 50 percent over the subsequent 26 years. In both figures, the years 2011 and 2014 (years of reform to parole and sentencing) are marked with vertical lines. Notably,
TABLE 2-11 Parole Populations by Race/Ethnicity, 2001 through 2019
| 2001 | 2006 | 2011 | 2016 | 2019 | |
|---|---|---|---|---|---|
| Total | 731,147 | 798,210 | 855,458 | 874,777 | 876,921 |
| White | 274,015 | 319,392 | 323,263 | 341,163 | 344,999 |
| Black | 299,708 | 304,484 | 305,297 | 323,667 | 324,461 |
| Hispanic | 130,755 | 143,012 | 138,104 | 157,460 | 157,845 |
| Amer. Ind. | 4,828 | 7,000 | 8,502 | — | — |
| Asian | 4,391 | 5,147 | 5,600 | — | — |
| Unknown | 15,672 | 13,402 | 68,508 | — | — |
NOTES: In 2016 and 2019, the fractions with unknown race were quite high. We use the racial composition of the parole population in 2018, which is well measured, to create race specific counts for the larger racial groups.
SOURCE: Data from Annual Probation Survey and Annual Parole Survey and Probation and Parole in the United States–2019, https://bjs.ojp.gov/data-collection/annual-probation-survey-and-annual-parole-survey
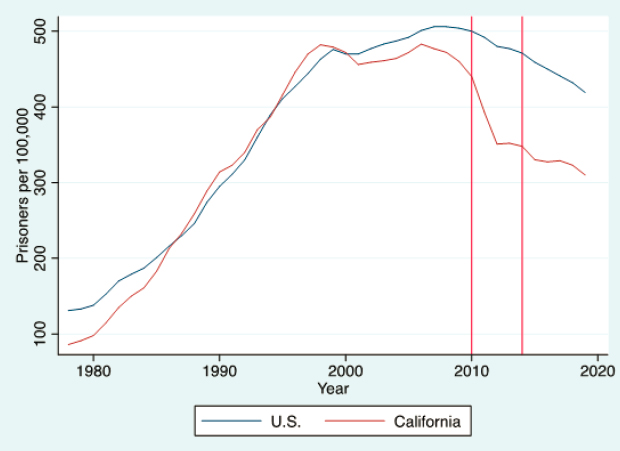
SOURCE: Data from the Bureau of Justice Statistics. Generated using the Corrections Statistical Analysis Tool, https://csat.bjs.ojp.gov/
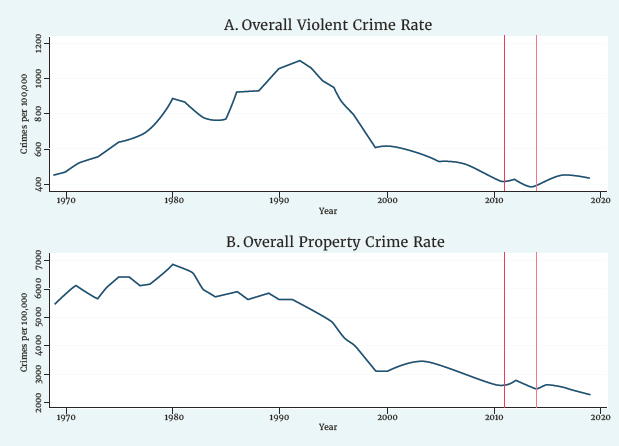
SOURCE: Data from Crime in California 2020, California Department of Justice, https://oag.ca.gov/cjsc/databases
these reforms reduced the state’s prison incarceration rate to early-1990s levels with little evidence of an impact on crime rates.
Here we ask several questions pertaining to the California experience. First, what drove the departure of California’s prison trend from that of the nation? Second, did the reforms impact public safety? Finally, were there racially disparate impacts of this change?
Two broad factors converged to generate the reduction in the state incarceration rate. First, decades of litigation pertaining to conditions of confinement and the availability of health and mental health services in the state prison system culminated in a federal court order to reduce state prison overcrowding, an order ultimately affirmed by a 2011 U.S. Supreme Court ruling. Second, public opinion pertaining to sentencing severity and the use of incarceration in particular softened, resulting in several notable ballot measures aimed at undoing much of the stringent sentencing practiced in past decades.
Regarding the response to the federal court order, in 2011 California enacted broad corrections reform legislation under the banner of corrections realignment. The legislation was prompted by pressure from a federal three-judge court overseeing the California prison system, impaneled as a result of legal decisions in two lawsuits against the state filed on behalf of California prison inmates. In one lawsuit (Coleman v. Brown),32 it was alleged that California was providing inadequate health care services to its prison population. In the other lawsuit (Plata v. Brown), it was alleged that the system was providing inadequate mental health services. Both resulted in rulings in favor of the plaintiffs, finding that prison overcrowding was the primary cause of the inadequate services and that the poor health and mental health care systems violated the Eighth Amendment prohibition against cruel and unusual punishment.
Assembly Bill 10933 (referred to in the state as “corrections realignment”) was passed and implemented under threat of a federal court order to release up to 35,000 inmates if the state failed to act on its own. The legislation eliminated the practice of returning parolees to state prison custody for technical parole violations for all but a small set of the most serious offenders. It also defined a group of nonserious, nonsexual, nonviolent offenders who upon conviction serve their sentences in county jails. The act generated an immediate reduction in weekly prison admissions from roughly 2,100 per week to 600 per week and a steady, permanent decline in the prison population of over 20 percent. While this decrease was partially offset by an increase in jail populations, the overall incarcerated population in California (combined prison and jail) fell by roughly 25,000 people within six months of the reform.
___________________
32 563 U.S. 493; see https://www.law.cornell.edu/supremecourt/text/09-1233
Regarding the change in public opinion, in recent years California voters passed several state ballot initiatives aimed at reducing the use of prison along both the intensive and extensive margins. In 2012, voters approved a ballot measure to narrow the definition of felonies that would qualify for second- and third-strike sentence enhancements, limiting these felonies to serious and violent offenses (Proposition 36). More recently, voters passed a proposition that incentivizes prison inmates to engage in rehabilitative programming and refrain from institutional misconduct in exchange for shorter prison terms (Proposition 57, passed in November 2016).
Proposition 47, passed in November 2014, is the most far-reaching sentencing reform passed by way of ballot initiative and had immediate impacts on the operations and practices of several arms of the state’s criminal justice system. Put simply, the proposition redefined a subset of “wobbler” offenses, those that can be charged as either a misdemeanor or felony, as straight misdemeanor offenses. Regarding property offenses, the proposition redefined shoplifting, forgery, crimes involving insufficient funds, petty theft, and receiving stolen property offenses where the value of the property theft falls below $950 as misdemeanors. The proposition also eliminated the offense of petty theft with a prior. Regarding drug offenses, a subset of possession offenses was redefined as misdemeanors. These new charging protocols apply to all new cases with the exception of instances where the individual in question has certain prior convictions. The proposition also included a provision for individuals currently serving sentences for reclassified offenses to file a resentencing petition, as well as a provision for those convicted in the past to file a petition to have the prior conviction reclassified as a misdemeanor (California Judicial Council, 2016). The passage and implementation of Proposition 47 reduced jail populations by about 10 percent, the state prison population by about 3.5 percent, policing, and the actions associated with specific offenses (Dominguez-Rivera et al., 2019).
Evaluations of these reforms find little evidence that the documented impacts of these reforms on jail populations, prison populations, the likelihood of being arrested, and the sanctions one faces in the event of arrest and conviction also impacted crime rates. Regarding the effects of the 2011 realignment reform, Lofstrom and Raphael (2016) find no impact of the large discrete reduction in the state’s prison population on violent crime and modest short-lived effects on property crime. Similarly, two separate evaluations of Proposition 47 find no evidence of an effect of the reform on violent crime (Dominguez-Rivera et al., 2019; Bartos and Kubrin, 2018) and some suggestive evidence of a small impact on larceny theft.34
___________________
34 One might note in Figure 2-13 what appears to be a slight increase in violent crime in California in 2014. Dominguez-Rivera and colleagues (2019) demonstrate that this increase is almost entirely attributable to the Los Angeles Police Department expanding its formal
By contrast, these reforms did impact racial disparities in criminal justice involvement both in terms of incarceration rates as well as arrests. Tables 2-12 and 2-13 present the proportion of California residents institutionalized (largely in jail or prison) by race, gender, age, and level of educational attainment (from Lofstrom et al., 2020). The tables present figures for the years 2011 (realignment was implemented at the end of 2011), 2014 (Proposition 47 goes into effect at the end of 2014), and 2017. While large disparities exist across racial groups in all years, there is a notable narrowing in overall race disparities especially among men and among lesser educated and younger men.
In addition to disparate impacts of these reforms on incarceration rates, researchers have also documented disparate impacts on arrest rates as well as pretrial processing and criminal case disposition. Mooney and colleagues (2018) present an analysis of California arrest rates before and after the passage of Proposition 47. They demonstrate a sharp decline in felony drug arrest rates for African American, White, and Hispanic people, with the larger decline for African Americans narrowing the disparity relative to White people. They also find comparable declines and narrowing racial disparities for other offenses reclassified as result of the proposition. Lofstrom and colleagues (2020) find similar effects on arrests, with particularly large declines in race disparities in felony drug arrests among younger men. MacDonald and Raphael (2020) study administrative data on criminal cases processed by the San Francisco District Attorney before and after the passage of Proposition 47. The authors find a narrowing of racial disparities in case outcomes largely attributable to lessening of the adverse effects of pretrial detention and criminal history on case outcomes.
Given that parole populations have grown as other forms of supervision have decreased, it is important to note that a growing literature finds that parole supervision generates many re-admissions to prison for violations of parole conditions that are technical. For example, in Illinois, violations fall under one of 15 rules. Rule 1 violations are the only ones that involve new criminal charges. However, those under supervision may be returned to prison for changing residence without approval, possessing a firearm, using drugs, associating with known gang members, or doing anything that violates approved conditions established by a parole agent.35
___________________
definition of aggravated assaults to include incidents where someone brandishes a firearm. The change occurred in response to an internal inspector general’s report noting that the department was undercounting aggravated assaults. The change in reporting methods coincides exactly with the passage of Proposition 47.
35 See 730 ILCS 5/3-3-7, https://www.ilga.gov/legislation/ilcs/fulltext.asp?DocName=073000050K3-3-7. In Illinois, the parole system is called Mandatory Supervised Release because release dates from prison are not determined by parole boards, and post-release periods of supervision are fixed at one, two, or three years, given good behavior.
| Panel A: White Men | |||
|---|---|---|---|
| 2011 | 2014 | 2017 | |
| All | 0.015 | 0.013 | 0.012 |
| 18–25 | 0.013 | 0.008 | 0.006 |
| 26–30 | 0.017 | 0.013 | 0.015 |
| 31–40 | 0.016 | 0.015 | 0.014 |
| 41–55 | 0.015 | 0.014 | 0.012 |
| Less than HS | 0.086 | 0.071 | 0.070 |
| HS grad | 0.023 | 0.022 | 0.020 |
| Some college | 0.011 | 0.011 | 0.011 |
| College + | 0.001 | 0.001 | 0.001 |
| Panel B: African American Men | |||
| 2011 | 2014 | 2017 | |
| All | 0.093 | 0.078 | 0.065 |
| 18–25 | 0.076 | 0.056 | 0.050 |
| 26–30 | 0.094 | 0.089 | 0.072 |
| 31–40 | 0.106 | 0.089 | 0.075 |
| 41–55 | 0.097 | 0.082 | 0.064 |
| Less than HS | 0.337 | 0.285 | 0.295 |
| HS grad | 0.109 | 0.093 | 0.075 |
| Some college | 0.054 | 0.040 | 0.038 |
| College + | 0.007 | 0.008 | 0.005 |
| Panel C: Hispanic Men | |||
| 2011 | 2014 | 2017 | |
| All | 0.024 | 0.022 | 0.022 |
| 18–25 | 0.023 | 0.020 | 0.019 |
| 26–30 | 0.028 | 0.023 | 0.027 |
| 31–40 | 0.026 | 0.028 | 0.028 |
| 41–55 | 0.019 | 0.019 | 0.016 |
| Less than HS | 0.036 | 0.035 | 0.041 |
| HS grad | 0.024 | 0.023 | 0.022 |
| Some college | 0.011 | 0.011 | 0.010 |
| College + | 0.003 | 0.003 | 0.002 |
| Panel D: Asian Men | |||
| 2011 | 2014 | 2017 | |
| All | 0.005 | 0.006 | 0.005 |
| 18–25 | 0.006 | 0.002 | 0.002 |
| 26–30 | 0.007 | 0.008 | 0.003 |
| 31–40 | 0.005 | 0.009 | 0.008 |
| 41–55 | 0.004 | 0.005 | 0.004 |
| Less than HS | 0.021 | 0.034 | 0.039 |
| HS grad | 0.012 | 0.010 | 0.010 |
| Some college | 0.004 | 0.005 | 0.003 |
| College + | 0.001 | 0.001 | 0.000 |
SOURCE: Data from Table 7 in Lofstrom and colleagues (2020).
| Panel A: White Women | |||
|---|---|---|---|
| 2011 | 2014 | 2017 | |
| All | 0.002 | 0.002 | 0.002 |
| 18–25 | 0.002 | 0.002 | 0.001 |
| 26–30 | 0.003 | 0.002 | 0.001 |
| 31–40 | 0.003 | 0.002 | 0.002 |
| 41–55 | 0.003 | 0.002 | 0.003 |
| Less than HS | 0.026 | 0.012 | 0.017 |
| HS grad | 0.004 | 0.002 | 0.004 |
| Some college | 0.003 | 0.003 | 0.002 |
| College + | 0.000 | 0.000 | 0.000 |
| Panel B: African American Women | |||
| 2011 | 2014 | 2017 | |
| All | 0.010 | 0.008 | 0.007 |
| 18–25 | 0.009 | 0.004 | 0.002 |
| 26–30 | 0.009 | 0.008 | 0.012 |
| 31–40 | 0.013 | 0.011 | 0.010 |
| 41–55 | 0.010 | 0.008 | 0.004 |
| Less than HS | 0.048 | 0.050 | 0.043 |
| HS grad | 0.012 | 0.008 | 0.006 |
| Some college | 0.007 | 0.005 | 0.006 |
| College + | 0.002 | 0.000 | 0.000 |
| Panel C: Hispanic Women | |||
| 2011 | 2014 | 2017 | |
| All | 0.002 | 0.002 | 0.002 |
| 18–25 | 0.002 | 0.002 | 0.002 |
| 26–30 | 0.004 | 0.003 | 0.003 |
| 31–40 | 0.003 | 0.002 | 0.003 |
| 41–55 | 0.002 | 0.002 | 0.002 |
| Less than HS | 0.005 | 0.003 | 0.004 |
| HS grad | 0.002 | 0.002 | 0.002 |
| Some college | 0.001 | 0.001 | 0.002 |
| College + | 0.000 | 0.001 | 0.001 |
| Panel D: Asian Women | |||
| 2011 | 2014 | 2017 | |
| All | 0.001 | 0.001 | 0.001 |
| 18–25 | 0.001 | 0.000 | 0.001 |
| 26–30 | 0.001 | 0.001 | 0.000 |
| 31–40 | 0.001 | 0.001 | 0.001 |
| 41–55 | 0.001 | 0.001 | 0.000 |
| Less than HS | 0.002 | 0.007 | 0.003 |
| HS grad | 0.002 | 0.001 | 0.001 |
| Some college | 0.001 | 0.001 | 0.001 |
| College + | 0.001 | 0.000 | 0.000 |
SOURCE: Data from Table 8 in Lofstrom and colleagues (2020).
In Illinois and other states, parole agents have great discretion and considerable power to start proceedings that generate readmissions for people recently released from prison. Jordan and colleagues (2022) examine formerly incarcerated individuals during and just after fixed periods of post-release supervision. They find that post-release supervision has only minor impacts on the likelihood that a given formerly incarcerated individual faces a new felony charge but large impacts on the likelihood that a formerly incarcerated individual returns to prison. The resolution of this apparent contradiction is that more than one-third of prison admissions among persons under post-release supervision are associated with technical violations and not new crimes.
Franco-Paredes and colleagues (2021) and Harding and colleagues (2017) find that the parole agents in Michigan use technical violations to readmit large numbers of formerly incarcerated individuals back to prison. However, they also find that the incapacitation effects created by these readmissions and any other services these agents provide have little impact on rates of severe crime.
In some states, a single agency governs both probation and parole supervision, and research on the impacts of probation supervision contains findings that parallel findings in recent studies of parole. For example, Hyatt and Barnes (2017) review a recent experimental evaluation of a program known as Intensive Supervision Probation. The program involved more intensive supervision and more frequent contact with probation officers. The program had no impact on recidivism, but it did increase rates of technical violations and prison reentry.
Rose (2021) examines a reform of probation in North Carolina that made it more difficult for probation officers to start proceedings that would send probationers to prison. By comparing offender characteristics and recidivism rates in the pre- and post-reform periods, he shows that in the pre-reform period probation officers were not using technical violations to incapacitate offenders who were significantly more high risk than others on probation.
Many probation and parole systems appear to be designed in ways that maximize the opportunities for agents or officials with implicit or explicit bias to use discretion in ways that harm certain groups of offenders. Defenders of these systems argue that parole and probation agents possess information that allows them to act to protect society from dangerous persons who are likely to reoffend. However, the literature offers little evidence that this is true.
SYNTHESIZING THE EVIDENCE
This chapter has broadly documented what is known about racial and ethnic disparities in victimization, offending, and criminal justice
interactions and processing in the United States. The following section summarizes the findings from this analysis.
CONCLUSION 2-1: There are clear racial disparities in victimization rates. American Indians and African Americans are the most likely to be victimized by serious violent offenses, followed by Hispanic, non-Hispanic White, and Asian people. While inter-racial disparities in nonlethal violent victimization have narrowed considerably over the past decade, racial disparities in murder rates remain stubbornly high, with the murder rate for African Americans relative to other groups increasing sharply during the 2020 pandemic. Disparities and trends in disparities in property crime victimization are qualitatively similar.
CONCLUSION 2-2: The most recent data on homicide victimization, for 2020, demonstrate two facts concerning the recent increase in homicide rates, which have reached the highest levels since the mid- to late 1990s: (1) the increases were broad-based geographically, with similar patterns observed across the country; and (2) the increases are extremely concentrated among specific demographic groups, particularly among Black men.
CONCLUSION 2-3: There are large racial disparities in arrest rates for serious felony offenses as well as for less serious offenses. Salient patterns include very high relative arrest rates among African Americans for robbery and relatively high arrest rates for American Indians for alcohol-related offenses. Regarding race disparities in arrests for serious offending, the racial composition of arrests aligns with the racial composition of offenders as reported by crime victims, though there is also evidence that offenses where the victim identifies the perpetrator as being Black are somewhat more likely to be reported to the police.
CONCLUSION 2-4: Black people are considerably more likely to be stopped by the police while driving, riding a bike, or walking relative to members of other racial groups. Vehicle stops often occur due to equipment violations rather than moving violations and often do not result in a citation. Among those stopped, Black people are considerably more likely to be searched by police and are more likely to be asked to exit a vehicle, to be handcuffed, to be ordered to sit on a curb, or to experience a backseat detention during the duration of the stop. Again, such stops often do not end with a citation or an arrest, and for African Americans they are relatively less likely to result in arrest or citation.
CONCLUSION 2-5: While most interactions between the police and the public do not involve a use of force, there are sizable racial disparities in use of force of all sorts. Black people are the most likely to report experiencing force or the threat of force during police stops. Moreover, Black people are overrepresented among instances where police shoot and kill members of the public. There are large regional disparities in fatal police shootings, with the highest rates in West Coast states and the lowest rates in the Northeast.
CONCLUSION 2-6: The higher rate at which police shoot Black persons does not necessarily imply that, holding the conditions of citizen encounters constant, police are more likely to shoot Black people. Black individuals are much more likely to be arrested for violent crimes and also more likely to shoot police, although this is a relatively rare event. However, existing studies do not rule out the possibility that police behaviors that shape interactions with Black citizens create circumstances that make the use of lethal force more likely. This in particular qualifies the findings from the one study (Fryer, 2019) that tests for and fails to find racial disparity in the likelihood that serious incidents result in an officer-involved shooting. There is evidence of a higher likelihood that emergency calls for service originating from Black and Hispanic neighborhoods are more likely to result in an officer-involved shooting, and that this appears to be driven in its entirety by outcomes involving White officers. This finding in particular provides evidence that racial bias is likely a factor in differential use of force. Moreover, there is clear evidence that police are more likely to use less lethal force against Black defendants. The higher rates at which police stop, search, and apply nonlethal force to Black citizens cannot be explained by the rates at which Black citizens engage in crime.
CONCLUSION 2-7: Black people consistently report being treated with less respect in their interactions with police officers. Moreover, research analyzing the content of interactions recorded by body-worn cameras confirms these reports.
CONCLUSION 2-8: Murders involving Black and Hispanic victims are notably less likely to be cleared by arrest relative to murders involving White victims. Recent research suggests that police efforts and resources have considerable impacts on the likelihood of clearing such offenses, especially during the weeks and months following the initial few days following the incident. Research recently has focused on gun assaults that generate nonfatal injuries and suggests substantial
reduction in violence could be achieved by paying more attention and devoting more effort to clearing these nonfatal but serious assaults.
CONCLUSION 2-9: Black criminal defendants are more likely to be detained pretrial and are more likely to be convicted as a result. Existing research on bail setting indicates that the practice releases many high-risk defendants while simultaneously detaining low-risk defendants due to their inability to make bail. Research suggests that eliminating cash bail and replacing the system with an actuarial system where detention depends more directly on risk of pretrial misconduct could both reduce jail populations and not increase crime rates. Such a change would likely have a disparate impact on African American defendants, who are more likely to be detained pretrial, often for less serious offenses.
CONCLUSION 2-10: Incarceration rates in state and federal prisons have declined since their peak in the mid-2000s, but they still remain high by historical and international standards. Black people, especially Black men, have very high incarceration rates relative to other groups. Prison incarceration rates have declined for all groups in recent decades, and by nearly 30 percent for Black Americans. While absolute and relative race disparities have declined for Black Americans, there are still large racial disparities in prison incarceration rates.
CONCLUSION 2-11: Black people are heavily overrepresented among people currently condemned to die for their conviction offense. Moreover, the historical application of the death penalty has been disproportionately applied to Black defendants, not only for the offense of murder but also for the offense of rape for much of the 20th century. Empirical research consistently finds that case factors such as whether the victim was White, the quality of the defense effort, the state, and the time period significantly impact the likelihood of being sentenced to death for a capital offense. Finally, advances in DNA evidence analysis and targeted legal advocacy have revealed that a nontrivial portion of those sentenced to death were innocent.
CONCLUSION 2-12: Combining data from all states and the federal system, incarceration rates and probation populations have fallen in recent years, with consequent reductions in absolute racial disparities, but the population of formerly incarcerated people on parole has expanded steadily since 2000. California’s experience with corrections suggests that it is possible to shrink correctional and parole populations, and to use less punitive and more local forms of community supervision, without adversely impacting public safety. Moreover, the
state’s experience suggests that doing so narrows racial disparities in criminal justice involvement.
CONCLUSION
The committee finds strong evidence of high rates of violent victimization in minority communities, high rates of police contact, and large racial disparities across the multiple stages of the criminal justice system, including in arrests, pretrial detention, sentencing and incarceration, application of the death penalty, and probation and parole. The statistical portrait indicates a variety of harms reflected in high rates of homicide mortality and robbery victimization, and at the hands of the criminal justice system through police use of force, police shootings, and imprisonment. The statistical portrait shows the extent to which Black, Latino, and Native American communities must confront the dual challenges of high rates of interpersonal violence and the pains of criminal justice system contact.
The evidence indicates that interpersonal harm and the injuries of criminal justice contact are related. High rates of criminal offending in Black and Brown communities help explain criminal victimization and disproportionate contact with police and the courts. Still, beyond the damage caused by serious crime, there are a vast number of low-level police contacts that are racially disparate and often characterized by disrespect and harsh treatment by police.
The review of statistics on crime and the criminal justice system also revealed limitations of the data. Race and ethnicity in the criminal justice system are measured inconsistently across agencies, making it difficult to get a national picture of racial disparity. One critical area, the police use of force—a longstanding issue of public interest and policy significance—is not measured by any federal agency, and independent efforts have emerged to fill the gap. While relatively good data exist on Black Americans’ and White Americans’ interactions with the criminal justice system, crime, and victimization, data on Latino and Native American populations are often lacking.
Although the disparities in crime and criminal justice contact paint a picture of significant racial inequality, the data also indicate substantial improvement in some areas over the last two decades. Despite the increase in homicides over the last two years, crime is generally substantially lower than in the early 1990s, and this has conferred enormous improvements in quality of life in Black and Brown communities. Incarceration rates have fallen from 2008 to 2020, and this has accompanied large reductions in absolute and relative racial disparity.
From the statistical portrait of racial inequality in this chapter, we will turn next in Chapter 3 to review research on the high rates of crime that
concentrate in racially segregated and low-income neighborhoods. These neighborhoods often form the context for the high levels of victimization and disproportionate criminal justice contact reported in this chapter. We will then examine in Chapter 4 how spatially concentrated patterns of crime combine with an accumulation of racial disparities throughout the stages of the system from arrest to sentencing to incarceration.
CHAPTER 2 APPENDIX FIGURES
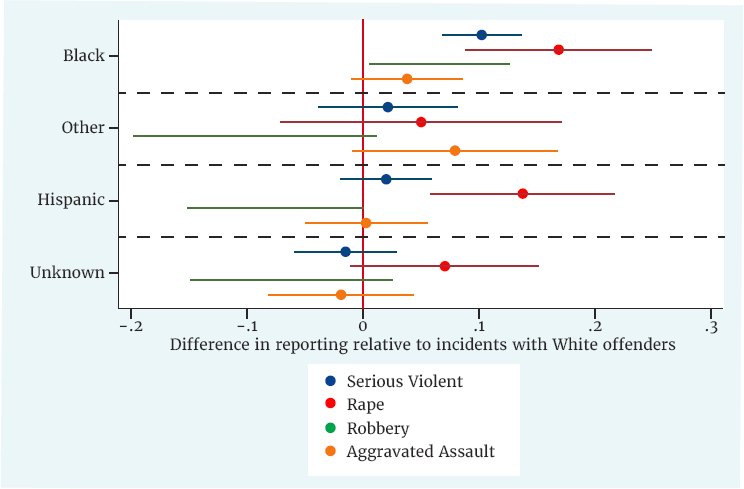
SOURCE: Tabulations from multiple years of the National Crime Victimization Survey, https://bjs.ojp.gov/data-collection/ncvs
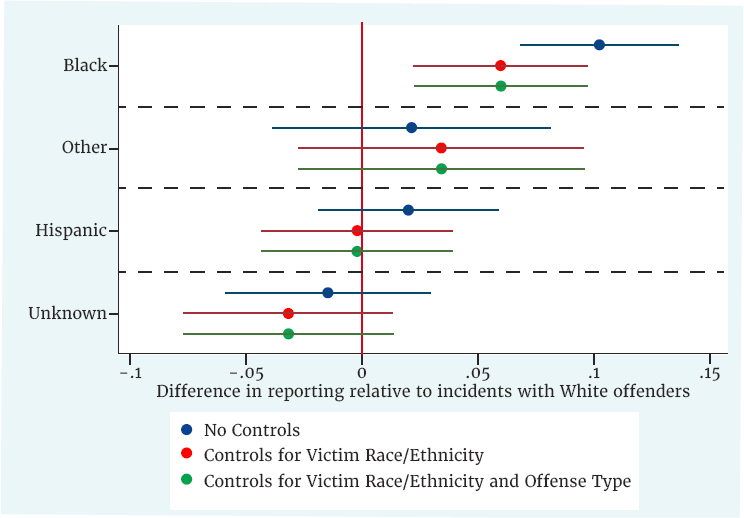
SOURCE: Tabulations from multiple years of the National Crime Victimization Survey, https://bjs.ojp.gov/data-collection/ncvs
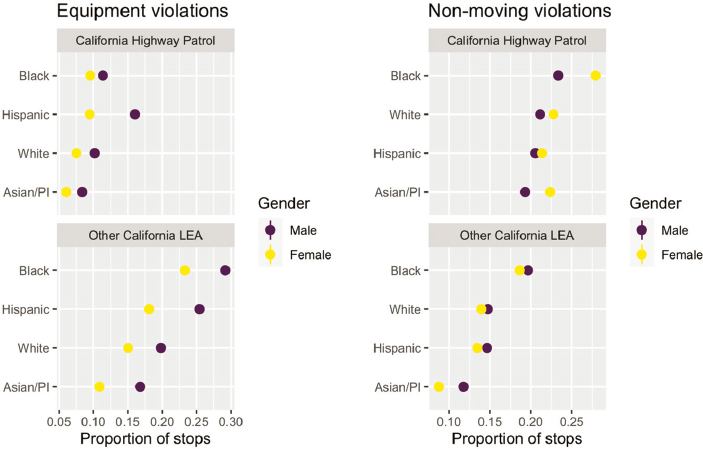
SOURCE: Data from Open Justice, California Department of Justice, Racial and Identity Profiling Act, https://openjustice.doj.ca.gov/
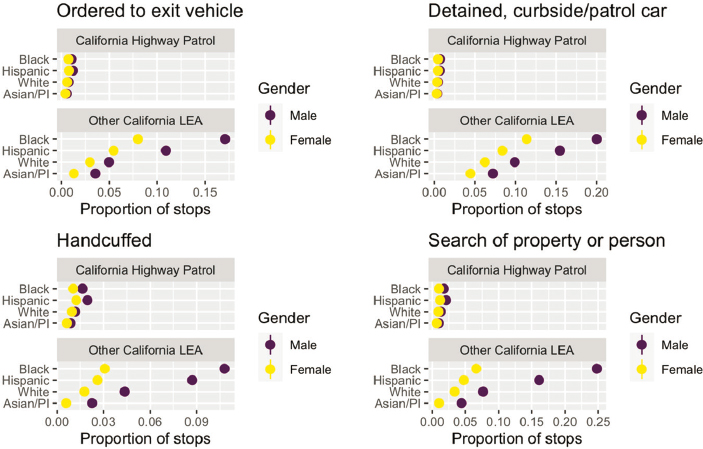
SOURCE: Data from Open Justice, California Department of Justice, Racial and Identity Profiling Act, https://openjustice.doj.ca.gov/
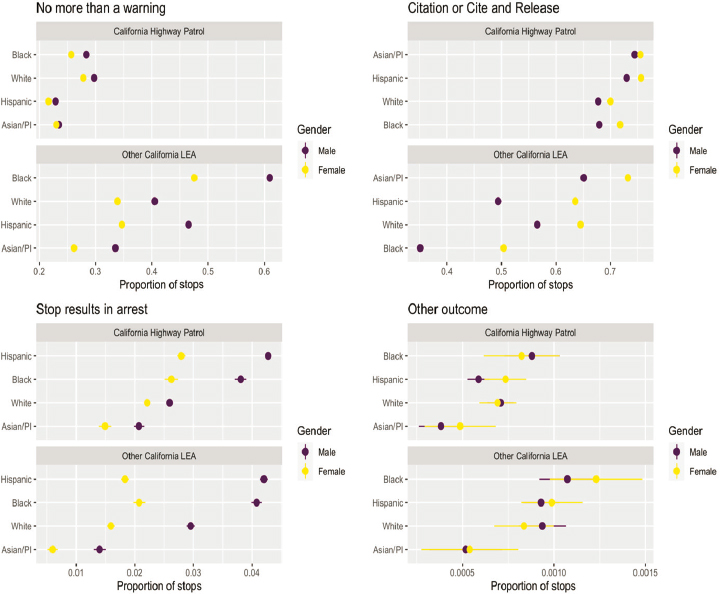
SOURCE: Data from Open Justice, California Department of Justice, Racial and Identity Profiling Act, https://openjustice.doj.ca.gov/