
4
STA Water Quality and CERP Progress
The historic Everglades ecosystem developed under chronically phosphorus-limited conditions. Runoff from agricultural and urban development beginning in the early 1900s altered these conditions through drainage with high-phosphorus concentrations entering the Everglades Protection Area (defined as Water Conservation Areas [WCAs] 1, 2A, 2B, 3A, and 3B, and Everglades National Park; FAC §§ 62-302.540). In phosphorus-impacted areas, essential characteristics of the Everglades have been altered through the loss of periphyton and the replacement of native sawgrass by dense cattails, which degraded fish and bird habitat (Davis, 1994). In response to this degradation, in 1988 the United States sued the State of Florida.1 Under the Consent Decree reached in 1992 and subsequent enhancements, the state constructed 57,000 acres of treatment wetlands, termed stormwater treatment areas (STAs),2 and additional STA construction and restoration are under way in response to the subsequent 2010 Amended Determination (EPA, 2010; see next section for details). These constructed wetlands are globally unmatched in spatial and temporal scale and collectively have removed more than 3,200 metric tons of phosphorus as of water year3 (WY) 2022 (Chimney, 2022b).4
___________________
1United States v. South Florida Water Management District, 847 F. Supp. 1567 (S.D. Fla. 1992).
2 The 57,000 acres were constructed as part of the Everglades Construction Project and the South Florida Water Management District (SFWMD)’s Long-Term Plan for Achieving Water Quality Goals (Burns & McDonnell, 2003).
3 Water year refers to measurements made during May 1 to April 30, with the year designated as the year in which it ends. Wet season, which receives 70 percent of the total hydraulic and phosphorus loads, is considered to occur from May 1 to October 31, and dry season is considered to occur from November 1 to April 30. All the monitoring data collected since the construction of STAs are reported on a WY basis.
4 Edits were made here and throughout the report after its prepublication release to correct descriptions of the legal history, compliance process, and regulatory terminology.
Full implementation of key Comprehensive Everglades Restoration Plan (CERP) projects are predicated on water being discharged into the Everglades Protection Area meeting established STA discharge limits for phosphorus (see next section); thus, the state’s efforts to remediate the quality of Everglades inflows is foundational to CERP implementation. Consistent with the study charge to discuss issues that may impact restoration progress, in this chapter the committee focuses on the effectiveness of the STAs and the implications of their performance to CERP progress. This chapter begins with a brief overview of Everglades water quality requirements and criteria, the state’s ongoing Restoration Strategies program, and implications of the Plan’s performance for CERP implementation. The committee then provides an overview of how STAs function and key drivers of their performance, followed by a review of the important progress being made to achieve the water quality standards. Finally, the committee recommends strategies to support the state’s ongoing efforts to meet the water quality discharge requirements and sustain STA performance over the long term.
EVERGLADES WATER QUALITY OBJECTIVES AND CRITERIA
The federal Clean Water Act (33 U.S.C. §§1251-1388) requires states to establish water quality standards to support designated uses of waterways that are then reviewed and approved by the U.S. Environmental Protection Agency (EPA). The act also establishes a permit program for discharges of wastewater and stormwater into receiving waters of the United States. Issues related to compliance with Clean Water Act standards in the Everglades Protection Area have been the subject of two significant, related, and ongoing lawsuits (see Appendix D of NRC [2012] for a timeline of major events). Both cases make it clear that discharging water into the Everglades Protection Area that does not comply with water quality standards is a violation of the Clean Water Act. See also Chapter 5 of NRC (2010) for a detailed history of Everglades water quality standards and associated issues.
In 1988, the United States sued the State of Florida and the SFWMD, alleging that the state had failed to adequately clean up waters flowing into Everglades National Park and the Arthur R. Marshall Loxahatchee National Wildlife Refuge (LNWR, also known as WCA-1). After several years of litigation, the parties entered into a settlement agreement in 1991 that was implemented through a Consent Decree in 1992. The 1991 settlement agreement contained several provisions, including
- a general commitment on the part of the SFWMD and the Florida Department of Environmental Protection (FDEP) to protect water quality in LNWR and Everglades National Park,
- adoption of interim and long-term total phosphorus (TP) limits and levels,5
- certain remedial measures,
- a research and monitoring program, and
- contingencies for enforcement.
Remedial measures under the Consent Decree included a commitment by the SFWMD to construct 35,000 acres of STAs and for the state to develop and implement an interim and long-term regulatory program to ensure that all discharges from the Everglades Agricultural Area (EAA) meet Clean Water Act standards.
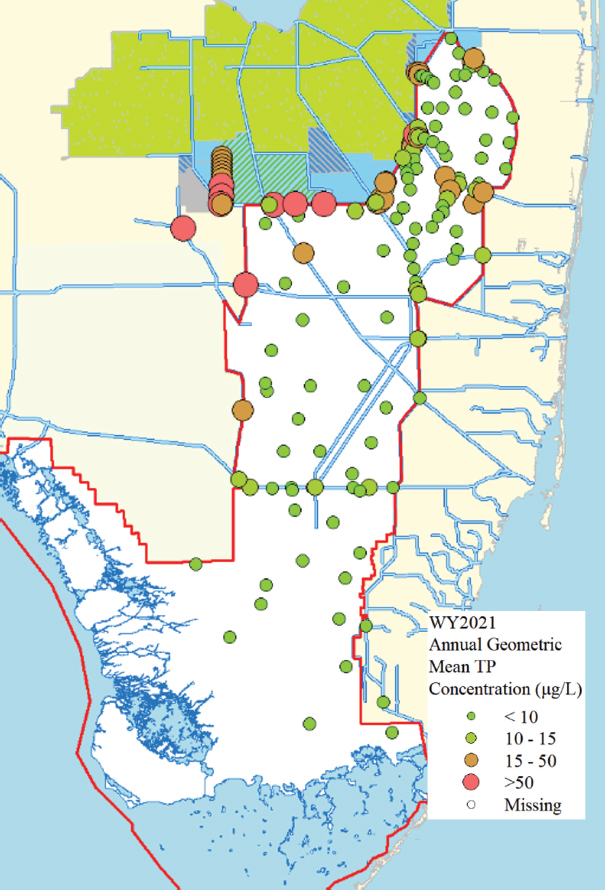
The 1994 Everglades Forever Act (Fla. Stat. §373.4592) directed the FDEP to develop numeric criteria for phosphorus within the Everglades Protection Area to comply with the Consent Decree. In 2003, the State of Florida formally adopted a numeric phosphorus rule (FAC §§62-302.540)6 that established the phosphorus criterion for waters in the Everglades Protection Area as the long-term geometric mean of 10 µg/L (Box 4-1). Achievement of the criterion in WCA-1 (LNWR), -2, and -3 is evaluated across a network of sampling stations (a subset of those shown in Figure 4-1) using a four-part test7 to determine whether a violation of standards has occurred.8 Achievement of the criterion in Everglades National Park is governed by methods in Appendix A of the 1992 Consent Decree (see SFWMD [2009] for details).
In 2010, a federal judge found that the water quality regulatory program enacted by Florida in response to the 1992 Consent Decree failed to comply with the requirements of the Clean Water Act and directed the EPA and the FDEP to take certain steps to comply with their mandatory duties. In response, the EPA issued its Amended Determination (EPA, 2010) directing the FDEP to correct
___________________
5 Interim limits for phosphorus were to be achieved by July 1997 (later amended to October 2003), including annual flow-weighted concentration goals in Shark River Slough of no more than 14 parts per billion (ppb) in a dry year and 9 ppb in a wet year. Long-term limits were to be achieved by 2002 (later amended to 2006) including annual flow-weighted concentration goals in Shark River Slough of no more than 13 ppb in a dry year and 8 ppb in a wet year, and the long-term concentration limit for Taylor Slough and the Coastal Basins was set at 11 ppb. Interim and long-term limits for Everglades National Park and levels for LNWR were specified by complex formulas in Appendices A and B of the Settlement Agreement. Interim levels for LNWR were to be between 8 and 22 ppb depending on water levels as measured.
6 See also Miccosukee Tribe of Indians of Florida v. United States, 2008 WL 2967654 (S.D. Fla.).
7 The four-part test is used to assess compliance according to the following four provisions: (1) 5-year geometric mean is less than or equal to 10 ppb, (2) annual geometric mean averaged across all stations is less than or equal to 11 ppb, (3) annual geometric mean averaged across all stations is less than or equal to 10 ppb for 3 of 5 years, and (4) annual geometric mean at individual stations is less than or equal to 15 ppb (FAC §§62.302.540).
8 Text was added following the prepublication release of the report to include WCA-1 among areas in which the four-part test is applied.
deficiencies in meeting its water quality standards and articulated that “the narrative and numeric nutrient criteria in the State’s water quality standards are not being met for the Everglades Protection Area.”9 The Amended Determination was intended to provide an enforceable plan for ensuring that the water entering the Everglades Protection Area from the EAA and the C-139 Basin complies with the previously adopted narrative and numeric phosphorus criteria for the Everglades Protection Area (FAC §§ 62-302.540).
The 2010 Amended Determination included a draft water quality–based effluent limit (WQBEL) to be included in all National Pollution Discharge Elimination System (NPDES) permits for STAs that discharge into the Everglades Protection Area.
___________________
9 Florida set narrative regulatory criteria to ensure that phosphorus concentrations would cause “no imbalance in flora or fauna,” which are now formalized in FAC §§ 62-302.530 (see also Rizzardi, 2001).
SOURCE: Gilhooly et al., 2022.
In 2012, the FDEP set a WQBEL for TP in STA discharge consisting of two components: (1) a maximum annual flow-weighted mean of 19 µg/L and (2) an annual flow-weighted mean of 13 µg/L not to be exceeded in more than 3 out of 5 water years on a rolling basis (Florida Permit FL0778451; FDEP, 2017a). The WQBEL was calculated to ensure that water discharged from the STAs is of high enough quality in spite of year-to-year variability to ensure compliance with the previously established narrative and numeric nutrient criteria in the Everglades Protection Area to sustain native vegetation and ecosystems in the Everglades.
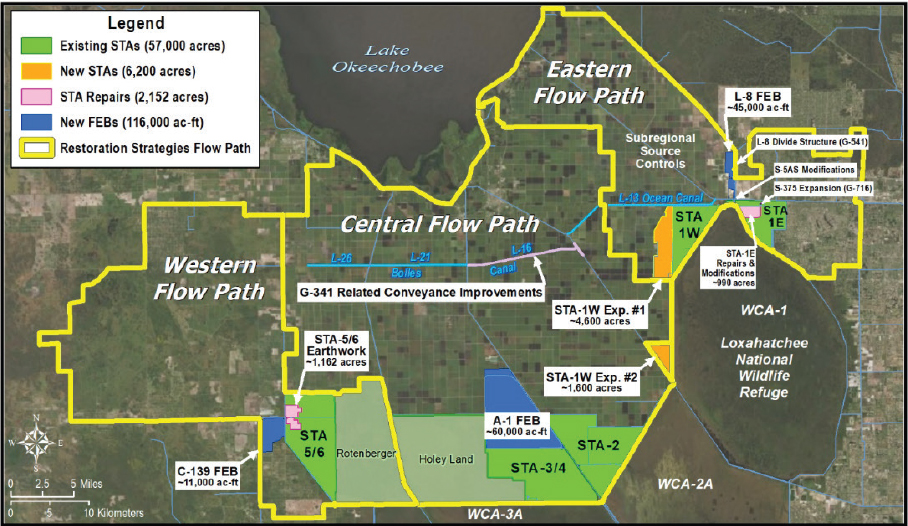
In response to the Amended Determination, in 2012 the SFWMD developed the Restoration Strategies Regional Water Quality Plan (hereafter, Restoration Strategies Plan; SFWMD, 2012), which provides for expanding existing STA acreage and additional infrastructure improvements to meet the WQBEL (Box 4-2; Figure 4-2). Restoration Strategies projects are expected to be fully constructed and operational by 2025. The first annual assessment of WQBEL attainment begins in WY 2027 (May 2026-April 2027).
IMPLICATIONS OF STA DISCHARGE QUALITY ON CERP PROGRESS
The Central Everglades Planning Project (CEPP)—the largest CERP project and key to restoring distributed sheet flows through the heart of the remnant Everglades system (see also Chapter 3)—depends on flows that are processed by STAs. Restoring sheet flows is fundamental to “getting the water right” and effectively restoring the River of Grass. Ongoing degradation of the greater Everglades due to the disruption of sheet flows has been well documented (McVoy et al., 2011), including the loss of peat and alteration to ecosystem topography such as the ridge and slough and tree islands. These defining ecosystem characteristics would likely require decades if not centuries to restore if lost. Enhancing sheet flows in the system as soon as possible, particularly in dry seasons when peat loss occurs, is essential to halting the ongoing degradation and beginning the restoration process. Meeting water quality criteria helps ensure that these restored flows do not further degrade ecosystems in the remnant Everglades (e.g., by causing replacement of sawgrass by dense cattails).
Timely WQBEL attainment affects CEPP implementation progress for two major project elements: CEPP North and CEPP EAA Reservoir (see Chapter 3 and Figure 3-19). As discussed previously, the first annual assessment of WQBEL attainment will begin in WY 2027. CEPP North is designed to restore sheet flow by spreading inflows across northern WCA-3A and backfilling the Miami Canal (Figure 3-19). This project can provide benefits in the near term using “existing” flows (i.e., water flows through the STAs without implementation and operation of new storage and treatment provided by the CEPP EAA Reservoir Project).
SOURCE: Shuford et al., 2022.
TABLE 4-1 Summary Status of Major Restoration Strategies Project Components
| Component | Purpose | Status |
|---|---|---|
| Eastern Flow Path | ||
| L-8 FEB | Attenuate flow into STA-1E and STA-1W | Construction completed 2017, long-term operations to commence by December 2022 |
| L-8 Divide Structures (G-716, G-541) | Assist movement of inflows and outflows to L-8 FEB | Construction completed 2016, now operational |
| STA-1E Repairs and Modifications | Improve STA performance | Construction of improvements to Cells 5 and 7 began in April 2020, transport of fill material and regrading is ongoing |
| STA-1W Expansion # 1 (Phase 1) | Increase STA-1W effective treatment area | Construction completed in 2018, now operational |
| STA-1W Expansion # 2 (Phase 2) | Increase STA-1W effective treatment area | Construction completion expected in December 2022 |
| G-341 Related Improvements | Divert flows (600 cfs max) to the west | Construction completion expected in 2024 |
| Subregional Source Controls | Reduce inflow loads from hotspots in the basin | Pilot projects completed in 2015 and 2017; conceptual project planning ongoing |
| Central Flow Path | ||
| A-1 FEB | Attenuate flow into STA-2 and STA-3/4 | Construction completed 2015, now operational |
| Western Flow Path | ||
| STA-5/6 Internal Improvements | Improve the performance of STA-5/6 | Construction completed 2020, now in optimization period |
| C-139 FEB | Attenuate flow into STA-5/6 | Construction completion expected in 2023 |
SOURCES: Data from Chimney et al., 2022a; Shuford et al., 2022.
However, once the Miami Canal is plugged, if inflows do not meet the WQBEL, the redistribution of water as sheet flow through WCA-3A could increase TP concentrations in interior areas not previously affected (see Figure 4-1), possibly adversely affecting the condition of periphyton and enhancing the spread of cattails. The U.S. Army Corps of Engineers (USACE) CEPP 2014 Chief’s Report (USACE, 2014b) specifies, and Connor (2022) reaffirms, that no federal investment in CEPP North infrastructure can occur until the WQBEL standard is met in these existing flows. The state, however, has elected to proceed with construction of CEPP North prior to the determination of WQBEL compliance beginning in 2027, including the filling of the Miami Canal starting in 2024. By doing so, the state is accelerating the potential implementation of CEPP North, although it is unclear whether this schedule assumes early attainment of the WQBEL. Delays in STA performance could potentially delay CEPP North implementation and
the associated restoration benefits if the risks of proceeding without WQBEL attainment are ultimately judged to be substantial.10
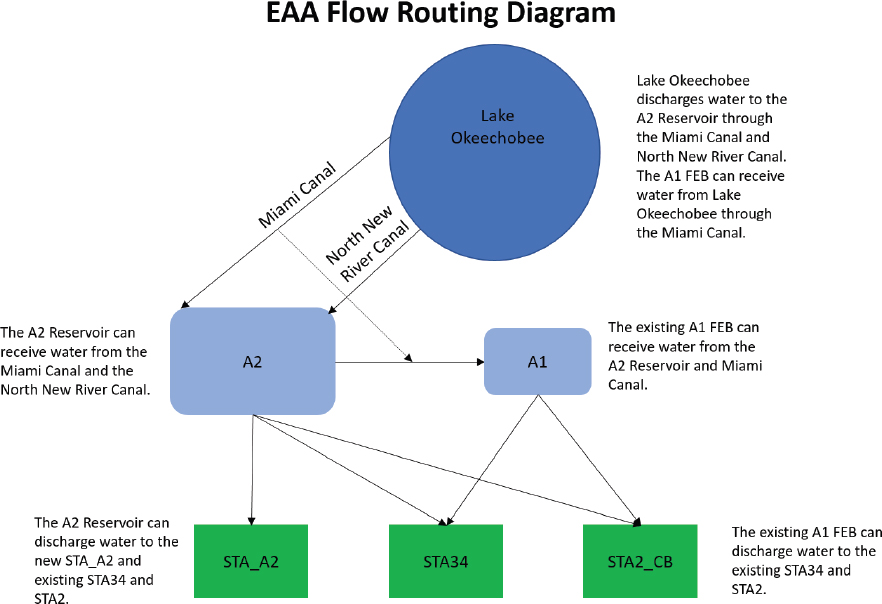
The CEPP also provides additional flows (“new water”) into the Everglades Protection Area via the CEPP EAA Reservoir project elements. CEPP EAA Reservoir includes a 10,500-acre reservoir with 240,000 acre-feet (AF) of storage (also known as the A-2 Reservoir) along with the new 6,500-acre A-2 STA to help treat the new water volumes conveyed to the Everglades (Figure 3-19). The A-2 Reservoir will be able to receive water from Lake Okeechobee and is designed to be fully integrated into the existing Restoration Strategies infrastructure (A-1 Flow Equalization Basin [FEB], STA-2, and STA-3/4) and operations (Figure 4-3). The A-2 STA was sized under the assumption that excess hydrologic inflow capacity in STA-3/4 and STA-2 in the dry season would also be used together with the A-2 STA to treat A-2 Reservoir discharges to WQBEL requirements, thereby reducing the size of the A-2 STA while promoting dry season flows, as desired. After treatment, the “new” water is dispersed into the Everglades Protection Area through the CEPP North infrastructure. CEPP EAA Reservoir is projected to provide an average of 370,000 AF of “new” water annually, compared to conditions without any CEPP features (USACE, 2020b). CEPP EAA Reservoir is currently scheduled for completion in 2029 according to the 2021 Integrated Delivery Schedule. The state has expedited the construction of the associated 6,500-acre A-2 STA, which is scheduled for completion in 2023 with flooding and optimization in 2024 and 2025.
Until all Restoration Strategies STAs meet the WQBEL, the USACE will limit operations of, and thus the benefits provided by, the EAA Reservoir. The EAA Reservoir Final Environmental Impact Statement Record of Decision (USACE, 2020c) specifies that “[a]ll features of the state’s Restoration Strategies must be completed and meet state water quality standards prior to initiating any operations which would allow water from the Federal EAA project to enter any of the state’s Restoration Strategy facilities.” Until the WQBEL is met for the Restoration Strategies STAs, “the EAA reservoir may only be operated to flow the amount of water that the new EAA A-2 STA alone can treat to meet all federal and state water quality standards, as well as any additional treatment necessary for passage of water to Everglades restoration” (USACE, 2020c).11 Under this policy, before the A-2 Reservoir is allowed to operate at full capacity, the prior 5 years of data
___________________
10 Following release of the prepublication version of the report, this paragraph was modified to correct its description of the compliance process.
11 According to the CEPP Post Authorization Change Report Project Operating Manual (Annex C, SFWMD, 2018a), “the WQBEL is a numeric discharge limit applied to permitted discharges from EAA STAs, including STA-2, STA-3/4, and A-2 STA to assure that such discharges do not cause or contribute to exceedances of the 10 micrograms per liter (µg/L) TP criterion within the Everglades Protection Area.”
SOURCE: https://www.saj.usace.army.mil/CEPPEAA/.
from all STAs must show compliance with the WQBEL (i.e., WY 2025-2029 for 2029 operation). Because the A-2 STA was sized based on excess hydrologic loading capacity in STA-2 and STA-3/4, until the WQBEL is met, flows to the Everglades will be limited to the capacity of the 6,500-acre A-2 STA and the 31,800 combined acres in STA-2 and STA-3/4 will not be available. Modeling for the EAA Reservoir planning process calculated that the A-2 STA could treat an average of 162,100 AF/year (out of the 370,000 AF/year that the CEPP was projected to provide on average) and the remaining 207,900 AF/year would be treated by STA-2 and STA-3/4 (SFWMD, 2018a). Thus, until the WQBEL is met, model projections suggest that the CEPP could only deliver 44 percent of the anticipated average annual new flows.
Until the WQBEL is met, USACE (2020b) also stated that inflows to the EAA Reservoir must also be limited:
The EAA reservoir may, in turn, not be allowed to store any extra water other than what can be treated and released to all applicable standards (by the current sampling methods/criteria) by the new EAA A-2 STA facility for benefits determined to be essential to Everglades restoration, until the state satisfies the water quality treatment needs of its Everglades Construction Project and meets all of their Restoration Strategies.
Accordingly, the benefits to the northern estuaries that are derived from moving water south rather than sending damaging high-volume discharges to the estuaries may also be reduced. However, no data are available to estimate the reduced benefits if the WQBEL is not met as expected.
In effect, success of Restoration Strategies is foundational to the implementation of the CEPP and the timely delivery of planned CERP benefits. Substantial delays in reaching the goals of Restoration Strategies would reduce the benefits provided by these CEPP projects until WQBEL compliance is met. In the balance of this chapter the committee turns its attention to a review of the underlying science, engineering, design, and operations of the STAs and a discussion of the progress to date under Restoration Strategies, with the goal of helping inform the state’s efforts to meet the WQBEL criteria by 2027.
OVERVIEW OF STAS
Constructed treatment wetlands are used globally to remove nutrients and other contaminants from inflow waters and to maintain desired outflow water quality (Kadlec and Wallace, 2009; Vymazal, 2022). Management approaches can vary, depending on the chemical composition of nutrients or contaminants in the inflow water, climate, hydrologic setting, vegetation, and wetland type. For example, small-scale treatment wetlands with active management of hydrology, soils, and vegetation are sometimes integrated with conventional water treatment systems to improve outflow water quality. Large-scale treatment wetlands, such as STAs, are usually designed as passive systems with minimal or no active management. The hydrologic and biogeochemical processes in these ecosystems are intended to mimic processes that occur in natural wetlands. Considerable information is available on performance of treatment wetlands operated at multiple scales (Kadlec and Wallace, 2009; Vymazal, 2022).
How STAs Remove Phosphorus
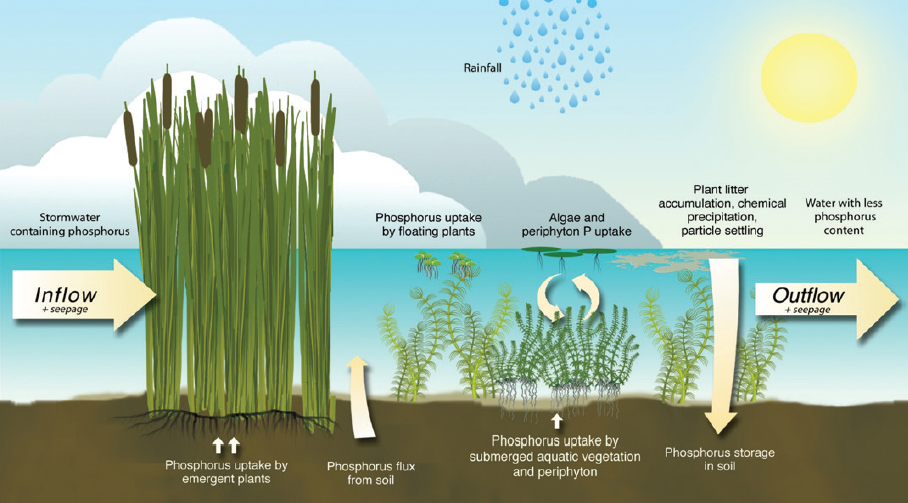
The design and operation of Everglades STAs is based on creating environmental conditions along a flow path that promotes phosphorus removal from the inflow water. Phosphorus removal occurs through short-term retention
SOURCE: SFWMD.
processes, such as uptake in vegetation, periphyton,12 and microbial communities, as well as long-term storage through abiotic sorption, precipitation, and soil accretion (Figure 4-4; Kadlec and Wallace, 2009; Reddy and DeLaune, 2008). In the soil and water column, phosphorus is present in organic and inorganic forms, which can be present as dissolved and/or particulate forms (Box 4-3; Appendix B). The relative proportion of these forms affects the mobility and processing of phosphorus in STAs. In addition, biogeochemical conditions (e.g., pH, redox) and interactions with other elements (e.g., carbon, nitrogen, sulfur, calcium, magnesium, iron, aluminum) affect phosphorus mobility and bioavailability, ultimately influencing outflow TP concentrations and the overall performance of STAs.
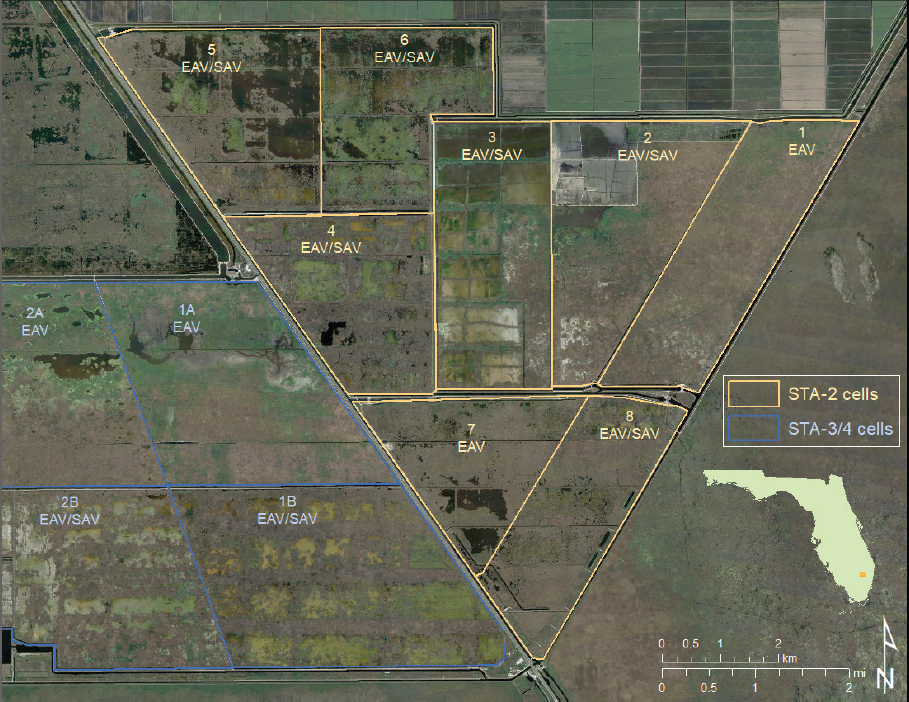
Aquatic vegetation and periphyton are essential components of STA function. Types of vegetation include emergent aquatic vegetation (EAV), submerged
___________________
12 Periphyton is a community of attached algae and other microbes that occur throughout the wetlands.
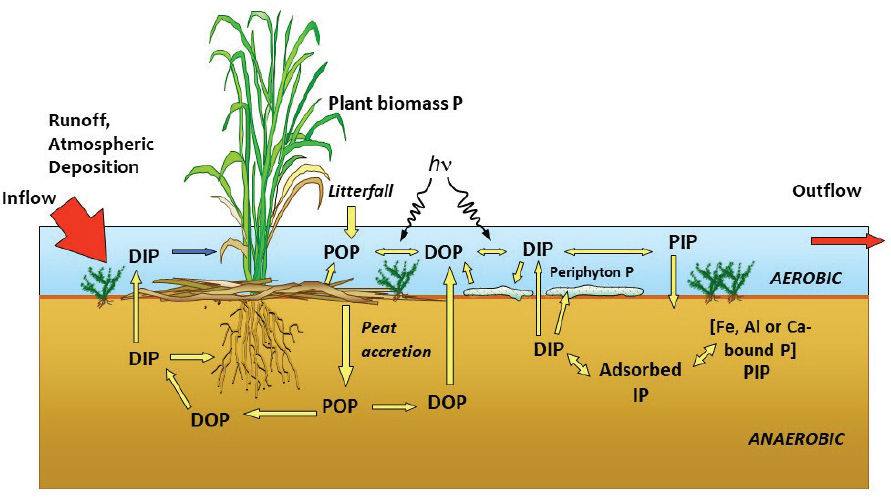
NOTES: DIP = dissolved inorganic phosphorus, DOP = dissolved organic phosphorus, PIP = particulate inorganic phosphorus, POP = particulate organic phosphorus.
SOURCE: Modified from Reddy and DeLaune, 2008.
aquatic vegetation (SAV), and floating aquatic vegetation (FAV). STA cells are typically classified by the dominant vegetation type because EAV and SAV function somewhat differently within STAs (see Figures B-2 to B-6 in Appendix B). EAV (mostly dominated by cattails [Typha latifolia and Typha domingensis]) is particularly effective in sequestering nutrients by uptake through its large root system including rhizomes. In addition to high productivity and standing crop of biomass, EAV supports accumulation of organic matter through biomass decomposition and the production of plant litter (Reddy and DeLaune, 2008). EAV soils are characterized by lower mineral matter and higher organic matter.
In treatment cells containing SAV, underwater photosynthesis and primary productivity promote alkalization and calcium carbonate (CaCO3) formation in the water column that is deposited as a fine particulate sediment. This chalky, amorphous CaCO3 provides a substrate to adsorb and precipitate dissolved phosphorus more effectively than soils in EAV areas (Figure 4-7; Dierberg et al., 2002; Reddy et al., 2021). This recently accreted material, or floc, derived from
SOURCE: Data from Hu and James, 2021.
particulate inorganic material and partially decomposed plant litter, is easily resuspended into the water column.
Small areas with deep water zones near STA inflows are sometimes colonized by FAV. Although FAV can assimilate phosphorus in the biomass, it is generally undesirable in STA operations because it spreads rapidly, depletes water column oxygen, lowers pH, and interferes with the underwater growth of shoots of EAV. In addition, FAV also blocks light transmittance through the water column, limiting SAV and associated periphyton growth. Thus, as part of routine maintenance, FAV is removed from STAs or killed using herbicides.13
Periphyton-based stormwater treatment areas (PSTAs) have also been explored as a means to reach low discharge concentrations via downstream polishing cells (Zamorano et al., 2018; Zhao et al., 2015). To support the growth
___________________
13 FAV die-off can result in significant increases in water column phosphorus and nitrogen (Reddy and Sacco, 1981).
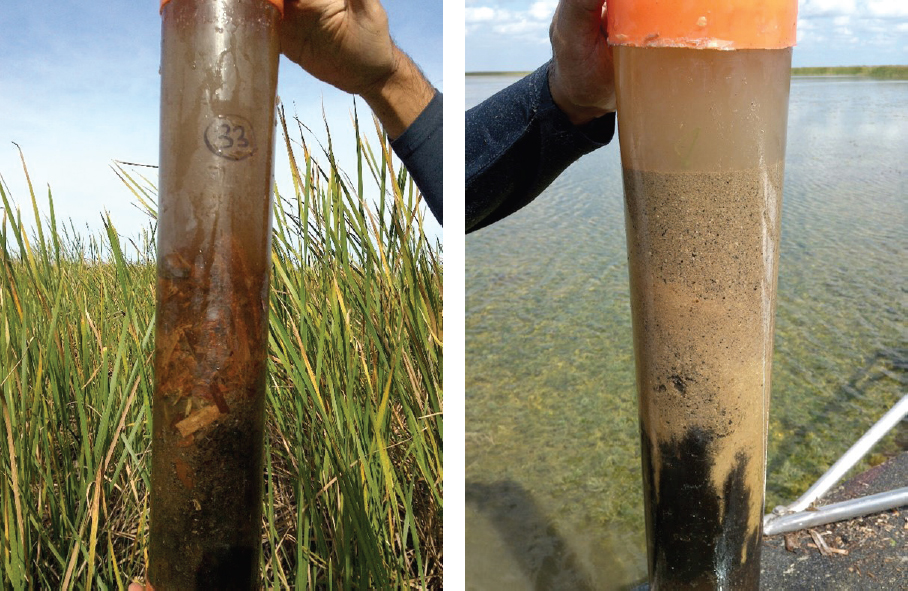
SOURCE: J. King, SFWMD.
and function of periphyton, the soil from the PSTA cell is initially removed down to the underlying limestone caprock to reduce potential internal phosphorus loading from existing soil.
Accretion of organic and mineral matter in sediments is thought to be the major mechanism for the long-term sequestration of nutrients and other contaminants in these wetlands (Bhomia et al., 2015; Kadlec and Wallace, 2009; Reddy et al., 2021). Over time the residual floc material is compacted and becomes part of recently accreted soil (Bhomia et al., 2015). Soil accretion rates for STAs can range from a few millimeters to more than 1 centimeter per year (Bhomia et al., 2015; Dierberg et al., 2021; Reddy et al., 2021). The net accumulation
of phosphorus in plant material can be influenced by vegetation type, characteristics of detrital material, and the water column chemistry. With time, STAs will accrete organic and mineral matter with different physical and biological characteristics and nutrient retention characteristics than the underlying soil (Bhomia et al., 2015).
Hydraulic conditions such as hydraulic loading rate, velocity, water depth, flow distribution, and hydroperiod are critical design and operational considerations for effective removal of phosphorus. STAs are designed to promote sheet flow without preferential flow paths. Each STA contains multiple flow-ways and cells to ensure even distribution of flows across the treatment area. Dense vegetation communities near STA inflows are designed to reduce the water velocity, creating a quiescent flow regime that facilitates particulate settling and nutrient removal. High flows or intense wind and storm events can mobilize floc and increase TP in the water column. Simple schematic maps of individual STA showing flow paths and vegetation configuration within treatment cells are presented in Appendix B.
Role of Flow Equalization Basins
STAs work most effectively when the water and phosphorus inflows are moderated to be appropriate for the capacity of the treatment area. Too much flow or dry-down conditions can impact STA performance, sometimes for an extended period. FEBs are designed to provide upstream water storage to moderate the flow of water into an STA to optimize performance over a range of hydrologic conditions. Shallow, vegetated FEBs can also serve to remove phosphorus, although that is not their primary purpose. As part of Restoration Strategies, two FEBs (A-1 and L-8) are now operational, and a third is under construction.
EVALUATION OF CURRENT CONDITIONS AND STRATEGIES OF INDIVIDUAL STAS TOWARD THE WQBEL
The recent performance of each of the five Everglades Construction Project/Restoration Strategies STAs are briefly summarized in this section by flow path, and more detailed descriptions and diagrams of each STA are provided in Appendix B. Current performance is discussed relative to the WQBEL criteria of “shall not exceed: 13 µg/L as an annual flow-weighted mean (FWM) in more than 3 out of 5 water years on a rolling basis; and 19 µg/L as an annual flow-weighted mean (AFWM) in any water year” (FDEP, 2017a0). Key operational parameters and recent (WY 2017-2022) performance for all STAs are summarized in Table 4-2.
TABLE 4-2 Key Characteristics of the STAs for Water Years 2017-2022
| STAs | Began Operation (WY) | Treatment Areaa (acres) | Inflow Water Volume (MAF/yr) | Average Inflow Concb (μg/L) | Average Outflow Concb (μg/L) | Phosphorus Loading Rate (g/m2-yr) | Hydraulic Loading Rate (cm/day) | TP Retention Rate (g/m2-yr) |
|---|---|---|---|---|---|---|---|---|
| STA-1E | 2006 | 4,994 | 0.189 | 157 | 29 | 2.33 | 4.4 | 1.91 |
| STA-1W | 1994 | 10,810c | 0.142 | 194 | 33 | 1.31 | 1.8 | 1.04 |
| STA-2 | 2000 | 15,495 | 0.351 | 102 | 22 | 0.75 | 2.0 | 0.58 |
| STA-3/4 | 2004 | 16,327 | 0.452 | 84 | 13 | 0.73 | 2.4 | 0.62 |
| STA-5/6 | 1998 and 2000; combined in 2012 | 14,338 | 0.160 | 218 | 56 | 0.89 | 1.1 | 0.60 |
a Defined as total wetted surface area of the STA.
b Concentrations are flow-weighted means.
c Total area reflects 4,260 acres in STA-1W Expansion area #1 that became fully operational in WY 2021.
SOURCES: Data from Chimney, 2018, 2019, 2020, 2021, 2022a,b.
Central Flow Path: STA-3/4 and STA-2
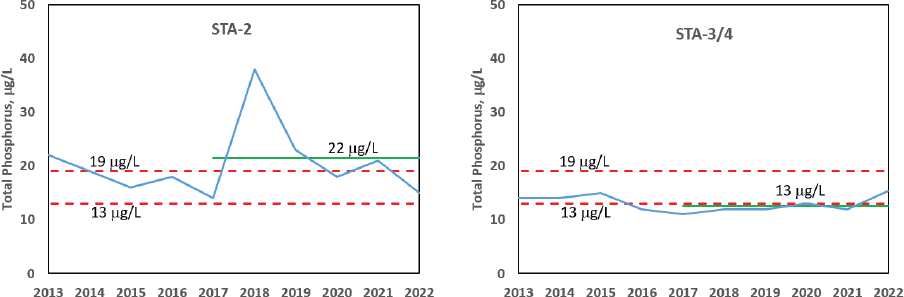
The best-performing Everglades STAs are situated in the Central Flow Path (see Figure 4-2) and receive inflows from the EAA and Lake Okeechobee, with inflow TP concentrations to STA-2 and STA-3/4 approximately 50 percent lower than those to the other STAs (Table 4-2).14 STA-3/4 has shown consistently impressive performance over the period of record and has maintained effluent phosphorus concentrations consistent with the WQBEL requirements during the recent 6 years (WY 2017-2022), with a flow-weighted mean discharge of 13 µg/L TP (Figure 4-8; Table B-1). The Restoration Strategies A-1 FEB (15,000 acres, 4 feet deep), completed in 2015, helps attenuate peak inflows to both STA-3/4 and STA-2 and also significantly reduces TP concentrations in the FEB outflows, essentially acting as a large supplemental STA. All Restoration Strategies actions have been completed for STA-3/4, and if best practices and optimal operational metrics are continued, this STA is poised to maintain outflow TP concentrations required by the WQBEL.
STA-2 has effluent phosphorus concentrations that are close to meeting the WQBEL. In 6 out of the past 10 years, STA-2 discharge has met the upper annual limit (19 µg/L TP) but has never met the lower limit of the WQBEL (13 µg/L TP, required in at least 2 of every 5 years; see Figure 4-8). Efforts are under way to refurbish Flow-ways 2 and 3 (Figure B-3) in WY 2022-2023 by regrading the
___________________
14 Text was added following the prepublication release of the report to include Lake Okeechobee among the inflow sources.
SOURCES: Data from Chimney, 2014, 2015a, 2017, 2018, 2019, 2020, 2021, 2022a,b; Pietro, 2016.
soil to address vegetation recruitment issues posed by uneven topography and to prevent hydrologic short circuiting. Recent vegetation management efforts have included restoration of damaged cattail stands after disruptions from intense storm events, including Hurricane Irma, and treatment of FAV (Chimney, 2022a). Between March 2021 and March 2022, flow-weighted mean outflow concentrations from Flow-ways 1, 4, and 5 averaged 13 µg/L TP or below, suggesting promise for STA-2 to meet the WQBEL if performance issues in Flow-ways 2 and 3 are successfully addressed (N. Hooseinny, SFWMD, personal communication, 2022).15
Eastern Flow Path: STA-1E and STA-1W
The discharges in the STAs of the Eastern Flow Path (see Figure 4-2) far exceed WQBEL requirements (Figure 4-9). STA-1E and STA-1W receive inflows from the C-51 West, S-5A, and L-8 Basins with some regulatory releases from Lake Okeechobee, and average inflow TP concentrations (157 µg/L and 194 µg/L for STA-1E and STA-1W, respectively, for WY 2017-2022) and phosphorus loading rates are much larger than those of the Central Flow Path (Table 4-2).
___________________
15 This text has been corrected following prepublication release of the report to correct the reported STA measurement locations.
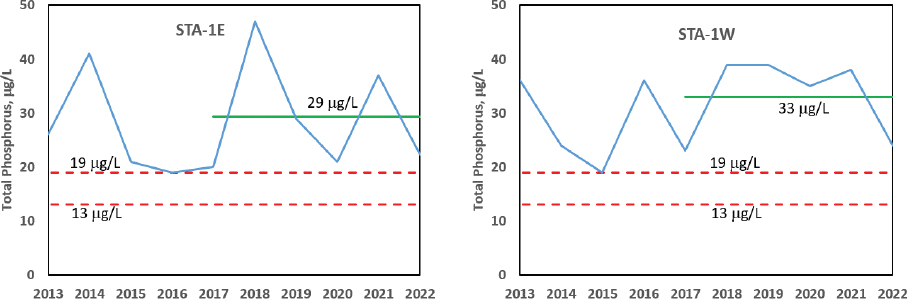
SOURCES: Data from Chimney, 2014, 2015a, 2017, 2018, 2019, 2020, 2021, 2022a,b; Pietro, 2016.
Neither STA has experienced average annual discharges below 19 µg/L during the past 6 years.
Significant work is now under way through Restoration Strategies to address performance issues, including efforts to mitigate hydraulic short circuiting, excessive dry downs, and high phosphorus loading rates. Cells 5 and 7 of STA-1E have been regraded to better support growth of EAV, and efforts are under way to improve hydraulics and topographic issues in the three flow-ways of STA-1W, which are scheduled for completion in 2022. Long-term operations of the 45,000 AF L-8 FEB are expected to commence by the end of 2022, which will serve to moderate high and low inflows to STA-1E and STA-1W and thereby improve performance, although this deep below-ground reservoir does not provide phosphorus removal, like the A-1 FEB. The SFWMD is working to manage operations to avoid observed increases in TP concentrations from the L-8 FEB after heavy rains (see Appendix B). An additional 5,860 acres16 of STA-1W expansion area are in progress—Expansion #1 (4,260 acres) became operational in WY 2021, and Expansion #2 (1,600 acres) is expected to become operational in 2024 (Figure 4-2). Together, these two Restoration Strategies expansion areas will increase the total STA area of the Eastern Flow Path by approximately 50 percent.
___________________
16 Reported as treatment area.
Subregional source control efforts were included in the Restoration Strategies program to reduce the inflow of phosphorus into STA-1E and STA-1W (SFWMD, 2012), and specific projects “are being considered based on a combination of factors, including water quality of discharges, proximity and potential impact of discharges to STAs, and having willing local participants” (Shuford et al., 2022). Two pilot studies were conducted to help inform the design of subregional source control projects. From 2013 to 2015, a pilot project was conducted to examine the effects of dredging sediments and vegetation from canals (canal cleaning) in the East Beach Water Control District (CH2M Hill, 2016a). The SFWMD reported that effects of the pilot project were difficult to discern under varying hydrologic conditions with the existing baseline data (Hutchins et al., 2017). The second pilot project involved an analysis of existing water quality data and activities in the S-5A Basin within the EAA (CH2M Hill, 2016b, 2017). Shuford et al. (2022) note that the SFWMD continues to develop “preliminary subregional source control concepts and to seek participation from S-5A basin stakeholders. Additional concepts are expected to be developed as these discussions continue.” In summary, significant progress is under way in STA expansion and refurbishment in the Eastern Flow Path, but no progress in reducing loads is apparent through additional Restoration Strategies subregional source control practices despite a decade of effort.
STA-5/6 (Western Flow Path)
STA-5/6 is challenged by high inflow TP concentrations from the C-139 Basin (218 µg/L on average for WY 2017-2022) and low hydraulic loading (Table 4-2). In recent years, STA-5/6 has far exceeded the WQBEL discharge concentrations, with only 1 year in the past 6 years with average annual discharges below 19 µg/L (Figure 4-10). Between 2018 and 2020, refurbishment operations were under way on STA-5/6 as part of Restoration Strategies, including earthwork and regrading on more than 1,100 acres to address uneven topography and “non-effective treatment areas” (Shuford et al., 2022).
Runoff from the C-139 Basin is flashy, with long periods of little to no runoff. Portions of STA-5/6 dry out nearly every year (see Appendix B), and the rainy season brings high volume inflows that release high phosphorus concentrations from the STA upon rewetting. To operate most effectively, STAs need steady water delivery throughout the year to maintain saturated conditions in all flow-ways. The new Restoration Strategies C-139 FEB, which is projected to be operational in 2024, is expected to hold 11,000 AF to provide additional water to help maintain hydration of the STA during dry periods (Shuford et al., 2022). However, the C-139 FEB is substantially smaller in volume than the A-1 and L-8
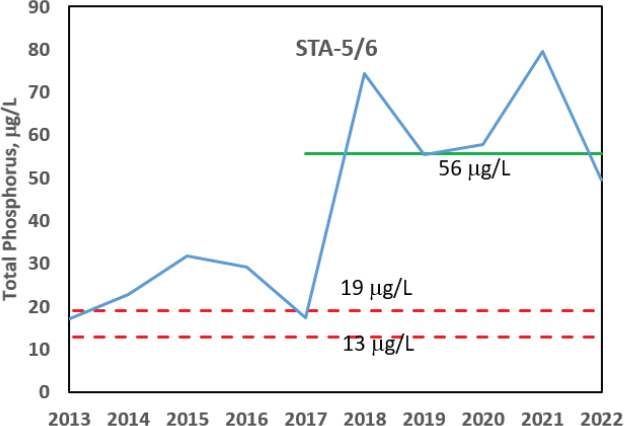
SOURCES: Data from Chimney, 2014, 2015a, 2017, 2018, 2019, 2020, 2021, 2022a,b; Pietro, 2016.
FEBs, and the extent to which it will ameliorate the long dry periods remains unclear.17 If the FEB cannot maintain saturated conditions, STA-5/6 could benefit from a new connection to the Miami Canal (and Lake Okeechobee) that would provide additional water supply to the STA-5/6 inflows to prevent dry-down conditions and potentially provide additional flexibility for managing inflows to STA-2 and STA-3/4.
Assessment Across All STAs
Efforts undertaken as part of Restoration Strategies are expected to improve the performance of all STAs. The impressive performance of STA-3/4 shows that sustained discharge with TP concentrations below 13 µg/L is possible, especially if associated with low phosphorus inflow concentrations and loading rates. How-
___________________
17 Models used as the basis for the 2012 Restoration Strategies Regional Water Quality Plan did not have the ability to reliably simulate durations of dryouts (J. Otero, SFWMD, personal communication, 2022).
SOURCES: Data from Chimney, 2018, 2019, 2020, 2021, 2022a,b.
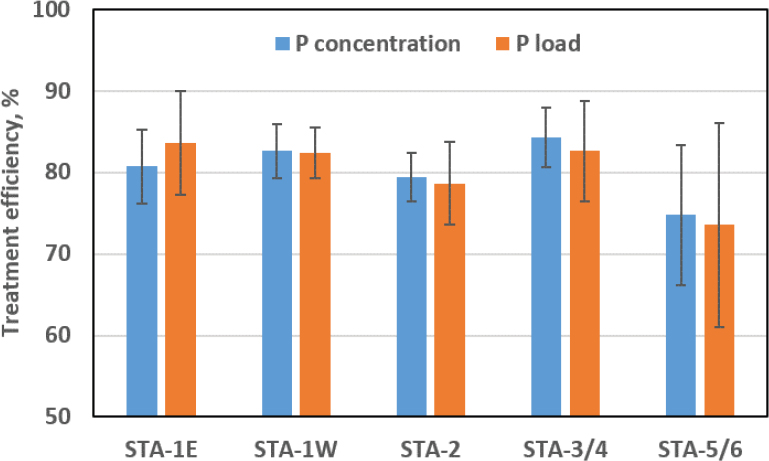
ever, the challenge of meeting the WQBEL starting in WY 2027 is substantial. A helpful way to illustrate key challenges across the different STAs is to calculate phosphorus treatment efficiency based on either average flow-weighted mean inflow and outflow TP concentrations or inflow and outflow TP loads.18
Phosphorus treatment efficiency of STAs based on average inflow and outflow concentrations over the most recent 6 years (WY 2017-2022) ranged from 74 to 85 percent (Figure 4-11; Table 4-3). The highest and lowest treatment efficiencies were found in STA-3/4 and STA-5/6, respectively. The range of treatment efficiencies across the STAs, however, was relatively small, especially considering the larger range in outflow concentrations. STAs with higher inflow TP concentrations will require substantially greater STA treatment efficiencies to meet the WQBEL compared to those with lower inflow TP concentrations. For example, for WY 2017-2022, the treatment efficiency of STA-2, considered to be a well-performing STA (flow-weighted mean inflow and outflow concentrations
___________________
18 TP treatment efficiency = ((Inflow TP – Outflow TP)/Inflow TP)*100.
TABLE 4-3 Anticipated Phosphorus Treatment Efficiency to Achieve the WQBEL at the Ambient Inflow TP Concentrations Indicated
| Recent Conditions (WY 2017-2022) | Future Efficiency Needed to Meet an Annual Average of | ||||
|---|---|---|---|---|---|
| Inflow TP concentration μg/L | Outflow TP concentration μg/L | Treatment efficiency (%) | 13 μg/L TP | 19 μg/L TP | |
| STA-1E | 157 | 29 | 81 | 92 | 88 |
| STA-1W | 194 | 33 | 83 | 93 | 90 |
| STA-2 | 102 | 22 | 79 | 87 | 81 |
| STA-3/4 | 84 | 13 | 85 | 85 | 77 |
| STA-5/6 | 218 | 56 | 74 | 94 | 91 |
NOTE: Treatment efficiency is the bulk treatment efficiency over the operational period WY 2017-2022.
SOURCES: Data from Chimney, 2018, 2019, 2020, 2021, 2022a,b.
of 102 and 22 µg/L TP, respectively, was actually lower than the treatment efficiency of poorly performing STA-1W (flow-weighted mean inflow and outflow concentrations of 194 and 33 µg/L TP, respectively).
As demonstrated in Table 4-3, the STAs that are not currently meeting the WQBEL must increase their efficiency, beyond the current efficiency of STA-3/4, or reduce inflow concentrations and/or loads. For example, to achieve the 13 µg/L TP target with current average inflow concentrations and loads, the treatment efficiency of STA-1W must increase to 93 percent and the STA-5/6 treatment efficiency must increase to 94 percent, which is significantly higher than STA-3/4, which is currently operating at 85 percent removal efficiency (Table 4-3). A few of the STAs may already be functioning at or near their limits of performance, and current STA performance is very good compared to treatment wetlands currently used globally for nutrient reduction to protect downstream water quality.
Efforts are also under way through Restoration Strategies to reduce phosphorus loading rates by increasing the STA treatment area in the Eastern Flow Path. Moreover, Restoration Strategies envisioned efforts to reduce phosphorus loads through subregional source control efforts, although no source reduction projects have been implemented. Inflow TP concentrations must be reduced by 50 to 60 percent to bring the other STAs to the same concentrations as are currently experienced in STA-2 and STA-3/4. For STA-1E and STA-1W, expansion of the treatment area coupled with L-8 FEB will help to reduce phosphorus loads and potentially reduce outflow TP concentrations. Shallow vegetated FEBs in the Western and Central Flow Paths may help reduce inflow concentrations.
The above analysis highlights several common factors among the best-performing STAs: low phosphorus loading rates, low inflow TP concentrations, moderate hydraulic loading rates, and large STA sizes (see Table 4-2 and Appendix B). Poor-performing STAs tend to have high phosphorus loading rates, high inflow TP concentrations, and/or high or low hydraulic loading rates. These factors and others will be explored in the next section as drivers of performance, to inform actions that could improve performance.
EXTERNAL AND INTERNAL DRIVERS REGULATING STA PERFORMANCE
The function and ability of STAs to remove phosphorus and ultimately meet the WQBEL is regulated by both external and internal drivers. Key external drivers include inflow phosphorus concentrations and loading rates, hydraulic loading, and inflow water chemistry, which all can be affected by the source of the inflow water (e.g., EAA, C-139 Basin, Lake Okeechobee water). These external drivers are affected by climate change variables such as increasing temperature and irregular rainfall patterns, which are manifested as more intense storms, more frequent hurricanes, and more intense periods of water shortages and drought. Internal drivers include the biological communities within an STA (e.g., vegetation, periphyton, microbes), phosphorus enrichment in soils, water chemistry, and nutrient status over flow paths. Internal drivers are linked to external drivers, which together influence the overall operating system that supports the function of STAs to remove phosphorus from inflow waters. For STAs, many of these external drivers have been well studied, but understanding of the role of internal drivers in regulating the performance of STAs is more limited.
Key External Drivers
External drivers control inputs of water and nutrients to STAs or disturb those systems. Many of these drivers can be managed with STA treatment area and design criteria and use of FEBs.
Phosphorus Concentrations and Loading Rates
Phosphorus Concentrations.
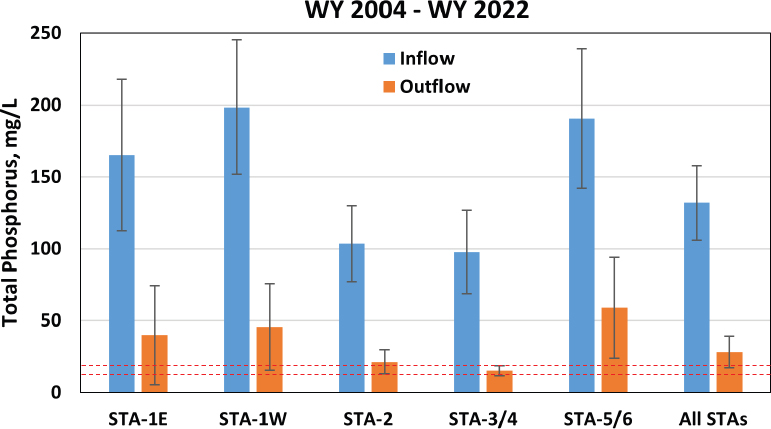
The concentration of phosphorus in inflow water is an important controller of STA performance (Kadlec and Wallace, 2009; Zhao and Piccone, 2020). The higher the inflow concentration, the greater the percent removal required of the STA to reach the target concentration of 13 µg/L. Chimney (2022a) noted, “Depending on the averaging period, inflow
TP concentration generally accounted for 50 to 60% of the variability in outflow TP concentration…” based on past SFWMD analyses of STA data over the period of record.
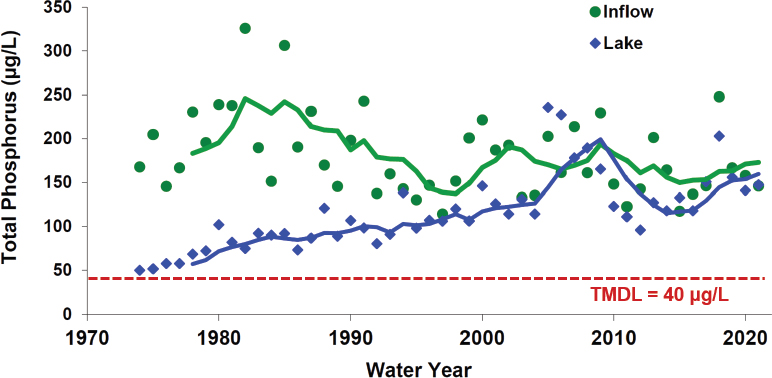
Average annual flow-weighted inflow concentrations for WY 2004-2022 across all STAs range from less than 100 to more than 200 µg/L TP (Figure B-1). Long-term average TP concentrations of inflow water during the operation period are approximately 50 percent lower for the best-performing STAs (STA-2 and STA-3/4) compared to STA-1E, -1W, and -5/6 (Figure 4-12). With low inflow TP concentrations, STA-2 and STA-3/4 have been highly resilient throughout their operational period. Moreover, STA-3/4 has been able to maintain annual outflow TP concentrations to meet the upper limit of the WQBEL since WY 2009 and both the 13 and 19 µg/L TP requirements since WY 2017 (applied on a rolling basis to the prior 5 years of data) (see Figure B-1, Appendix B).19
Inflow TP concentrations are affected by watershed hydrology, land use, fertilizer and manure applications, legacy phosphorus in soils, storm events, drought, and best management practices applied at the farm and basin scales (see NRC [2010] for more discussion of source control requirements and strategies). Intense storms can initially flush nutrients from the watershed, although extended wet periods generally dilute TP concentrations. Changing sources of inflow, such as increasing water deliveries from Lake Okeechobee, will also affect TP concentrations in STA inflows (see Box 4-4). Broader or more intensive use of best management practices would provide the best opportunity to reduce TP concentrations and loads in STA inflows.
Phosphorus Loading Rates.
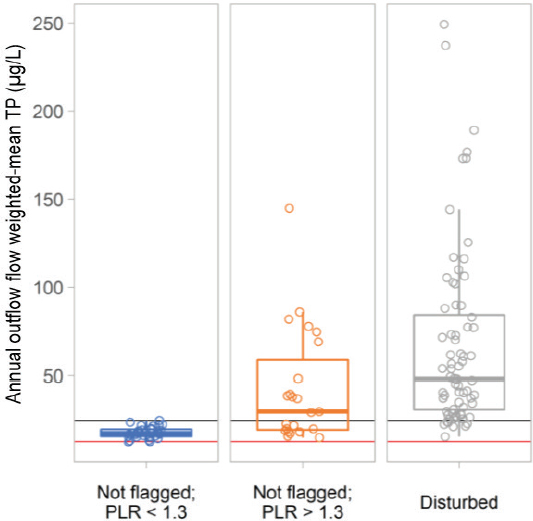
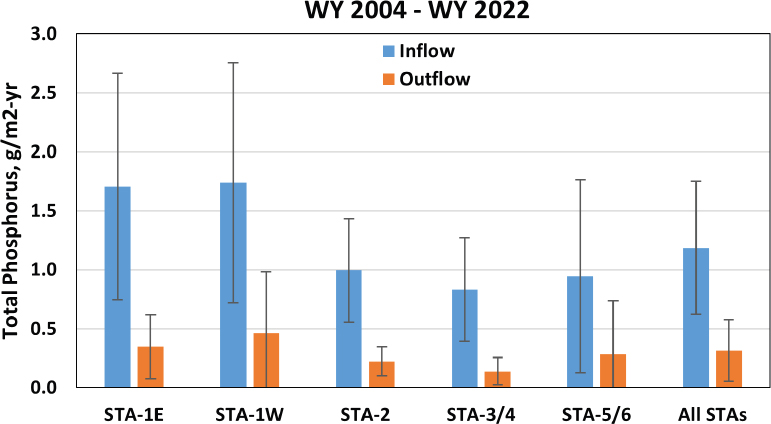
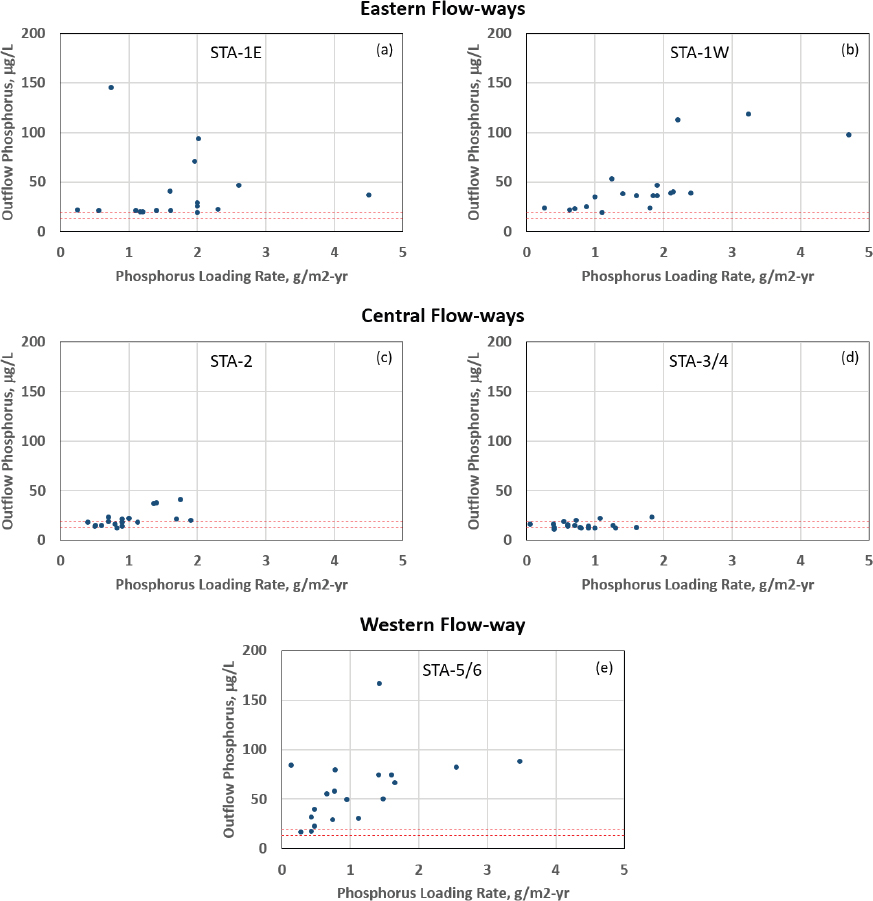
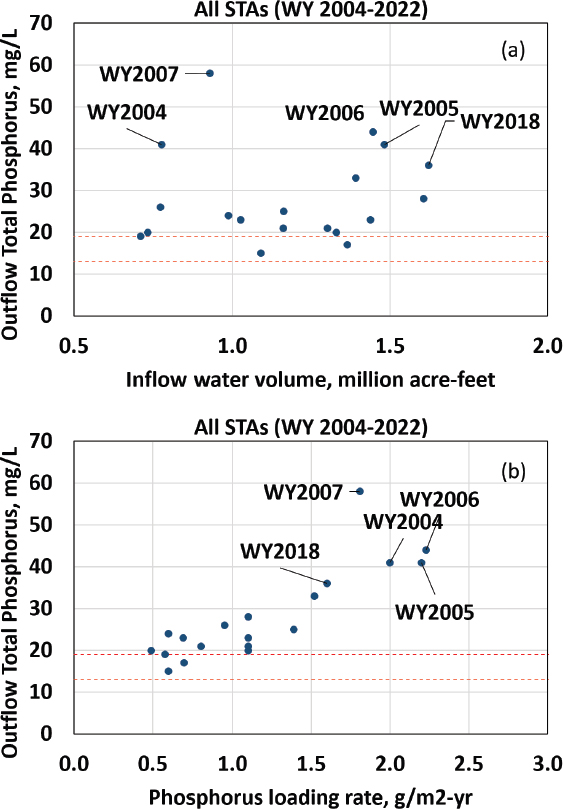
One of the most consistent external factors driving STA performance is phosphorus loading rates from external sources. In a recent study, DB Environmental (2022) reported that phosphorus loading rates less than 1.3 g/m2-yr with no disturbance (e.g., construction, vegetation damage from severe storms) consistently showed mean annual flow-weighted outflow concentrations less than 25 µg/L TP. In contrast, undisturbed STAs with phosphorus loading rates greater than 1.3 g/m2-yr exhibited higher mean annual flow-weighted outflow concentrations (Figure 4-14). Over the long term, low TP loading rates (< 1.0 g/m2-yr P) to STA-2 and STA-3/4 have helped to maintain low outflow TP concentrations, compared to the other STAs (Figures 4-15 and 4-16). STA-1E and STA-1W experienced high phosphorus loading rates of greater than 2 g P/m2-yr for 7 years, between 1 and 2 g P/m2-yr for 7 years, and less than 1 g P/m2-yr for only 4 years. These observations are consistent with earlier studies reported by Kadlec (1999) and Richardson et al. (1997).
___________________
19 Following the prepublication release of the report, edits were made here and in Appendix B to correct and clarify the performance of STA-3/4 relative to the WQBEL.
SOURCES: Data from Chimney, 2014, 2015a, 2016, 2017, 2018, 2019, 2020, 2021, 2022a,b; Germain and Pietro, 2011; Goforth et al., 2005; Ivanoff et al., 2012, 2013; Pietro, 2016; Pietro et al., 2006, 2007, 2008, 2009, 2010.
STAs experiencing vegetation disturbance showed still greater effluent TP concentrations (Figure 4-14), suggesting that low phosphorus loading rates are an important but not the sole factor driving STA performance.
Increasing the size of the STA footprint, as is under way in the Eastern Flow Path, can help address conditions with high phosphorus loading rates. Construction of shallow, naturally vegetated FEBs, as are part of Restoration Strategies in the Central and Western Flow Paths, can reduce both phosphorus loading rates and inflow concentrations.
Disturbance Events: Storms and Droughts
Disturbance events, such as flooding or high winds with vegetation damage, dryout, and construction, can also affect STA performance. DB Environmental (2022) evaluated the performance along flow-ways over time within STA-1E,
SOURCE: Modified from Zhang et al., 2022.
SOURCE: DB Environmental, 2022, under contract to the SFWMD.
-1W, -2, and -5/6 (see Figures B-2 to B-6 for diagrams of the flow-ways in each STA) and showed a strong effect of disturbance on outflow TP concentrations. The mean outflow concentrations from flow-ways in which the vegetation was disturbed were nearly double those of undisturbed flow-ways with high loading rates (see Figure 4-14). The period of elevated outflow TP concentrations may range from a few weeks to more than a year depending on the type of the disturbance, its location along the STA flow-way, the type of vegetation affected, floc and soil resuspension, and the efforts to rehabilitate the system after an event.
Storms and High Hydraulic Loading.
Storm events or prolonged wet weather can influence STA performance through changes in hydraulic loading. Storms often coincide with increases in phosphorus inflow concentrations and loads,
SOURCES: Data from Chimney, 2014, 2015a, 2017, 2018, 2019, 2020, 2021, 2022a,b; Germain and Pietro, 2011; Goforth et al., 2005; Ivanoff et al., 2012, 2013; Pietro, 2016; Pietro et al., 2006, 2007, 2008, 2009, 2010.
leading to a decrease in STA performance (Figure 4-17). During the operation period, STA performance was affected by several tropical storms and hurricanes including Francis and Jeanne (WY 2005), Wilma (WY 2006), Ernesto (WY 2007), and Irma (WY 2018). Flood events trigger high pumping rates into the STAs, which are part of the EAA flood protection system, increasing flow velocity and particle entrainment and decreasing the hydraulic residence time within STAs, which can diminish performance. High hydraulic loading can also increase water depth within an STA. Water depths in EAV treatment cells exceeding 3 feet result in physiological stress in plants, reducing biomass and plant density and ultimately decreasing phosphorus removal (Diaz, 2022). Deep water conditions for extended periods can result in widespread mortality of cattails and formation of floating tussocks.
Over the past 7 years, significant quantities of STA inflows have come from Lake Okeechobee regulatory releases, which are used to reduce high lake levels to protect the integrity of the Herbert Hoover Dike and to improve
SOURCES: Data from Chimney, 2014, 2015a, 2017, 2018, 2019, 2020, 2021, 2022a,b; Germain and Pietro, 2011; Goforth et al., 2005; Ivanoff et al., 2012, 2013; Pietro, 2016; Pietro et al., 2006, 2007, 2008, 2009, 2010.
SOURCES: Data from Chimney, 2014, 2015a, 2017, 2018, 2019, 2020, 2021, 2022a,b; Germain and Pietro, 2011; Goforth et al., 2005; Ivanoff et al., 2012, 2013; Pietro, 2016; Pietro et al., 2006, 2007, 2008, 2009, 2010.
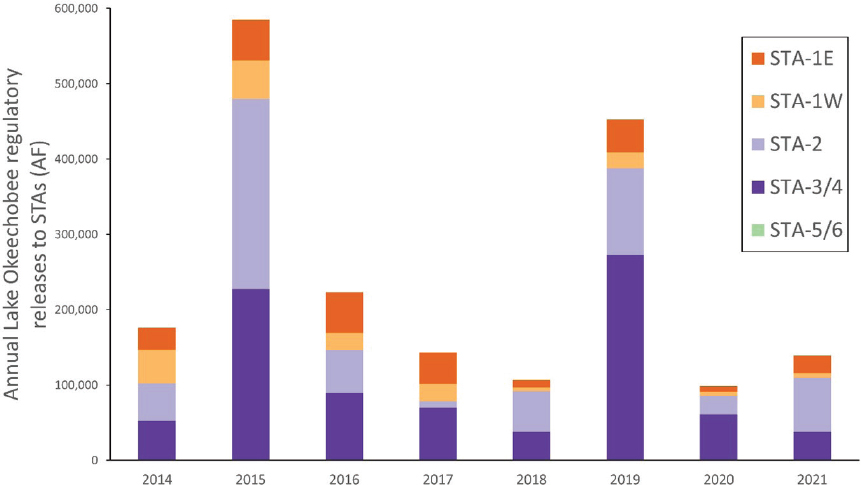
ecological conditions in the lake (see Chapter 3). The Restoration Strategies Regional Water Quality Plan (SFWMD, 2012) assumed average lake regulatory releases of 58,300 AF/yr—all through STA-3/4—but since 2014, average annual regulatory releases have been 245,000 AF/yr (Figure 4-18). These high regulatory releases to the STAs provide benefits to the northern estuaries by reducing harmful discharges and to the remnant Everglades by increasing flows, providing the equivalent of 66 percent of the CEPP’s new water benefits without any new infrastructure. Regulatory releases from Lake Okeechobee to STA-1E, -1W, and -2 (Figure 4-18) have also increased chronically high phosphorus loading rates and have added more stress to STAs that have been unable to meet the WQBEL.
The new CERP A-2 STA has been designed to significantly reduce the adverse effects of storm events on STA operations. The A-2 STA is not part of the EAA flood protection system design, and its inflow capacity (650 cfs; SFWMD, 2018a)
SOURCES: Data from Chimney, 2015a, 2017, 2018, 2019, 2020, 2021, 2022a; Pietro, 2016.
is one-tenth the inflow capacity of STA-3/4.20 With the large A-2 Reservoir effectively serving as an FEB, inflows can be moderated to optimize performance, reduce vegetation stress, and minimize sediment entrainment in canals and mobilization of floc within the STA. The A-2 STA offers an opportunity to learn how well an STA can perform with limited exposure to the effect of storm event runoff and associated high loading events.
Storms can be associated with high winds and wave action, which can damage vegetation and suspend sediment, respectively, again resulting in a deterioration of phosphorus removal efficiency (DB Environmental, 2022). SAV cells can be particularly sensitive to disturbance. Following intense storm events, substantial declines in SAV coverage and densities have been reported in several STA cells (Dombrowski et al., 2020). Vegetative buffers of EAV, such as those used in STA-3/4 and recently established in STA-2 (Figure 4-19), can reduce the impacts of high winds on SAV.
Droughts and Dryout.
Dryout and reflooding is also an important disturbance that can affect STA function (Dierberg et al., 2012; Newman and Pietro, 2001; Pant and Reddy, 2001). Soil desiccation can result in mineralization of detrital soil organic phosphorus, and in turn phosphorus can be mobilized into the water column upon subsequent reflooding (Søndergaard and Jeppesen, 2020; White et al., 2006). In addition, if STA soils experience dryout, sulfide formed under flooded soil conditions will oxidize, decreasing soil pH and mobilizing phosphorus.
The magnitude of these effects, however, depends on the conditions and location of dryout and reflooding. If dryout occurs in outflow cells, the impacts of outflow on water quality are likely more severe than for dryout in inflow cells (DB Environmental, 2022). Moreover, good vegetation coverage and condition in outflow cells can mitigate against the effects of upstream dryout due to effective retention of the mobilized phosphorus in downstream cells. Finally, the magnitude of reflooding following dryout will influence the extent of disturbance. Gradual reflooding with limited discharge generally produces limited TP increases, while reflooding involving large discharges results in large TP concentrations in outflow waters (DB Environmental, 2022). Access to water from Lake Okeechobee (currently available to all STAs except STA-5/6) or other sources of water storage, such as an FEB, can eliminate dryout conditions if sufficient water is available.
___________________
20 STA-3/4 has a maximum inflow capacity of 6,475 cfs via the G-370 and G-372 pump stations (FDEP, 2017b).
SOURCE: Modified from Google Earth 2022.
Other Constituents
Concentrations of other constituents, such as nitrogen and calcium, in inflow waters may also affect the functioning of STAs.
Nitrogen.
A balance between nitrogen and phosphorus is needed to support the primary productivity of biotic communities in STAs and other wetlands and aquatic ecosystems (Čapek et al., 2018; Conley et al., 2009; Pearl et al., 2016). However, nitrogen availability within STAs is likely an under-recognized potential driver of phosphorus treatment efficiency. Nitrogen in STAs is not currently
SOURCES: Data from Chimney, 2015a, 2017, 2018, 2019, 2020, 2021; Pietro, 2016.
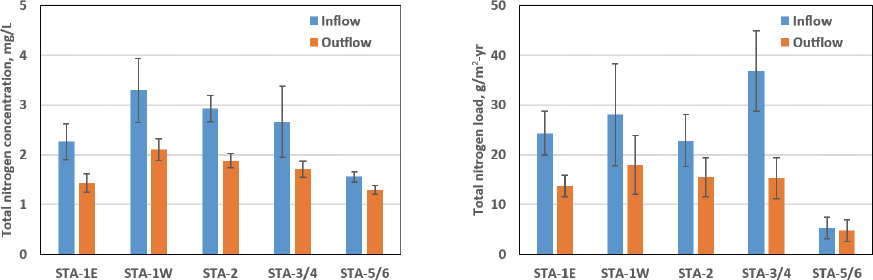
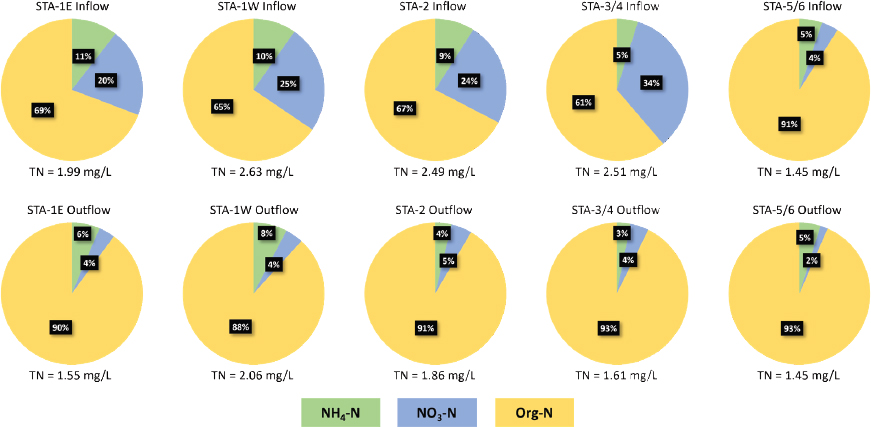
managed or intensively researched, but differences in nitrogen loads and removal efficiency among the STAs hint at the potential importance of nitrogen to STA performance. For WY 2014-2021, the highest average total nitrogen inflow loads were evident in STA-3/4, the best-performing STA, while the lowest loads occurred in STA-5/6, which in recent years has performed poorly (Figure 4-20). In general, watershed sources of nitrogen for STA inflows include inorganic and organic fertilizers, animal manures, biosolids, plant litter, and organic matter in soils. Watershed management, hydrology, soil types, redox, and land use will affect nitrogen loads and forms (e.g., inorganic and organic nitrogen; see Box 4-5) in STA inflow waters.
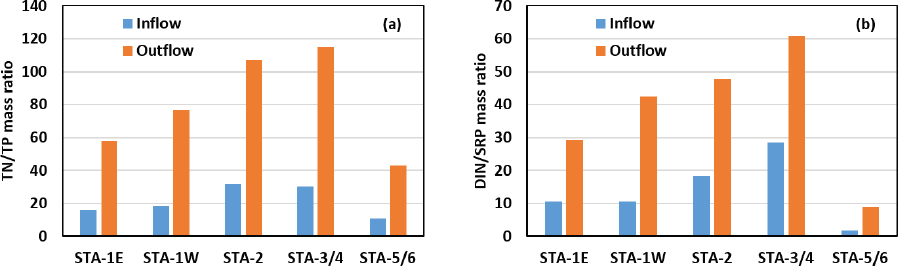
Nitrogen-to-phosphorus (N/P) ratios of water, vegetation, microbes, litter, floc, and soils commonly serve as indicators of their roles in regulating primary productivity and water quality in aquatic ecosystems (Čapek et al., 2018; Koerselman and Meuleman, 1996; Pearl et al., 2016),21 and thus, N/P ratios in STA inflows may also be indicative of differences in STA performance (Figure 4-22a). Low N/P ratios (11 to 18) are evident in the inflows of the poorly performing STAs (STA-1E, -1W, and -5/6), and relatively high N/P ratios (30 to 32) are observed for inflows in the better performing Central Flow Path (STA-2 and STA-3/4) (Figure 4-22a). STA-3/4 inflows also have the largest average fraction of dissolved inorganic nitrogen (ammonium and nitrate),
___________________
21 In this report, N/P ratios are expressed on a mass basis. Mass-based N/P ratios can be multiplied by 2.2 (31/14) to obtain molar-based N/P ratios.
SOURCE: Data from Hu and James, 2021.
SOURCE: Data from Hu and James, 2021.
which is more reactive than organic nitrogen, while STA-5/6 inflows have the lowest (Figure 4-21).
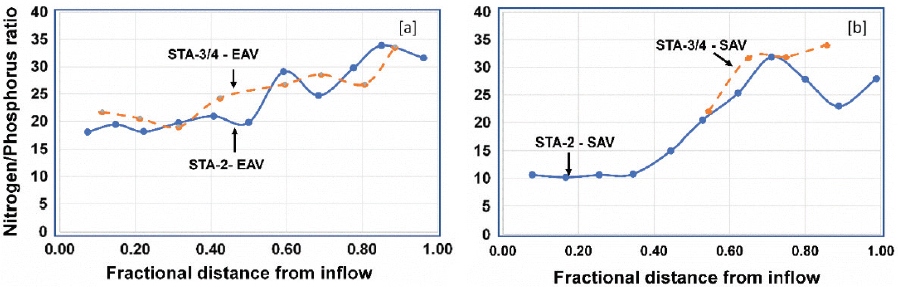
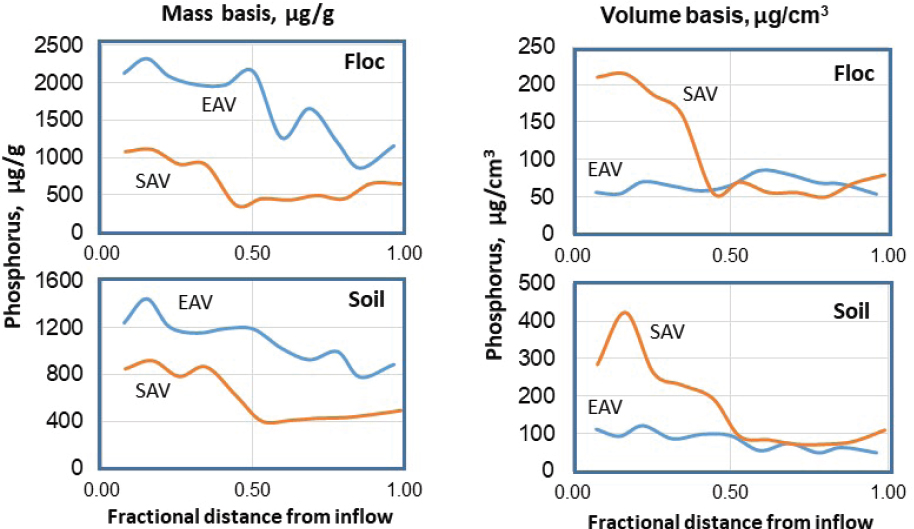
N/P ratios may also potentially serve as indicators of performance along STA flow-ways. Upstream areas of the STAs with phosphorus-saturated soils typically have lower N/P ratios in both water (Figure 4-22) and recently accreted soil and floc (Figure 4-23) compared to downstream areas because of conditions of phosphorus surplus, which can lead to nitrogen limitation or nitrogen and phosphorus co-limitation (Inglett et al., 2009; Pearl et al., 2016). Nitrogen limitation reduces phosphorus uptake by microbes, periphyton, and vegetation by suppressing the activity of phosphatase enzymes (Inglett et al., 2019a,b; Reddy et al., 2005; Tessier and Raynal, 2003). Nitrogen limitation can also decrease the primary productivity of aquatic vegetation, thereby reducing plant phosphorus uptake. As water moves through downstream in the STA and more phosphorus is removed along the flow path from the water column and stored in floc and soils relative to nitrogen, N/P ratios increase (Figures 4-22 and 4-23). At STA outflows, N/P ratios in water are about three to four times larger than their respective inflow ratios. At most STA downstream areas, there is surplus dissolved inorganic nitrogen relative to soluble reactive phosphorus (Figure 4-22; see Box 4-5) and higher activity of phosphatase enzymes in floc and soils than at upstream areas, both clear indicators of conditions of phosphorus limitation (Inglett et al., 2019a,b).
Overall, low N/P ratios in the water column coupled to soil phosphorus enrichment may indicate reduced phosphorus removal efficiency and opportuni-
NOTES: Length of the flow-way (FW): STA-2 FW-1 = 3.2 miles (5,200 m); STA-2 FW-3 =2.8 miles (4,450 m); and STA-3/4 3A and 3B = 1.9 miles (2,980 m).
SOURCE: Reddy et al., 2021.
ties for management improvements. High surface-water N/P ratios (>100) that drive phosphorus-limiting conditions are likely indicators of high phosphorus removal efficiency. Additional research on the ratios of available nitrogen and available phosphorus in soils and floc and the N/P ratios within tissues of microbes, periphyton, and plants would be necessary to confirm nitrogen limitation. Such research on the role of nitrogen in STA performance could lead to refined management strategies for both nitrogen and phosphorus.
Calcium.
Calcium plays an important role in removing phosphorus from the water column, and important relationships have been noted between calcium and phosphorus accretion in STAs and the WCAs (Craft and Richardson, 1993; Reddy et al., 1993, 2021). Underwater photosynthesis increases water column pH during the daytime and promotes CaCO3 formation and deposition into floc, which increases conditions for accumulation of phosphorus (Pederson et al., 2013; Pelechaty et al., 2013). High CaCO3 accretion, with rates of up to 1 cm/yr, occurs in SAV treatment cells (Reddy et al., 2021). Phosphorus accumulation rates in SAV cells are approximately 2-3 times higher than in EAV cells, and calcium accumulation rates are 17-42 times higher in SAV than in EAV cells.
This pattern suggests that in SAV treatment cells, CaCO3 formation immobilizes phosphorus (occlusion) and/or promotes the formation of insoluble complexes with other elements to facilitate accretion of material with high mineral content.
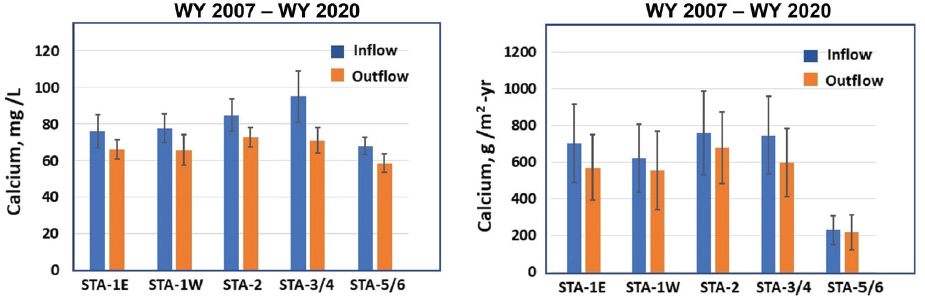
Average inflow calcium concentrations in the STAs ranged from 68 to 95 mg/L, with slightly higher values observed in the inflows of STA-3/4 and somewhat lower concentrations measured in the inflows of STA-5/6. High calcium concentrations in the inflow waters are likely due to dissolution of limestone in the subsurface soils and in the drainage canals. Overall, calcium concentrations decreased 13-25 percent between inflows and outflows. Calcium accumulation rates22 were highest in STA-3/4 (149 g/m2-yr) and lowest in STA-5/6 (14 g/m2-yr) (Figure 4-24), primarily reflecting variation in hydraulic loading rates and SAV activity that influence the production of CaCO3. At present, calcium dynamics in STAs are relatively understudied and merit additional attention in future research, monitoring, and assessment in relation to STA performance given that additional Lake Okeechobee inflows (~50 mg/L calcium) could potentially decrease CaCO3 formation and associated co-precipitation of phosphorus in SAV treatment cells. At this time, the critical calcium concentrations required to support CaCO3 formation in STAs are not known.
Key Internal Drivers
In addition to external drivers, long-term sustainable performance of STAs is also influenced by internal drivers. Understanding the roles of these drivers helps to optimize STA performance. Internal drivers are mediated by the activity of various biotic communities in concert with biogeochemical and physical processes that are supported by hydrologic processes. These processes are not well understood and are often treated as a “black box” because managers consider them to be complex and challenging to measure (Kadlec and Wallace, 2009; Reddy and DeLaune, 2008). Moreover, internal processing may not be considered a priority by managers and policymakers because the WQBEL is based on the TP concentration in STA effluent rather than concentrations within the STA compartments. Thus, a major management emphasis is placed on monitoring inflows and outflows. However, if STAs do not function to the expectations of managers, it is critical to evaluate and understand the internal processes regulating phosphorus speciation, transport, and fate in the soil and water column. These processes can provide insights to improve understanding of internal factors controlling STA performance for long-term function.
___________________
22 Calculated as the difference between the mean inflow and outflow loading rates shown in Figure 4-24.
SOURCE: Data from Hu and James, 2021.
Vegetation
EAV and SAV play pivotal roles in STA performance in reducing phosphorus concentrations. Overall, the biogeochemical processes of STAs are regulated by vegetation through uptake of nutrients and production of litter, which serves as organic substrate to microbial communities (Chimney and Pietro, 2006; DeBusk and Reddy, 2005; Reddy and DeLaune, 2008). In addition, underwater photosynthesis by SAV creates an environment that facilitates abiotic immobilization of phosphorus from the water column. Thus, healthy and stable vegetation is essential for long-term sustainable performance to reduce outflow TP concentrations to meet the WQBEL. Compared to EAV, SAV areas exhibit three times higher levels of phosphorus storage—a measure of TP storage/accretion per unit area that normalizes for differences in bulk density of floc and soils (Reddy et al., 2020, 2021). In all STAs, the SFWMD has transitioned to managing cells as mixed SAV/EAV (rather than SAV only) because EAV can help stabilize the CaCO3 floc sediment and minimize resuspension during flows and bioturbation by benthic invertebrates, fish, or other animals. Treatment cells in each STA flow-way typically consist of either EAV or mixed SAV/EAV and are operated in a series of EAV followed by SAV/EAV cells (see Figures B-2 to B-6). Current design of STAs favors mixed SAV/EAV areas over EAV because of the role of SAV in rapid accumulation of phosphorus as calcareous soils.
The use of periphyton-based polishing cells (PSTA) has also been explored due to their ability to attain outflow TP levels near 10 µg/L (Kadlec and Wallace, 2009). In 2005, the SFWMD constructed a field-scale PSTA in STA-3/4 to test its performance.23 From WY 2008 to WY 2021, the PSTA cells received annual flow-weighted mean inflow TP concentrations of 9-27 µg/L (phosphorus loading rate = 0.14-0.45 g/m2-yr) and produced annual flow-weighted mean outflow TP concentrations in the range of 8-13 µg/L (Piccone and Dombrowski, 2022; Zamorano et al., 2021). During WY 2017-2021, the average annual PSTA cell outflow concentrations were 25-33 percent lower than the overall STA-3/4 outflow concentrations (Piccone and Dombrowski, 2022). Periphyton-based cells have impressive treatment potential for polishing low concentration flows to meet the WQBEL. However, PSTA cells tend to accumulate loose phosphorus-containing floc that is vulnerable to disturbance, which may lead to discharge of higher concentrations of particulate phosphorus after storm events (Zamorano et al., 2018). Monitoring is ongoing to assess their long-term performance and sustainability.
Sustaining healthy vegetative communities in STAs is key to overall performance. As discussed previously, vegetation disturbance can result from external climatic disturbances such as extremes in flow (both high discharge and drought), windstorms, impacts from herbivory, and earthwork. Loss of aquatic vegetation does not always result in poor performance of STAs; dense communities of EAV or a mixture of EAV and SAV can help buffer STAs against the adverse effects of large flooding events (DB Environmental, 2022; Figure 4-19). Vegetation maintenance including plantings and regulation of hydrologic conditions that promote healthy and functional communities of EAV and SAV are an important and widely recognized component of overall STA management.
Phosphorus Enrichment of STA Soils
Over the period of operation, starting in WY 1994 with STA-1W, the STAs have collectively accumulated more than 3,200 metric tons of phosphorus, with a major portion stored in soils, including floc and recently accreted soil (Chimney, 2022b). Continuous phosphorus loading into the STAs has resulted in distinct phosphorus gradients in the soil and water column with high values in upstream areas and low levels in downstream areas. Spatial gradients of phosphorus in floc and soils in both EAV and SAV flow-ways have been observed along transects in STA-2 and STA-3/4 (Figures 4-25 and 4-26; Osborne et al., 2019a, b), and similar spatial gradients are also noted in the Everglades Protection Area (a synthesis
___________________
23 This 400-acre PSTA test site is composed of a 200-acre upper SAV cell, a 100-acre lower SAV cell, and a 100-acre PSTA cell.
SOURCE: Data from Reddy et al., 2019b.
of research can be found in Newman et al. [2017]). Approximately one-third of stored phosphorus is highly reactive and susceptible to release from the sediment into the water column via advective and diffusive flux, resulting in high internal loads, especially in upstream areas of treatment cells. In STAs, phosphorus flux from floc to overlying water decreases with distance from the inflows (Wright et al., 2019). The impacts of internal loading are highlighted in Figure 4-27: under no-flow conditions, a pronounced plateau in water column TP concentrations is observed in the upper portion of STA-2 Flow-way 3, suggesting that fluxes of TP from the soil into the water column are offsetting any uptake. Extensive accumulation of phosphorus in STA soils can reduce phosphorus uptake capacity or increase internal TP loading to the water column from phosphorus-enriched
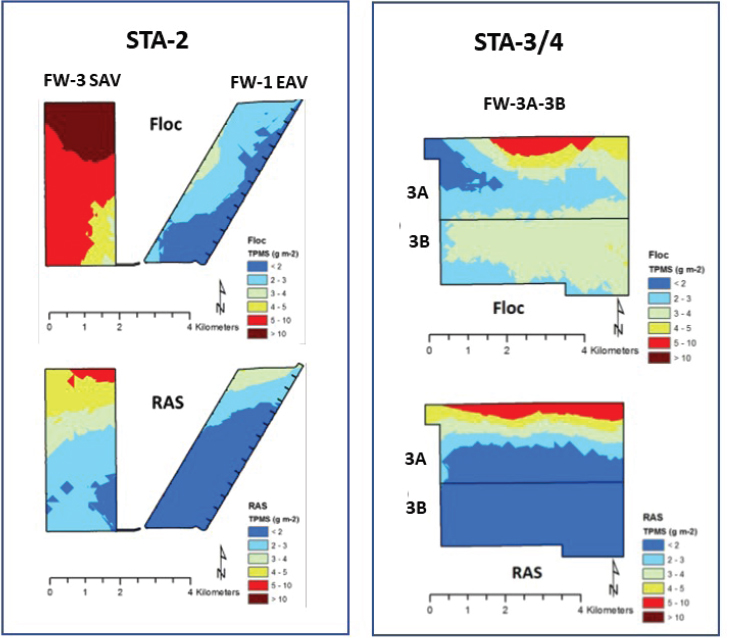
SOURCES: Osborne et al., 2019a,b.
soils, thus raising concerns about the long-term capacity to achieve and maintain desirable outflow TP concentrations.
Phosphorus removal efficiency and TP concentrations in upstream treatment cells can serve as an indicator of phosphorus saturation status of the soil and provide early warning signals of the need for management actions. The committee, however, is not aware of analyses that have been conducted on the performance of individual treatment cells as part of routine STA management.24 Management of newly accreted material by consolidation, hydrologic manipulation (water level drawdown), or application of soil amendments can potentially improve
___________________
24 Information received after release of the prepublication version of this report indicates that such analyses do exist.
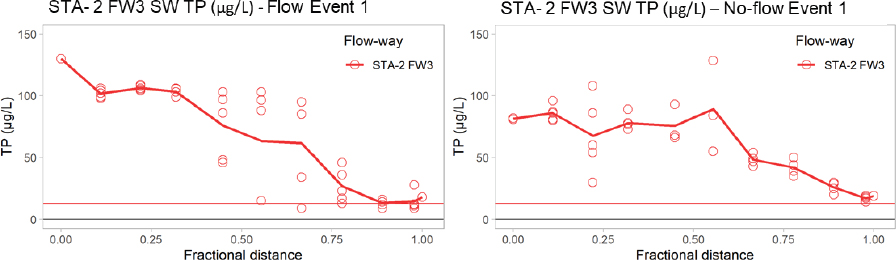
NOTES: Each point represents one monitoring station. The thick red line connects the mean value of TP concentrations at each transect. The horizontal red line is equal to 13 µg/L.
SOURCE: DB Environmental, 2022, under contract to the SFWMD.
water quality. Under extreme conditions of phosphorus-saturated soils, an STA cell could be scraped down to remove the surface soils.
ADAPTIVE MANAGEMENT OPPORTUNITIES
Adaptive management has become a well-established concept in both restoration science and in the CERP, in which the scientific enterprise—monitoring, assessment, research, modeling, and synthesis—is used to address decision-critical uncertainties to inform project management actions (NASEM, 2021). These actions may be either reactive to existing challenges or proactive in anticipation of future challenges (Eberhard et al., 2009; Holling, 1978). Because management and/or restoration of complex ecosystems, such as the Everglades, are characterized by inherent uncertainty, adaptive management provides an effective means to meet the project objectives.
A vigorous adaptive management program is merited for an initiative as large and as consequential as Restoration Strategies, which is based on complex natural biogeochemical process whose interactions and dynamics are not fully
understood. In this section, the committee discusses key elements of such a program, including the development of near-term milestones toward achieving improvements in STA performance, science tools to support decision making, establishment of an independent advisory committee to provide guidance on STA remediation and operations, and near-term and long-term management options that can be considered in the context of adaptive management to support the state’s effort to meet the WQBEL requirements.
Development of Near-term Milestones
Quantitative objectives are essential to adaptive management of ongoing projects. Monitoring and analysis can be used to assess the degree to which management goals are being met, and the full science enterprise can be used to identify issues associated with implementation that may need to be addressed. For the STAs, WQBEL compliance beginning in WY 2027, following the full implementation of Restoration Strategies, represents the key quantitative objective. However, given the importance of WQBEL compliance to the full operation of other CERP features, such as the EAA Reservoir, the committee recommends that the SFWMD establish intermediate milestones for each STA, so that managers remain fully informed about whether the STAs are on their expected trajectories and can address unexpected issues as early as practicable, ideally well before the first year of WQBEL compliance assessment in WY 2027. The committee acknowledges that ecological disturbances, such as hurricanes or tropical storms, may impact the ability of STAs to meet certain milestones. Even when disturbances occur, milestones will inform managers of the effectiveness of the existing structural and operational elements in mitigating those disturbances, and whether additional actions are needed.
These annual milestones would be developed based on the best professional judgment of the performance of each STA and the expected response of the STAs to the ongoing implementation of various Restoration Strategies features. These milestones might be developed in consultation with STA experts from academia and federal agencies. The state and the broader science community have extensive knowledge of STA functioning and performance, which continually expands through ongoing research from the Restoration Strategies Science Plan (see Box 4-6; SFWMD, 2013, 2018b).
Science to Support STA Management and Decision Making: Monitoring, Assessment, Modeling, Research, and Synthesis
An extensive monitoring, assessment, modeling, research, and synthesis program is critical to support WQBEL attainment.
Monitoring and Assessment
The assessment of spatial patterns in nutrient dynamics as inflowing water is processed through each of the cells in STA flow-ways could be an effective tool to inform the status of STA functioning and to guide management decisions to improve phosphorus removal. Cell-by-cell measurement and analysis of forms of phosphorus and nitrogen in water and soil would provide insight on mechanisms and status of nutrient processing within STAs. Although cell-by-cell monitoring is more costly than the current whole-STA monitoring, the information derived would help to focus attention on poorly performing cells. Focused cell-by-cell data would help managers understand how a cell is responding to Restoration Strategies rehabilitation efforts, whether phosphorus saturation is occurring that could compromise the removal of phosphorus necessary to attain the WQBEL, and whether additional near-term management steps are needed, such as those discussed later in this chapter.
Modeling, Machine Learning, Data Analysis, and Integration
Models have been primarily used to inform STA design (e.g., Dynamic Model for Stormwater Treatment Areas [DMSTA]25). These models are relatively simple tools for sizing STAs, but they are not appropriate for understanding and managing the complex behavior of phosphorus in STAs. The SFWMD would benefit from adopting spatially explicit models of STA biogeochemistry and hydrology that could be parameterized through calibration to measurements of water and nutrient fluxes on a cell-by-cell basis. Such models are currently available, and their calibration and testing against observations from Everglades STAs have been documented in the peer-reviewed literature. For example, the Lake Okeechobee Environmental Model for Constructed Wetlands (LOEM-CW) is a fully distributed model that solves coupled equations for transient wetland flow, processes that transform and transport phosphorus and nitrogen, and emergent and submerged vegetation dynamics (Jin and Ji, 2015). Two- and three-dimensional versions of this modeling framework have been calibrated and evaluated against time-series data on water levels and concentrations of phosphorus, nitrogen, and dissolved
___________________
oxygen in STA-2 and STA-3/4 (Ji and Jin, 2016, 2020). An alternative model formulation, the Low-P Wetland Event Model (LPWEM), employs a tank-in-series hydraulic framework with simple expressions for flow-dependent phosphorous removal and internal phosphorus loading (Juston and Kadlec, 2019). Evaluation and testing of LPWEM resulted in good agreement between measured and modeled phosphorus concentrations along longitudinal transects within the C1B flow cell of STA-3/4 and between measured and simulated phosphorus concentrations in outflows from STA-2 and STA-3/4. As a semi-distributed model incorporating a reasonably simplified representation of phosphorous dynamics, LPWEM is parametrically parsimonious, requiring estimation of fewer parameters from calibration than LOEM-CW. Both LOEM-CW and LPWEM, as well as other wetland water quality models (e.g., Paudel and Jawitz, 2012), cannot account for all the variation in field data. Nevertheless, their accuracy will improve with continued application and refinement of their process representations. Even in their current form, models such as LOEM-CW and LPWEM can certainly play an important role in illuminating relationships between an STA’s attributes and its functioning. They could, for example, be used to infer the sensitivity of phosphorous removal efficiencies to factors amenable to management, such as water depth, flow rate, cell-inflow allocations, and vegetation composition. This knowledge, in turn, could be used to optimize STA operations, inform routine maintenance and refurbishment schedules, and assess potential system modifications intended to increase phosphorous removal. Considering the recent advances in wetland water quality models and the insights that can be gained through their application, the committee judges that they should play a greater role within an adaptive management framework for WQBEL attainment.
In addition to dynamic simulation modeling, machine learning approaches could provide insight on the behavior of STAs. For example, Baiser et al. (2021) evaluated phosphorus removal by STAs using structural equation modeling to understand better the function of individual STAs. The SFWMD has detailed time series information on individual STAs. With such detailed and robust data sets, machine learning techniques could be an effective tool to enhance understanding of controls on phosphorus removal in STAs.
Scientific Research
Scientific research is essential to support effective operations and management of the STAs. STAs in the Everglades are at the leading edge of performance of treatment wetlands for phosphorus globally. However, despite decades of research on STA function and performance by the SFWMD and its university and consulting partners, further research on opportunities to enhance their
phosphorus removal efficiency is needed. The Restoration Strategies Science Plan provides the overall framework for development and coordination of science activities to identify the critical factors that influence phosphorus reduction and treatment performance to meet the WQBEL for the Everglades STAs. The first 5-year Science Plan (SFWMD, 2013) was developed in 2013, and the SFWMD is currently implementing the 2018 Science Plan (2018-2023; SFWMD, 2018a). The studies supported by the Science Plan are outlined in Box 4-6.
The Science Plan is organized around six key research categories to inform STA operations and improve their performance:
- Design of FEBs,
- STA operational or design enhancements to improve and sustain STA performance,
- Vegetation management,
- The influence of fish and wildlife on STA performance,
- Management of internal phosphorus loading, and
- Management mechanisms to decrease concentrations of forms of phosphorus at the STA outflows.
The Science Plan provides a road map to improve understanding of how the STAs function and to address key information gaps. The 2018 Science Plan indicates that internal phosphorus loading is an understudied phenomenon in the STAs and that additional research is needed to examine the biological, chemical, and physical factors that influence this process (Orihel et al., 2017; Steinman and Spears, 2020), with particular attention paid to dissolved organic phosphorus.
Although the regulatory focus of the STAs is phosphorus, other elements influence phosphorus bioavailability, mobility, and fate, as described earlier in this chapter. Phosphorus dynamics through space and time are poorly understood in STAs. Wetlands receiving phosphorus loading may potentially develop nitrogen-limiting conditions that restrict biotic growth/productivity and thereby decrease phosphorus utilization and increase phosphorus discharges. Phosphorus dynamics are also affected by sulfate, iron, and calcium and by changing redox conditions. As STA management seeks to sustain extremely low phosphorus outflow concentrations, attention to the many factors that influence phosphorus dynamics is appropriate. Field-based, replicated experiments can be used to manipulate relevant elements (e.g., nitrogen, calcium) and measure how they interact to influence phosphorus cycling and sequestration. The processing of phosphorus and the interactions with other elements vary spatially through STAs, which ultimately affects outflow phosphorus concentrations and speciation. Thus, in addition to manipulative experiments, there is a critical need to monitor
phosphorus-element dynamics and mass balances on a cell-by-cell basis, especially in poorly performing STAs.
The role of vegetation in STAs cannot be overemphasized. A variety of studies have been conducted to investigate the resilience of SAV and EAV communities, phosphorus retention by SAV versus mixed SAV/EAV communities, phosphorus retention by specific vegetative taxa, and short-term and long-term phosphorus removal by different vegetative species (Bhomia and Reddy, 2018; DB Environmental, 2020a,b; Julian et al., 2019). Understanding the performance of individual species is also important—Chara may respond differently than Najas to altered environmental conditions, not only because of differences in phosphorus uptake rates but also because Chara can assimilate bicarbonate, resulting in production of CaCO3, which immobilizes phosphorus through abiotic mechanisms (Kufel and Kufel, 2002). Although the PSTA project met WQBEL standards (Zamorano et al., 2018), it remains unclear to what extent effective phosphorus removal was due to periphyton uptake or other factors such as low phosphorus inflow concentrations and/or lime rock exposure. These uncertainties underscore the need to understand the phosphorus removal efficiencies of different growth forms (e.g., submergent versus emergent vegetation) and taxa, and the mechanisms driving phosphorus removal. Such an understanding will help inform the management of STAs to meet the WQBEL.
Hydraulic loading is known to affect STA performance, but continued field-scale research would help to determine optimal hydraulic parameters for STA operations and the extent of impact associated with deviations from optimal conditions. For example, the A-2 STA, which is not part of the EAA flood control system, can be used to examine STA performance under steady inflow conditions in contrast to the remaining STAs, which must manage high inflows during storms. Additional research could examine the role of vegetative buffers near STA discharges in minimizing particulate phosphorus discharge.
Synthesis
The data on STAs are abundant, but to date efforts to examine these data in detail, interpret patterns and trends, and provide a synthesis of STA function have been insufficient. The report Phosphorus Dynamics in the Stormwater Treatment Areas (DB Environmental, 2022) is a good first step to do so. However, detailed interpretation of the function of STAs and the response of STAs to management efforts needs to be an ongoing endeavor. In particular, the dynamics of STAs should be evaluated along cell-by-cell flow paths, including time-series mass balances of TP and phosphorus species. Models and machine learning approaches could be effectively used in concert with data interpretation and
synthesis efforts. Synthesis should ideally identify actions that can be taken to improve STA performance, either over the short term to achieve the WQBEL or over the long term to maintain effective performance, or critical knowledge gaps affecting STA management decisions (see also Chapter 6).
As part of the synthesis effort, the committee recommends the formation of an external STA scientific advisory committee. This advisory committee would be analogous to the aquifer storage and recovery independent peer review panel convened by the SFWMD (see Box 3-1). The advisory committee could meet annually to discuss progress toward the milestones and provide additional expertise and advice to support WQBEL attainment. It could also provide advice on data collection, data analysis, research, modeling, and synthesis efforts that inform actionable management activities.
Near-term Considerations for STA Management
The comparison of STA performance milestones to monitoring data, informed by other research, modeling, and synthesis, may highlight the need for additional STA management actions. Near-term options to improve STA performance include improving hydraulic loading rates, reducing phosphorus concentrations and loading rates, managing vegetation, and managing floc and soil. The SFWMD is actively using these tools to improve phosphorus removal efficiency, although some additional considerations are noted below.
To function effectively, STAs must be hydrated throughout the year. However, during the dry season when water supply is limited, some treatment cells may experience dryout. Reflooding of these dryout areas can potentially mobilize phosphorus from soil to the overlying water column (DB Environmental, 2022). The three Restoration Strategies FEBs (see Figure 4-2) were designed to store water and reduce the frequency of dry downs, although no information is publicly available on how the FEBs are expected to change the projected occurrence of dryout. Water from Lake Okeechobee may be needed during drought conditions to provide enough water to keep the STAs hydrated, but conveyance structures are lacking to connect Lake Okeechobee via the Miami Canal to STA-5/6 inflow structures. Water allocation prioritization may need to be revisited to support WQBEL compliance, especially when CERP progress depends on it.
Low phosphorus concentrations and loading rates are key characteristics of the best-performing STAs. The performance of STA-1W and STA-1E could be significantly improved by decreasing phosphorus loading rates by at least 50 percent (similar to STA-3/4) and creating an option to recirculate the STA outflow through periphyton-dominated cells to further reduce TP concentrations.
The completion of STA Expansions #1 and #2 in the Eastern Flow Path, which represent an additional 4,260 acres and 1,600 acres, respectively, compared to pre-2021 STA acreage, would reduce the average area-based phosphorus loading rate by about 34 percent.26 Restoration Strategies includes a project to implement subregional source controls in the Eastern Flow Path to address hot spots in phosphorus loading, although no progress has been made in subregional load reduction. Additional attention toward this load-reduction project could improve STA performance if phosphorus hot spots are addressed.
All STAs have a finite capacity to store phosphorus in vegetation and soils. Upstream treatment cells accumulate phosphorus more rapidly and therefore have a shorter period of effective phosphorus removal than downstream cells. This pattern has been consistently noted in all STAs including STA-3/4. Upstream cells experience enrichment in phosphorus and exhibit signs of nitrogen limitation (based on N/P ratios). Phosphorus management strategies (e.g., removal of enriched soil or application of chemical amendments to soils) may be needed to remediate areas with substantial accumulated phosphorus in soils to achieve adequate outflow TP concentrations. Continued field research and long-term monitoring are needed to evaluate the efficacy of approaches to mitigate phosphorus-enriched soil. For example, laboratory tests showed that soil inversion (burial of phosphorus-laden surface soil) reduced phosphorus to an impressive 13 µg/L in batch tests (Josan et al., 2019), but field testing under flow-through conditions is needed to assess how quickly these soils would saturate with phosphorus.
Ongoing adaptive management of STAs to optimize phosphorus removal should also consider whether STA cells have the appropriate composition and placement of SAV and EAV and whether increased use of periphyton is merited. Different phosphorus removal mechanisms in EAV and SAV areas result in different soil types and biogeochemical processes. The more organic soils derived from EAV are capable of trapping particulate matter whereas the soils dominated by SAV are characterized by more mineral matter, are flocculent, and are easily suspended in the water column (Reddy et al., 2019a). By using the information available from vegetation and soil types, project managers could create the appropriate mosaic of EAV and SAV to optimize dissolved phosphorus uptake and particulate phosphorus trapping.
___________________
26 Prior to the STA expansions, STA-1E and STA-1W included approximately 11,400 acres. The addition of 5,820 acres through Restoration Strategies will increase the total STA acreage in the Eastern Flow Path to approximately 17,220 acres. If inflow concentrations remain the same and inflows are evenly distributed to spread the loading across the available STA area, the phosphorus loading rate is expected to decrease by 5,820/17,220 or 34 percent.
Alternative Management Strategies
Despite the significant efforts by the SFWMD to manage phosphorus in the STAs, if the WQBEL target is not met in all of the STAs, alternative management strategies may be needed. The alternative strategies in this section may complement existing approaches to meet the WQBEL.
Control of Internal Phosphorus Loading
In this chapter the committee has highlighted the concern about internal loading of phosphorus from saturated soils or resuspended floc that is discharged from the STAs. The addition of chemicals could help reduce internal phosphorus loading via direct inactivation of phosphorus.
The chemical characteristics of phosphate allow for salt formation with aluminum, calcium, iron, lanthanum, or other metals with varying degrees of solubility (Lürling et al., 2020). Chemical inactivants that bind phosphorus can be applied in liquid or solid forms. A wide variety of solid-phase phosphorus adsorbents have been developed that utilize a range of precursor materials and substrates. An important consideration is the amount applied: too little will leave sediment uncovered, while too much may impair aquatic biota or otherwise adversely affect biogeochemical processes (Steinman and Ogdahl, 2012). In general, six elements—calcium, magnesium, aluminum, iron, silicon, and lanthanum—in a variety of mineralogical and geochemically reactive forms can serve as phosphorus adsorbents that are commonly applied to aquatic systems, including as active constituents within constructed wetlands. The phosphorus adsorbent receiving the most attention over the past decade is lanthanum-modified bentonite (Spears et al., 2016).
The SFWMD evaluated the feasibility of applying chemical inactivants to the STAs and decided against their use because of the significant costs and logistical challenges of application over such a large surface area (Chimney, 2015b). However, an alternative approach may be to apply these materials strategically, in treatment locations that (1) have historically high phosphorus concentrations, exceeding the WQBEL; and (2) are delimited and targeted areas, such as near the discharge points of STAs, where they will be most effective.
Alternative Agricultural Management
A potentially effective approach to reaching phosphorus targets is to control the phosphorus concentrations and loads entering STAs from external sources. Additional attention to source reduction, particularly in the Eastern and Western Flow Paths, may ultimately be necessary and may well prove cost-effective in
achieving the WQBEL. Farms in the EAA have reduced their annual TP loads by 55 percent on average since 1994 (Taylor et al., 2019), with most farms contributing to these improvements (Yoder, 2019). However, this improvement has not been continuous over this period, because large initial phosphorus load reductions have not been maintained over time (Yoder et al., 2020). Thus, it may be possible to modify current agricultural practices to further reduce phosphorus loading before the runoff reaches the STAs to help meet the WQBEL requirements.
Non-structural best management practices of potential value include reducing loads from those farms that are the largest contributors (hot spots), even absent an exceedance of the allowable collective load by basin based on the Consent Decree codified in the 1994 Everglades Forever Act. In addition, Yoder et al. (2020) suggested that linking monitoring data to relevant farm management decisions may encourage farm managers to further reduce phosphorus loads based on their analyses, as the data can be used as a feedback or accountability tool.
Structural best management practices have been implemented in the EAA and C-139 basins, contributing to phosphorus load reduction. In addition to installation in hot spots, it may be possible to enhance performance of some structural best management practices, including leveling of fields, maintaining ditch and canal bank berms, deepening/widening main canal sediment sumps and traps, constructing and maintaining sediment sumps in field ditches, regularly cleaning canal and field ditches, slowing drainage near exit pump stations, planting cover crops, installing raised culverts, vegetating ditch banks for stabilization, and using weed booms and trash racks (Adorisio et al., 2006; Diaz et al., 2015).
Inflow Control
Phosphorus loading to the STAs could also be reduced through changes in water operations, although such actions could have adverse effects on other parts of the system. For example, if STAs are not performing adequately, instead of moving water south through the STAs, managers theoretically could opt to reduce hydraulic and phosphorus loading rates by discharging the water to the coastal estuaries. This outcome would result in a cascade of adverse effects by reducing the flow of water south and by increasing the discharge of nutrients to the estuaries. However, STA-specific inflow adjustments could be made with lesser impacts—for example, reducing the rates of inflow pumping during wet weather periods, as is currently planned for the A-2 STA.
If the STAs do not meet the WQBEL under ongoing management, difficult tradeoff decisions based on a rigorous analysis of costs and benefits may be necessary. This analysis would consider the benefits of CERP progress with full
EAA Reservoir operation versus impacts to the remnant Everglades and the estuaries from reducing current inflows to the STAs. Implementation of the Lake Okeechobee System Operating Manual, with greater discretion on downstream releases, would provide the flexibility needed to adjust these operations if judged appropriate.
RECOMMENDATIONS AND CONCLUSIONS
Implementation and refinement of STAs over the past nearly three decades has resulted in marked reductions in TP concentrations in outflow waters, particularly in STA-3/4, which currently meets the requirements of the WQBEL. A considerable volume of rigorous, peer-reviewed, and applicable science has been generated by the SFWMD, as well as its academic and consulting partners, that has helped inform the design and performance of STAs. However, the extent of phosphorus removal varies across STAs, and some STA discharges remain far from target values. The state’s current efforts through Restoration Strategies and other actions are expected to continue to improve the function of the STAs, although meeting and sustaining the WQBEL requirements in all STAs starting in WY 2027 will be a significant challenge. Given the dependence of CERP progress on WQBEL attainment—particularly the timely delivery of full CEPP benefits—the committee offers the following recommendations and conclusions to support the state’s efforts to understand and improve the effectiveness of STAs.
To support and sustain WQBEL attainment, the SFWMD should implement a rigorous adaptive management framework that increases efforts in data collection, data analysis, modeling, and synthesis. Talented and experienced SFWMD scientists and engineers are working on the STAs, as evidenced by the phosphorus removal performance to date, and substantial research is under way through the Restoration Strategies Science Plan that should be useful to STA management. Nonetheless, the extent of phosphorus removal needed to meet and sustain the WQBEL will likely require even stronger science support for decision making, cell-by-cell monitoring, new modeling tools, detailed analysis of available data, and frequent feedback between science and management to support rapid, science-informed decision making and to reduce the likelihood of water quality impeding CERP progress.
A rigorous adaptive management program should include development of near-term milestones for each STA flow-way. The WQBEL sets clear quantitative targets to assess STA performance starting in WY 2027, but quantitative interim milestones over the next few years should also be developed based on the activities associated with Restoration Strategies and other STA remediation actions. These milestones would help communicate to managers the science-based
expectations of STA function and recovery times in each flow-way and would provide a basis for further analysis and possible action if outcomes do not meet expectations, thereby supporting more nimble decision making. They would also increase transparency of restoration progress to the community interested in water treatment by STAs and Everglades restoration.
Additional monitoring, research, analysis, and modeling will provide insight on ways to optimize and sustain STA performance. Despite decades of research and lessons learned through STA operations, key gaps remain in the understanding of phosphorus mobility and removal processes within STAs and optimal strategies to manage STA hydrology, vegetation, and biogeochemical processes. Moreover, currently available tools are limited in their ability to forecast STA responses to management actions. The cumulative retention of phosphorus in soils threatens the long-term performance of the STAs. The committee identified several priority research needs:
- Cell-by-cell monitoring along with the development of cell-by-cell phosphorus budgets would help managers identify problem areas and focus additional efforts to better understand and address the mechanisms that drive elevated phosphorus conditions. These activities would identify cells that may be transitioning to conditions of phosphorus saturation.
- Additional analysis of nutrient dynamics (e.g., TP, phosphorus forms, total nitrogen, nitrogen forms and associated secondary elements) along STA flow-ways could illuminate strategies to more effectively manage phosphorus. Dissolved organic and particulate phosphorus can represent substantial fractions of TP concentrations in STA outflows, but current management efforts are generally focused on TP rather than individual forms of phosphorus. The interplay between nitrogen and phosphorus and the significance of nitrogen-limiting conditions deserves additional attention in understanding factors that affect phosphorus removal efficiency.
- Field research in STA cells that appear to be approaching phosphorus saturation and thereby increased internal phosphorus load and that are experiencing reduced efficiencies could provide insight on the effect of soil phosphorus accumulation on the ability of STA cells to retain phosphorus, and the benefits and timing of cell refurbishment in maintaining the effective performance of STAs over the long term. Field research would also provide an opportunity to examine the best strategies for refurbishment and recovery.
- Application and continued refinement of STA biogeochemistry and hydrology models would enhance the understanding of STA function and inform maintenance and operations decisions.
- Additional field research on the effects of STA hydraulics, such as inflow and outflow velocities, hydroperiod, and hydraulic loading, on phosphorus discharge could inform future operations.
An independent, external STA science advisory committee would provide additional perspective and expertise to assist the SFWMD in evaluating water quality progress of Restoration Strategies relative to expectations for phosphorus removal and in identifying areas of concern and promising strategies. An external STA science advisory committee, analogous to the aquifer storage and recovery independent peer review panel convened by the SFWMD, could meet annually to discuss progress toward the milestones and to provide additional expertise and advice to support WQBEL attainment. With a mix of specialists, including in biogeochemistry, regional water operations, and agricultural source control measures, this group could advise on data collection, data analysis, research, modeling, and synthesis efforts that inform actionable management activities.
Although a variety of factors affect outflow phosphorus concentrations, phosphorus inflow concentrations and loading rates are key drivers affecting WQBEL attainment. The only STA (3/4) that consistently meets water quality conditions that approach the WQBEL has an annual phosphorus loading rate that is generally much lower than 1 g/m2-yr. In contrast, STA-1E, -1W, and -5/6 routinely have phosphorus loading rates that exceed 1 g/m2-yr, and in some years exceed this rate by a factor of two or more. The average flow-weighted inflow concentrations for STA-3/4 (84 µg/L TP during WY 2017-2022) were approximately 50 percent (or less) than the average flow-weighted inflow concentrations of the three poorest-performing STAs. Thus, for some STAs the annual phosphorus loads and/or concentrations will likely need to be halved to achieve annual effluent TP concentrations that approach the WQBEL. Three approaches can be pursued to manage elevated phosphorus loading rates in a given STA: improve the phosphorus removal efficiency within the STA, increase the footprint (surface area) of the STA (as is under way in STA-1W), and/or decrease the upstream phosphorus loading entering the STA (source control). Restoration Strategies includes all three approaches in some capacity to reach the WQBEL, with most efforts devoted to improving phosphorus removal efficiency, but little progress has been made to reduce subregional phosphorus loads in the Eastern Flow Path. The concentrations of some STAs are so high that efficiencies beyond those of the best-performing STA would be needed to meet the WQBEL. In these cases, additional source control measures may ultimately be needed to meet the WQBEL.


