

APPENDIX B
ROI Workbook and User Guide
ROI Workbook
The BIM ROI Tool is intended to help transportation agencies understand the business case for investing in BIM. Because the results vary greatly depending on the agency context and how the agency plans to use BIM, there is no one-size-fits-all ROI result. Instead, agencies should use the BIM ROI Tool to quantify the benefits and costs of BIM given their own circumstances. Agencies should be prepared to collect and enter cost and benefit data as directed by the tool. Data may need to be obtained from various areas within the organization.
The BIM ROI Tool is provided as a separate Microsoft Excel workbook, which can be downloaded from the link available on the National Academies Press website (nap.nationalacademies.org) by searching for CRP Special Release 4: Lifecycle BIM for Infrastructure: A Business Case for Project Delivery and Asset Management.
ROI Workbook User Guide
Introduction
The purpose of this User Guide is to provide step-by-step instructions for how to use the BIM ROI Tool and to explain the contents of the workbook. For additional details on the methodology used to calculate the ROI of BIM investments, see Chapter 4.
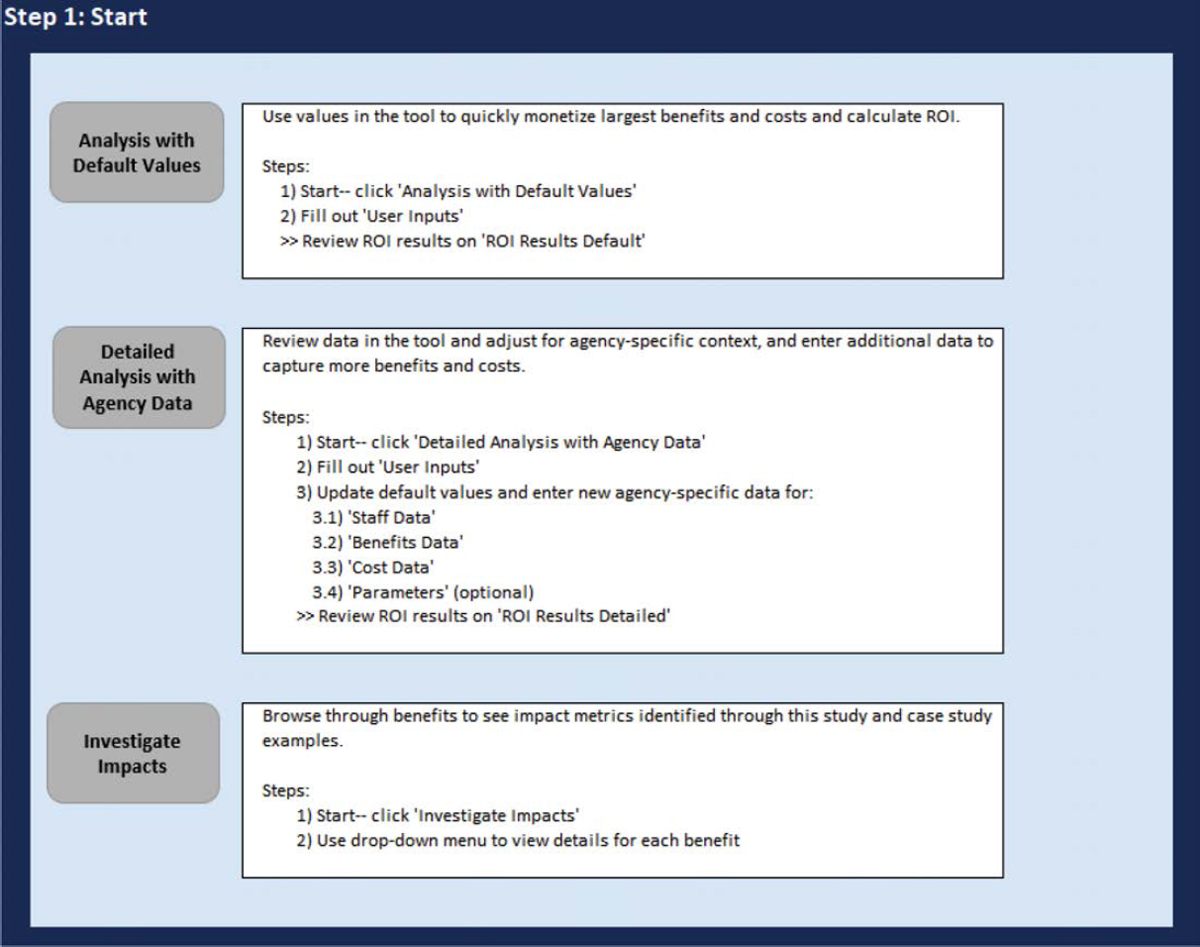
After this introduction, the User Guide provides a summary of the contents of the BIM ROI Tool, including some detailed sheets that most users can ignore. Next, the User Guide provides instructions for how to use the three functions of the tool:
- Run a quick “Default Analysis” based on rule-of-thumb data and limited agency inputs.
- Run a “Detailed Analysis” tailored to the agency context and requiring more information.
- Use “Investigate Impacts” as an interactive way to review findings from this study.
Workbook Contents
There are 41 worksheets in the tool. However, the agency needs to view only the first 10 sheets to use the tool. The tabs of these 10 “user sheets” are either yellow or red to indicate that they require user inputs or provide results. Throughout the Excel workbook, workbook tabs are color coded as follows:
Yellow: These worksheets require user inputs. Sheets with lighter yellow tabs are required only for the Detailed Analysis, while sheets with darker yellow tabs are required for both the Detailed Analysis and Default Analysis. There are six yellow sheets in the tool:
- START
- USER INPUTS
- STAFF DATA
- BENEFITS DATA
- COST DATA
- PARAMETERS
Red: These worksheets show results of the ROI analysis, impact metrics associated with each benefit, and a list of sources used for the data in the tool. There are four red sheets in the tool:
- ROI RESULTS DEFAULT
- ROI RESULTS DETAILED
- INVESTIGATE
- REFERENCES
Blue: These include 20 benefit calculation worksheets plus one sheet that calculates overall ROI metrics. There are four shades of blue indicating four types of calculation sheets:
- Agency benefit calculations (sheets BA1 through BA6)
- Project benefit calculations (sheets BP1 through BP5)
- Staff time benefit calculations (sheets BS1 through BS9)
- ROI results
Orange: These are cost calculation worksheets. There are two orange sheets in the tool:
- INITIAL COSTS
- ONGOING COSTS
Purple: These are additional data worksheets used in the tool. There are five purple sheets in the tool:
- SOFTWARE COSTS
- CASE STUDY RESULTS
- USE CASE MATRIX
- OTHER DATA
- PRICE INDICES
Black: There is one black worksheet (LISTS LOOKUPS), which shows information used in the tool to create dropdown menus or other lists for reference.
Gray: There are two gray worksheets that serve as separators between calculation and data sheets.
Instructions
Agencies can perform three functions with the tool:
Default Analysis allows the user to perform a quick ROI analysis based on rule-of-thumb data included in the tool and some user inputs. This option incorporates only benefits and costs with the best data found through literature review, expert panel, and case studies. However, results will not be tailored to the context of a given agency.
Detailed Analysis allows the user to perform a detailed ROI analysis specific to the agency’s context and includes all quantifiable benefits and costs identified by this study. This function requires the user to enter agency-specific data on several sheets. The data inputs are more detailed and take more time to enter than the simple inputs needed in the default analysis.
Investigate Impacts allows the user to review findings from the study. This function is like an automated literature review. No calculations are made, but the user can select from a drop-down list of benefits to view the benefit definition, impact metrics found through the study, and examples of case studies that experienced a given benefit.
The user selects one of these functions on the START sheet, which is shown in Figure B-1. The rest of this chapter explains how to use each of these three functions. The last section explains how to update certain data in the tool periodically.
Default Analysis
There are three steps to perform the Default Analysis, as described in the following sections.
Start
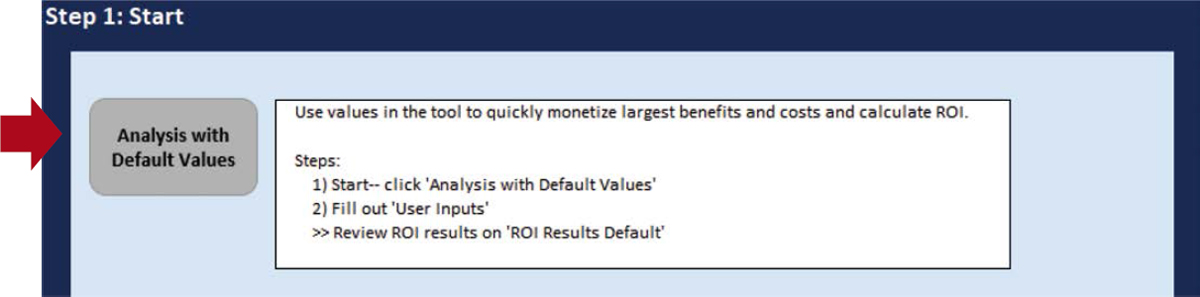
For either type of analysis, the user must begin on the START sheet and click the “Analysis with Default Values” button (shown in Figure B-2) to run the Default Analysis. It is important that the user clicks this button to calculate and view the correct results in the rest of the tool.
User Inputs
Clicking “Analysis with Default Values” will automatically direct the user to the USER INPUTS sheet. As indicated by the instructions on the top of the sheet, the user must fill out all cells in green on the sheet. There are four sections that the user must review and fill out, described as
follows. Each section includes various definitions and instructions, plus green cells requiring data from the user.
- Investment Case versus Base Case: asks the user questions about the level of BIM adoption in the Base Case and the Investment Case. It also asks about the agency’s typical projects. Definitions are provided to assist the user.
- Incremental Software Costs in Investment Case: requires the agency to estimate the additional annual spending on software due to the conversion to BIM in the Investment Case. Note this is not the total software costs, it is only the incremental cost compared to software spending in the Base Case. The user can click the hyperlink to review a table of sample BIM-related software subscription costs; however, these costs vary given what software the agency is purchasing, package discounts, and other factors.
- Use Cases of BIM in Investment Case: asks the user yes/no questions to identify how the agency will be using BIM in the Investment Case. The user should answer “yes” only if this is a new use of BIM-related technologies that the agency did not implement prior to the BIM adoption in the Investment Case.
- Other Costs in Investment Case: asks yes/no questions about additional costs that the agency will incur in the Investment Case, such as investment in additional hardware, IT infrastructure, and/or new BIM-related trainings.
After completing all four sections, the user should scroll to the top right of the sheet and click the right navigation arrow. This will take the user to the ROI RESULTS DEFAULT sheet.
To clear all previous data entered in the tool, click “Clear All User Inputs” in the top right of the screen (Figure B-3). Once this button is clicked, data cannot be restored. Therefore, it is recommended that the user save a copy of the tool before clicking the “Clear All User Inputs” button.
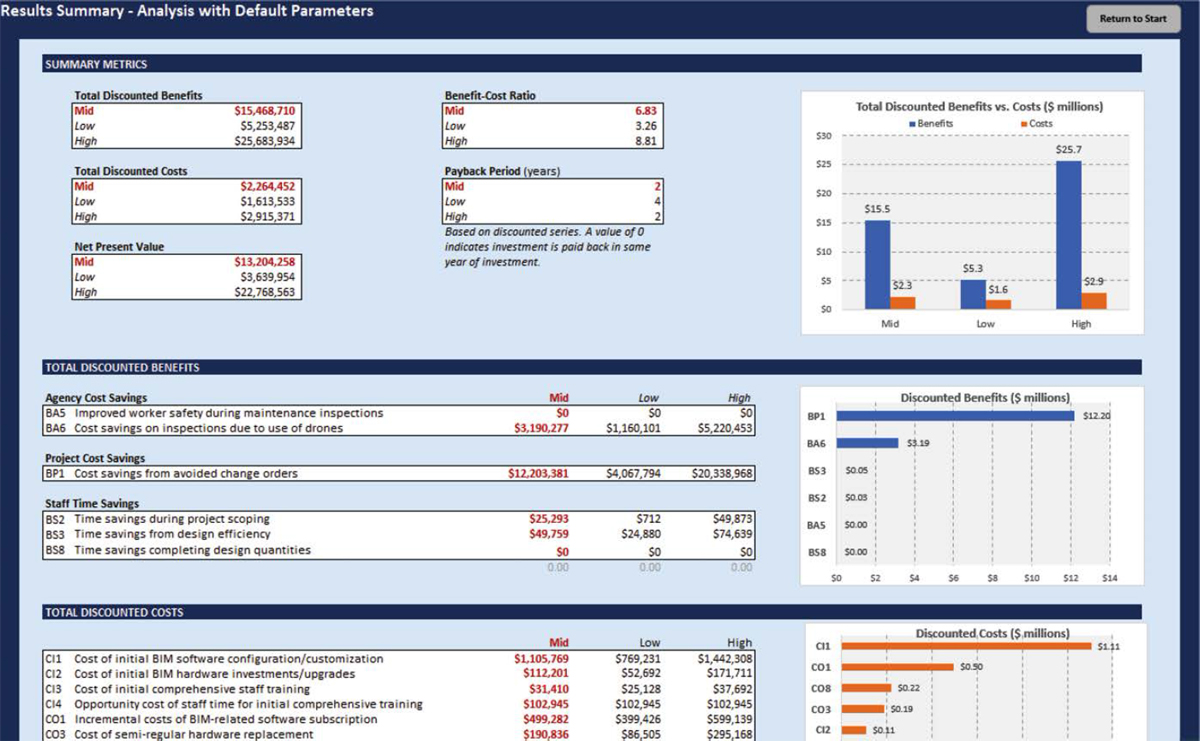
ROI Results Default
This sheet shows summary metrics from the ROI analysis, including the BCR, total discounted benefits, total discounted costs, NPV, and the payback period. When evaluating results, note that

a BCR greater than 1.0 indicates that the investment is “net beneficial.” The benefits of the investment are expected to outweigh the costs.
The sheet also shows the relative value of all six benefits and seven costs monetized under the Default Analysis. A partial screenshot is provided in Figure B-4.
When finished reviewing results, click “Return to Start” to access the START sheet.
Detailed Analysis
There are seven steps to perform the Detailed Analysis, as described in the following sections.
Start
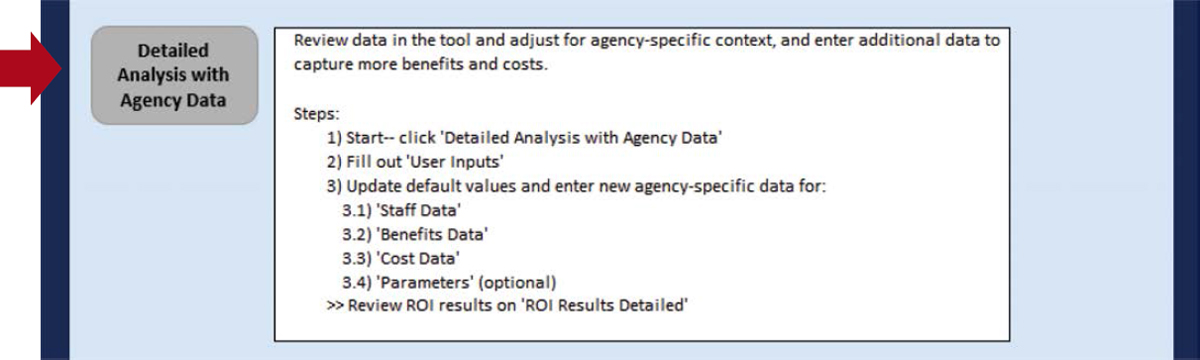
For either type of analysis, the user must first begin on the START sheet. Click the “Detailed Analysis with Agency Data” button to run the Detailed Analysis (Figure B-5). It is important that the user clicks this button to calculate and view the correct results in the rest of the tool.
User Inputs
Clicking “Detailed Analysis with Agency Data” will automatically direct the user to the USER INPUTS sheet. The agency must fill out the same information as with the Default Analysis. (See instructions for Default Analysis.)
After completing all user inputs, scroll to the top right of the sheet and click the right navigation arrow. This will take the user to the STAFF DATA sheet.
Staff Data
On the STAFF DATA sheet, the user must fill out data on agency staff wages, as well as the number of staff expected to attend BIM-related trainings. Instructions are provided at the top of the worksheet. Throughout the tool, the user should only enter values in green cells. This sheet includes various “suggested values” that the user can reference, but agency-specific data should be provided.
After entering all staff data, the user should scroll to the top right of the sheet and click the right navigation arrow. This will take the user to the BENEFITS DATA sheet.
Benefits Data
This sheet includes a table of all the benefits of BIM identified by this study. The table is divided into four categories based on the benefit categories:
In-House Agency Benefits: financial cost savings to the agency at an institutional level, not attributable to a single project, and due to implementing BIM methods. For instance, this includes cost savings from repeated data collection and reduced paper and printing requirements.
Project Cost Savings: financial cost savings attributable to a specific project from using BIM-related technologies on that project. For example, this could include avoided costs associated with change orders.
Staff Time Savings: efficiency gains due to implementing BIM that are attributable to a specific project or to the agency in general.
User Benefits: benefits realized by asset users. For instance, travel time savings to vehicles due to reduced construction road closures because of improved schedule management (attributable to BIM). While user benefits are included in this table, they are not monetized in the ROI tool and therefore do not require data from the agency.
For each benefit category, the table includes the benefit code, name, definition, variables used to monetize the benefit, and units of these variables. Columns N through P (in blue) provide suggested values collected through the literature review, expert panel, and case studies. A range of values are provided including a mid-estimate, followed by a low and high range.
Instructions for filling out the benefit data are located at the top of the worksheet. The user should scroll through each benefit, review the suggested value for reference, and enter agency-specific data in the green cells. If one or more of the benefits do not apply to the agency, the user should enter zeros in the relevant green cells.
After entering all benefit data, the user should scroll to the top right of the sheet and click the right navigation arrow. This will take the user to the COST DATA sheet.
Cost Data
This sheet includes a table of all the costs of BIM as identified in this study. The table is divided into two categories to indicate the type of cost:
Initial/one-time costs: one-time agency costs associated with purchasing BIM technologies, such as the initial setup/configuration of modeling software.
Ongoing costs: regular and semi-regular agency costs incurred over time to maintain BIM-related investments. This includes things such as ongoing software subscriptions or periodic hardware upgrades.
For each cost category, the table includes the cost code, name, variables used to monetize the cost, and units of these variables. Columns M through O (in blue) provide suggested values as identified through the literature review, expert panel, and case studies. A range of values is provided including the mid-estimate, followed by a low and high range.
Instructions for filling out the cost data are located at the top of the worksheet. As instructed, the user should scroll through each cost, review the suggested value for reference, and enter agency-specific data in the green cells. If one or more of the costs do not apply to the agency, the user should enter zeros in the relevant green cells.
After entering all cost data, the user should scroll to the top right of the sheet and click the right navigation arrow. This will take the user to the PARAMETERS sheet.
Parameters
This sheet includes various modeling parameters and assumptions. For instance, this sheet defines the years of analysis included in the model, the discount rate, and various ramp-up periods
for realizing certain benefits or costs. The agency does not need to make changes on this sheet, but the user may review and make updates as desired.
After reviewing and updating parameter values as needed, scroll to the top right of the sheet, and click the right navigation arrow. This will take the user to the ROI RESULTS DETAILED sheet.
ROI Results Detailed
This sheet shows summary metrics from the ROI analysis, including the BCR, total discounted benefits, total discounted costs, NPV, and the payback period, which are common metrics used for economic analyses to determine project viability. The sheet also shows the relative value of all 20 benefits and 15 costs monetized under Detailed Analysis. This sheet looks like the results sheet shown for the Default Analysis (Figure B-4).
When finished reviewing results, the user should click “Return to Start” to access the START sheet.
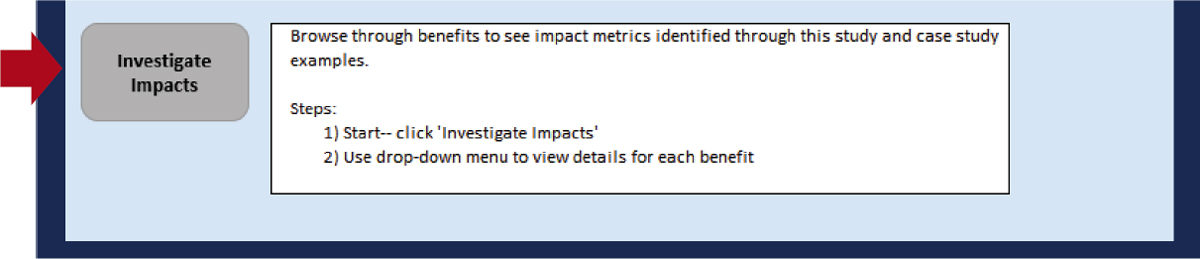
Investigate Impacts
There are two steps to Investigate Impacts, as described in the following sections.
Start
From the START sheet, click on the “Investigate Impacts” button (Figure B-6). This will automatically direct the user to the INVESTIGATE sheet.
Investigate
The INVESTIGATE sheet allows the user to explore the various benefits identified from this study. Click the green cell to select from a drop-down list of benefits. Selecting a benefit will automatically update the text on the sheet.
Once a benefit is selected, the user will be provided with the following information:
Benefit Full Name: provides the full name of the benefit selected.
Benefit Description: provides a description of the benefit selected.
Impact Metrics: lists the impact metric associated with the benefit selected (if values were found for this benefit). Where available, the percent reduction in agency costs associated with the selected benefit is shown with a mid-value as well as a low to high range.
Reference(s): lists the source(s) used to estimate the range of values provided under Impact Metrics.
Case Study Findings: provides examples of the selected benefit from the case studies, if applicable.
When the user is finished investigating benefit impacts, the user should click “Return to Start” to access the START sheet.
Periodic Tool Updates
There are two sheets in the tool that should be updated annually by an agency. This process is described as follows.
Price Indices
PRICE INDICES is a purple sheet located toward the back of the workbook. While the user does not need to review this sheet to perform the ROI analysis, the sheet should be updated annually. To update the sheet, follow these steps:
- Go to the Bureau of Economic Analysis (BEA) website: https://www.bea.gov/.
- Click on Tools: Interactive Data > National Data: GDP & Personal Income > Begin using the data.
- Select National Income and Product Accounts (NIPA) tables > Table 1.1.9 Implicit Price Deflators for GDP.
- Click “modify”:
Series: annual.
First year: 2020.
Last Year: [[current year]].
- Click “download.”
- Open the downloaded file.
- Navigate to the PRICE INDICES sheet.
- Copy and paste the values for [[current year]] from the downloaded file into PRICE INDICES in the next available column.
Parameters
Most values on PARAMETERS can be updated at the agency’s discretion. However, there is one dollar value that should be updated annually: “Value of U Injury (Severity Unknown).” This value comes from the U.S. DOT Benefit Cost Analysis Guidance for Discretionary Grant Programs, which is typically updated annually. Each time a new version of the BCA Guidance is released, the injury value should be updated. Enter the new value in the green cell in E27.
If the dollar year specified in BCA Guidance does not match the dollar year used in the tool (located on STAFF DATA, cell D11), the user will need to inflate the value in the tool based on the GDP deflators on PRICE INDICES. To inflate, use the following formula:
This page intentionally left blank.


