

CHAPTER 4
Making the Business Case
4.1 Overview of Business Case Approach
Approach Conceptualization
The objective of Project TFRS-02, “Lifecycle BIM for Infrastructure: A Business Case for Project Delivery and Asset Management,” was to evaluate the business case for BIM for transportation infrastructure by analyzing and quantifying how adopting BIM enterprise-wide could lead to efficiency gains and other benefits throughout the lives of assets, including project design, construction, and asset management. The case was made through ROI analysis, which considers the benefits and costs of BIM adoption.
While the definition of BIM can be broad and ambiguous, this study defined BIM as the adoption of an intelligent, object-based 3D modeling process. From the case studies and literature review, the research team learned that most transportation agencies have not fully integrated BIM processes for project delivery and asset management, but many have achieved certain aspects of BIM adoption. Thus, the ROI approach considered a range of possible “levels” of BIM adoption, discussed later in this chapter under the section on agency maturity.
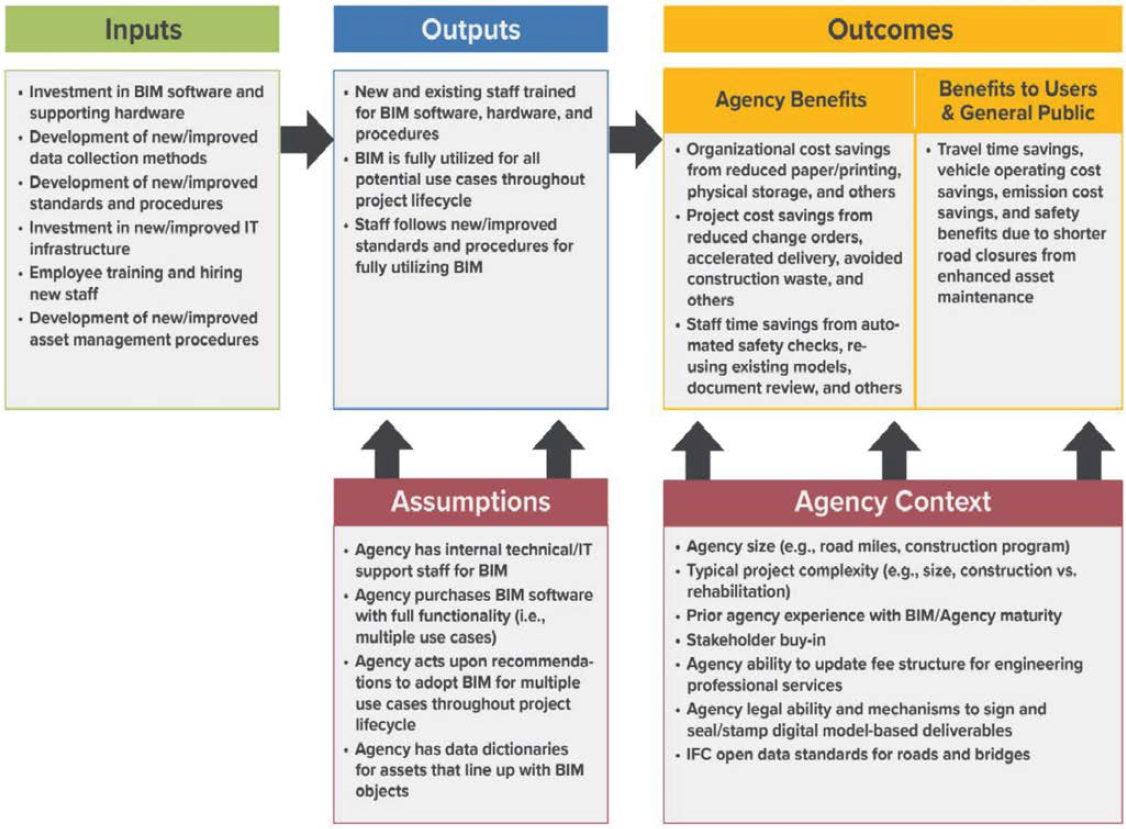
To define the ROI analysis approach, the research team first conceptualized the process of implementing BIM. This allowed the research team to identify the types of costs and benefits likely associated with implementing BIM, as well as how the initial investment was linked to the eventual outcome. Figure 4-1 illustrates this approach.
As shown in the diagram, examples of BIM implementation activities, or “inputs,” included efforts such as investing in software and supporting hardware, developing new standards and processes, and training employees. These inputs helped identify the costs associated with implementing BIM, as well as the “outputs” expected from these activities, such as trained staff able to follow BIM procedures and use modeling software. Outputs then led to “outcomes,” which are the benefits that should be compared against costs in an ROI analysis. For instance, one type of outcome expected from BIM was project cost savings from avoided change orders.
This input–outcome process also helped the research team identify the agency context and assumptions necessary to translate inputs into outputs and outcomes. (Assumptions and agency context are described in the boxes below the outputs and outcomes in Figure 4-1.) For example, an agency must purchase sufficient functionality in the modeling software to realize benefits from BIM. In fact, the type of modeling software purchased will determine which specific outcomes (benefits) the agency can realize. This concept was captured by this study through the term “use cases.”
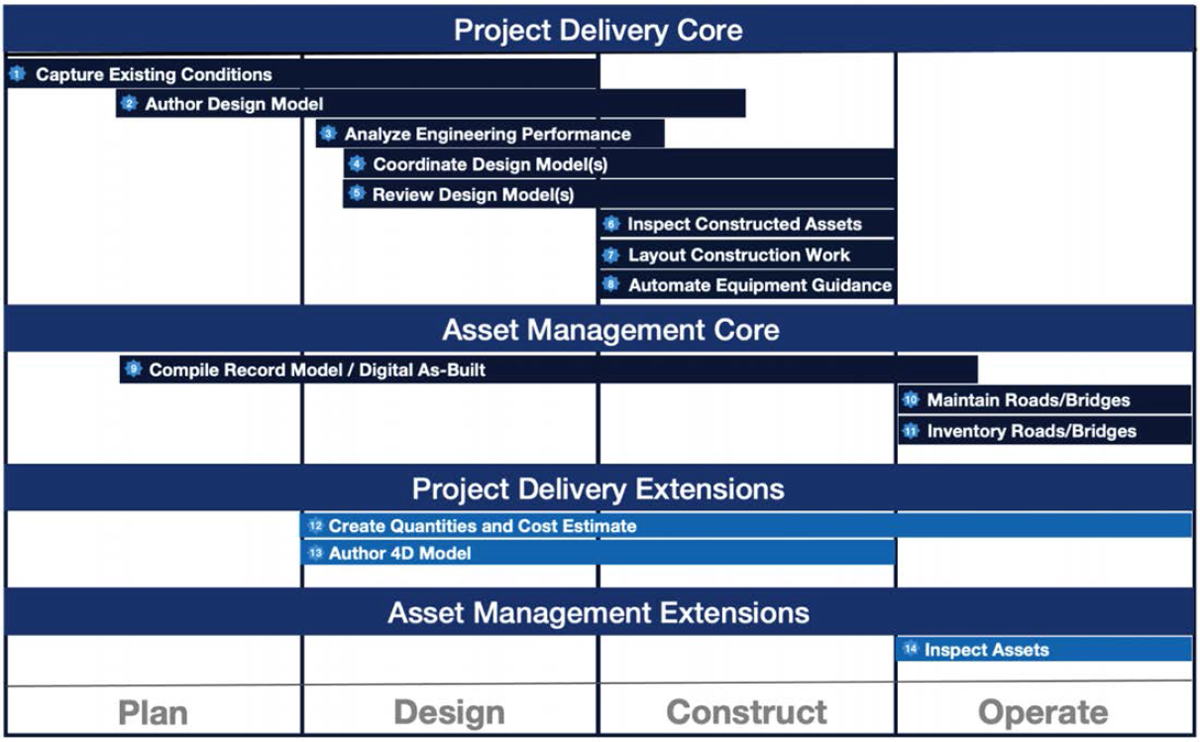
A BIM use case is defined as a method of applying BIM during a facility’s lifecycle to achieve one or more specific objectives (Messner et al. 2021). The research team identified 14 key use cases that could help an agency realize benefits from implementing BIM (Figure 4-2).
Once the research team identified a list of all the benefits associated with BIM, each benefit was mapped to one or more use cases. This mapping represents the link between acquiring a particular use case of BIM (through purchasing certain types of modeling software) and the outcome of implementing the use case in practice. For example, purchasing 3D survey modeling software (such as ContextCapture or ReCap Pro) allows an agency to “capture existing conditions” (a core project delivery use case) by developing a 3D object model of the existing conditions for a transportation project. With this technology, the agency can contextualize the project surroundings and has the potential to assess design alternatives to find more cost-effective solutions or avoid potential conflicts (benefit).
Mapping benefits to use cases was critical to the ROI analysis. It allowed the research team to assign one or more specific benefits to an agency, given the knowledge of which use cases would be acquired as part of the Investment Case. The full benefits-to-use cases mapping can be found in Appendix D of this report and in the BIM ROI Tool developed as part of the project (in the “Use Case Matrix” Excel sheet).
Program-Level Approach
The ROI approach for this study considered benefits at a program level rather than taking a project-level approach. There are many reasons why the ROI analysis had to be performed at
the program level. First, given the size of BIM-related investments, these costs would not be fully recovered after applying the new modeling technologies to only one project. Nor was this the intention of the investment—these costs were considered an investment by agencies for the future projects in each program.
Second, not all benefits realized from BIM could be attributed to a specific project; some benefits were accrued by the entire organization. For instance, one of the BIM benefits identified in the study was cost savings from reduced paper, printing, and distribution. By moving to a digital approach, agencies could save money on production and distribution of plan sheets and printing and shipping of bid tabs. Note that agencies that already implement e-construction or only issue electronically signed PDFs for plans would not experience this cost savings when adopting BIM.
Third, there were cumulative project-level benefits that could be realized only when sufficient information had been aggregated into agency databases. These benefits could be attributed to a specific project, but they were realized only after several projects had been completed. For instance, agency staff could save time during design from reusing previous BIM content for future similar work. However, this benefit could be realized only once BIM content had been built up in a 3D-component library.
To achieve the program-level approach, the ROI analysis considered an agency’s “typical project.” The typical project was intended to capture 85 percent of the type of work the agency does. Identifying the typical project was important for determining how much these projects were expected to benefit from BIM. While a large new construction project was likely to realize
many benefits from BIM, large projects may not be common for the agency. Currently, the typical project type for many DOTs is maintenance work, which—depending on the complexity of the work—may or may not benefit from the use of BIM.
An agency’s typical project may be complex or non-complex:
- Complex projects are characterized by the amount of construction activities that introduce the most risk. These projects typically involve multiple phases and complex geometric structures and interchanges. The project scopes vary, but the risks are typically associated with activities to install new or reconstruct infrastructure in an urban environment with many utility corridors and right-of-way impacts. While complex projects may be described by their major scopes of work—such as new pavement, bridge construction, or roadway widening—it is probably more useful to define these projects by the level of perceived risk. Complex projects are more likely to benefit from BIM.
- Non-complex projects are characterized by construction activities that introduce the least amount of risk. These projects may include multiple phases and simple activities, such as full-depth pavement replacement, mill and overlay, and safety improvements such as signing and pavement marking. These projects are less likely to benefit from BIM, but they benefit from standard BIM information requirements.
Once the characteristics of a typical project were set, the characteristics were then scaled by the average number of projects each year that would include the use of BIM. While this method did not capture the variety of project types that an agency may implement (such as the occasional megaproject), it was intended to approximate the average ROI for the agency.
Return on Investment Defined
Since there is no industry consensus on what constitutes ROI analysis for transportation programs, for the purpose of this study, the research team had defined ROI analysis as benefit-cost analysis (BCA). This approach has been recommended by the research agency for NCHRP Project 08-36/Task 62, “Best Practice Methodology for Calculating Return on Investment for Transportation Programs and Projects” (Cambridge Systematics 2007). This provided a framework for calculating ROI.
From the studies identified in the literature review, the research team found that many BIM studies measure ROI as net benefits divided by total costs. This metric is commonly used for pure financial analyses and intended to calculate a tangible cash return, but it is not consistent with a BCA approach. The equivalent metric for BCA is the benefit-cost ratio (BCR), which is calculated as total benefits divided by total costs. BCA is a more comprehensive approach that includes both financial and non-financial benefits and costs, such as time savings, improved safety, and other societal impacts. As several of the anticipated benefits and costs of BIM are non-financial, a BCA approach is better for capturing ROI of BIM investments.
4.2 Benefit-Cost Analysis Framework
This section describes the key principles of BCA to be considered in ROI analysis. As discussed previously, BCA compares total benefits to total costs and calculates various summary metrics. This approach is illustrated in Figure 4-3.
As shown in the figure, the framework involves identifying and monetizing as many of the benefits and costs related to BIM implementation and use as possible. The future streams of these benefits and costs are discounted by a discount rate over a selected period of analysis to calculate total discounted benefits and total discounted costs. These discounted benefits and
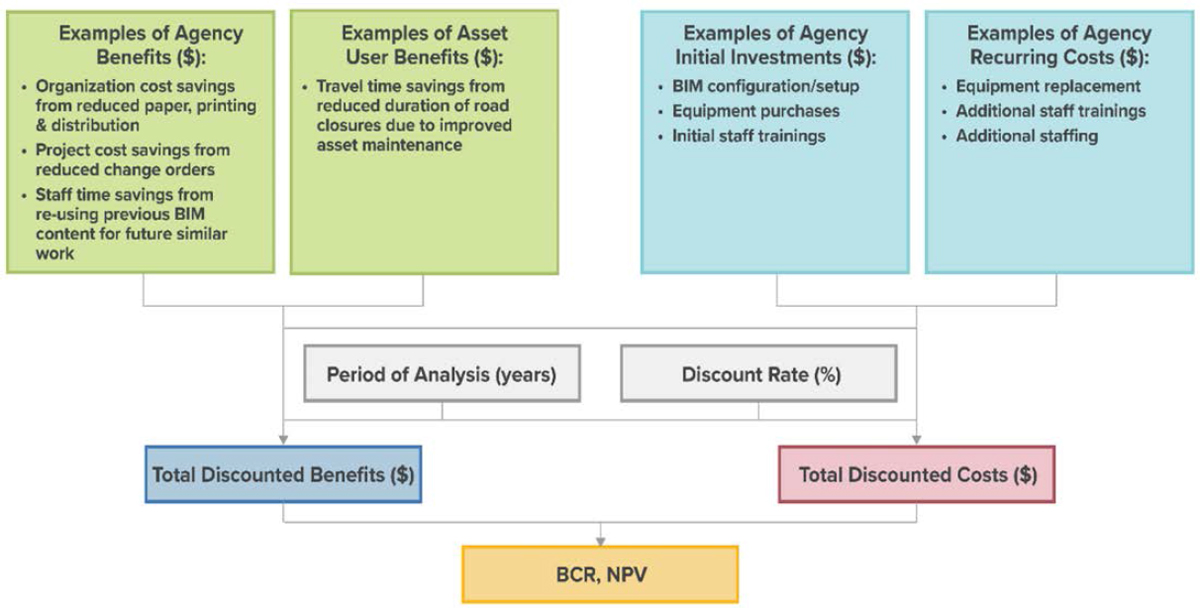
Figure 4-3. Illustration of BCA approach.
costs are used to calculate typical BCA metrics, such as the BCR payback period, and net present value (NPV).
Base Case versus Investment Case
BCA is a method that measures the effects of implementing a particular project, program, or other investment compared to not making the investment. The analysis monetizes as many benefits and costs as possible associated with two states of the world: the “Base Case” (the state of the world without the investment) and the “Investment Case” (the state of the world with the investment). Several Investment Cases can be considered, but they are always compared against the same Base Case.
Defining the appropriate Base Case and Investment Case is the first step in a BCA. The Base Case is typically defined as “business as usual,” meaning that no major changes are made from the current state of the world. However, the Base Case must also be realistic. Instead of “doing nothing,” the Base Case should still involve regular software and hardware upgrades that would occur without investing in new BIM-related technologies.
For the purposes of this study, the Base Case was defined as “business as usual” with no additional software or hardware investments, other than regularly scheduled upgrades. The Investment Case was defined as “investing in a new BIM technology, training and technical support, and other resources needed to enable BIM methods for project delivery and asset maintenance.” These definitions were also consistent with BIM ROI studies identified in the literature review (see Chapter 2), as demonstrated by the studies shown in Table 4-1.
Because BIM is a method of exchanging information and data between many systems and producing 3D models and information to support various use cases, it is important to categorize the types of technologies by specific applications. Software can be purchased with different
Table 4-1. Base Case versus Investment Case for BIM in the literature.
| Study | Investment Case | Base Case |
|---|---|---|
| Giel and Issa (2013) | Project B (BIM) | Project A (pre-BIM): small, commercial warehouse projects of tilt-up wall construction |
| Giel and Issa (2013) | Project C (BIM) | Project C (pre-BIM): assisted-living facility projects |
| Giel and Issa (2013) | Project F (BIM) | Project E (pre-BIM): mid-rise commercial condominium projects |
| Fanning et al. (2015) | Pecos Street over I-70 Bridge | Fort Lyon Canal Bridge (part of Rocky Ford Bridge project) |
| Barlish and Sullivan (2012) | Two historical BIM projects, one current BIM project | Two historical non-BIM projects, one current non-BIM project |
features and functionalities to support specific tasks, such as authoring and reviewing models and performing clash detection. This variety in functionality indicates that these software packages have codependencies and may be associated with different benefits. As more functionality is attained with the software, there becomes a greater potential for benefits. For instance, while the model authoring software allows the creation of design models, it lacks the functionality to track review comments for QA.
For an agency that already has model authoring software but will be upgrading to a more advanced package or expanding functionality, the Investment Case would include the “incremental costs” of the new software (i.e., the additional costs in the Investment Case compared to the Base Case), as well as all the benefits associated with the expanded modeling software capabilities. The Base Case would be the state of the world with the original BIM capabilities (or lack thereof), including the benefits associated with this software. No new investment costs would be considered for the Base Case because the agency has already purchased the software (sunk costs). However, any ongoing/subscription costs in the Base Case should be considered. The ROI analysis uses the incremental ongoing costs in the Investment Case compared to the Base Case. Multiple Investment Cases can be analyzed, depending on the level of software functionality purchased.
Distribution of Benefits and Costs over Time
BCA considers future streams of benefits and costs. In addition to the initial investments to acquire technology and supporting infrastructure, ongoing costs will be required to maintain the modeling software and BIM practices. For instance, software subscriptions will need to be renewed periodically. Refresher training will be necessary for existing staff, and any new hires will require comprehensive training.
Benefits occur over time. While many of the benefits resulting from improved design and construction are realized within the first few years of acquiring the BIM-related technology, benefits associated with enhanced maintenance will occur many years in the future. Additionally, many benefits will increase (or “ramp up”) over time as agencies become more familiarized with the modeling software and as a more comprehensive database of modeling content is built up over time.
For these reasons, estimating the ROI of BIM investment must consider an uneven stream of benefits and costs over time. Figure 4-4 illustrates this concept. Note that this figure is purely
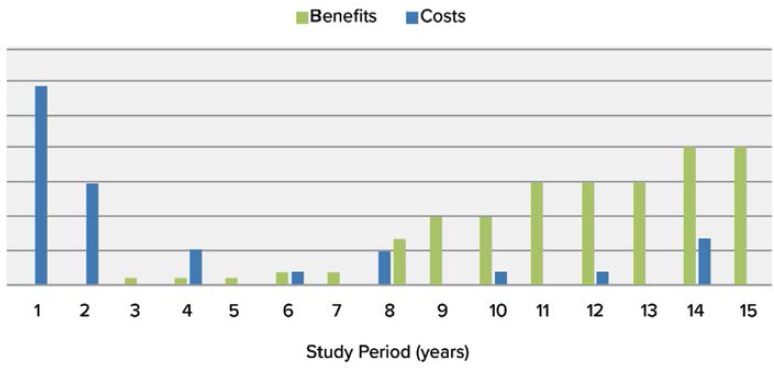
illustrative and should not be used to indicate the time frame or magnitude of cost recovery for BIM.
As illustrated by Figure 4-4, costs accrue from the beginning of the BIM technology investment, but benefits take time to ramp up and be fully realized. Accordingly, it will take time for agencies to recover their investment costs. Additionally, benefits realized from using BIM for one project will likely be insufficient to make up for these investment costs. Instead, agencies will start to see benefits exceed costs when considering their entire program of projects over time, unless initial BIM investments are for a megaproject.
Discounting
Discounting helps convert the uneven distribution of benefits and costs over time into comparable values. Discounting transforms future streams of benefits and costs into present terms. The need for discounting is based on people’s preference for the present over the uncertainty of the future. In other words, discounting reflects the fact that a dollar tomorrow is worth less than a dollar today, even without considering inflation.
Future benefits and costs should be discounted using the social discount rate, which captures the value society places on present versus future consumption. This is a real discount rate that does not include inflation. The discount rate should not be confused with inflation; inflation accounts for how the value of money changes over time, while discounting accounts for the preference of people for consumption today rather than in the future.
Agencies use a range of discount rates. Many state agencies have their own policies for selecting a preferred discount rate. The U.S. DOT follows guidance from the Office of Management and Budget (OMB) to select an appropriate social discount rate. OMB recommends using a 7.0 discount rate to reflect the opportunity cost of capital that would otherwise be invested in private markets. However, OMB also suggests using a 3.0 percent discount rate to provide a sensitivity analysis, where the lower rate represents the scenario in which project funds would otherwise be invested in alternative public uses. The BIM ROI Tool developed during this study has a default discount rate of 4.0, which is a middle value, but tool users should pick the value most appropriate for their analyses. Once a discount rate is selected, the same value should be used consistently for all BCAs in the future for comparability.
During the literature review performed for this study, the research team found that discounting is not commonly included in ROI studies. This is in part because most studies focus on the
benefits of applying BIM strategies during the design and construction phases, which tend to take place over a few years. However, discounting should still be included; it is especially important for BIM benefits in asset management, which occur later in the project lifecycle.
The ROI framework allows the tool user to consider the ramp-up effect common to BIM benefits, which will also be affected by the time value of money. As seen in Figure 4-4, BIM is expected to yield an uneven stream of future costs and benefits, with the bulk of costs occurring at the initial time of investment and benefits increasing over time. Benefits are affected by discounting more than costs, since benefits occur in the future. This timing means that applying discounting will disproportionately affect benefits compared to costs, and will thus result in a longer payback period compared to not applying discounting.
Return on Investment Measures
There are several different metrics that can be used to capture the ROI of BIM implementation: NPV, BCR, and payback period.
- NPV is the difference in the discounted benefits and costs of BIM investment. A positive NPV suggests that the BIM investment is economically justifiable, meaning that the benefits outweigh the costs. It is calculated as the present value of benefits (i.e., the entire stream of benefits discounted to the present) minus the present value of costs (including initial capital costs as well as ongoing maintenance and operating costs discounted to the present).
- BCR is the present discounted value of total benefits divided by the present discounted value of total costs of the BIM investment. A BCR greater than 1.0 indicates that the benefits of the BIM investment outweigh the costs and are worth the investment. A BCR of less than 1.0 indicates that the BIM investment will not generate benefits sufficient to offset the costs. A large positive BCR indicates a better investment than a low positive BCR. This metric can be used to compare different investment options.
- Payback period is the time it takes for the investment to break even—that is, the timespan between investment and when the cumulative benefits first exceed cumulative costs. The BIM ROI Tool shows the payback period in years, which is the difference between the year that the investment first breaks even and the year of investment. A shorter payback period indicates a larger BCR and a more beneficial investment.
As discussed at the beginning of this section, many of the BIM ROI studies identified through the literature review measured ROI as net benefits divided by costs, which is not consistent with BCA metrics. The ROI metrics quantified for this study are consistent with traditional BCA reporting practices.
4.3 Factors Influencing Realization of Benefits
There are several factors that can affect an agency’s potential to realize all benefits of BIM, but two are especially important: BIM use cases implemented and agency BIM maturity. These factors are described further in the following sections.
BIM Use Cases Implemented
Software companies typically sell a variety of BIM-related software packages that provide access to particular use cases. For instance, purchasing a software package for cloud-based document management can provide use cases associated with sharing and accessing BIM models. Alternatively, purchasing software specifically for design reviews can provide use cases associated with improved QC, editing, and geometric analysis, in addition to the use cases from sharing and editing BIM models.
Agencies that purchase BIM-related software packages can access more functionality (i.e., enable the adoption of more use cases). The research team mapped each benefit of BIM to one or more use cases. Therefore, agencies that acquire more use cases can realize more benefits. Agencies that purchase BIM-related software with use cases for asset management will be able to unlock the additional benefits that come from using BIM during the entire project lifecycle.
Agency BIM Maturity
This study defines agency maturity as the organization’s level of familiarity with BIM. The more “mature” agencies are, the more likely they are to be familiar with potential use cases for BIM and apply BIM throughout the project lifecycle. This can be represented conceptually by a CMM, as discussed in Chapter 2. While several CMMs are available, they are all based on three basic BIM adoption stages. These three stages define minimum BIM requirements and milestones to gauge level of BIM adoption (Succar 2010). These definitions of BIM adoption stages align well with the current state of and desired outcomes for BIM adoption in the United States.
The three stages of BIM adoption are Level 1, Level 2, and Level 3 (illustrated by Figure 4-5).
- Level 1, object-based modeling: might include creating 2D information for contract plans or creating 3D files for contractor use (e.g., AMG).
- Level 2, model-based collaboration: typically involves sharing federated (i.e., combined) models within a single shared online area while also relying on file-based collaboration and library management. Might include creating 3D object models for all disciplines.
- Level 3, network-based integration: fully integrated PIMs shared via real-time CDE and use of standards for interoperable data. Includes information attributes for all 3D objects.
This study defines BIM as the adoption of intelligent object-based 3D modeling. Levels 1–3 represent different variation in the adoption of BIM; Level 1 indicates an agency that has acquired fewer use cases of BIM than Level 2 or Level 3.
However, it is the increment between the Base Case and Investment Case, rather than the value at each level, that is important for BIM. Levels 1–3 can be represented by different Investment Cases for BIM adoption. The Base Case represents the level of BIM adoption if new investment
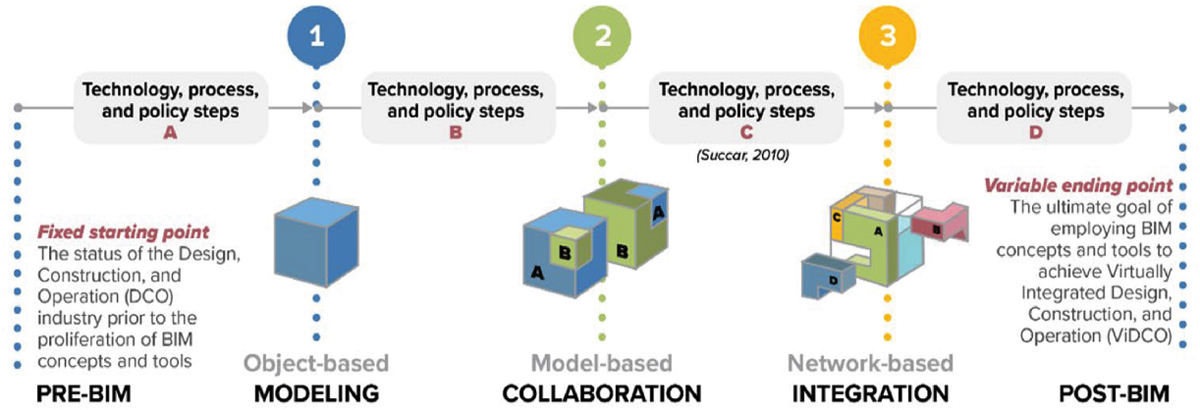
Figure 4-5. Levels of BIM adoption.
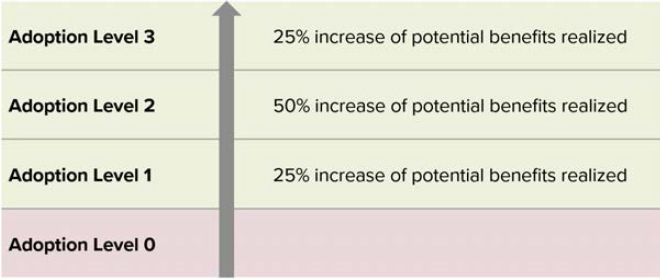
Figure 4-6. Benefits realized by levels of BIM adoption.
in BIM is not made. The Base Case could be Pre-BIM (Level 0), Level 1, or Level 2. Going from a Base Case of Pre-BIM (Level 0) to an Investment Case of Level 1, for example, would generate fewer benefits than going from a Base Case of Pre-BIM (Level 0) to an Investment Case of Level 3. In fact, the returns from achieving different levels of BIM adoption are not expected to be linear; that is, going from Level 0 to Level 1 is expected to generate fewer benefits than going from Level 1 to Level 2. Figure 4-6 summarizes this effect, which is also coded into the BIM ROI Tool. (Note that the value of percent changes between levels is an assumption made in the BIM ROI Tool to capture the concept of nonlinear returns.)
4.4 Identified Benefits and Costs of BIM
Based on the literature review, case studies, and expert panel, 24 benefits and 15 costs were associated with investing in BIM-related technologies. This section describes all unique benefits and costs; however, not all benefits can be monetized due to current data limitations. All the costs identified are costs to the agency. Most of the benefits also accrue to the agency, but some benefits would also accrue to users of the transportation asset (e.g., roadway users), and a small portion would go to the public.
BIM Benefits
The research team identified four categories of benefits associated with BIM:
- In-house agency cost savings: financial cost savings to the agency at an institutional level that are not attributable to a particular project. Benefits ramp up over time as more projects are designed using BIM methods.
- Project cost savings: financial cost savings attributable to a specific project from using BIM-related technologies on that project.
- Staff time savings: efficiency gains due to implementing BIM. By saving time on a particular task, staff time can be reallocated to another task.
- User benefits: all benefits realized by asset users, plus a small portion of benefits to the general public.
As indicated in the definitions, both agency cost savings and project cost savings are avoided financial costs. However, as avoided costs, financial cost savings do not represent revenue generation for the agency. Benefits monetized in this study represent added value, not necessarily
increased revenues. It should not be assumed that BIM-related investments will generate net financial savings. Instead, the combination of avoided financial costs plus improved efficiencies and workforce utilization can result in a positive net gain from investing in BIM, which is reflected through financial cost savings and efficiency gains.
Not all benefits of BIM can be monetized. First, some benefits of BIM are intangible improvements. For instance, improved communication due to detailed BIM design is a benefit. If improved communication leads to staff time efficiencies, then it can be monetized, but communication without time efficiencies can be difficult to monetize. Therefore, the ROI does not reflect all possible benefits of BIM. Additionally, as more agencies and industries adopt BIM, agencies that choose not to adopt BIM may be left behind, causing additional intangible costs.
Second, data limitations prevent the monetization of some benefits. User benefits, for instance, are not monetized in the BIM ROI Tool because these benefits can vary significantly from project to project. One example of user benefits is travel time savings to roadway users from reduced construction road closures for projects that use BIM techniques to improve schedule management. By reducing the days of construction, an agency is also able to reduce the days of road closures and congestion for vehicles. However, estimating such a benefit would require an understanding of the traffic levels during construction, the delay caused by construction, the diversion routes, and the hours of road closures that could be avoided, which vary vastly from project to project.
The BIM ROI Tool includes calculations to monetize 20 benefits; however, several of these benefits require agency data in order to be included in the analysis. Table 4-2 through Table 4-5 list the benefits identified by four categories: in-house agency cost savings, project cost savings, staff time savings, and user benefits.
BIM Costs
The research team identified 15 BIM-related costs, grouped into two categories:
- Initial costs: one-time, upfront costs associated with purchasing BIM technology. This includes costs such as the initial setup and configuration of BIM-related software for the DOT, as well as initial comprehensive trainings for staff.
- Ongoing costs: regular, semi-regular, or temporary costs incurred over time to maintain BIM-related investments. These include costs such as ongoing software subscriptions, recurring software and hardware upgrades as needed, and ongoing staff trainings.
Table 4-6 lists the identified costs associated with adopting BIM.
4.5 Monetizing Benefits
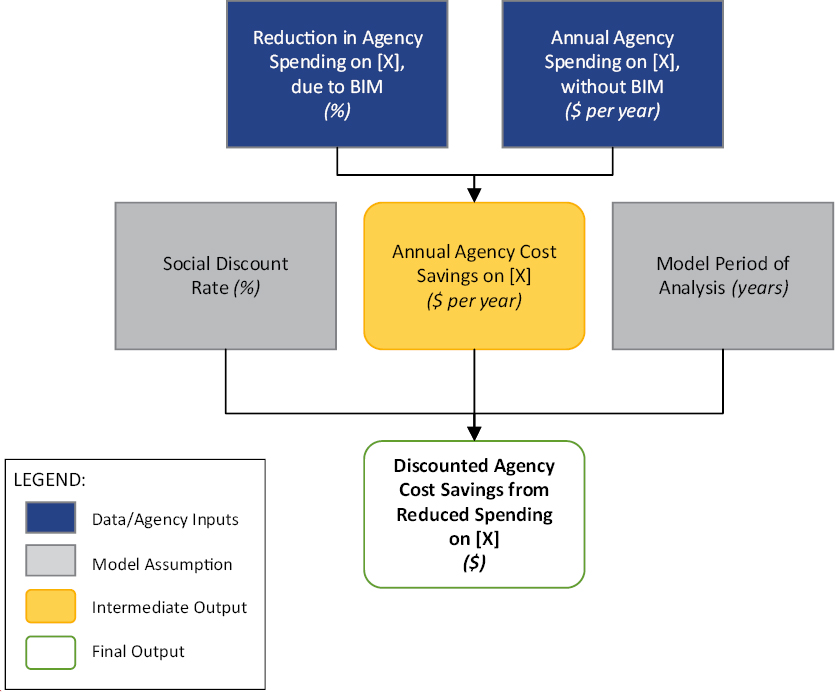
This section provides an overview of the calculations made in the BIM ROI Tool to estimate the benefits of BIM. Calculations are illustrated using structure and logic (S&L) diagrams. S&L diagrams are a visual illustration of a set of calculations used to estimate a particular result or final output. The diagrams consist of boxes connected with arrows. Each box represents an input variable or parameter; intermediate output (calculated based on the input variables, parameters, and other intermediate outputs); or the final output. The arrows between boxes are operations (e.g., add, multiply, divide). In addition to helping to explain how calculations are made in the tool, S&L diagrams also identify the data needs for the calculations.
There are a total of six S&L diagrams included in this section, grouped into one of the three benefit categories monetized for the BIM ROI Tool. Rather than having one diagram for each of the 20 monetized benefits, some diagrams are generalized to represent calculations for several
Table 4-2. In-house agency cost savings from adopting BIM.
| Code | Benefit Name | Benefit Definition |
|---|---|---|
| BA 1 | Cost savings from reduced paper, printing, and distribution | This benefit refers to reduced spending on the production and distribution of plan sheets plus printing and shipping of bid tabs that results from moving to a digital approach. Agencies that have already implemented “e-construction” or only issue electronically signed and sealed PDFs of the plans will not experience these cost savings. |
| BA 2 | Cost savings from reduced physical storage needs and office space/elimination of leased building space | This benefit is the cost savings from reduced use of office space and leased building space for storage of paper plans and other physical files due to digital conversion. Agencies that have already implemented “e-construction” or only issue electronically signed and sealed PDFs of the plans will not experience these cost savings. |
| BA 3 | Avoided vehicle crashes due to safety simulation with BIM | This benefit results from avoiding potential vehicle crashes due to improved safety simulations during project design. Specifically, this benefit is monetized by the avoided operational costs to the agency (e.g., cleanup and property repair costs, such as guardrail replacements) that would have resulted from vehicle crashes. |
| BA 4 | Improved worker safety during construction inspections | This benefit represents the value of reduced worker accidents during construction inspections resulting from increased use of automation by contractors. Specifically, workers may be less exposed to heavy equipment when contractors use AMG, and they may spend less time onsite performing inspections by using 3D model viewer apps on mobile devices. |
| BA 5 | Improved worker safety during maintenance inspections | This benefit represents the value of reduced worker accidents during asset maintenance inspections resulting from increased use of automation when capturing existing conditions. Specifically, workers may be less exposed to live traffic because they may be using remote sensors to capture information that can be compared to a 3D as-built model of the asset. |
| BA 6 | Cost savings on inspections due to the use of drones | This benefit is the cost savings on inspections due to the use of drones. For instance, using drones during bridge inspections has been shown to reduce the need for traffic control, which avoids the costs associated with traffic control. |
Table 4-3. Project cost savings from adopting BIM.
| Code | Benefit Name | Benefit Definition |
|---|---|---|
| BP 1 | Cost savings from avoided change orders | This benefit is the cost savings from avoided change orders due to improved collaboration between disciplines to identify conflicts and constructability issues. |
| BP 2 | Cost savings from improved schedule management | This benefit is the cost savings that result from completing a project early or on time due to the use of BIM for managing the schedule. For instance, the use of 4D model simulations to identify sequences of activities that may interfere with each other. This risk management tool enables the team to make plan modifications to conduct the work without affecting the timeline. |
| BP 3 | Lower construction bid prices due to improved communication of design intent | This benefit captures the reduction in costs of construction contracts due to reduced risk from the use of BIM. Specifically, contractors bidding on construction contracts may reduce bid amounts by removing the risk contingency given the access to 3D models that better communicate the design intent. |
| BP 4 | Cost savings from creating visualizations with BIM | This benefit represents the cost savings of creating a visualization video with the use of modern 3D modeling software (compared to completing a project visualization without 3D design models of the project). This might include visualizations for public information, safety simulations, or other uses. |
| BP 5 | Cost savings from optimization of construction material or design options due to BIM design | This benefit is the cost savings from optimization of construction material use or design options due to having a detailed project 3D model. This refers to the optimization of material use rather than reduction of material overruns. Construction materials or design options can be optimized through BIM visualization and design tools. |
Table 4-4. Staff time savings from adopting BIM.
| Code | Benefit Name | Benefit Definition |
|---|---|---|
| BS 1 | Time savings from re-using previous BIM content for future similar work | This benefit represents the time saved in developing a project design by re-using previous BIM content (3D-component libraries in CAD). This benefit grows over time as a content library of 3D templates is developed. |
| BS 2 | Time savings from avoiding tracking down information for scoping project | This benefit is the total time saved on scoping a project. Specifically, this represents time saved in tracking down information due to having access to an enterprise database that has been populated from BIM products as a reference, such as digital as-built or asset inventory record models. |
| BS 3 | Time savings from improved design efficiency, including parametric design and avoided design rework | This benefit is the time saved when creating a project design due to improved work efficiency, including parametric design and avoided design rework. This would require the use of modern modeling software with parametric design and dynamic updates functionality. |
| BS 4 | Time savings in document review and approval due to faster turnaround time by using cloud-based software | This benefit is the time saved when reviewing and approving documents due to faster turnaround time with cloud-based software. This benefit will not be realized for agencies already using real-time review workflows with cloud-based software to review PDF plan sheets (e.g., Bluebeam). Benefits may also be realized by taking an intermediate step to go from paper to electronic workflows using PDF plans. While not a BIM environment, the implementation of a real-time collaborative review process using electronic plans (PDF form) and cloud-based software to track comments can result in some benefits similar to the full implementation of BIM. |
| BS 5 | Time savings from avoided RFIs due to improved clarity of design | This benefit is the time saved by having fewer RFIs, and therefore spending less time responding, due to improved clarity of design from BIM models. |
| BS 6 | Staff time saved from improved schedule management/improved workforce utilization | This benefit is the staff time saved due to improved schedule management. Improved schedule management enables teams to reallocate staff tasks from one activity to another (i.e., improved workforce utilization). |
| BS 7 | Time savings during construction inspections due to use of 3D digital design data | This benefit is the time savings during construction inspections from utilizing 3D digital design data and GPS equipment or mobile model viewers (instead of traditional methods, such as using plan sets, cross-sections, or level and tape methods). |
| BS 8 | Time savings on completing design quantities | This benefit is the time savings on completing design quantities due to automation with BIM. This refers to the BIM software functionality to automate reports for all pay item quantities, instead of using manual methods with spreadsheet calculations. |
| BS 9 | Avoided time spent tracking down information needed for routine maintenance or repair work | This benefit is the avoided time spent tracking down information needed for routine maintenance or repair work due to having all information saved in a centralized location. |
Table 4-5. User benefits from adopting BIM.
| Code | Benefit Name | Benefit Definition |
|---|---|---|
| BU 1 | Travel time savings for roadway users due to reduced construction road closures (from improved schedule management) | Reduced road closures translate to fewer days of detours for vehicles. |
| BU 2 | Vehicle operating cost savings for roadway users due to reduced construction road closures (from improved schedule management) | Reduced road closures translate to fewer vehicle miles traveled. |
| BU 3 | Emissions cost savings for roadway users due to reduced construction road closures (from improved schedule management) | Reduced road closures translate to fewer vehicle miles traveled, and thus fewer emissions. |
| BU 4 | Safety benefits for roadway users due to reduced construction road closures (from improved schedule management) | Reduced road closures translate to fewer vehicle miles traveled, and thus fewer vehicle collisions. |
Table 4-6. Costs from adopting BIM.
| Code | Cost |
|---|---|
| Initial Costs | |
| CI 1 | Initial cost of BIM asset management software or system configuration and customization (e.g., professional services to set up system solution) |
| CI 2 | Initial BIM hardware investments or upgrades required (e.g., computer workstations, tablets, GPS rovers, drones, robotic stations) |
| CI 3 | Cost of initial comprehensive staff training |
| CI 4 | Opportunity cost of staff time for initial comprehensive training |
| Ongoing Costs | |
| CO 1 | Incremental costs of BIM-related software subscription |
| CO 2 | Incremental spending on IT resources or infrastructure from BIM (e.g., cloud storage capacity/data storage, ProjectWise capacity, internet speed/capacity) |
| CO 3 | Semi-regular hardware replacement costs (e.g., GPS rovers, drones, robotic stations) |
| CO 4 | Cost of external refresher staff trainings |
| CO 5 | Opportunity cost of staff time for external refresher trainings |
| CO 6 | Opportunity cost of staff time for internal refresher trainings |
| CO 7 | Opportunity cost of creating new training materials |
| CO 8 | Average cost increase of professional services contracts due to requiring BIM for design |
| CO 9 | Cost of hiring additional staff needed for BIM program |
| CO 10 | Cost of acquiring digital as-built once project is completed |
| CO 11 | Cost to maintain database of digital as-builts |
benefits. As indicated by the diagram legends, the rectangular boxes with the darkest shading represent data used to quantify benefits of BIM, while rectangular boxes with lighter shading represent model parameters or other economic data used in the tool. Rounded boxes with the lightest shading are intermediate outputs calculated, and darker rounded boxes are the final output (i.e., BIM benefits).
Calculations for In-House Agency Cost Savings
All six agency cost-savings benefits shown in Table 4-2 can be represented by either
- Direct reduction in annual organizational costs due to BIM; or
- Reduction in quantity of inputs required for organizational operations due to BIM, which translates to reduced costs.
The S&L diagrams in this section represent these two categories of agency cost savings.
The S&L diagram in Figure 4-7 shows the calculation of agency cost-saving benefits from a direct reduction in costs. An example of this type of agency cost-savings benefit (represented by the “X” in Figure 4-7) is reduced spending on the production and distribution of plan sheets as well as printing and shipping of bid tabs, a result of moving to a digital approach. This benefit is calculated by estimating the average annual spending on paper, printing, and distribution prior to adopting BIM, as well as the percent reduction in this spending due to digital conversion. Multiplying these two variables yields the average annual cost savings, which is then discounted using the social discount rate over the period of analysis. This results in total discounted agency cost savings from reduced spending on paper, printing, and distribution.
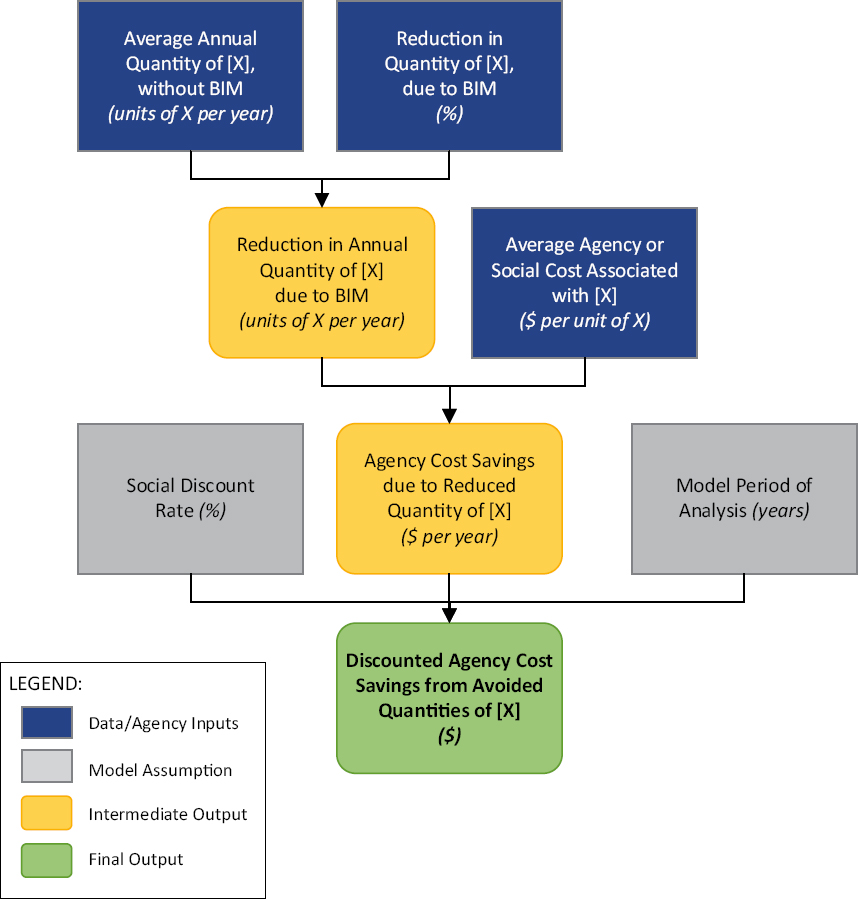
Figure 4-8 includes an S&L diagram representing in-house agency cost savings from a reduction in quantity of inputs. An example of this type of benefit is the reduction in average worker injuries during construction inspections due to increased use of automation. This limits
worker exposure to heavy equipment and may reduce the amount of onsite inspection time versus 3D model viewings. To estimate this benefit, the average annual number of worker injuries across all projects without automation is multiplied by a percent reduction in injuries due to the use of automation. This yields the avoided annual number of worker injuries, which is monetized using average values per injury, by level of severity, as provided in the U.S. DOT BCA guidance. This annual avoided cost is discounted over the period of analysis.
Project Cost Savings
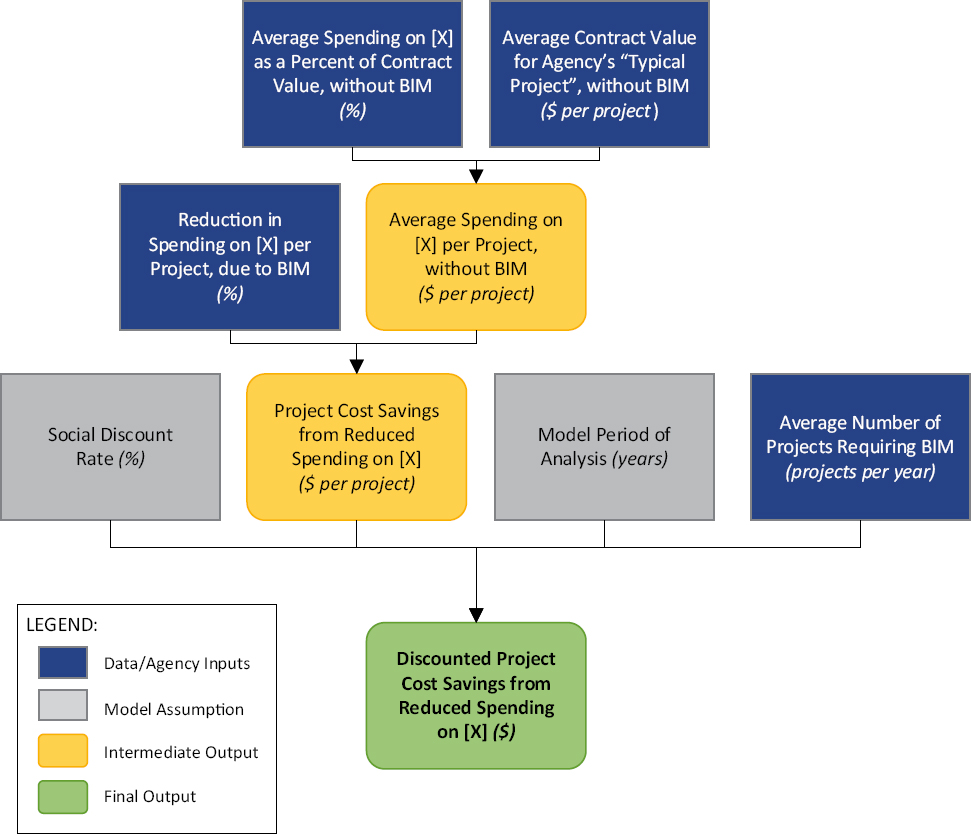
Like agency cost savings, project cost savings are calculated as either a direct reduction in per-project costs due to BIM or a reduction in input quantities required per project due to BIM. Since project cost savings are an improvement per project, the benefit is scaled up by the number of projects per year to calculate annual cost savings. The S&L diagram in Figure 4-9 illustrates the calculation of a project cost-savings benefit brought about by a direct reduction in cost.
One example of a project cost-savings benefit fitting this calculation structure is reduced spending on construction materials or design options due to BIM design. This benefit is calculated by estimating average spending on construction materials as a percentage of total contract value, then multiplying by the average contract value for the agency’s typical project to get average spending on construction materials per project. This number is then multiplied by the percent reduction in spending on construction materials due to the optimization of materials from the use of BIM during design. Per-project savings are then scaled by the average number of projects per year that use BIM to calculate annual cost savings, and then discounted back over the model period of analysis to get discounted total project cost savings.
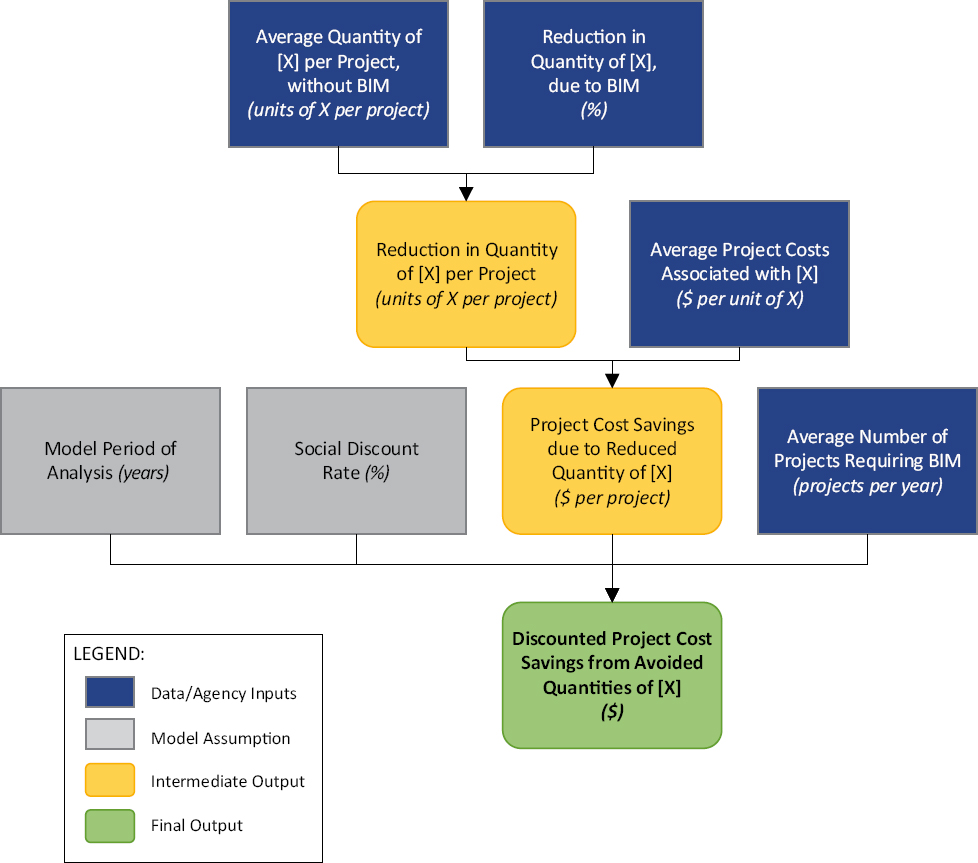
The S&L diagram in Figure 4-10 illustrates the calculation of a project cost-savings benefit brought about by a reduction in quantities per project. An example of this benefit is project cost savings from improved schedule management. This is the benefit that results from completing a project early or avoiding overruns due to the use of BIM for managing the schedule. To calculate this benefit, the average duration of the agency’s typical project should be estimated. This is multiplied by the percent improvement in project schedule due to BIM to get the number of avoided days of delay. This is monetized using a generalized conditions cost to approximate the average value of a day saved in the project schedule. These cost savings are discounted over the model period of analysis to get total discounted project cost savings from improved schedule management.
Staff Time Savings
Staff time-savings benefits (as shown in Table 4-4) can be represented by either
- Reduction in staff time spent on project-related activities due to BIM; or
- Reduction in staff time spent each year on other agency-related duties due to BIM.
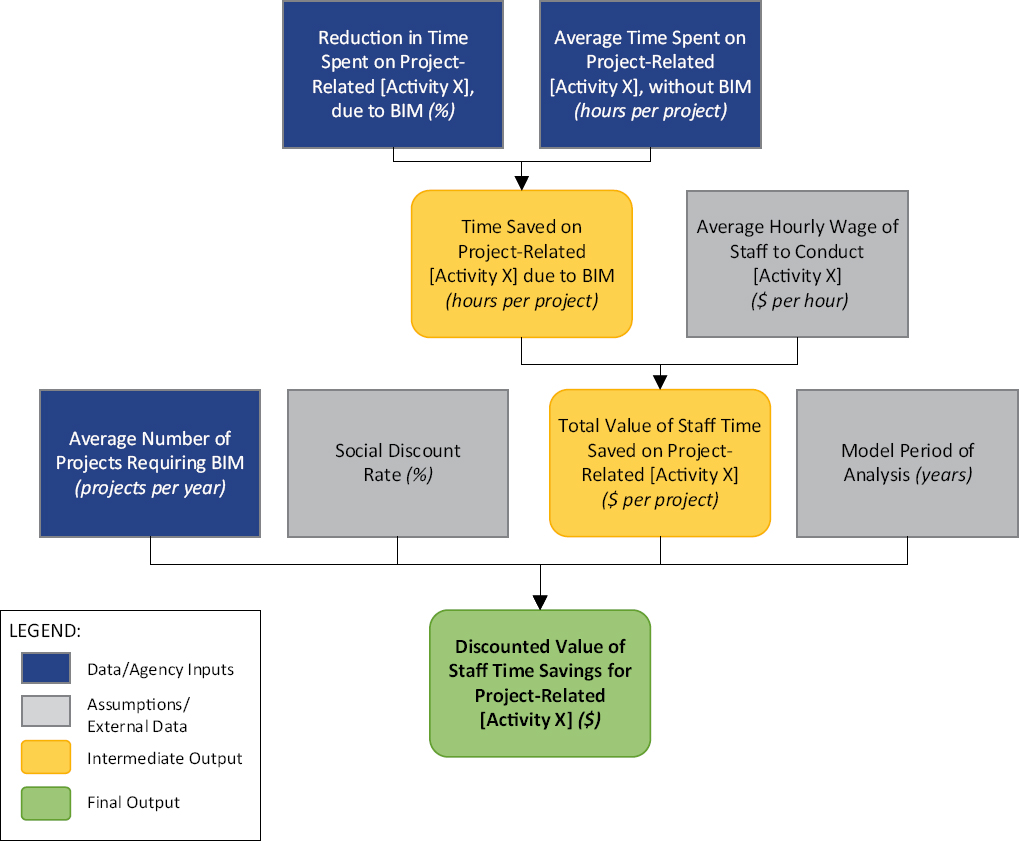
The S&L diagram in Figure 4-11 illustrates calculations for the first type of staff time-savings benefits.
One example of this project-related staff time-savings benefit is time saved on completing design quantities due to automation. In this example, using BIM to automate reports for all pay item quantities (rather than using manual methods with spreadsheet calculations) allows staff to save time on this project task. To monetize this benefit, the average time spent on manual methods is multiplied by a percent reduction in staff time on this activity due to automation. Hours saved are then monetized using average hourly staff rates for the relevant staff involved in the task. The total value of staff time saved is estimated on a per-project basis and is scaled to annual cost savings based on the average number of projects each year requiring BIM. These savings are discounted over the model period of analysis.
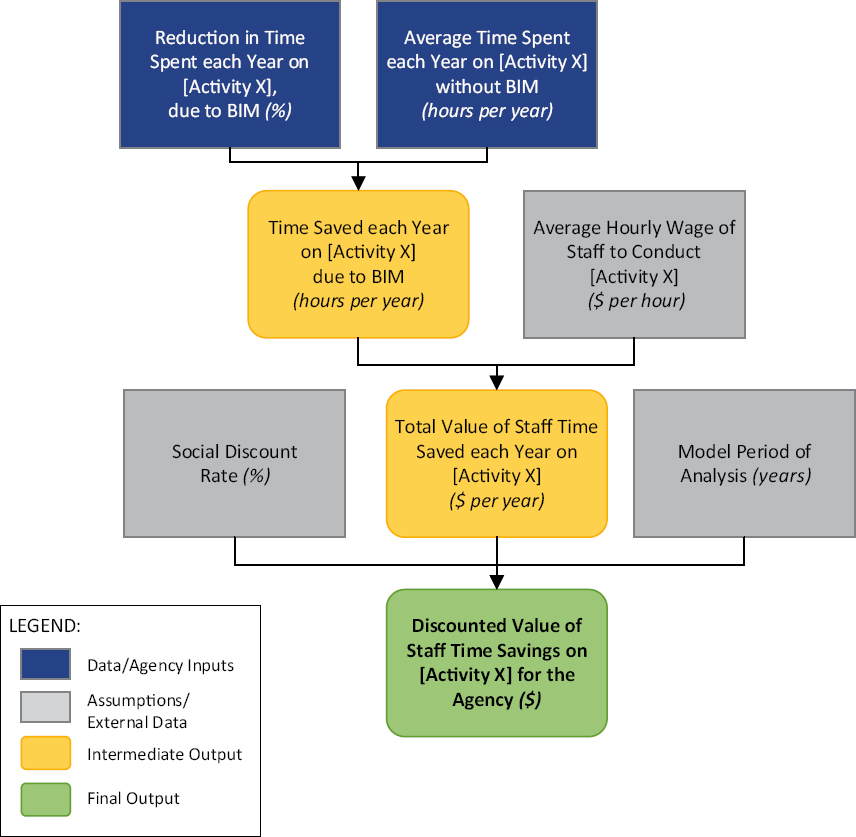
The S&L diagram in Figure 4-12 illustrates calculations for staff time-savings benefits at the organizational level rather than staff time related to a specific project.
An example of organizational staff time-savings is reduced time spent tracking down information needed for routine maintenance and repair work because all information is saved in a centralized location. Populating asset inventory databases creates centralized data storage processes, facilitating access by all staff. This example includes staff time savings during operations for
all projects maintained by the agency. These calculations are very similar to those in Figure 4-11, but time is saved for the agency per year rather than per project. To calculate this benefit, the average time spent each year tracking down relevant asset information without BIM is multiplied by the percent improvement (in time spent) given the centralized data location. These hours saved are monetized using staff hourly wages. These annual savings are accrued over the model period of analysis and discounted back to present value terms using the social discount rate.
4.6 Conclusions and Observations
The ROI framework described in this chapter was implemented into the Excel-based BIM ROI Tool. This tool calculates the benefits and costs of investing in BIM-related technologies assuming a 10-year period of analysis and a social discount rate of 4.0 percent, though both parameters can be adjusted by the agency. The tool calculates and displays the various ROI metrics discussed in this report, including the BCR and NPV of the investment.
The analysis is necessarily performed at the program level rather than at the project level. There are many reasons for this approach, including the fact that the investment costs are not meant to be recovered by one project, but rather over time after the process is applied to a program
of projects. Also, not all the benefits of BIM can be attributed to a specific project. The agency benefits listed in Table 4-2 accrue to the organization rather than to one project. Finally, there are several cumulative project-level benefits that can only be realized once enough time has passed and enough data have been collected. For instance, agency staff can save time on designing a new project by reusing previous BIM content, but first a 3D component library must be built over time. Due to this program-level approach and data limitations, described later in this report, the BIM ROI Tool cannot be used to evaluate the case study projects individually. Instead, the tool should be used to evaluate the extent to which an agency’s program of projects can benefit from the use of BIM.
Based on the literature review, case studies, and expert panel, this study identified 24 benefits associated with implementing BIM for transportation projects. Four of these benefits could not be quantified because they were context specific and the data would be difficult to obtain. These are the four user benefits described in Table 4-5. For instance, roadway users are expected to receive travel time savings from reduced construction road closures for projects that use BIM techniques to improve schedule management. In other words, by reducing the days of construction, the agency is also able to reduce the days of road closures and therefore reduce congestion for vehicles. However, this would require an understanding of the traffic levels during construction, the delay caused, the diversion routes, and the hours of road closures that could be avoided, which vary largely from project to project.
Calculations for the remaining 20 benefits were built into the BIM ROI Tool; however, 14 of these benefits were missing data for one or more variables and thus required agency input. The remaining 6 benefits were monetized in the BIM ROI Tool. Similarly, there were 15 costs of BIM identified by this study. Of these 15 costs, 8 costs were missing data for one or more variables and thus required agency input. The remaining 7 costs were monetized in the tool.
Based on the 6 monetized benefits in the tool, cost savings from avoided change orders (BP 1 in Table 4-3) are the largest benefit. This also aligns with qualitative findings from the case studies—all five of the case studies identified avoided costs associated with change orders as a significant benefit of BIM. The next largest benefits are both agency cost savings: from the use of drones during inspections—thus avoiding costs associated with traffic control (BA 6 in Table 4-2)—and also from avoided worker injuries during maintenance inspections due to increased automation, remote sensors, and reduced exposure of workers to live traffic (BA 5 in Table 4-2). The remaining 3 monetized benefits are all associated with improved staff efficiencies. Out of the 20 quantifiable benefits identified, 9 are staff time savings. This indicates that while there may be more benefits associated with staff efficiencies, the highest value comes from project cost savings and agency cost savings. Thus, agencies may decide to focus on tracking benefits associated with project and agency cost savings, while tracking staff efficiencies from BIM may not be worth the effort.
Considering the 6 monetized benefits and 7 monetized costs and making various assumptions about the agency context (e.g., the number of use cases, typical project size and duration, and software costs), this ROI study calculated an ROI from BIM greater than 1.0, indicating a net positive investment. However, there are several qualifications to this result.
First, not all the identified benefits and costs are monetized and included in this ROI result due to data limitations. For instance, the literature review found that many ROI studies tend to focus on the returns of BIM for buildings rather than for transportation infrastructure. The case studies were helpful in enumerating the benefits of BIM qualitatively. For instance, all five of the case studies had identified avoided costs associated with change orders as a significant benefit of BIM. However, these agencies did not track much of the data needed to monetize benefits. Additionally, only one of these agencies (DEN) has started using BIM for asset management, so these benefits were particularly difficult to capture. Collecting cost data from the case studies was also difficult since the project teams interviewed were not in charge of the agency’s financial decisions (i.e., investing in software, hardware, or other equipment) and therefore were unaware of these costs. The expert panel was helpful in providing orders of magnitude estimates of the benefits; many BIM practitioners do not collect the data but do have a sense of the relative significance of the benefits. Additionally, some participants did provide data on costs and benefits after the panel session.
Agency context is also critical for determining the benefits and costs of BIM; therefore, it is not feasible to provide one solution to the ROI of BIM for any given agency. Instead, the BIM ROI Tool requires the agency to enter various inputs to specify the agency context. As discussed in this chapter, realizing benefits from BIM depends largely on the number of BIM use cases acquired and pursued by the agency. Acquiring more use cases (through the purchase of various modeling software programs) allows the agency to realize more benefits. Thus, the agency must specify in the BIM ROI Tool that BIM use cases will be acquired in the Investment Case.
Similarly, agencies need to specify what types of investments they plan to make as part of their BIM adoption process (such as investing in new hardware, BIM trainings, and equipment). Because many of the benefits are calculated as a percent reduction in project costs, agencies must also specify the size of their typical project.
Another important aspect of the agency context is specifying the level of BIM adoption in the Base Case compared to the Investment Case (Table 4-1). This allows the BIM ROI Tool to calculate the incremental change in benefits between the state of the world with the BIM investment and “business as usual” for an agency. For instance, if the agency plans to go from Level 0 (pre-BIM) to Level 1 (object-based modeling), the benefits will be lower than if the agency goes from Level 0 (pre-BIM) to Level 2 (model-based collaboration). While the tool does require several inputs by the agency, there are also many suggested values provided to help inform an agency’s estimates.
Given these data limitations and the requirements for inputs on the agency context, the BIM ROI Tool provides two options to the user. First, the agency can perform a default analysis, which allows the user to perform a quick ROI analysis based on the data collected for the 6 benefits and 7 costs. The agency will still need to enter information on the agency context under the “User Inputs” sheet.
The second option is to perform a detailed analysis, which captures all 20 benefits and 15 costs identified by the study. This option requires the agency to provide data or estimates to help monetize the 14 benefits and 8 costs with missing data. These values can be based on agency estimates at first, and then these values can be adjusted over time, as the agency collects the data indicated by the tool, to more precise measures. The agency must still enter information on the
agency context on the “User Inputs” sheet. (More details on these options and instructions on how to use the BIM ROI Tool are provided in Appendix B of this report.)
One finding from this study is that many transportation agencies agree conceptually that there are many benefits from BIM and that these benefits likely exceed the costs of investment. However, agencies are often not collecting the type of data needed to measure and monetize the benefits from this investment. One reason is likely that there is no standardized set of metrics established to inform agencies on what type of data should be collected.
Thus, one of the key outcomes from this study should be to establish such a set of standard metrics. The BIM ROI Tool includes a sheet called “Benefits Data,” which lists all the variables and units needed to measure each benefit. The research team strongly recommends that agencies use this sheet of variables to inform their data collection process going forward. After several agencies have collected these data, the team suggests performing further research to compile, aggregate, and review these data to add to the knowledge base of BIM benefits.
One of the goals of this study was to answer four key questions regarding the ROI of BIM. These questions are presented in the following sections, along with responses based on the findings from this study.
Can the Benefits of BIM Be Quantified?
The research team identified 20 quantifiable benefits of BIM. However, due to data limitations, 6 of these benefits were fully monetized in the tool, while the remaining 14 benefits include some, but not all, of the required data for monetization. However, calculations for all 20 benefits are coded into the BIM ROI Tool. If agencies provide estimates for the remaining data items, the tool will automatically incorporate the remaining benefits into the ROI calculation.
Are the Benefits of BIM Substantial Enough to Justify the Investment Required by Implementation?
Based on the 6 benefits and 7 costs monetized in the BIM ROI Tool, and given several assumptions about agency context, the benefits of BIM do justify the investment. However, there are several caveats to this answer. As described earlier, this result does not account for 14 benefits and 8 costs of BIM identified by this study. These benefits and costs cannot be fully monetized in the tool at this time due to data limitations. Additionally, agency context is critical for determining the benefits and costs of BIM, thus it should be tailored to each agency. This includes specifying which BIM use cases are acquired by the agency, what types of investment costs will be incurred (hardware, trainings, equipment, etc.), what is the agency’s typical project size, and what is the agency’s maturity level of BIM in the Base Case versus Investment Case (refer to Figure 4-5). However, based on qualitative feedback received during the interviews with transportation agencies and BIM experts during this study, there is a strong belief that the benefits of BIM do outweigh the costs.
What Is the Cost of Doing Nothing?
While the ROI of investing in BIM varies by agency, the long-term cost of making no investment into BIM-related technologies is likely to be significant. Software costs are one of the few costs identified in the study. An agency that chooses not to integrate BIM does not necessarily avoid the costs of upgrading systems. Software is frequently updated, and legacy versions are sunsetted. As a result, an agency may have to purchase new software simply to continue what it has already been doing. An agency adopting only a basic package does not receive the full benefits
of BIM. This would be like purchasing a smartphone but using it only to make phone calls. The marginal costs of additional packages are minor compared to the benefits of BIM integration.
Based on conversations with agencies and BIM experts during this study, BIM is the future for the industry. While there are limited data to quantify the ROI from this investment, the feedback received overwhelmingly confirms that using BIM techniques can help save money and time. If an agency chooses not to integrate BIM, the missed benefits of BIM (minus the marginal costs of additional packages) are the costs of inaction.
How Can Stakeholders Realize the Maximum Benefit of BIM?
Based on the findings from this study, there are multiple factors that determine the level of benefits that can be realized from BIM. First, the more BIM use cases acquired by the agency, the more opportunities there are to realize benefits from BIM. This means that investing in software and technologies that allow more opportunities for applying BIM methods provides more avenues for realizing benefits. In particular, agencies that apply BIM techniques throughout the project lifecycle (from delivery through asset management) have more opportunities to realize benefits.
Another factor that determines the scale of benefits is the level of agency BIM maturity (i.e., the level of BIM adoption). As described in Figure 4-6, the adoption of BIM can be grouped into different levels, ranging from pre-BIM (Level 0), to the use of 2D and 3D independent files (Level 1), to model-based collaboration (Level 2), to a fully integrated model sharing real-time information in a CDE (Level 3). Depending on the agency’s level of BIM adoption in the Base Case and the Investment Case, the benefits realized will vary. For instance, going from Level 0 to Level 1 is likely to provide fewer benefits than going from Level 1 to Level 2.
Finally, this study found that the level of benefits can also be constrained by the type of projects to which BIM processes are applied. BIM tends to be most beneficial for large and complex projects. For instance, using BIM techniques for a straightforward re-paving project may offer fewer benefits; but for a megaproject, BIM will likely provide more opportunities to save costs and time. While project complexity is not factored into the BIM ROI Tool calculations, a larger contract value does increase the size of the benefits realized.


