

CHAPTER 4
Transit Agency Case Studies
This chapter includes case studies that represent transit agencies that exemplify a variety of community types, transit agency sizes, fare structures, and fare-free experiences. These case studies were developed to inform the evaluation framework and provide more detailed examples of how fare-free transit has been evaluated at transit agencies of different sizes across the United States. Information was gathered from the survey responses, transit agency interviews, news articles, and press releases.
Purpose of Case Studies
To inform evaluation framework development and provide more detailed examples of how fare-free transit has been evaluated at transit agencies of different sizes across the United States, the project team developed 23 case studies. Transit agencies looking to evaluate fare-free transit in their community can identify similar systems and learn about their experiences. The research team used the case studies to develop the final evaluation framework. Examples from the case studies are included throughout the evaluation framework as examples of the “framework in practice.” Please note that the research team developed the case studies in early 2022. Because some evaluations were ongoing at the time of writing, some of the information may have changed by the time this report is published.
Transit Agency Categorization
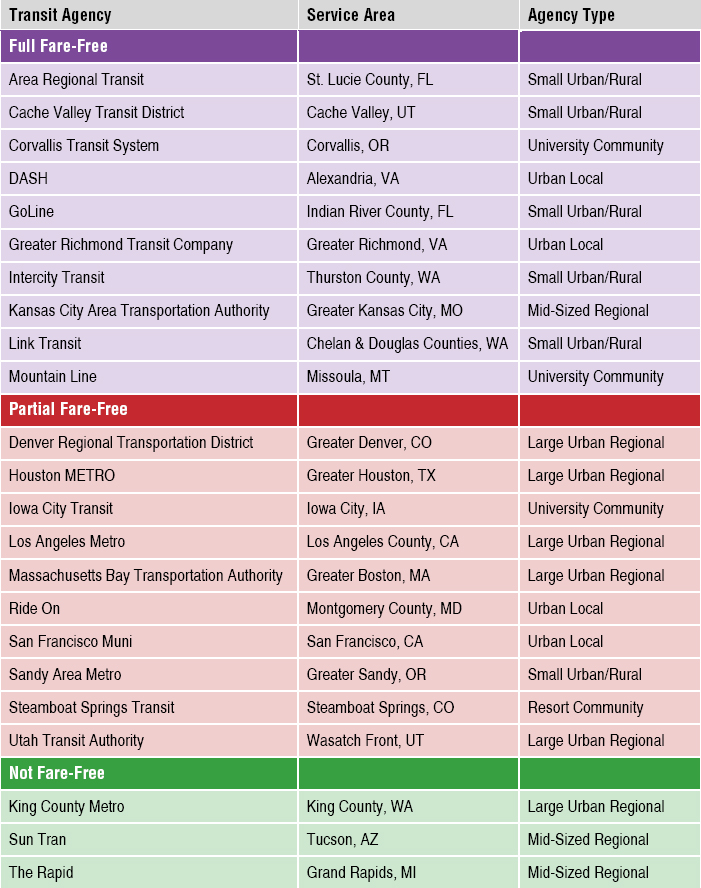
The case studies presented in this chapter are organized under three main types of fare-free transit service:
- Full fare-free: Transit agency does not collect fares from any riders.
- Partial fare-free: Transit agency does not collect fares from specific groups of riders, on certain routes or transit services, during certain times, or in defined areas. These transit agencies may have been considering piloting or implementing fare-free transit.
- Not fare-free: Transit agency collects fares from all riders. These transit agencies may have been considering piloting or implementing fare-free transit.
The research team also classified the case study transit agencies into five categories based on data from the National Transit Database (NTD) including 2019 ridership levels, the population and density of the service area, and the population of the overall urban area.5 The research team also looked at the modes operated by the transit agency and its relationships with other transit providers. These types are not prescriptive or exact, but rather provide general guidelines for understanding differences in fare-free systems.
___________________
5 In some cases, the 2019 NTD data did not line up with staff expectations when reviewed by the respective transit agencies. In some cases, transit agency staff responsible for reporting operations data to NTD included additional revenue sources as farebox revenue leading to higher farebox recovery percentages. To maintain consistency across the case studies, NTD data was reported for all case studies unless otherwise noted.
The transit agency categories are as follows:
- Large Urban Regional: Has a large service area population, part of a large or very large urban area, serves multiple communities across an urban area as the main transit provider, and has high ridership.
- Urban Local: Located in a large or very large urban area, service area is also served by other large transit providers and has a smaller service area population than large urban regional transit agencies.
- Mid-Sized Regional: Serves a medium service area population in a medium to large urban area, acting as the main regional transit provider.
- Small Urban/Rural: Low to medium ridership, serves a small service area population, not part of a large urban area, and may connect with neighboring agencies but not serve the same area.
- Resort Community: Serves a small community with a mainly resort economy.
- University Community: Serves a small to medium-sized community with one or more universities.
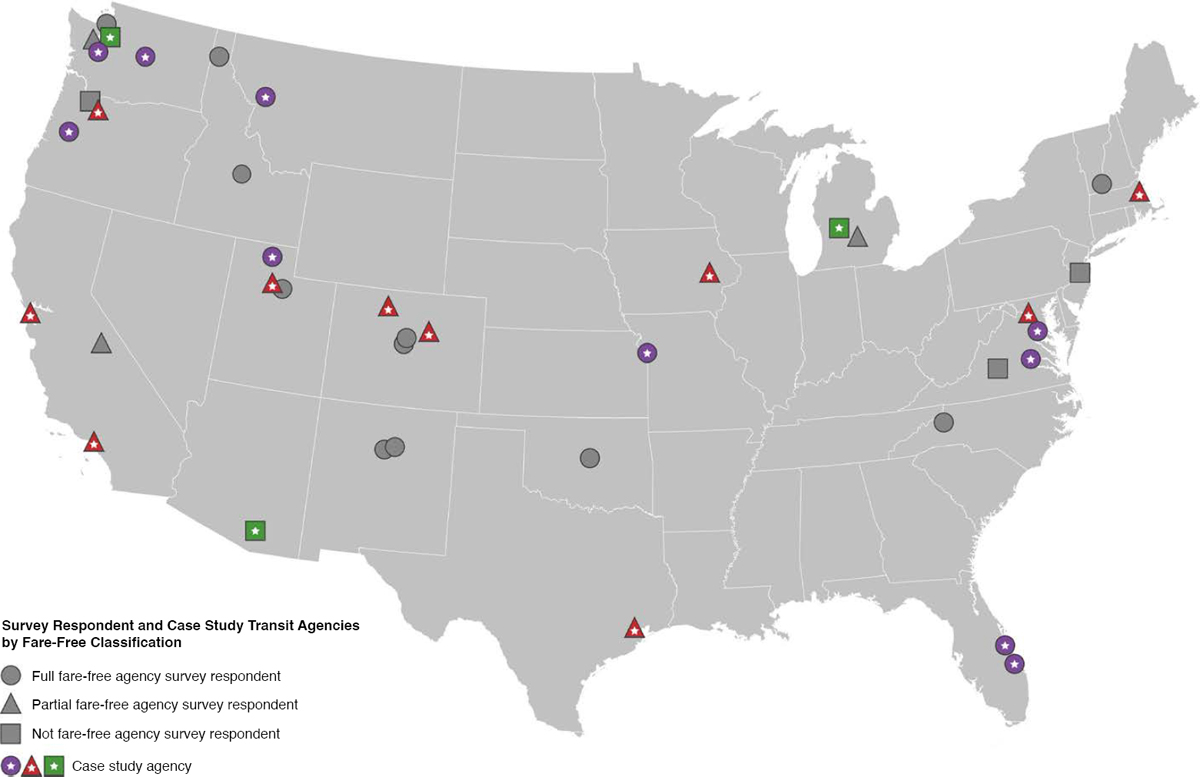
Exhibit 4-1 lists all transit agency case studies, their service areas, and their agency types. Exhibit 4-2 shows a map of the case study transit agencies by their fare-free transit type. Additional details on each transit agency’s categorization can be found in Appendix A.
Full Fare-Free Transit Agencies
Area Regional Transit
| Agency Statistics (2019) |  |
|
| Agency Type: | Small urban/rural | |
| Urban Area Poverty Rate: | 9% | |
| Service Area: | St. Lucie County, FL | |
| Service Area Population: | 0.3 million | |
| Service Area Size: | 572 sq. miles | |
| Passenger Trips: | 0.8 million | |
| Operating Expense: | $6.0 million | |
| Farebox Recovery: | 0%* | |
*Data provided by Area Regional Transit

Fare-Free Context
- Fare-free transit service began as a pilot program for students only in 2015.
- The pilot was expanded to all riders in 2017 with support from the Board of County Commissioners and FDOT.
- A 2020 study was conducted by FDOT on ridership, service, and fiscal impacts that recommended a 2-year extension of the program to be followed by reevaluation.

Fare-Free Policy Goals
- Attract ridership.
- Make transit more accessible for all county residents by reducing the financial burden of travel.
- Improve regional environmental justice.

Evaluation
- A technical memorandum produced after the 3-year pilot included
- Data on service, finances, and ridership.
- Analysis of changes in ridership patterns.
- Surveys of operators, transit riders, and the public.
- The transit agency also conducted a literature review to understand findings in a broader context.

Outcomes
- Ridership increased 140% in the first year.
- Productivity, or boardings per revenue hour, doubled within the first year.
- Subsidy per passenger boarding decreased from $10 to $5.
- A slight decrease in operating speed occurred after the removal of fares, likely due to the increase in boardings.
- Vehicle cleaning costs increased by 25% due to increased wear and tear.
- No negative safety impacts have been reported.
- Ridership increased among people with low incomes, retired people, and older people with higher incomes.

Program Funding
- FDOT provided funding for the 3-year pilot project and the county budget covered the additional cost when the pilot was extended.
- Higher ridership has resulted in a 48% increase in the county’s FDOT state block grant allocation over the past 4 years of fare-free transit.
Cache Valley Transit District
| Agency Statistics (2019) |  |
|
| Agency Type: | Small urban/rural | |
| Urban Area Poverty Rate: | 17% | |
| Service Area: | Cache Valley, UT | |
| Service Area Population: | 0.1 million | |
| Service Area Size: | 33 sq. miles | |
| Passenger Trips: | 1.4 million | |
| Operating Expense: | $6.2 million | |
| Farebox Recovery: | 0% | |
Fare-Free Context
- CVTD started operating service as zero-fare in 1992.
- Staff describe the system as “zero-fare” instead of fare-free to emphasize that no one is getting anything for “free,” but rather that transit is a public service being paid for with taxes.
- The transit agency board continues to push staff to operate zero-fare service. The board believes that growth and expansion continue with local sales tax growth and not with fares.
Fare-Free Policy Goals
- Encourage the public to use public transit.
- Simplify management of the transit system by avoiding the additional administrative burden of fare collection.
- Make transit accessible for everyone.
- Contribute to a strong local economy by allowing users to have more disposable income to use in the local economy.
Evaluation
- CVTD uses voter surveys to gauge rider and non-rider support for many aspects of the transit system, including the zero-fare program.
- The transit agency evaluates its zero-fare policy every 5 years and looks at the qualitative and quantitative impacts of charging fares. These evaluations find that charging fares would be expensive and significantly decrease ridership.
Outcomes
- The community has become more supportive over the years as marketing and messaging has improved, and the zero-fare policy is currently very popular with the public and the board. The 2019 survey found that 97% of riders and 68% of non-riders support the zero-fare system.
- There have not been serious problems with disruptive passengers, and CVTD works with civilian transit staff and homeless service providers for most issues that arise.
- CVTD has a conduct policy that aims to keep the public safe, encourage usage, and focus on correcting behavior.
Program Funding
- The system is operated with revenue from an existing sales tax.
Corvallis Transit System
| Agency Statistics (2019) |  |
|
| Agency Type: | University community | |
| Urban Area Poverty Rate: | 21% | |
| Service Area: | Corvallis, OR | |
| Service Area Population: | <0.1 million | |
| Service Area Size: | 14 sq. miles | |
| Passenger Trips: | 1 million | |
| Operating Expense: | $3 million | |
| Farebox Recovery: | 0% | |
Fare-Free Context
- Staff championed the concept, and the program was passed through City Council.
- In anticipation of increased ridership, CTS increased revenue hours by 5% and consolidated some bus stops.
- A policy requiring riders to have destinations when boarding the bus was added to the Code of Conduct.
Fare-Free Policy Goals
- Improve the environmental impact of local transportation by encouraging transit ridership.
- Expand access to transit for everyone.
Evaluation
- CTS did not establish specific goals or objectives that could be measured before implementing fare-free transit.
- The success of the program is measured quantitatively through ridership and qualitatively through informal community feedback.
Outcomes
- The transit agency saw a 39% increase in ridership in the first year, particularly among individuals with low incomes and people experiencing homelessness.
- At first, CTS experienced deterioration of on-time performance due to higher ridership, but then adjusted route times to allow for more time.
- The transit agency saw a slight uptick in negative on-board behavior affecting operators and other passengers, but operators are happy to not monitor the fare collection.
- The community is very supportive of fare-free transit service, and it is an integral part of the City of Corvallis community.
Program Funding
- Farebox revenue was replaced with a Transit Operations Fee, collected from all individuals and businesses through their utility services monthly bill.
DASH
| Agency Statistics (2019) |  |
|
| Agency Type: | Urban local | |
| Urban Area Poverty Rate: | 8% | |
| Service Area: | Alexand ria, V A | |
| Service Area Population: | 0.2 million | |
| Service Area Size: | 16 sq. miles | |
| Passenger Trips: | 3.8 million | |
| Operating Expense: | $21.7 million | |
| Farebox Recovery: | 21% | |
Fare-Free Context
- DASH was temporarily fare-free at the onset of the COVID-19 pandemic and resumed fare collection in the spring of 2021.
- Full zero-fare service was launched in conjunction with the launch of the first phase of the long-term network redesign in September 2021.
Fare-Free Policy Goals
- Bring back ridership lost during the pandemic and promote usage of the new network.
- Help achieve the city’s environmental goals.
- Provide financial relief for all riders with low incomes without an application and income validation process that would act as a barrier to potential beneficiaries.
Evaluation
- A fare study was completed during the pandemic that evaluated full zero-fare service, zero-fare for residents with low incomes, and half-price fares for residents with low incomes. Evaluation criteria included cost per benefiting rider, administrative costs, equity benefits, and ridership impacts.
- The transit agency selected a full zero-fare scenario based on the estimated costs and benefits.
- DASH is conducting several customer surveys in the first 12 months following implementation to gauge the impact of the new network and free fares. These surveys will attempt to quantify new riders vs. existing riders who ride more often.
- In the fare study, DASH identified 17 key performance metrics linked to qualitative and quantitative fare-free transit goals. These metrics will be used to evaluate the costs and benefits of the zero-fare program.
Outcomes
- DASH thinks it will be difficult to isolate the impact of zero-fare ridership due to the pandemic recovery and the network redesign.
- Non-ridership impacts are also difficult to isolate due to the loss of precise fare media data.
- The transit agency’s ridership recovery has significantly outpaced peer agencies in the Washington, DC, region.
- The transit agency estimated that upgrading its fareboxes would cost an estimated $3 to $4 million.
Program Funding
- The Alexandria City Council approved an additional $1.7 million annual operating subsidy for FY2022.
- The City of Alexandria was awarded $7.2 million over 3 years through the Virginia Department of Rail and Public Transportation’s (DRPT’s) Transit Ridership Incentive Program (TRIP) grant program that provides funding for initiatives that encourage transit ridership.
- Due to the reduced ridership from the pandemic, the ridership increase will likely not be high enough to require additional service, lowering early costs.
GoLine
| Agency Statistics (2019) |  |
|
| Agency Type: | Small urban/rural | |
| Urban Area Poverty Rate: | 11% | |
| Service Area: | Indian River County, FL | |
| Service Area Population: | 0.2 million | |
| Service Area Size: | 216 sq. miles | |
| Passenger Trips: | 1.3 million | |
| Operating Expense: | $4.1 million | |
| Farebox Recovery: | 0% | |
Fare-Free Context
- GoLine has been fare-free since the service began in 1995.
Fare-Free Policy Goals
- Make service more attractive to grant providers by increasing ridership.
- Improve operational efficiency and reduce administrative costs incurred by collecting fares.
Evaluation
- As the system has always been fare-free, it is difficult to evaluate what is attributable to the lack of fares.
Outcomes
- Indian River Transit is ranked as the most efficient transit agency in Florida, with the highest number of riders per local dollar of investment. Many of the cost savings come from not having to collect fares.
- The community is very supportive of fare-free transit. Community leaders and businesses are outspoken on the value of transportation in the community.
Program Funding
- GoLine is funded through FTA grants, state block grants, and local matches from the county government.
Greater Richmond Transit Company
| Agency Statistics (2019) |  |
|
| Agency Type: | Urban local | |
| Urban Area Poverty Rate: | 11% | |
| Service Area: | Greater Richmond, VA | |
| Service Area Population: | 0.5 million | |
| Service Area Size: | 227 sq. miles | |
| Passenger Trips: | 9.3 million | |
| Operating Expense: | $55 million | |
| Farebox Recovery: | 20% | |
Fare-Free Context
- Starting in 2019, GRTC began exploring potential changes to the fare structure that could benefit riders with low incomes.
- The transit agency suspended fares in March 2020 in response to the COVID-19 pandemic and has extended the policy twice.
- The Virginia DRPT TRIP provides matched state funding grants for programs that aim to increase transit ridership, such as zero-fare service.
Fare-Free Policy Goals
- End the regressive nature of fare collection, especially because the majority of GRTC riders earn less than the federal poverty rate and are people of color.
- Rebound from pandemic ridership loss and use higher ridership to open up new funding opportunities.
Evaluation
- During the pilot program, GRTC plans to analyze the operational, social, and economic impact of zero-fare.
- The continued extension of the program is contingent upon funding and GRTC board approval.
Outcomes
- Ridership for local GRTC routes has reached pre-COVID levels as of Spring 2022, but direct outcomes are difficult to gauge.
Program Funding
- Initially, GRTC filled the foregone revenue gap with federal COVID-19 relief money.
- GRTC received $8 million in grant money through DRPT TRIP, which requires a local funding match. Both the City of Richmond and Virginia Commonwealth University have pledged support.
- GRTC has identified funding partnerships through June 2023 and is exploring opportunities for continued business and institutional partnerships through the life of the program and beyond.
Intercity Transit
| Agency Statistics (2019) |  |
|
| Agency Type: | Small urban/rural | |
| Urban Area Poverty Rate: | 10% | |
| Service Area: | Thurston County, WA | |
| Service Area Population: | 0.2 million | |
| Service Area Size: | 101 sq. miles | |
| Passenger Trips: | 4.7 million | |
| Operating Expense: | $44.6 million | |
| Farebox Recovery: | 9% | |
Fare-Free Context
- Intercity Transit launched the 5-year zero-fare demonstration project in January 2020.
- The idea of zero-fare service came from a public engagement process about the future of public transit.
- The transit agency completed a financial and operational feasibility review before implementing the pilot.
Fare-Free Policy Goals
- Improve the environmental impact of local transportation by encouraging transit ridership and decreasing car trips.
- Increase access to transit for everyone.
- Improve operational efficiency and reduce administrative costs incurred by collecting fares.
Evaluation
- Evaluation of the pilot is difficult because the program started 2 months before travel restrictions and reduced transit demand due to the COVID-19 pandemic in March 2020.
- No specific goals were established to evaluate the pilot.
- Rider and operator surveys are planned but on pause due to the pandemic (as of October 2021).
Outcomes
- Outcomes are difficult to measure, as the COVID-19 pandemic significantly impacted ridership before significant data could be collected.
- In the first 2 months of the program, the transit agency saw a 29% month-over-month increase in ridership over 2019 ridership.
- Operators experienced faster bus operating times.
Program Funding
- Farebox revenue was not replaced as part of the project, as the estimated savings was higher than the estimated cost.
- Sales tax revenues for transit increased in 2018 due to an unrelated ballot measure.
Kansas City Area Transportation Authority
| Agency Statistics (2019) |  |
|
| Agency Type: | Mid-sized regional | |
| Urban Area Poverty Rate: | 12% | |
| Service Area: | Greater Kansas City, MO | |
| Service Area Population: | 0.8 million | |
| Service Area Size: | 456 sq. miles | |
| Passenger Trips: | 12.4 million | |
| Operating Expense: | $100.4 million | |
| Farebox Recovery: | 9% | |
Fare-Free Context
- The downtown streetcar opened in 2016 as zero-fare, which raised equity concerns over the demographic differences between streetcar and bus riders.
- KCATA buses are currently zero-fare through 2023.
- Non-ADA, on-demand service and certain microtransit services are still collecting fares.
- The decision to go fare-free was made before the COVID-19 pandemic, but the implementation date was moved from the summer of 2020 to March 2020.
Fare-Free Policy Goals
- Provide economic benefits to customers, in particular riders with low incomes.
- Improve mobility and access to transit.
- Reverse ridership decline and increase operating efficiency.
- Reduce fare disputes.
Evaluation
- The Mid-America Regional Council’s Transit Zero Fare Impact Analysis (Mid-America Regional Council, n.d.) on the zero-fare program found that equity benefits will vary depending on how zero-fare service is funded in the future.
- KCATA obtained federal funding to study the post-implementation health outcomes and impacts of zero-fare service and hopes to use these results to bring on healthcare funding partners.
- Rider surveys and stakeholder interviews were conducted on experiences so far as well as concerns and desires about the future of transit and fares.
Outcomes
- Ridership and on-time performance statistics were collected, but due to impacts of the pandemic, the influence of zero-fare service is unclear.
- Ridership decreased less and rebounded more quickly than for peer agencies that continued collecting fares.
- Rider surveys showed support for the program, with some concerns from community leaders on the opportunity cost of lost fare revenue.
- Security incidents per 100,000 riders declined by 17% between 2019 and 2020.
Program Funding
- Federal COVID relief funding will cover revenue loss through 2023.
- Blue Cross and Blue Shield of Kansas City signed on as an early funding partner with a cost-sharing agreement, but the partnership is on hold due to the existence of CARES Act funding.
- KCATA faces unique funding challenges due to the shared financial model between multiple Missouri and Kansas municipalities.
Link Transit
| Agency Statistics (2019) |  |
|
| Agency Type: | Small urban/rural | |
| Urban Area Poverty Rate: | 13% | |
| Service Area: | Chelan and Douglas Counties, WA | |
| Service Area Population: | 0.1 million | |
| Service Area Size: | 197 sq. miles | |
| Passenger Trips: | 1 million | |
| Operating Expense: | $15 million | |
| Farebox Recovery: | 4% | |
Fare-Free Context
- Fare-free service was initiated as an emergency declaration in the spring of 2020 to improve operator safety and reduce viral transmission.
- This emergency declaration was extended into a 1-year, fare-free pilot in July 2021 and will be reevaluated before a potential extension.
- Before the fare-free pilot, Link Transit operated four fare-free shuttle routes within Wenatchee, East Wenatchee, and Leavenworth.
Fare-Free Policy Goals
- Attract ridership.
- Improve operational efficiency.
- Reduce administrative costs incurred by collecting fares.
Evaluation
- A fare study was completed during the pandemic, including a feasibility evaluation of fare-free transit service.
- Evaluation criteria included ridership and productivity impacts, increased operating costs, foregone farebox revenue, and on-time performance improvements.
- The results of the evaluation included an anticipated net increase in operating costs between $1.0 and $1.2 million, primarily related to increased demand for paratransit service.
- The transit agency plans to evaluate the policy for effectiveness; potential operational aspects to consider include ridership, demand for paratransit service, and passenger conflicts.
Outcomes
- In January 2022, fixed-route ridership was at about 70% of pre-pandemic levels, while paratransit ridership had returned to pre-pandemic levels. Ridership loss was expected to be more significant had the transit agency not implemented fare-free service.
- Initially, fare-free transit service was not highly marketed as passengers were told to limit transit usage to essential trips only. As the pandemic recovery continues, Link Transit plans to increase advertisements for fare-free service.
Program Funding
- The increased ridership anticipated by providing fare-free transit service is expected to qualify Link Transit for approximately $275,000 in additional funding from the STIC funding program.
- As of January 2022, there has been little to no impact on the transit agency budget thus far in the pilot. Much of the foregone farebox revenue was negated by the cost of managing the funds and additional funding sources have not been necessary.
Mountain Line
| Agency Statistics (2019) |  |
|
| Agency Type: | University community | |
| Urban Area Poverty Rate: | 13% | |
| Service Area: | Missoula, MT | |
| Service Area Population: | 0.1 million | |
| Service Area Size: | 70 sq. miles | |
| Passenger Trips: | 1.6 million | |
| Operating Expense: | $6.7 million | |
| Farebox Recovery: | 0% | |
Fare-Free Context
- Full fare-free transit was spearheaded by the city mayor starting in 2013.
- The mayor and transit agency board worked to create a fare-free pilot program, which was launched in 2015.
Fare-Free Policy Goals
- Attract ridership.
- Improve operational efficiency and reduce administrative costs incurred by collecting fares.
- Improve the environmental impact of local transportation by encouraging transit ridership.
- Make transit access more equitable by reducing the financial burden of travel.
- Frame transit as a public service.
Evaluation
- The transit agency had no specific quantitative evaluation criteria for the feasibility of the program other than evaluating financial health to ensure the program was sustainable.
- Mountain Line conducted a rider survey in the second year of the program and found that almost half of respondents were riding more frequently after the removal of fares.
- The transit agency also polled the public about transit in advance of an election, and the zero-fare program was rated as one of the most popular programs and a point of community pride.
Outcomes
- The transit agency saw a 70% increase in ridership over 3 years, which was much higher than expected.
- The ridership increase included riders who would have otherwise taken a car instead of a transit trip.
- Funding has been the largest ongoing challenge.
- Community advocates have reported that fare-free transit has been integral in increasing access to community services.
Program Funding
- The initial pilot program was funded through financial partnerships with area hospitals, local businesses, and the city and county.
- The success of the program has allowed the Mountain Line to obtain significant grant money due to increasing ridership, proven community support, and efficient operations.
- To ensure the longevity of free fares, the transit agency brought in the community as “partners” by including funding for free fares in a tax levy in the 2020 election. The levy passed overwhelmingly and will support service expansion and provide financial stability.
Partial Fare-Free Transit Agencies
Denver Regional Transportation District
| Agency Statistics (2019) |  |
|
| Agency Type: | Large urban regional | |
| Urban Area Poverty Rate: | 8% | |
| Service Area: | Greater Denver, CO | |
| Service Area Population*: | 3.1 million | |
| Service Area Size: | 2,342 sq. miles | |
| Passenger Trips*: | 105.8 million | |
| Operating Expense: | $644.4 million | |
| Farebox Recovery: | 24% | |
*Data provided by RTD

Fare-Free Context
- The transit agency has two fare-free routes in the Central Business District that have always been free.
- Children, active-duty military, law enforcement, RTD employees and dependents, RTD contractors, retirees, board members, and ADA-paratransit-approved riders and their aides currently can ride RTD for free.
- RTD is currently embarking on a comprehensive fare study and equity analysis, which may include an examination of fare-free transit alternatives.

Fare-Free Policy Goals
- Increase efficiency of transit with faster service and all-door boarding.

Evaluation
- RTD did not evaluate the current fare-free programs before or after implementation.
- The upcoming fare study will likely evaluate aspects of these programs.

Outcomes
- Free Mall Ride experienced high ridership, with approximately 10 million rides in 2019.
- Free Metro Ride was popular with downtown commuters but was suspended due to the COVID-19 pandemic.

Program Funding
- Per Colorado state statute, Denver RTD must have a balanced budget.
- Fare-free for specific passenger groups has been in place since the earliest days of RTD, and that foregone fare revenue was not directly replaced.
- Free Mall Ride and Free Metro Ride have been fare-free since their launch and were not budgeted to require fares. Passengers often transfer to or from other RTD services and pay a fare then.
Houston METRO
| Agency Statistics (2019) |  |
|
| Agency Type: | Large urban regional | |
| Urban Area Poverty Rate: | 14% | |
| Service Area: | Greater Houston, TX | |
| Service Area Population: | 3.8 million | |
| Service Area Size:* | 1,300 sq. miles | |
| Passenger Trips: | 90 million | |
| Operating Expense: | $574 million | |
| Farebox Recovery: | 11% | |
*Data provided by METRO
Fare-Free Context
- Older adults, paratransit-eligible riders, qualified riders with disabilities or decorated veterans, children under six, jurors, and METRO employees and their spouses ride free.
- METRO conducted a study in late 2019 to early 2020 on fare-free transit alternatives.
Fare-Free Policy Goals
- Attract ridership.
- Encourage paratransit riders to use fixed-route service when possible by removing the financial barrier for paratransit-eligible riders.
Evaluation
- METRO evaluated a variety of fare-free transit service alternatives including fare-free on all or some services, fare-free for students, and fare-free during off-peak hours.
- No ridership surveys or outreach were conducted as part of the fare-free study.
- The study did not evaluate any potential equity or social outcomes, but staff believe the inclusion of these factors would have been useful in their evaluation framework.
- Without public or political pressure, the transit agency’s decision was based on the financial and logistical results of the study.
Outcomes
- The evaluation found that free fares would result in significant fixed-route and paratransit ridership increases.
- METRO estimated that the additional ridership would result in the need for hundreds of new operators and buses, additional administrative capacity, and a new bus facility, which would together cost over $100 million in capital costs alone.
- Budget and administrative constraints would make it very difficult to add additional service of the magnitude required.
- As a result of the study, METRO decided not to implement full fare-free transit.
Program Funding
- No funding sources were considered once the costs were calculated.
Iowa City Transit
| Agency Statistics (2019) |  |
|
| Agency Type: | University community | |
| Urban Area Poverty Rate: | 20% | |
| Service Area: | Iowa City, IA | |
| Service Area Population: | <0.1 million | |
| Service Area Size: | 25 sq. miles | |
| Passenger Trips: | 1.6 million | |
| Operating Expense: | $7.6 million | |
| Farebox Recovery: | 19% | |
Fare-Free Context
- Since June 2021, ICT has extended fare-free transit to persons with disabilities, older adults, Medicare card holders, and paratransit card holders. Previously those groups could ride free during off-peak hours only. Children under the age of 5 can also ride free.
- Partial fare-free transit was implemented alongside lower fares for all riders and a network redesign.
- After a comprehensive fare study that included a fare-free analysis, the Iowa City Council chose not to pursue full fare-free transit due to funding constraints.
- ICT connects with a campus shuttle service that is fare-free for all.
Fare-Free Policy Goals
- Increase ridership while balancing revenue goals.
- Improve passenger experience.
- Streamline fare structure and policies.
- Make transit an affordable option.
Evaluation
- The Iowa City Area Transit Study, a comprehensive review of both ICT and neighboring Coralville Transit fares and services, was finalized in February 2020 and included a fare-free analysis.
- The study estimated the ridership increase could result in an annual operating cost increase of between $1.3 and $1.4 million for fixed-route and $745,000 and $872,000 for paratransit.
Outcomes
- Outcomes of the new partial fare-free program are difficult to gauge due to its recent implementation, simultaneous network changes, and the COVID-19 pandemic.
Program Funding
- The combination of reducing fares and partial fare-free transit is estimated to cost the transit agency $50,000 in fare revenue.
- No new funding source was secured to support the changes, and the reduction in farebox recovery was factored into the transit agency’s yearly budget.
Los Angeles Metro
| Agency Statistics (2019) |  |
|
| Agency Type: | Large urban regional | |
| Urban Area Poverty Rate: | 13% | |
| Service Area: | Los Angeles County, CA | |
| Service Area Population: | 8.6 million | |
| Service Area Size: | 1,500 sq. miles | |
| Passenger Trips: | 380 million | |
| Operating Expense: | $1.9 billion | |
| Farebox Recovery: | 15% | |
Fare-Free Context
- LA Metro launched its Fareless System Initiative Task Force in 2020 to study and identify facts, challenges, and opportunities related to eliminating fares on LA Metro buses and trains.
- The transit agency launched a phased 2-year pilot program in 2021, which began with free fares for K-12 and community college students in districts participating in cost-sharing partnerships.
- The goal of the pilot is to identify challenges and offer recommendations on how to best implement long-term, fare-free transit for students and potentially expand to include additional groups of riders in the future, including riders with low incomes.
- The transit agency’s board of directors will decide how to proceed after an evaluation of the pilot.
Fare-Free Policy Goals
- Attract ridership.
- Make transit access more equitable by reducing the financial burden of travel for underresourced communities.
- Improve operational efficiency and reduce administrative costs incurred by collecting fares.
- Reduce emissions from local transportation by encouraging transit ridership.
- Increase operator safety by minimizing fare collection conflicts.
Evaluation
- The transit agency is the largest by far to test fare-free transit, and the pilot evaluation will collect significant data and feedback.
- A study to assess ridership increases, benefits, and costs will supplement the pilot.
- The evaluation framework and metrics will include equity, finances, safety and security, rider experience, and operational capacity.
Outcomes
- In the first 4 months, LA Metro distributed over half a million student transit passes. The highest level of student ridership previously was 90,000 students following the launch of the Los Angeles Department of Transportation’s free DASH to Class Program in the fall of 2019.
- Additional outcomes will be identified as the pilot program continues.
Program Funding
- Funding for fare-free transit will come from multiple sources, including potentially the California Cap and Trade funds for the Low Carbon Transit Operations Program.
- LA Metro has implemented cost-sharing with schools and partner transit agencies and is continuing to seek federal funding.
Massachusetts Bay Transportation Authority
| Agency Statistics (2019) |  |
|
| Agency Type: | Large urban regional | |
| Urban Area Poverty Rate: | 9% | |
| Service Area: | Greater Boston, MA | |
| Service Area Population: | 3.1 million | |
| Service Area Size: | 3,244 sq. miles | |
| Passenger Trips: | 366.7 million | |
| Operating Expense: | $1.5 billion | |
| Farebox Recovery: | 44% | |
Fare-Free Context
- To support riders during the COVID-19 pandemic, MBTA piloted fare-free transit on one bus route between August 2021 and February 2022.
- The city council approved the expenditure of funds to support expanding fare-free service to a total of three routes for a 2-year period.
- Fare-free transit was a central piece of the mayor’s election campaign, and there is a strong desire to expand to other, similar bus routes within the City of Boston.
- Fare price and farebox recovery are lower for buses than for the other modes operated by the MBTA.
Fare-Free Policy Goals
- Economic development along a major corridor.
- Affordable and equitable transportation.
- Making transit more reliable through decreased boarding times from all-door boarding.
Evaluation
- To evaluate the pilot program, the MBTA and the City of Boston will analyze ridership, service impacts, trip times, rider experience, economic impact for riders, and rider equity.
- The City of Boston and the MBTA conducted both a pre-pilot and mid-pilot survey and will evaluate additional performance measures, including the percentage of riders who are transit-dependent, the percentage of riders saving money as a result of the pilot, the number of new riders, and on-time performance.
Outcomes
- Ridership increased substantially.
- Dwell times decreased by about 20%.
- Negative impacts on travel times were minimal.
- Riders like the easier boarding process.
- 20% of riders saved more than 20% a month.
- The majority of riders were “transit-critical.”
Program Funding
- The one-route pilot was paid for by the City of Boston through $500,000 from federal COVID-19 relief funds.
- To continue the pilot and eliminate fares on two more routes, the city council approved $8 million in federal funds in December 2021.
Ride On
| Agency Statistics (2019) |  |
|
| Agency Type: | Urban local | |
| Urban Area Poverty Rate: | 8% | |
| Service Area: | Montgomery County, MD | |
| Service Area Population: | 1 million | |
| Service Area Size: | 495 sq. miles | |
| Passenger Trips: | 20.6 million | |
| Operating Expense: | $124.6 million | |
| Farebox Recovery: | 16% | |
Fare-Free Context
- Before the COVID-19 pandemic, fare-free transit existed for older adults and students through high school.
- Ride On suspended fares at the beginning of the COVID-19 pandemic in March 2020. The policy was extended through July 2022.
- Based on interest expressed by the Montgomery County Executive and County Council members, MCDOT undertook an examination of long-term, fare-free, and reduced-fare options.
Fare-Free Policy Goals
- Increase equity through minimizing financial burdens and increasing access to the transportation system.
- Increase ridership.
- Improve customer experience.
- Improve transit operations and performance.
- Shift riders onto transit from less sustainable modes of transportation.
Evaluation
- MCDOT conducted a fare equity study in 2021 to evaluate zero-fare and reduced-fare options, focusing on four areas of analysis: equity, fiscal impacts, ridership, and fare program administration.
- The fare study final recommendation to the County Council was to return to fare collection at a reduced price while retaining the partial fare-free programs from before the COVID-19 pandemic.
- MCDOT conducted rider and public outreach as part of the study.
Outcomes
- Ridership changes due to the COVID-19 pandemic have made gauging the outcomes of fare-free service difficult.
Program Funding
- Federal COVID-19 relief funding replaced fare revenues for the short term.
San Francisco Muni
| Agency Statistics (2019) |  |
|
| Agency Type: | Urban local | |
| Urban Area Poverty Rate: | 9% | |
| Service Area: | San Francisco, CA | |
| Service Area Population: | 0.9 million | |
| Service Area Size: | 49 sq. miles | |
| Passenger Trips: | 223 million | |
| Operating Expense: | $856 million | |
| Farebox Recovery: | 23% | |
Fare-Free Context
- Muni provides free fares for youth, people with disabilities, older people with low incomes, and certain students.
- In October 2020, the transit agency launched a program to provide free fares for people experiencing homelessness who are receiving assistance from the city’s Homelessness Service and Housing Department.
- The transit agency also participates in the Bay Area’s Metropolitan Transportation Commission (MTC) Clipper START pilot program and provides half-fares to eligible riders with low incomes that are not eligible for the fare-free programs.
Fare-Free Policy Goals
- Promote affordability.
- Provide service to students traveling to and from school and extracurricular activities.
- Legitimize the rides of the population that was already riding but unable to pay and take away the fear of fare evasion citations.
Evaluation
- No official review was conducted for the 2013 programs.
- Muni has conducted ridership surveys with the school district but has been unable to reach the entire population.
- The Bay Area’s MTC is evaluating the Clipper START program that focuses on six outcomes: awareness and marketing, customer experience, financial viability, administrative feasibility, affordability, and access and mobility.
Outcomes
- No change in ridership or associated challenges such as longer wait times or increased crowding.
- Fewer issues in addressing individuals not paying their fare.
- Community and operators support the programs.
Program Funding
- Funding for the various fare-free programs comes from general funds and a one-time, 16-month grant from Google for the youth program.
Sandy Area Metro
| Agency Statistics (2019) |  |
|
| Agency Type: | Small urban/rural | |
| Urban Area Poverty Rate: | Not available | |
| Service Area: | Greater Sandy, OR | |
| Service Area Population: | Not available | |
| Service Area Size: | Not available | |
| Passenger Trips: | 123,000 | |
| Operating Expense: | $1.4 million | |
| Farebox Recovery: | 6% | |
Fare-Free Context
- Sandy Area Metro did not charge fares from its inception in 2000 until 2013.
- In 2013, a $1 fare was implemented in response to both declining revenues and a desire from elected officials, businesses, and the public to address people experiencing homelessness riding the bus. As a result, ridership plummeted.
- After 3 years of charging a fare, Sandy Area Metro eliminated local fares while retaining a $1 fare for out-of-town routes.
- Surveys and public meetings were conducted during the years that fares were implemented to guide the policy and process.
Fare-Free Policy Goals
- Support local businesses by making it easier and less expensive to travel for goods and services.
- Attract ridership.
- Improve operational efficiency and reduce administrative costs incurred by collecting fares.
Evaluation
- No official evaluation was undertaken after the introduction of fares or after the removal of the in-town fares, but passenger trip data showed a clear impact on ridership.
- Public surveys and meetings provided feedback on the fare structure.
Outcomes
- After introducing the $1 fare, ridership overall fell dramatically, and short trips dropped off almost completely.
- The community is currently very supportive of local fare-free transit.
Program Funding
- Payroll taxes are a key component of the funding structure; due to the collection of the payroll tax, some local businesses did not support a fare-free service.
- In 2019, approximately 35% of grant funding for Sandy Area Metro came from the federal government, with support from state and local government as well. The out-of-town fares are not a significant source of revenue.
Steamboat Springs Transit
| Agency Statistics (2019) |  |
|
| Agency Type: | Resort community | |
| Urban Area Poverty Rate:* | 12.2% | |
| Service Area: | Steamboat Springs, CO | |
| Service Area Population:* | <0.1 million | |
| Service Area Size: | Not available | |
| Passenger Trips: | 1.1 million | |
| Operating Expense: | $3.6 million | |
| Farebox Recovery: | 4% | |
*Data provided by Steamboat Springs Transit
Fare-Free Context
- The transit agency started with seasonal fare-free transit, expanded to fare-free for city residents, and then expanded further to fare-free for all riders on local service.
- The transit agency found that fare-free for city residents did not result in improvements in boarding times, operational savings, or ridership. Difficulty in validating local residency made fraud common.
Fare-Free Policy Goals
- Improve financial and operational efficiency by reducing boarding times and removing fare collection costs.
- Attract ridership.
- Make the system more competitive by aligning with the fare-free policies of transit agencies in similar resort communities.
Evaluation
- The transit agency adjusted its program when it was not reaching program goals.
- Recommendations for other transit agencies include conducting an early and ongoing evaluation, and testing fare-free transit with a soft opening to iron out difficulties.
Outcomes
- The transit agency saw a 30% increase in fixed-route ridership and more than 100% increase in paratransit ridership.
- Passenger loading and unloading times were significantly reduced.
- The operational budget remained similar to what it had been even with dramatic ridership growth.
Program Funding
- Steamboat Springs Transit is funded through the local municipality’s general fund, which is in turn funded through a sales tax.
- The program was initially launched during an economic surge, with promises from the business community to support the program if needed in the future, but that support did not materialize in an economic downturn. A long-term, codified funding strategy from the start would have been helpful.
Utah Transit Authority
| Agency Statistics (2019) |  |
|
| Agency Type: | Large urban regional | |
| Urban Area Poverty Rate: | 9% | |
| Service Area: | Wasatch Front, UT | |
| Service Area Population: | 1.9 million | |
| Service Area Size: | 737 sq. miles | |
| Passenger Trips: | 45 million | |
| Operating Expense: | $311 million | |
| Farebox Recovery: | 16% | |
Fare-Free Context
- Free downtown zone service started in 1985 in advance of the Salt Lake City Winter Olympics.
- A BRT line in Utah County opened with free fares in 2018 to encourage ridership, funded by a 3-year city grant, which was extended for another 3 years in 2021. A second BRT line is set to open in late 2023/early 2024 and will also be fare-free for 3 years to encourage ridership.
- There is political support for fare-free transit from the mayor of Salt Lake City.
- In 2022, the transit agency launched “Free Fare February” to reduce emissions during a season of typically poor air quality and to honor the legacy of the Salt Lake Olympics.
Fare-Free Policy Goals
- Attract ridership.
- Improve air quality by removing cars from the road.
Evaluation
- UTA had not conducted any evaluations or studies of the partial fare-free transit.
- The grant money for fare-free BRT was not contingent on any specific outcomes or metrics.
- The transit agency measured the impacts of “Free Fare February.”
- UTA plans to undergo a regional fare-free transit evaluation later in 2022.
Outcomes
- UTA has received a few complaints from riders about passengers experiencing homelessness and disruptive passengers.
- UTA experienced significant increases in ridership during “Free Fare February.” Feedback on a rider survey indicated that the month had a positive impact on riders including improved affordability, access, mobility, and quality of life.
Program Funding
- The fare-free zone does not have a specific funding source but is built into the transit agency budget.
- Funding for fare-free BRT is provided through a city grant.
- “Free Fare February” was paid for through partnerships, including regional governments and departments, educational institutions, corporations, and other contracts.
Not Fare-Free Transit Agencies
King County Metro
| Agency Statistics (2019) |  |
|
| Agency Type: | Large urban regional | |
| Urban Area Poverty Rate: | 8% | |
| Service Area | King County, WA | |
| Service Area Population: | 2.1 million | |
| Service Area Size: | 2,134 sq. miles | |
| Passenger Trips: | 128.7 million | |
| Operating Expense: | $910.2 million | |
| Farebox Recovery: | 26% | |

Fare-Free Context
- King County Metro is not pursuing fare-free transit due to high farebox recovery and potential impact on service without fare revenue, as well as cohesion with regional partners.
- A reduced fare for residents with incomes at or below 200% of the federal poverty level has existed since 2015 and is valid for travel on King County Metro and Sound Transit services.
- Established in 2020, the fully subsidized annual pass program expands on the existing reduced-fare program and is available for riders who have income thresholds at or below 80% of the federal poverty level and are enrolled in one of six specific state benefit programs.
- The program was developed in response to a 2019–2020 budget request by the King County Council to enhance its income-based fare program for those who could not afford the existing reduced-fare options.

Fare-Free Policy Goals
- Direct fare subsidies toward riders with the greatest need.
- Prioritize the mobility needs of people of color, residents with low incomes, people who speak little or no English, and immigrants and refugees.
- Retain fare revenue and regional cohesion.

Evaluation
- A randomized control trial pilot that informed the subsidized pass program found that the recipients of a fully subsidized pass more than doubled their transit usage as compared to recipients of a partially subsidized pass, but that they would likely not overwhelm the system, as most additional trips occurred during off-peak hours.
- Metro and its research partners are conducting a large-scale impact evaluation of the subsidized pass to inform recommendations for program changes and expansions. Metro will
publish annual reports based on evaluation findings and expects to have data indicating the impact on participants’ mobility, health, and well-being in 2024.

Outcomes
- As of August 2021, 6,000 residents have enrolled and more than 60% identify as Black, Indigenous, or a person of color.

Program Funding
- The pass program was funded through the county budget.
- The Robert Wood Johnson Foundation is providing support for the impact evaluation.
Sun Tran
| Agency Statistics (2019) |  |
|
| Agency Type: | Mid-sized regional | |
| Urban Area Poverty Rate: | 15% | |
| Service Area: | Tucson, AZ | |
| Service Area Population: | 0.8 million | |
| Service Area Size: | 335 sq. miles | |
| Passenger Trips: | 15.7 million | |
| Operating Expense: | $79.5 million | |
| Farebox Recovery: | 17% | |
Fare-Free Context
- Sun Tran suspended fare collection in March 2020 due to COVID-19. Fares are anticipated to return in January 2023.
- Prior to suspending fares, Sun Tran only offered fare-free transit to children and personal care attendants for disabled riders.
- The mayor of the City of Tucson and the city council encouraged the transit agency to evaluate staying fare-free and will have the final decision-making power.
- The transit agency conducted a feasibility evaluation as part of an equitable contactless fare study that estimated the impacts of two fare-free transit alternatives: fare-free transit for all and fare-free transit for riders with low incomes. The latter alternative builds on the transit agency’s existing fare program for people with low incomes that provides half-fares to eligible riders.
Fare-Free Policy Goals
- Make transit access more equitable by reducing the financial burden of travel on riders with low incomes.
- Reduce contact between riders and bus operators.
Evaluation
- The feasibility evaluation focused on the financial, operational, and equity impacts on the transit agency and the community.
- Sun Tran also conducted a rider and community survey on the future of fares to gauge public opinion on many possible fare changes, including staying fare-free.
- A separate bus operator survey was conducted by the transit agency in April 2021 and included questions on fare-free transit.
Outcomes
- During COVID-19 there was an increase in ridership among people experiencing homelessness. This has resulted in the majority of bus operators desiring a return to fare collection, per the survey.
- Additional outcomes of fare-free service are difficult to judge due to pandemic-related ridership changes.
- A public survey showed majority community support for continuing fare-free transit.
- The feasibility evaluation found that existing fixed-route service levels could accommodate additional ridership of up to a 50% increase over pre-pandemic ridership.
- The recommendations from the fare study include a proposed strategy for returning to fares, as well as considerations for long-term, fare-free transit that includes fixed-route and paratransit service needs, replacement revenue and funding, and safety and security costs.
Program Funding
- Current fare-free transit is being sustained through federal relief funding and continuing without fares would require finding a new funding source or receiving a larger budget from the city council.
The Rapid
| Agency Statistics (2019) |  |
|
| Agency Type: | Mid-sized regional | |
| Urban Area Poverty Rate: | 12% | |
| Service Area: | Grand Rapids, MI | |
| Service Area Population: | 0.4 million | |
| Service Area Size: | 155 sq. miles | |
| Passenger Trips: | 10.5 million | |
| Operating Expense: | $48.3 million | |
| Farebox Recovery: | 20% | |
Fare-Free Context
- In partnership with the City of Grand Rapids and Spectrum Health, one route was fare-free from August 2018 to August 2020.
- The downtown segment of a bus rapid transit route was fare-free from September 2016 to August 2020.
- Both programs were discontinued due to the use of the routes as shelter by a high number of people experiencing homelessness and behavioral issues related to public intoxication.
Fare-Free Policy Goals
- Alleviate congestion and parking demand in downtown Grand Rapids.
- Offer additional mobility options for downtown residents, workers, and visitors.
Evaluation
- The Rapid did not conduct an evaluation before or after the implementation of fare-free transit.
- More information on homelessness and addiction within the community, as well as a better understanding of the current support services available, would have been useful in the planning process.
Outcomes
- Increase in ridership, particularly by individuals experiencing homelessness.
- Bus operators faced an increase in disruptive and intoxicated riders.
- Useful in reducing traffic and parking congestion.
Program Funding
- The City of Grand Rapids and Spectrum Health made revenue contributions to help recover costs.


