

APPENDIX A
Transit Agency Survey Methodology and Findings
Methodology
The research team surveyed a sample of U.S. transit agencies to gather various perspectives on the evaluation of fare-free transit. The sample included agencies that are full or partially fare-free, agencies that are considering some form of fare-free transit, and those that are not interested in providing long-term fare-free transit. (Although many transit agencies temporarily implemented fare-free service starting in 2020 due to the COVID-19 pandemic, the research team only focused on transit agencies that had evaluated, piloted, or implemented permanent fare-free service.) The team developed a list of transit agencies based on the knowledge of the research team members, feedback from the project panel, agencies that were surveyed in TCRP Synthesis 101: Implementation and Outcomes of Fare-Free Transit Systems (Volinski 2012), and online research on fare-free transit.
Survey Instrument
The research team developed two survey instruments that asked transit agency staff questions on program initiation, program evaluation, funding, community support and equity, ridership impacts, operational and capital impacts, paratransit impacts, and enforcement and security:
- One survey was for transit agencies that are full or partially fare-free (i.e., do not collect fares from all or some riders)
- The other survey was for transit agencies that are not fare-free (i.e., collect fares from all riders)
The two survey instruments can be seen in Appendix B.
Survey Administration
The project team assembled contact information from relevant contacts at each of the transit agencies based on professional relationships, connections of the project panel, and online research. To confirm the transit agency contacts and fare-free transit status, our team sent initial emails to transit agency staff with the following message:
Hello [contact name],
Nelson\Nygaard has been retained by the Transportation Research Board/Transit Cooperative Research Program (TCRP) to develop a framework for evaluating fare-free public transportation. The research will examine the benefits, costs, and tradeoffs that must be considered by public transit agencies, policymakers, and other stakeholders as they look toward full or partial elimination of fares. As part of this research, we are surveying transit agencies in two categories: (1) agencies that currently provide full
or partial fare-free service and (2) agencies without existing fare-free service. For the purposes of this research, we are defining partial fare-free transit agencies as those that:
- Allow specific groups of riders to use transit services for free based on age, disability, income, student status, or other eligibility criteria
- Provide fare-free service on specific transit routes or transit modes
Your transit agency has been identified as one that [offers fare-free] / [does not currently offer fare-free service]. I am hoping that you or someone at your agency can complete a survey about your agency’s experience. The questions in the survey are designed to get an understanding of the factors that go into evaluation and implementation of fare-free service. If you have the data available, we would appreciate relevant information about ridership, on-time performance, service changes, capital investments, operating costs, fare collection costs, and transit agency revenues as they relate to fare-free transit at your agency. If detailed data is not available, estimates or opinions are sufficient.
If you are not the correct person to fill out the survey, are you able to connect me to the proper contact at your agency? Also, if your agency has been miscategorized, please let us know. Once we have the right contact, we will send out a Word document survey that allows for collaboration between staff members. We will be collecting survey responses through the end of April.
Note: Although many transit agencies temporarily implemented fare-free service starting in 2020 due to the COVID-19 pandemic, our research is only focusing on evaluating permanent fare-free service.
Please let us know if you have any questions.
Once contacts and transit agency classification were confirmed, the project team sent over the survey in Word document format with the following directions:
Hello [contact name],
Thanks for agreeing to take the transit agency survey for the TCRP evaluation of fare-free service research. I am attaching the survey in Word document format that allows for collaboration across staff and an opportunity to provide comments. We estimate that the survey might take you between 30–60 mins to complete. Please return the completed survey to us by responding to this email by April 30, 2021.
A reminder that if you have the data available, we would appreciate relevant information about ridership, on-time performance, service changes, capital investments, operating costs, fare collection costs, and transit agency revenues as they relate to fare-free transit at your agency. If detailed data is not available, estimates or opinions are sufficient.
Thank you and please let us know if you have any questions.
Survey Response
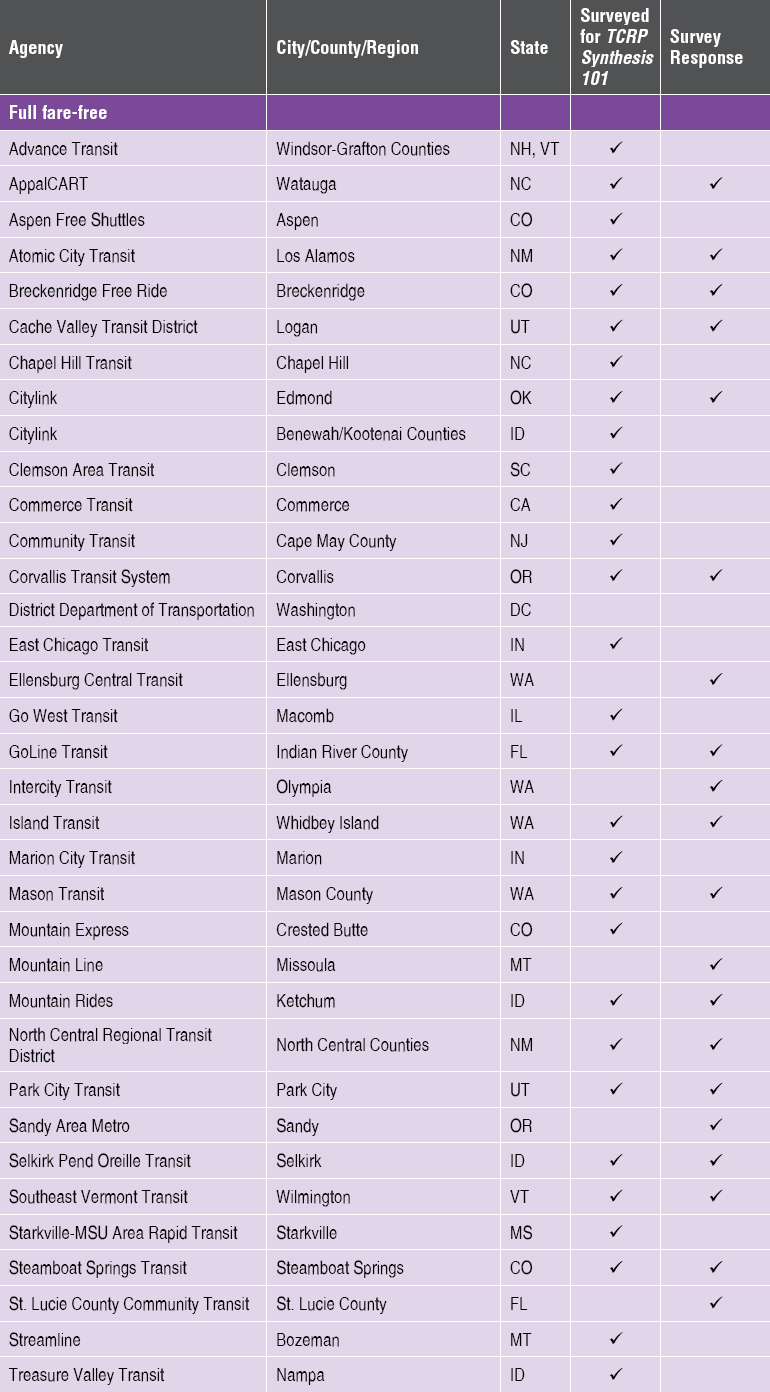
Thirty-five transit agencies and one state transportation agency responded to the project survey. The survey respondents represented transit agencies with various types of fare-free transit:
- Full fare-free, either since the inception of the transit agency or implemented after
-
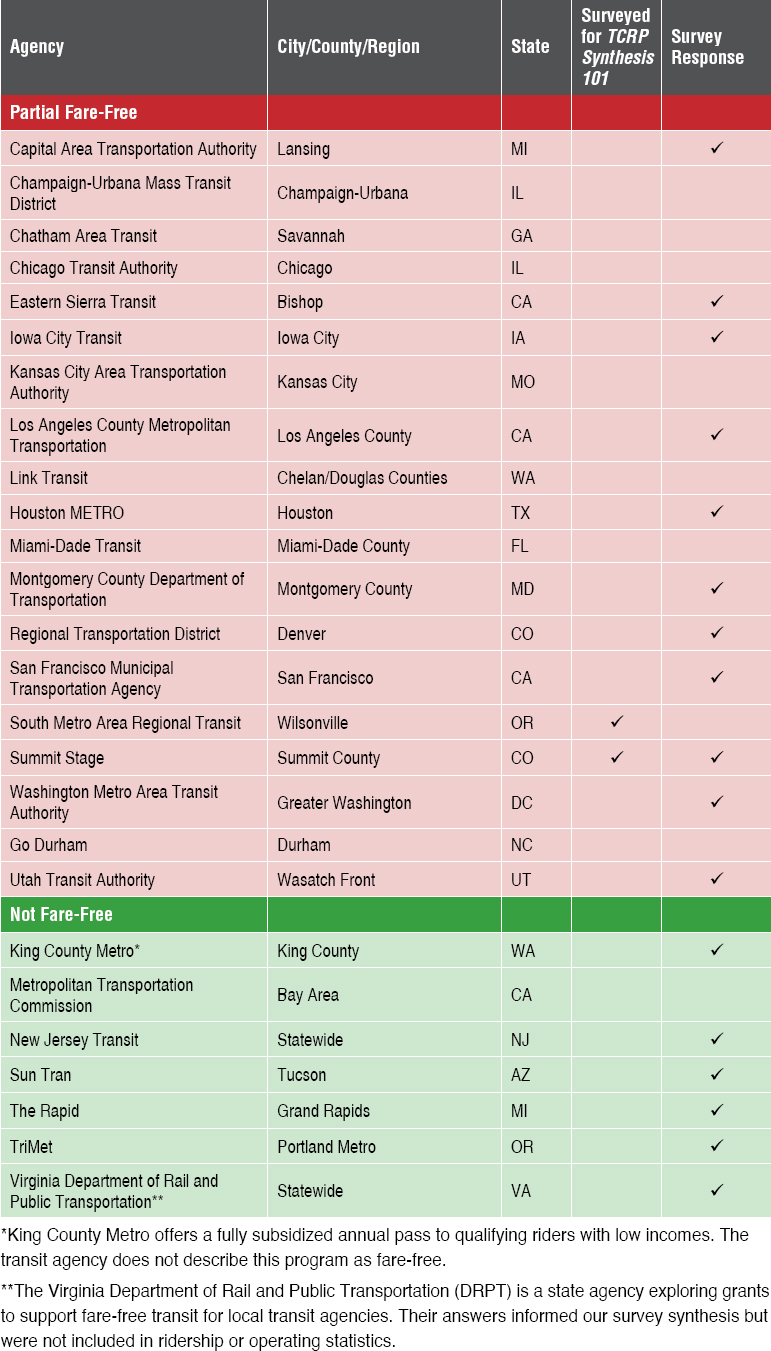
Partial fare-free (including agencies that fully suspended fares for all riders during the pandemic), either for specific groups, on specific routes, or in specific areas and are either:
- Considering piloting or implementing additional fare-free transit
- Not considering additional fare-free transit
-
Not fare-free (i.e., collect fares from all riders) (including agencies that had fully suspended fares for all riders during the pandemic) and are either:
- Considering piloting or implementing fare-free transit
- Not considering fare-free transit
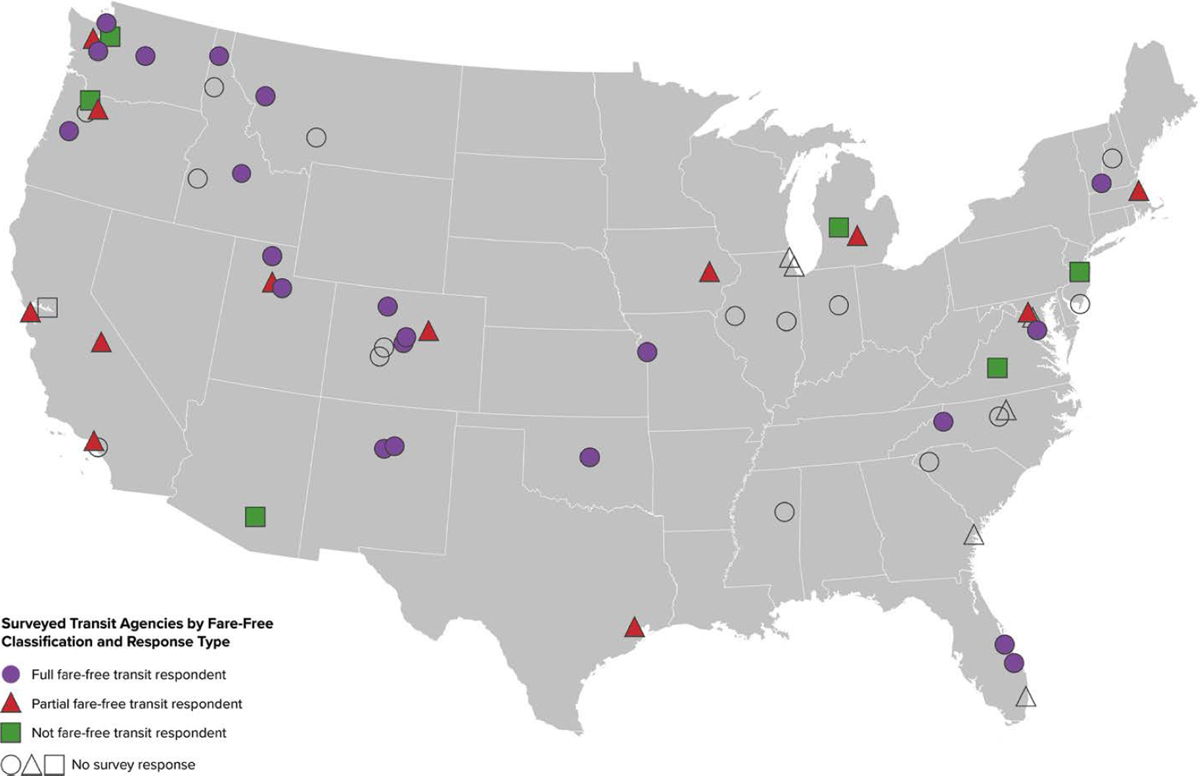
The assembled list of transit agencies, classification, and response type can be seen in Exhibit A-1. A map of the surveyed transit agencies and survey respondents can be seen in Exhibit A-2.
Transit Agency Statistics
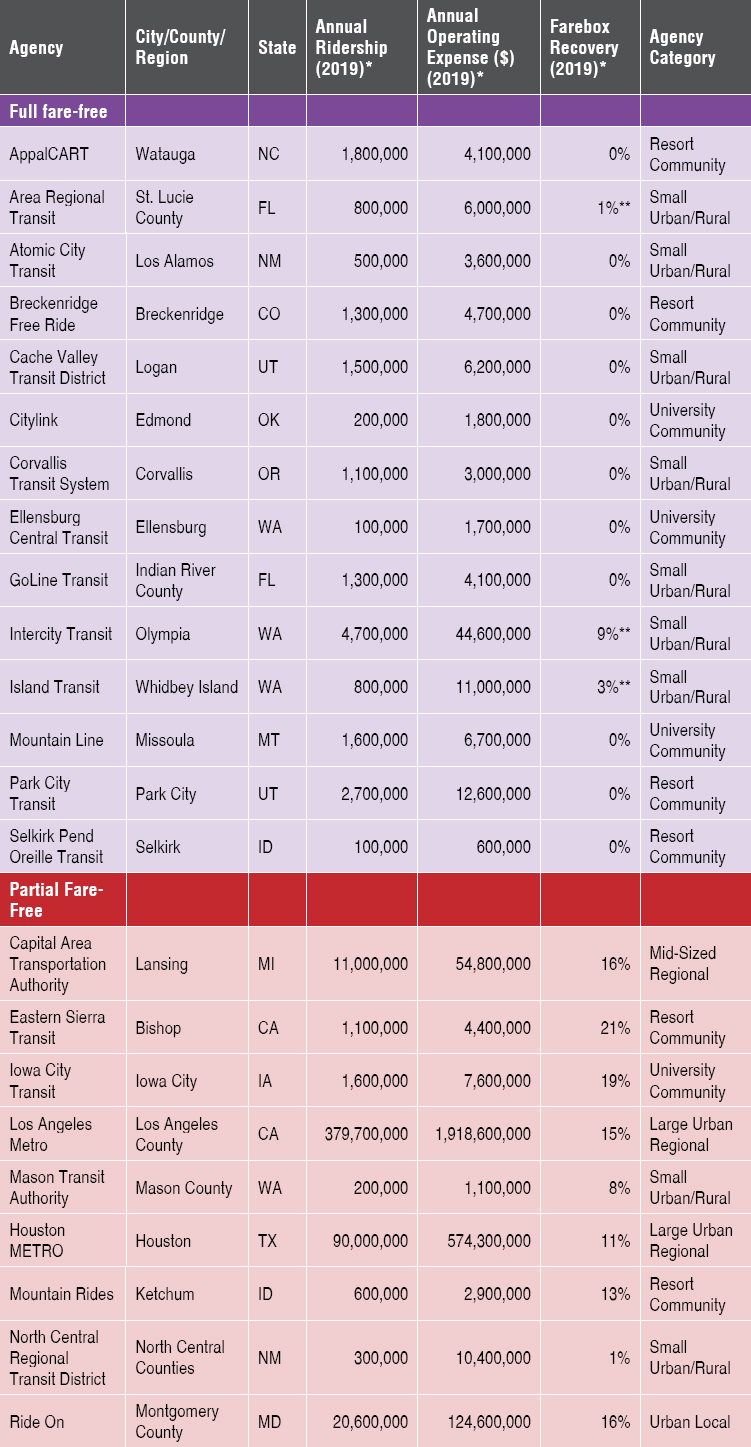
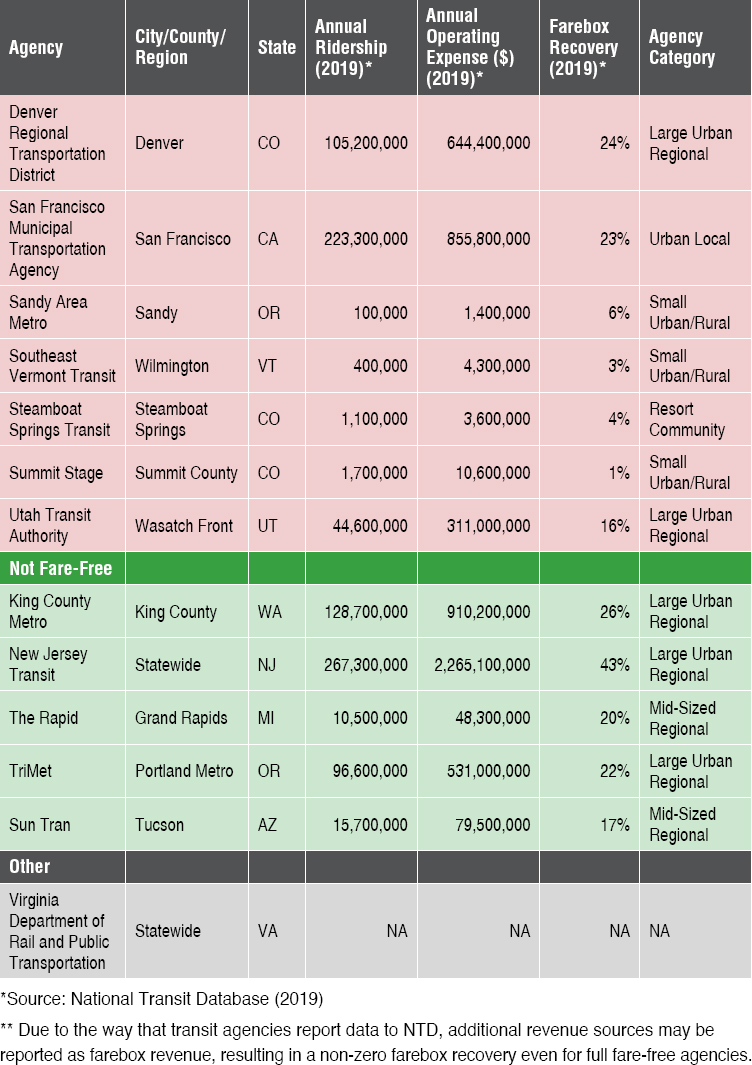
To understand the context in which each transit agency operates, surveyed transit agencies were categorized into six main community types based on ridership levels, the population and density of the service area, the population of the overall urban area, modes operated by the transit agency, relationship with other transit providers, and social context. These types are not prescriptive or exact, but rather provide general guidelines for understanding differences in fare-free systems. Transit agency categorizations and fare-free status can be seen in Exhibit A-3. The transit agency categories are as follows:
- Large Urban Regional: Has a large service area population, part of a large or very large urban area, serves multiple communities across an urban area as the main transit provider, and has high ridership.
- Urban Local: Located in a large or very large urban area, service area also served by other large transit providers, and has a smaller service area population than large urban regional transit agencies.
- Mid-Sized Regional: Serves a medium service area population in a medium to large urban area, acting as the main regional transit provider.
- Small Urban/Rural: Low to medium ridership, serves a small service area population, not part of a large urban area, and may connect with neighboring transit agencies but not serve the same area.
- Resort Community: Serves a small community with a mainly resort economy.
- University Community: Serves a small to medium-sized community with one or more universities.
The respondent transit agencies varied in terms of operating size and context. All full fare-free respondent transit agencies served small urban, rural, resort, or university-dominated communities, with smaller ridership, lower farebox recovery, and lower operating expenses on average. The partial and not fare-free respondents represented a wide range of transit agency sizes in terms of passenger trips, operating expense, and farebox recovery.
Survey Findings
This section describes the feedback provided in the transit agency survey responses. Key feedback themes included the following:
- Fare-free initiation, or what was involved in the decision-making process, what were the motivating factors for the programs, and what were the funding sources, if any, to fill the revenue gap.
- Program outcomes, or what transit agencies experienced after implementing fare-free transit.
- Program evaluation, or the methods transit agencies used to measure the potential and realized impacts of fare-free transit, and qualitative reflections on what would have been helpful for better measuring and understanding the outcomes.
Fare-Free Initiation
Program Champion
The source of the idea for fare-free transit service varied across transit agencies and was not recorded for multiple agencies. Survey responses indicated the following:
- For many transit agencies who studied or implemented fare-free transit, the policies were encouraged by policymakers who included fare-free transit in their election platforms as a benefit to the community.
- For other agencies, fare-free programs were proposed by the public through public engagement processes.
- For some transit agencies that went temporarily fare-free during the COVID-19 pandemic, policymakers and transit agency staff were interested in carrying forward the policy to continue to benefit the community.
Motivating Factors
Survey respondents shared a wide variety of reasons for why their transit agency was studying or implementing partial or full free transit (Exhibit A-4). Top reasons included the following:
- Increasing ridership. This was the most common goal of a transit agency partially or fully going fare-free, with almost 40% of respondents stating it as one of the main reasons they chose to eliminate or not implement fares. Even those that did not state increasing ridership
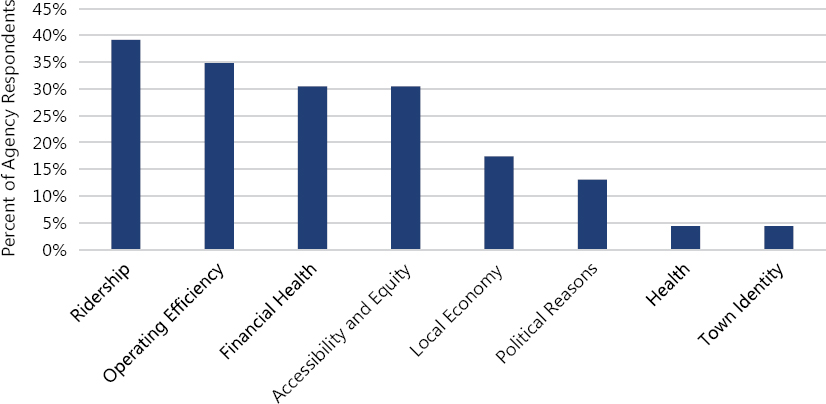
- Operating efficiency. Efficiency and operational considerations were top reasons for implementing a fare-free system as well. Transit agencies wanted to reduce dwell time by eliminating the cumbersome boarding payment process, as well as remove the duty of fare collection and enforcement from bus drivers.
- Financial health. For smaller transit agencies, not charging fares made financial sense. Farebox revenue counts against grant amounts in certain formula funding mechanisms because it reduces the operating deficit. The operational expenses of collecting fares can outweigh the actual revenue from fares in transit agencies with low farebox recovery.
- Accessibility and equity. Equitable and increased access to transit was the driving factor for many agencies to go fare-free, especially transit agencies that have recently switched to fare-free transit. Transit agencies expressed a desire to remove a financial burden from riders with low incomes who are already using the system as well as to lift a barrier to riding for those who may not have been able to afford it previously.
directly had goals that would be the result of increased ridership, such as decreasing demand for parking, supporting local business, or reducing pollution. Transit agencies varied widely in why they wanted to increase ridership, ranging from access to more grants to reducing parking demand and congestion to fighting climate change. Others simply wanted to increase ridership because it was a goal of the transit agency.
Partial Fare-Free Considerations
Fifteen transit agency survey respondents offer partial fare-free transit, including for a promotional or limited period, customer groups, routes, zones, and service types. For these agencies, partial fare-free transit was a strategy to help advance transit agency goals without large impacts on farebox revenue. The respondents did note that additional programs can result in increased overhead costs. Additionally, partial fare-free programs do not have the benefit of capital or operating savings from no longer purchasing and maintaining fareboxes. This drawback was discussed by Steamboat Springs, a full fare-free transit agency that began as partially fare-free. For a short time, fare-free transit was provided only to local residents, but it did little to encourage ridership, and no boarding time or operational cost savings were realized. After evaluating the locals-only program, Steamboat Springs chose to switch to full fare-free transit.
The type of partially fare-free transit is generally guided by the underlying goals of the transit agency and its program, such as the following:
- Encouraging transit use. Local and route-based fare-free systems were usually chosen by transit agencies to increase transit use while still bringing in revenue from other routes. Free
- Equity. Transit agencies looking to advance equity tend to provide free fares to specific groups of riders. This does not tend to increase overall ridership, but rather provides a financial benefit to current transit riders. SF Muni, LA Metro, and King County Metro all described supporting riders with low incomes as one of the main goals of their programs.
- Boarding time savings. Downtown zone-based, fare-free transit is employed by transit agencies looking to streamline boardings for short, busy trips through more dense commercial districts, such as Denver RTD’s free downtown zone and Utah Transit Authority’s free service in the Salt Lake City free zone.
- Community needs. The specific desires of a community also drive the formation of a partially fare-free program. Sandy Area Metro charges a fare for out-of-town service due to community concerns about destination-less riders, while still encouraging ridership within the community. Capital Area Transportation Authority provides fare-free transit on the Michigan State University campus after a request from the university.
local fixed-route service was the most common type of partially fare-free system, with fares charged on rural, out-of-town, or commuter trips. Utah Transit Authority utilized a promotional, time-limited program and provided free service for the first 2 years of a new bus rapid transit (BRT) line to build a ridership base.
Evaluating Program Feasibility
Some transit agencies recalled completing formal feasibility studies or evaluations before implementing fare-free transit, but this was not common:
- Of those that completed evaluations, about half consulted literature, peers, and best practice reviews to inform their decisions.
- Others completed operational evaluations to measure the potential service impacts of the fare policy, such as additional service demand from increased ridership.
- Some transit agencies focused on a financial evaluation of the policy change, including an inventory of existing fare collection costs and foregone fare revenue.
Funding Sources
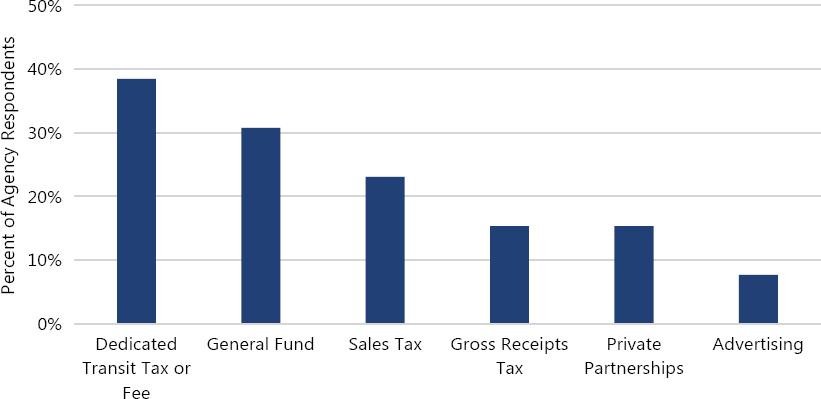
To fill the foregone revenue gap left by the elimination or reduction of passenger fares, some transit agencies absorbed the costs into transit agency or municipal budgets. Others were able to reduce operating costs enough through the efficiencies of not collecting fares to balance lost revenues. For transit agencies that were not able to fill the revenue gap, funding sources included gross receipts tax, sales tax, municipal general funds, advertising, private partnerships, a dedicated transit tax or fee, or some combination of methods (Exhibit A-5). Many transit agencies did not have long-term funding secured at the onset of fare-free transit, including St. Lucie County Community Transit and Mountain Line, and were operating through pilot grants from local and state sources. Some transit agencies found that fare-free transit unlocked new funding sources, such as local, state, and federal grants, that have allowed them to grow.
Specific examples of transit agencies using funding sources other than fares include the following:
- Mountain Line (Missoula, MT) is an example of utilizing external funds to get fare-free transit off the ground. Increased ridership and improved efficiency gave the transit agency a competitive advantage in applying for grants and attracting external partners, and more opportunities opened up as ridership increased. Once the fare-free transit was an established part of the community, the city voted on a levy to provide permanent stable funding, which passed and had overwhelming support.
- Corvallis Transit System (Corvallis, OR) used an innovative funding source that involved charging a small fee on utility bills to fund transit, encouraging the public to view mass transit as a city utility.
- Citylink (Edmond, OK) pulled from multiple funding sources, including the general fund, the sale of advertisements, and providing contracted services.
- The Virginia Department of Rail and Public Transportation (DRPT) created the Transit Ridership Incentive Program (TRIP), a statewide grant program, in 2021 to help fund free- and reduced-fare programs among Virginia transit agencies.
Finding a funding source for transit service to replace fare revenue was a common challenge for larger transit agencies that studied fare-free policy but opted not to go full fare-free. Many decision makers were deterred by the cost of the program and the inability to fill the funding gap left by the loss of farebox revenue. Examples include the following:
- Houston METRO decided against pursuing fare-free transit because of a concern over a lack of funding.
- NJ Transit was held back from exploring potential fare-free transit because of the question of funding.
- TriMet discontinued its fare-free zone due to the loss of fare revenue.
Decision-Making
The decision-making process for initiating a fare-free program also varied across the transit agencies:
- For most agencies, the decision to implement the program was an internal transit agency decision or a decision from local policymakers.
- For a few agencies, the policy was included on ballot measures and was voted on by the public.
- Six agencies opted to test the program through fare-free transit pilots before making a long-term decision to go fare-free.
Program Outcomes
Ridership
All transit agencies that eliminated fares before the COVID-19 pandemic experienced large increases in ridership, especially among youth, individuals with low incomes, and people experiencing homelessness. Outcomes included the following:
- Some full fare-free transit agencies struggled to keep up with the large increase in ridership. Ensuring high-quality service at higher ridership levels requires more frequent service, more buses, and more staff. These needs can greatly increase costs at the same time that fare revenue is lost.
- St. Lucie County Community Transit, one of the few transit agencies to analyze the before and after demographic data, saw an increase in riders with higher incomes.
- Going fare-free to just certain segments of the population (partially fare-free) did not seem to increase ridership significantly outside of large transit agencies like SF Muni.
Paratransit Demand and Service
Of the transit agencies that reported paratransit impacts, there was variation in whether there was an increase in ridership and revenue hours. Reported paratransit impacts were the following:
- Most agencies did not see a change in paratransit ridership or revenue hours.
- Some agencies narrowed eligibility for paratransit as part of the rollout of fare-free programs and did not see any changes in ridership.
- A few agencies experienced an increase in paratransit demand, including up to a 100% increase in Steamboat Springs. Two of the agencies also recorded an increase in revenue hours.
Disruptive Passengers
A few transit agencies of varying sizes reported problems with disruptive passengers, such as intoxicated passengers or rowdy youth, but this was not a consistent finding among all transit agencies interviewed. Reported outcomes were the following:
- Multiple systems that had expected to face this challenge did not see a measurable impact.
- Strong code of conduct policies, destination requirements, and required disembarking at the final stop helped solve some of these problems.
- Some of the reports of problems were rider complaints of passengers experiencing homelessness, which included challenges that are difficult to regulate away.
- The Rapid discontinued fare-free service because of continued conflicts and belligerent passengers.
Public Response
For many transit agencies, there was a general sense of support for fare-free transit from community members, but there was a lack of sufficient data to make overarching claims about public opinion. The following public opinion outcomes were reported:
- Only a handful of transit agencies conducted public engagement after implementation and understanding of public support is mostly based on anecdotal reports.
- Most transit agencies experienced a small but loud opposition early in the program, which eventually faded out as people experienced the new system. Transit agencies of all sizes reported challenges in ensuring public support and pushing back against the opposition, even if feedback was positive overall.
- Public pushback occurred in systems that reported more problems with disruptive passengers. Two transit agencies (The Rapid and Sandy Area Metro) limited or rescinded fare-free programs in response to operator, business, or rider complaints of destination-less and disruptive passengers.
- In smaller communities, transit agencies reported community pride and ownership of the free-fare programs and that not charging fares is an integral part of the system’s identity.
Operator Experience
Bus operators have mostly reacted positively to full fare-free systems:
- Fare disputes were cited as one of the biggest problems facing bus operators and removing that potential source of conflict has been an important benefit.
- There were a few reports of bus operators struggling to deal with disruptive and destination-less riders.
- During the COVID-19 pandemic, bus operators also expressed support of these policies that reduced close contact with passengers.
Program Evaluation
Methods
For many transit agencies, evaluating the success of a full or partially fare-free system was often difficult and varied depending on the decision-making process and program goals. The agencies that evaluated full or partially fare-free systems used different methods:
- High-level data review. Most transit agencies considered high-level impacts on system ridership and revenue when evaluating the move to fare-free transit.
-
Evaluation of program success:
- Aside from ridership and revenue, other examined metrics varied depending on the context and goals, including boarding times, additional service needs, passenger destinations, and public opinion.
- Only four of the respondent transit agencies conducted formal evaluations after implementation beyond looking at high-level ridership and revenue data.
- Three transit agencies are currently in pilot phases of fare-free programs and are planning to complete evaluations.
- Specific evaluation examples include the following:
- Houston METRO’s decision to not go fare-free was informed by a ridership and cost model. The transit agency determined the program would be infeasible due to a forecasted increase in service demand and costs.
- As part of its pilot program, St. Lucie County Community Transit conducted a detailed review of rider travel habits and demographics before and after the implementation of fare-free transit and was able to identify important metrics like riders with low incomes traveling to healthier grocery stores.
- No recorded evaluation. Transit agencies that implemented fare-free programs more than a decade ago were the least likely to have documentation of the decision-making, planning, or evaluation process. Many of these agencies indicated that they would have liked a more formal evaluation structure or implementation plan.
Desired Resources
Many transit agencies cited a lack of resources on how to evaluate the feasibility of or implement fare-free transit service. Some specific resources that would have been helpful include the following:
- Organized information on other transit agencies. A document or resource clearinghouse on the experiences of other transit agencies with fare-free transit would have been helpful to many transit agencies. Current information is not available in a centralized location, if at all. A better understanding of the processes and experiences of other transit agencies that had studied or implemented some form of fare-free transit would have been helpful for those who were evaluating potential fare-free transit for their own transit agencies.
- Checklists. Transit agencies that implemented fare-free programs expressed a desire for more information on what to expect and how best to go about implementation. Establishing clearer goals, incorporating these goals into a larger transportation demand management strategy, and ensuring funding for marketing and promotion were examples of issues transit agencies wished they had considered. For transit agencies that do not currently have fare-free transit, this type of resource would be helpful if they were to consider a fare-free program.
- Marketing resources. Multiple transit agencies also wanted additional resources or tools for marketing campaigns. Getting information about the program out to the public and explaining the benefits early, especially to those not on social media, would have helped smooth out some of the rollout hiccups. This challenge was not anticipated by every transit agency, another example of why a checklist of what to expect would have been useful.
- Better funding mechanisms. Access to funding is a major challenge to midsize and larger transit agencies where fares generate more revenue than they cost to administer and where increased ridership would strain the system and require expansion.
Comparison with TCRP Synthesis 101 and Existing Research Gaps
The findings from the transit agency survey completed for this report aligned with the findings from TCRP Synthesis 101: Implementation and Outcomes of Fare-Free Transit Systems (Volinski 2012) and showed shifts in goals and approaches over time. Overall, the two surveys documented similar outcomes of fare-free transit, including an increase in ridership, community support, and positive feedback from bus operators. They also both revealed similar challenges with funding and concerns with disruptive passengers. TCRP Synthesis 101 identified three categories of fare-free transit agencies based on the responses: small urban and rural public transit systems, transit agencies serving university-dominated communities, and transit agencies serving resort communities.
The fare-free programs in the 2012 survey also tended to fall into one of those three transit agency categories, although there was a wider range of types among partial fare-free agencies. In both the 2012 and 2021 surveys, larger transit agencies tended to experience crowding and a decrease in schedule reliability and would have needed additional capital and operating funds to accommodate increased demand. However, larger transit agencies have been exploring fare-free programs in recent years, and the COVID-19 pandemic has provided a unique opportunity for transit agencies to explore suspending fares.
Even with the completion of the two surveys, there is still room for future study on fare-free systems, especially given the lack of data available from many transit agencies. Some of this information, such as the process of decision-making and specific implementation plans, could be gathered from further interviewing of transit agencies.
Both surveys showed a lack of quantifiable results beyond ridership and funding numbers. Transit agencies lacked evaluation tools or frameworks, and some goals, such as equity or accessibility, were difficult to measure. Questions also remain about accurately forecasting ridership changes.
The COVID-19 pandemic has also caused a shock to the transit system, disrupting ridership and funding. Ridership changes and new travel patterns are likely to influence the impacts of fare-free transit. This complicates the evaluation of fare-free programs, where external factors may be influencing ridership more than fare-free programs. Continued research on the impacts of the COVID-19 pandemic on transit as well as specific investigations into the relationship with fare-free service are needed as transit agencies move forward.


