

CHAPTER 2
Fundamentals of Ferry Capacity
Each ferry system has unique planning and operating considerations related to its passenger or vehicle demand; the operating environment, including geography, sea state, and climate; the locations of terminals; and the type of service provided. For example, a single-vessel rural vehicle ferry service that serves as a lifeline route for island residents has different capacity considerations than multi-route urban systems that provide an alternative to congested roadways.
This report focuses on procedures and best practices based on what vessels carry: passengers only or passengers and vehicles. Although ferries do provide a variety of services beyond the transportation of vehicles and passengers, (e.g., carrying cargo or providing excursion trips), these services are not addressed in this research.
Overall ferry system capacity is driven by the capacity of the vessels (how many people or cars can be moved in one sailing) and the frequency of service (how many sailings occur over a period of time). Factors such as the design and number of vessels, operating conditions, number of routes served, and the terminal configuration directly affect the maximum number of possible sailings and the capacity of the system. System capacity is also driven by how the ferry system is governed along with the policies and regulations that apply to that service. Beyond total system capacity, operators are often most focused on capacity during a defined time period, such as the morning or evening commute windows.
This chapter provides an overview of the capacity planning considerations connected to each of these elements and discusses how these elements relate to each other and to overall system capacity.
Vessel and Fleet Planning
Habib et al. (1980) and the TCQSM (Ryus et al. 2013) provide an overview of vessel design considerations (including vessel functions, engine types and propulsion systems, hull and superstructural elements, vessel control, docking procedures, and passenger amenities) for passenger-only and vehicle ferries. The following sections describe how the vessel design, regulations, route and operating conditions, fleet size, and the vessel–terminal interface affect ferry system capacity.
Regulations Affecting System Capacity
Ferry systems can be subject to international, federal, state, and local laws, regulations, and standards. The exact nature and scope of the applicable regulatory system imposed on an individual ferry system depends on the specific operating characteristics of that ferry system.
This section provides an overview of the regulatory agencies involved and the key laws, regulations, and standards for U.S.-owned and -operated ferry systems that affect the potential vessel or ferry system capacity. Ferry services operating in other countries are subject to the requirements and regulatory regimes of those countries.
Regulatory Agency Overview
The U.S. Coast Guard (Coast Guard) is the federal agency with primary responsibility for maritime safety and security, including vessel construction, operational safety, vessel manning and crew licensing, lifesaving and emergency response, and vessel and facility security. The Coast Guard oversees a ferry system beginning with initial design and construction and following throughout the system lifespan. The Coast Guard issues the vessel a Certificate of Inspection (COI) that stipulates service information such as the authorized route, number of passengers allowed, the size and makeup of crew, the type and number of lifesaving appliances, and other related operating restrictions or limitations. While other federal agencies like the Environmental Protection Agency and Customs and Border Protection (CBP) and individual states may also regulate vessel operations, this research focuses on Coast Guard requirements that affect capacity of the vessel and ferry system.
Vessel Size
Vessel size has a direct impact on ferry system capacity. Further, the suite of applicable regulations varies significantly based on vessel size. In domestic service, vessel size is defined by the admeasured gross tonnage, a measurement reflecting the internal measured volume of the vessel, which governs the set of regulations that apply. Specifically, a passenger vessel admeasured to be less than 100 gross tons (GT) is considered a small passenger vessel, whereas a vessel greater than 100 GT is considered a large passenger vessel.
Small passenger vessels are generally subject to less stringent rules related to crewing and lifesaving requirements than large passenger vessels, leading to lower-cost vessel construction requirements and lower operating costs. As a result, smaller ferries’ cost profiles may allow for more efficiencies and indirectly more capacity after additional analysis. Table 4 outlines how small and large passenger vessels are defined, as well as the applicable regulations.
Accessibility
While the current Americans with Disabilities Act (ADA) does not address accessibility requirements for passenger vessels, the U.S. Access Board has developed draft accessibility regulations for newly built or altered passenger ferry vessels designed to carry 100 or more passengers. These proposed guidelines address onboard circulation, vertical access between decks, doorways, thresholds, restrooms, and other passenger spaces and elements. Adoption of the guidelines as regulatory requirements is pending final publication by the U.S. Access Board, the date for which was unknown at the time this report was written. When final guidelines are adopted, further study would be helpful to understand the impacts to passenger vessel design and capacity planning.
Route Operating Conditions and Vessel Requirements
The length, operating conditions, and environmental concerns of a route dictate vessel requirements such as speed, size, design, and regulations. In many cases, these requirements affect the size of the vessel that can be used as well as the speed at which the vessel travels and resulting service frequency. The following route elements have a direct relationship to vessel and route capacity.
Table 4. Regulations affecting capacity by vessel size.
| Vessel Size | Applicable Regulations |
|---|---|
| Small passenger vessels (less than 100 GT) Subchapter T and K |
Small passenger vessels are subdivided into two categories:
Vessel capacities for vessels subject to Subchapter K are typically governed by standards in one of three areas: (1) vessel stability, (2) vessel physical size/arrangements, and (3) available lifesaving appliance/equipment. The following brief explanations apply:
|
| Large passenger vessels (more than 100 GT) Subchapter H |
Large passenger vessels are subject to the provisions of 46 CFR Subchapter H. Unlike small passenger vessels, there are no further regulatory thresholds for large passenger vessels, with all vessels subject to the same set of rules, but with regulatory expectations modified based on operating variables such as route and capacity. Limits for passenger capacities are similar to those identified for small passenger vessels. However, for large passenger vessels, there are additional regulatory expectations, such as for structural fire protection, primary lifesaving appliances and evacuation, and crewing/manning, that may represent additional considerations for system capacity. |
-
Environmental restrictions: Ferries may travel through waters with designated slowdown zones that reduce the transit speed and result in fewer service trips. Some examples of speed restrictions related to environmental conditions include:
- Limiting speeds within a certain distance of protected marine mammals,
- Adjusting service speeds and vessel design to reduce vessel wakes and potential shoreline erosion, and
- The presence of shallow water, which may require slow speeds or specialized vessel design to manage operating risk and reduce the effects of propeller wash on sediment or aquatic vegetation.
- Marine traffic: Ferry routes may include areas of high vessel traffic, including other transportation, shipping, industry, and personal and recreational watercraft. Areas of high traffic may require reduced speeds for safe operation.
- Propulsion and emissions: Desired vessel propulsion systems (e.g., electric or hybrid-electric engines) and emissions level targets may affect vessel capacity—how much space is required for propulsion or charging equipment, how fast a vessel can make a round trip, and how long may be needed in between sailings (dwell time) for refueling or charging. Route environmental and terminal characteristics will affect the suitability of a vessel size and its propulsion type.
- Safety standards: Vessels are subject to myriad safety standards that determine how many passengers can be carried on the vessel, the number of crew required to operate the vessel,
- Sea states and weather conditions: For routes that travel through open water, vessels may be designed or equipped to aid in a comfortable passenger experience during times of wind and wave action, and larger vessel sizes may be required. In areas where ice may be present during winter conditions, vessels with ice-breaking capabilities may be required.
and the equipment required. Some of these standards are determined based on the operating conditions of the route. Each element affects the overall capacity of the vessel and the ferry system. Table 5 summarizes the safety requirements that affect capacity for U.S.-based domestic and international routes.
Right-Sizing the Vessel and Fleet
Ferry vessels are a major financial investment, with asset life that is typically longer than that of other transportation modes. For example, the 2018 National Census of Ferry Operators conducted by the U.S. Department of Transportation Bureau of Transportation Statistics found the average age of reported vessels to be 27 years, the median age 24 years, and the oldest vessel to be 104 years. As a result, right-sizing the vessel with the appropriate passenger or vehicle capacity and operating capabilities for current and future needs is an important decision for operators and transit planners. Factors involved in right-sizing the vessel may include the following:
- Current and forecast demand: Forecast ridership and anticipated growth, or policy decisions regarding levels of required service, can determine passenger and vehicle capacity requirements for vessels. Variability in demand by time of day, day of the week, or season, where peak demand may be significantly higher than most other periods, must also be considered. Policy and governance considerations related to system capacity are discussed in more detail in the Governance and Policy Factors section later in this chapter.
Table 5. Domestic and international safety standards affecting capacity.
| Ferry Service | Safety Standards Affecting Capacity |
|---|---|
| Domestic |
Any vessel carrying more than six passengers on a domestic voyage would be subject to applicable domestic laws and regulations, including those covering topics such as construction, operations, safety, crewing, security, and inspections. These standards vary depending on the domestic route to be served, with an ocean/exposed route generally having more stringent standards for topics such as safety, stability, and lifesaving than a route operating on protected waters. The vessel stability and lifesaving capabilities unique to the specified route and vessel to be employed may govern the vessel capacities authorized. The stability letter issued by the Coast Guard stipulates the number of passengers that may be carried on a specific route. The Coast Guard-issued COI stipulates the associated lifesaving gear, along with requisite crew necessary to respond to an emergency for the intended route. For example, a member of the crew, acting as a dedicated lifeboatman, is typically assigned to every primary lifesaving appliance, the number of which is tied to the vessel capacity and route served. |
| International |
Any vessel carrying 12 or more passengers and making an international voyage between a U.S. port and a foreign port is subject to applicable international conventions, including the International Conventions for the Safety of Life at Sea (SOLAS); the International Safety Management Code; High Speed Craft Code (as applicable); Standards for Training, Certification, and Watchkeeping; and the International Ship and Port Facility Security Code. A U.S.-flagged vessel employed on a route that includes international service is subject to international and domestic standards. The Coast Guard is the agency responsible for ensuring compliance with both sets of these standards. In addition to standards that apply to vessel operations, a ferry route that includes an international voyage also requires a terminal facility that provides the space and attributes necessary to accommodate applicable customs and immigration functions stipulated by CBP. |
- Fleet composition: Vessel design and fleet planning can involve trade-off decisions regarding vessel capacity and speed. Generally, smaller vessels require less dwell time to load and unload passengers. Therefore, route and system capacity involve a trade-off between vessel capacity and service frequency. The capacity provided by multiple smaller vessels with frequent sailings may be the same or greater than that of one large vessel with less frequent sailings. If operating costs are included as a consideration, comparison of different vessel scenarios must also include factors such as the total number of crew required for operation, maintenance costs, and fueling costs. The TCQSM (Ryus et al. 2013) introduces the trade-offs in fleet and service frequency planning, including considerations for routes with multiple destinations. Scheduled service frequency and vessel size are related to other service elements such as terminal infrastructure, berthing capacity, and multimodal connections.
- Interoperability: For systems with multiple terminals and routes, standardization of the fleet, in terms of vessel size and the design of the infrastructure needed to connect vessels with the terminal, can lead to efficiencies in maintenance and operating costs as well as crew training and dispatching and can have an impact on overall system capacity. Minimizing differences in vessel size and design allows for increased flexibility in route assignments and opportunities for increasing service during periods of high demand by dispatching additional vessels. Interoperability also supports system redundancy in case of vessel outages. For many systems, standardization of assets requires long-term planning and may be difficult and costly to implement for systems with existing assets.
- Operating cost: Vessel size and sailing speed directly affect operating cost since the vessel size and passenger capacity dictate the number of crew required by the Coast Guard, the amount of fuel used to serve the route, and the overall vessel maintenance costs.
- Route length and operating conditions: The length and characteristics of the route and operating environment also shape the vessel size. Routes with more exposure to wind and wave action may require a larger vessel or an alternative and suitable hull design to maintain safety, reliability, and passenger comfort.
- Regulations: The maximum passenger capacity of each vessel is determined by the Coast Guard and stated on the COI. The passenger capacity is determined based on vessel size, arrangements, crew size, and evacuation routes and equipment. Compliance with the Coast Guard COI requires accurate counts of passengers on each sailing. Regulations related to system capacity are discussed in more detail in the Regulations Affecting System Capacity section earlier in this chapter.
- Terminal constraints: Constrained capacity upland of the terminal can also dictate vessel size. A large volume of disembarking vehicles, or vehicles leaving from a park-and-ride lot, can overwhelm connecting roadways and intersections. For some passenger ferry services, capacity must be balanced and coordinated with the capacity of multimodal connections.
- Vessel–terminal interface: Vessel capacity is also directly related to terminal facilities, including both the landing infrastructure that must be compatible with the vessel size and design and the capacity of connecting terminal spaces. Passenger access is a critical component of overall terminal capacity, and providing adequately sized passageways reduces passenger queuing and alighting delays. In order to minimize dwell time, terminal spaces must accommodate a vessel load of passengers or vehicles as they load and unload within an allotted window of time.
Terminal Capacity and Design
Previous reports, including Habib et al. (1980) and the TCQSM (Ryus et al. 2013), provide an overview of the functional design and capacity concepts for terminal elements. The following sections provide additional detail on terminal capacity planning considerations, including
maximizing vessel berthing, regulatory constraints for passenger spaces, policy decisions regarding level of service (LOS) and targeted demand levels, and potential future needs. Guidance for calculating capacity requirements for passengers and vehicles is included in Chapters 3 and 4.
Vessel Berthing Capacity
The TCQSM provides methods for calculating vessel capacity (the maximum number of vessels per hour) at individual berths and at a dock facility based on passenger disembarking time, passenger embarking time, and vessel clearance time (Ryus et al. 2013, Equations 9-1, 9-2, and 9-5).
In addition to the number of berths, facility planning considerations for maximizing vessel berthing capacity include the float design and available in-water space, as described here:
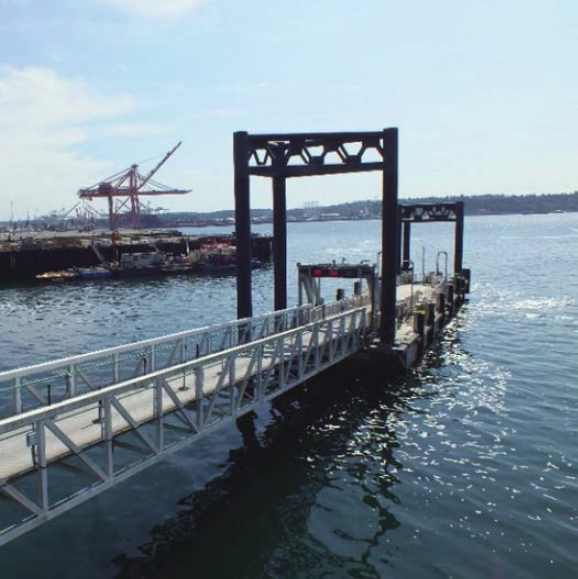
- For floats that provide two vessel berths (one on either side, as shown in Figure 2), the size and design of floats and ramps determine whether two berthed vessels can simultaneously load and unload passengers.
- The available in-water space around docks determines whether simultaneous maneuvering for arriving/departing vessels is possible, or if arriving vessels are required to wait for a departing vessel to clear the dock area before landing.
- For hub terminals serving multiple routes or routes with multiple vessels, service reliability may require backup slips in case of vessel breakdowns or terminal maintenance. Backup slips provide redundancy and are in addition to the slips required to accommodate scheduled landings.
Regulatory Constraints
Terminal capacity is affected by any local, state, and federal building codes and environmental and engineering policies that govern design and location of buildings and terminal facilities.
Accessibility
The ADA was passed into federal law in 1990 and prohibits discrimination based on disability in a variety of sectors, including transportation. For a public ferry operator, ADA construction guidelines apply to terminal facilities and must be incorporated in new terminal construction or facility renovations to provide equitable access for people with disabilities.
The U.S. Access Board is the federal agency that establishes the building and construction standards for ADA compliance. The construction standards for land-based facilities have long been established, with the most common design impacts for ferry operators being on elements such as those discussed in the following:
- Restroom dimensions and features.
- Minimum widths for pedestrian walkways or queuing lanes (primarily for wheelchair access).
- Maximum pedestrian ramp slopes. Meeting the ADA standard for maximum ramp slopes is a challenge for many ferry operations, especially those located in coastal areas with large tidal ranges or with constrained terminal sites that limit transit span lengths. In some cases, excessive ramp slopes may only occur during periods of extreme low or high tides, meaning that there may be relatively isolated instances of noncompliance. In these cases, operators must plan to have a crew or terminal staff member available to assist passengers when needed.
Environmental
Ferry terminals require in-water and overwater construction and must comply with applicable federal, state, and local regulations. Complying with the U.S. Clean Water Act requires demonstration of reducing and minimizing impacts to aquatic resources. As a result, the overwater terminal elements are typically designed to the minimum area necessary to maintain safe operations.
For vehicle ferries, holding lane design should include considerations for minimizing emissions from idling vehicles. For example, a large lot located near vessel boarding and terminal amenities may allow drivers to avoid idling for as long as would be the case in a long linear queue where vehicles have to frequently move forward.
Planning and Service Factors
In addition to regulatory considerations, the sizing of a terminal depends on many variables, including policy decisions regarding the targeted level of demand, number of routes and service types, and desired LOS for customers.
Demand Levels
Planning construction of or improvements of terminals requires a balance between current and future capacity needs, construction costs, and available space. Because passengers and vehicles move on and off ferries in large batches, capacity planning must take into account peak volumes of passengers and vehicles as well as the rates at which they move through the terminal. More information on passenger flows and best practices for managing passenger throughput are presented in Chapter 3, while information for vehicle flows is presented in Chapter 4.
When planning terminal capacity, operators must decide whether they will design to the peak demand level, meaning that they plan their facility to accommodate passenger and vehicle demand at all times, or whether they will design to a level lower than peak demand, meaning that demand is anticipated to exceed capacity some of the time. For example, when planning passenger spaces, Auckland Transport bases design capacity on passenger volumes in the peak 15 minutes of the peak operating hour in the design year (Auckland Transport 2019), while WSF
designs for the peak sailing on the 85th percentile busiest day in the design year, or the 55th busiest day of the year (Washington State Department of Transportation Ferries Division 2016).
Routes and Service Types
Additionally, the type and number of routes can have an impact on terminal capacity needs. Typically, commuters arrive close to departure times, which results in a shorter wait time and lower requirements for comfort and amenities, whereas recreational routes may see riders arrive further in advance of their scheduled departure time. For terminals that only serve one route, capacity can be planned based on the capacity of one vessel, while capacity planning for hub terminals may need to account for multiple vessels arriving and departing simultaneously. Depending on the route type and ridership, additional space may be required to accommodate higher numbers of bicycles. Operators and agencies may apply different capacity planning guidance and design standards to different types of terminals in order to appropriately plan capacity.
Pedestrian Level of Service
On top of design codes for maximum building capacity, design of terminal facilities relies on pedestrian LOS concepts, including qualitative and quantitative factors for evaluating pedestrian comfort and movement. Pedestrian Planning and Design (Fruin 1971) serves as a source for pedestrian LOS concepts and methods of calculation. LOS guidance for specific terminal elements is detailed in the Designing Passenger Facilities to a Level of Service section of Chapter 3.
Vehicle Facilities
Vehicle ferry operators use different standards for planning terminal capacity for vehicle holding and circulation. These standards are typically based on a factor of how many vehicles are carried in one sailing (addressed in more detail in the Vehicle Terminal Capacity Planning and Minimizing Dwell Time section of Chapter 4).
Additional Terminal Elements
In addition to passenger terminal spaces, capacity planning for other terminal elements requires policy decisions regarding level of service and long-term demand.
- Bicycle lanes and storage: Bicycle capacity requirements depend on type of route and terminal location. Data collection regarding bicycle demand for a variety of routes is recommended for further research to support capacity planning for bicycles.
- Multimodal connections: The space needed to support multimodal connections depends on planned capacity and demand for both the ferry and connecting transit systems. Terminal planning considerations for multimodal connections are further discussed in the Multimodal Connections section of Chapter 3.
- Parking: Potential parking needs include curbside pick-up and drop-off, short-term parking (passenger loading, ADA), long-term parking (walk-on passengers), employee parking, and miscellaneous (vendors, emergency vehicles). Decisions regarding how much terminal space to dedicate to parking depend on terminal location, the availability of multimodal connections, and current and forecast demand.
Accounting for Future Space Needs
Ferry terminals are often located at constrained sites with limited available space. Even for terminal locations that have space for expansion, the costs and environmental permitting involved with construction in and near the water in many places can make modification and
expansion of terminal infrastructure costly and difficult. Ideally, terminal design includes flexibility to accommodate future technology and capacity needs. Some of the potential needs that should be considered during terminal design include those discussed in the following subsections.
Alternative Vessel Designs
Berths and floats are often designed for a specific vessel or class of vessel. In order to accommodate multiple vessel sizes or designs, landing infrastructure must be sized for the largest potential vessel, and flexible or mechanical elements such as gangways and ramps may be needed to fit multiple boarding door locations and freeboards. If additional capacity is needed on a route, the size and number of vessels that can be used may be limited by terminal infrastructure.
Electrification and Alternative Fuels
Electric vessels and alternative fuels are in the early stages of adoption for ferries in the United States. With advances in technology and availability of grant funding aimed at reducing carbon emissions, many operators are currently in the planning stages for vessel electrification or alternative fuel use. Once more ferry services have implemented hybrid-electric or zero-emission vessels, further study will be needed to understand the space requirements for charging and other equipment. If a terminal location is constrained and does not have potential for expansion, these space requirements may take away from passenger or vehicle capacity. Early planning efforts have identified several considerations and potential space needs that can be included in terminal design to provide future flexibility and minimize the risk of future impacts to vehicle or passenger capacity. These considerations are discussed in the following:
- Alternative fuels: In addition to electrification of vessels, alternative fuels commonly considered for ferries include liquefied natural gas, liquefied petroleum gas, biofuels, methanol, ammonia, and hydrogen. Terminal planning and capacity considerations for potential application of alternative fuels depend on the location of fueling (off-site or at the terminal) and on requirements for specialized protocols, maintenance, or safety equipment.
- Energy storage: Rapid charging of an electric vessel during scheduled dwell times can create a power draw that is too large to be accommodated by most local utilities. Operators can overcome this issue by implementing an energy storage system at the terminal that allows electricity to be drawn continuously at a lower power level and stored to rapidly charge the vessel when it is connected. Current battery energy storage systems of the scale needed to support ferry vessel electrification are housed in 20- or 40-foot standard intermodal containers.
- Integration with the local utility grid: Electrification requires early collaboration with the local utility regarding local power grid capacity, as well as collaboration on how and where the terminal will connect to the utility. Delivering sufficient levels of power to terminals may require installation of new underground duct banks, overhead lines, or submarine cables. Additional transformers and other equipment at the nearest substation may also be required, depending on the charging demand loads.
- Shore–vessel charging connection: To get power from the shore to the vessel’s energy storage systems, a charging system is needed at the operating slip. For most operations, the large power demand and short dwell time available for charging will require an automated rapid charging system. Most charging systems consist of an active plug and a fixed receptacle. The active element can be a robotic arm or a gravity-powered cable system that is designed to engage the receptacle, verify the connection using low-voltage monitoring systems, and then engage the charging power. The location of the charging equipment will vary by terminal depending on design and vessel size and may be located on wingwalls, floats, or other terminal infrastructure at the slip.
- Space requirements: Depending on the vessel size and energy needs of the route, power management and energy storage systems can require a significant footprint at the terminal—typically between 1,000 and 2,500 square feet.
Future Expansion
Adding new routes or increasing the number of vessels that land at a terminal may require additional landing berths for vessels and added terminal capacity to accommodate the increased number of passengers that may be embarking and disembarking at one time. Siting terminals in a constrained location or designing terminals without flexibility for future facilities expansion may limit opportunities to increase capacity to meet future demand.
Maximizing Sailing Frequency
The frequency of sailings is a product of the time required to complete a round trip and the number of vessels in service. The maximum number of trips a ferry system can complete results in the maximum capacity of the ferry system.
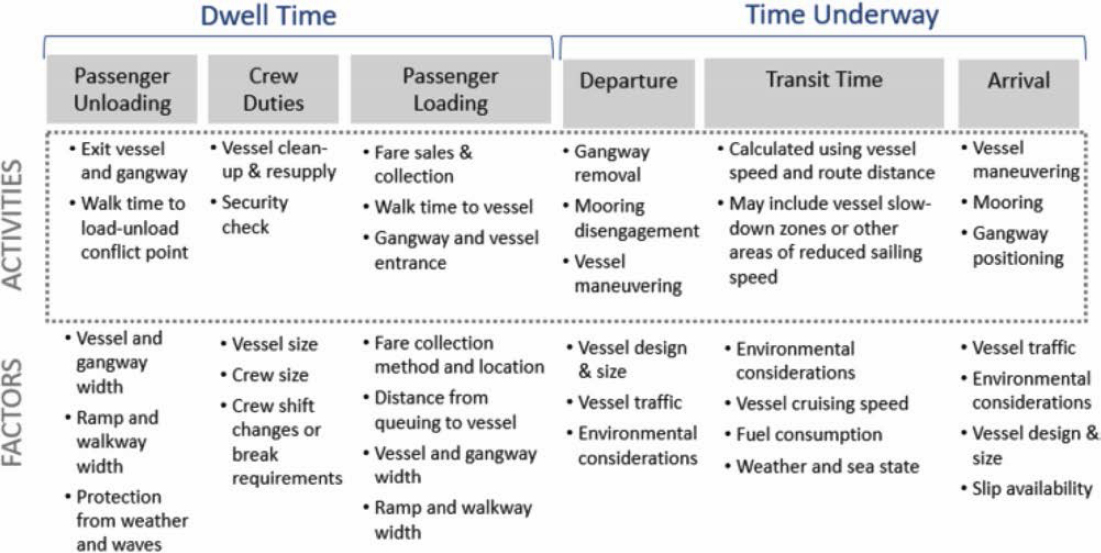
In the TCQSM, Chapter 9, Section 3, Ferry Scheduling and Service Planning provides a narrative description of the steps involved in a one-way ferry trip (Ryus et al. 2013). These steps are summarized in Figure 3, along with the factors that influence the time required to complete the activities within each step. The total trip time equals the sum of the time required to complete each of the activities in the figure that are required for a trip segment.
Operators have opportunities to influence the time required to complete the trip segment activities outlined in Figure 3 through infrastructure design and operational choices, such as terminal design, vessel layout, and vessel speed. However, some operational decisions are made based on environmental or regulatory factors rather than schedule maintenance. These may include vessel slowdowns to accommodate vessel traffic or marine mammals and weather-related
factors such as fog, ice, or wind. Because these factors cannot be planned for on a trip-by-trip basis, operators must consider the need for an operating margin, or additional time built into the service schedule, to maintain on-time departures. These considerations are outlined in the following sections.
Minimizing Dwell Time
Dwell time is the time that the vessel is at the dock in between transits. As shown in Figure 3, dwell time includes the time required for passengers to unload and load, as well as time needed for the crew to complete required duties.
Dwell time is often the place in the schedule with the greatest opportunity for efficiencies to be realized. Realizing those efficiencies may allow for an increase in scheduled trips in a given service day by allowing a single vessel to make more trips and increasing the number of vessel landings that can be accommodated at a terminal. Best practices used by operators to minimize dwell time are identified throughout this report.
Looking forward, as electrification of vessels increases and shoreside charging expands, vessel battery charging time or other alternative propulsion method fueling times may become a driver for the dwell time needed at the terminal and could decrease service frequency for some systems. Further research is needed to identify these impacts.
Vessel–Terminal Interface
The vessel–terminal interface, where passengers load and unload the vessel, affects dwell time because passenger traffic flows at different rates depending on the space and connections available. Passenger-only vessels typically load and unload passengers either through one or two narrow boarding stations on the side of a vessel or through one wider boarding station at the bow of the vessel. This research found that reducing the path of travel for passengers results in faster passenger loading (see the Optimizing Capacity by Improving Passenger Movement of Chapter 3 for additional discussion of the findings). Further study and data collection related to the configuration of the vessel–terminal interface, vessel operations, and dwell time are needed to support infrastructure investment and capacity planning decisions for operators.
Similarly, vehicle ferry design affects the time required for the vessel to maneuver in and out of the berth and the time needed to load and unload vehicles.
Table 6 provides a summary of how different factors related to the vessel–terminal interface affect dwell time for passenger-only and vehicle ferries.
Crew Shift Changes and Vessel Refueling
Dwell times during crew shift changes may be longer than during other times of the day. Shift change procedures vary greatly among operators, as do the roles and duties of crew before and after shift changes. Vessel crew shift changes typically need to occur at a homeport terminal. This need influences the operating and service schedule and the length of crew shifts, especially for routes with multiple trip segments that stop at more than two terminals, and should be considered during schedule planning and dwell-time calculation.
While potentially increasing crewing and operating complexity, implementing crew changes away from homeports to achieve operational efficiencies could provide an opportunity to enhance system or route capacity. Additional research on crew scheduling opportunities within the maritime regulatory environment is recommended to support the expansion of ferry systems with multiple routes.
Table 6. Factors affecting dwell time.
| Factor | Effect on Dwell Time |
|---|---|
| Passengers | |
| Access to multimodal connections | Dwell times can be optimized by improving passenger flow rates through the terminal by minimizing walk distance to and from multimodal connections and providing clear wayfinding. Best practices for integration with multimodal connections are discussed in the Multimodal Connections section of Chapter 3 as well as in Payne et al. (2013). |
| Boarding station width | The wider the boarding station and connecting ramp, the greater the number of people who can load and unload the vessel during a given time period. |
| Fare collection and location | Processing payment as passengers are boarding a vessel takes time, especially when handling cash payments. Locating and processing fares prior to queuing allows passengers to board the vessel quickly and can reduce dwell time. |
| Gangway and ramp design | Dwell time can be improved by making walkways as accessible as possible, especially for passengers with personal mobility devices, strollers, or bicycles, which may slow passenger flow rates or require assistance on ramps. Design of overwater elements may be constrained by limits on overwater coverage or construction costs. |
| Layout and vessel arrangement | Side-loading requires passengers to decide which way to turn and walk as they enter the vessel, whereas in a bow-loading vessel, more passengers can walk straight into the vessel before reaching a decision point and turning, therefore delaying their decision on a path to take and improving passenger flow onto the vessel. |
| Number of boarding stations | More boarding stations allow for more passengers to load or unload the vessel during a given period. Depending on security and fare collection methods, each boarding station may require a dedicated crew member during boarding. |
| Vessel connection to dock | Vessels that typically push into the dock (bow-loading vessels) or are specifically designed to fit their berth (SeaBus) may minimize or eliminate the time required to tie up. |
| Walk distance to vessel | The distance and time required for passengers to walk from the terminal to the vessel depend on the layout of terminal and vessel landing infrastructure. It takes more time for passengers to walk along multiple paths that switch back than it does if there is a short ramp to the vessel. |
| Vehicles | |
| Multiple-lane loading/unloading | For larger vehicle vessels, dwell time can be significantly reduced by increasing the number of vehicle lanes that can simultaneously load and unload. |
| Multiple vessel berths | For terminals serving multiple vessels, increasing the number of vessel berths reduces the risk of arriving vessels waiting to land at an occupied berth. Multiple vessel berths also provide redundancy in case of equipment breakdown or terminal maintenance. |
| Simultaneous passenger and vehicle loading/unloading | Providing separated passenger loading via an overhead ramp or separated walkway on the vehicle ramp reduces dwell time by allowing passengers and vehicles to safely load and unload simultaneously. |
| Vehicle lane design | Straight, rather than curved, length of vehicle lanes on the vessel maximizes the vessel capacity and simplifies loading. Loading vehicles into curved lanes can cause delays to loading and impacts on total vessel capacity, especially if it is difficult for large vehicles to stay within their lanes. |
| Vessel type (single-ended vs. double-ended) | Double-ended vessels require less maneuvering to depart the dock since they can pull away from the dock facing the direction of travel, whereas single-ended vessels must often reverse out of their berth and turn around before sailing, or back into the slip during landing, increasing maneuvering time. |
Longer dwell times, or time out of service to travel to and from a fueling facility, may also be required for some sailings if vessels need fuel or charging during the service day. Typically, operators schedule refueling at the beginning or end of the service day, or, if needed during the service day, during a period of lower demand such as mid-day.
Impact of Ridership Types
Findings from the operator questionnaire indicated that no responding operators tracked data on the comparison of service during regular commute times to service focused on recreational or special-event users, although several operators reported anecdotal evidence that dwell times during the commute windows are noticeably shorter and more consistent than dwell times during weekends or special events. During the commute windows, travelers are typically regular ferry commuters familiar with queuing and fare payment processes, and passenger or vehicle traffic is normally only heavy in one direction. During weekends or special events, more tourists and first-time passengers may be traveling, and demand may be heavy in both directions. Delays can occur because new users need direction from staff or increased time to make their way through the terminal, pay fares, and board the vessel, or when tourists ask questions to staff during fare payment or boarding. Additionally, the pace of walking for crowds that are mostly tourists or recreational travelers has been observed to be slower than that of commuting travelers.
An operator with three passenger-only ferry routes in Washington State reported that questions from tourists can add around a minute to each dwell time. A passenger-only ferry operator in New York reported that it adds extra dwell time to the summer weekend schedule for some routes to account for slower boarding times, especially for the higher number of passengers with bikes or strollers.
Operational modifications that support passenger throughput and may reduce the impacts of new users on dwell time are discussed in the Optimizing Capacity by Improving Passenger Movement section of Chapter 3.
Factors that Affect Ferry Trip Time
Each segment of the ferry trip, including departing the ferry terminal, transiting to the next terminal, and arriving at the destination terminal, contributes to the total ferry trip time. There are factors within each segment of the trip that affect how quickly the trip can be made.
Departure Time
- Maneuvering: Maneuvering requirements for leaving the terminal depend on vessel design and terminal layout. While double-ended vessels have minimal maneuvering needed to depart the dock because they can pull away from the dock facing the direction of travel, single-ended vessels must often reverse out of their berth and turn around before sailing, or back into the slip during landing. Depending on the size of the vessel, the open space available for maneuvering, and the presence of environmental considerations that may restrict vessel speeds or prop wash, the process of maneuvering away from the dock can take up to several minutes.
- Procedures: Ferry services may require a policy decision on whether a departing vessel has flexibility to wait for passengers or vehicles making their way toward the vessel after the scheduled departure time, or if the service maintains a strict schedule and leaves riders behind on the dock. This decision may depend on factors such as frequency of sailings, demand levels, the layout of terminal elements, and the location of fare processing.
Transit Time
Transit time is the time that the vessel is underway between the departure and arrival terminals. Transit time can be affected by known restrictions, such as slowdown or low-wake zones, as well as unplanned restrictions, such as waterway and marine mammal traffic and weather conditions. Transit time can also be affected by the priorities of the operator and its customers, whether these are related to fuel savings or time-competitive travel. Some of these elements affecting transit time include:
- Environmental considerations: Vessel wake impacts on sensitive shorelines or noise impacts to marine mammals or other wildlife may limit vessel speeds. Some impacts may be mitigated through vessel design, such as use of hydrofoil, or by a change in operating speed.
- Fuel consumption or emissions reductions: Operators may have a targeted level of fuel consumption or emissions reduction based on policy or operating cost levels, and this may affect the planned vessel cruising speed and the ability to travel at a higher-than-planned speed when the vessel is running behind schedule. Additionally, emissions targets that require additional or heavier equipment or housing of hybrid equipment may have impacts on vessel operating speed.
- Operating conditions: Even within the same ferry system, different routes can face unique navigational challenges depending on available water depths, waves, currents, wind conditions, and adjacent structures or obstacles to navigation. Operating conditions on a route can change daily or seasonally depending on variables such as tides and shifting sands.
- Type of service: The targeted market for each route may affect required vessel speeds. For example, commuter-focused services may offer competitive travel times that require a high sailing speed, while tourist-focused services may prioritize amenities or operating cost savings over sailing speed.
- Waterway traffic: Variability in waterway traffic, including ferries, shipping, and human-powered watercraft, can complicate ferry service schedule planning. Some operators may experience these challenges seasonally, especially as recreational boating increases in warmer months.
- Weather-related conditions: Transit time is affected when vessel speed is slowed due to wind, limited visibility, waves, sea state, or in-water obstructions such as logs and ice.
Arrival Time
The frequency of sailings is also controlled by the availability of berths on arrival at each terminal. The TCQSM (Ryus et al. 2013) provides a computational worksheet tool for calculating vessel service time (seconds per vessel) and berth capacity (vessels per hour).
In addition to the dwell time required by each vessel, other variables can affect the berthing capacity and arrival time at the terminal:
- Environmental considerations: The presence of sensitive shorelines can affect the speed at which vessels approach the dock as well as the space available for maneuvering near the berth.
- Maneuvering: In-water space availability determines whether multiple vessels can approach and depart berths at the same time. If a facility is located in a narrow waterway that does not have adequate space for multiple vessels to maneuver in and out of the facility simultaneously, schedule delays can occur when vessels have to wait for other vessels to clear the waterway.
- Schedule planning: Ferry users (especially those commuting to work or attending special events) may want to land and depart at certain times. At terminals located near a downtown or job center, berths may be at capacity during peak commute times, even if there is availability throughout other times of the day.
Scheduling an Operating Margin
Operating margin is the time built into a schedule to account for longer-than-average dwell times or transit times to decrease the risk of a ferry running behind schedule. Operator responses to the research questionnaire indicated that this additional time can be built into either the transit time or dwell time of every trip or of just a few select trips throughout the day. More information and a procedure for determining the operating margin (Equation 1) are provided for passenger-only ferries in the Operating Margin section of Chapter 3, and information related to vehicle ferries is provided in the Operating Margin section of Chapter 4.
Governance and Policy Factors
As a transportation service, ferry systems are often guided by the governing body and policy decisions that establish service levels or service characteristics and define the overall system capacity. Bruzzone (2012) provides a general overview of funding sources relevant to ferry transportation. The sections that follow provide an overview of common governance structures and funding considerations and outline those factors that affect ferry system capacity planning.
Governance and Funding
The mechanism through which ferry services are funded, owned, and operated is known as governance. How a ferry system is governed can affect the service levels and assets necessary to operate service that, in turn, determine the system capacity. There are three basic governance models used in the delivery of ferry service. These are outlined in the following sections, which discuss how their governance affects capacity planning through level of service and capital assets.
Privately Owned and Operated Service
In a privately owned and operated ferry system, service is provided by a private operator, without agency involvement. Unlike publicly owned or operated systems, privately owned and operated ferry providers are ineligible for most federal grants for capital improvements or local funding subsidies. Therefore, to sustain operations, private ferry systems must recover all capital and operating costs through fares and non-fare revenue such as concessions. Examples of private ferry operations are Fire Island Ferries (NY) and Star Line Ferry (MI).
Capacity planning considerations for privately owned and operated services include:
- Capital assets: Capacity planning may be driven by keeping costs as low as possible to make a profit.
- Funding: Capital and operating expenses are typically funded through fares and concession revenue.
- Level of service: Service schedules are typically developed around times of high demand to maximize profitability and minimize loss.
Public–Private Partnership
In a public–private partnership, a governing agency contracts for provision of transportation service, with varying options for ownership and maintenance of assets. For example, the agency may own terminals and vessels and contract with a private company to operate service and staff terminals. Examples of public–private partnerships in use in 2021 include:
- MBTA Ferry (MA): Ferry service in Boston Harbor that is funded and owned by the Massachusetts Bay Transit Authority (MBTA) and operated through a contract with Boston
- NYC Ferry (NY): Funded and owned by New York City Economic Development Corporation (NYCEDC) and operated through a contract with Hornblower Cruises. Assets are owned by NYCEDC, and Hornblower provides operating staff, including management and support, vessel crews, and terminal and maintenance staff. The fare policy ties the cost of a single trip to the cost of a subway fare ($2.75 for most riders in 2021).
- San Francisco Bay Ferry (CA): Funded and owned by the Water Emergency Transportation Authority (WETA) and operated through a contract with the Blue and Gold Fleet.
Harbor Cruises. Of the ferries used to provide service, two are owned by MBTA, and the rest are owned by Boston Harbor Cruises and leased to MBTA.
Capacity planning considerations for services operated by public–private partnerships include:
- Capital assets: Because service is publicly owned, the governing agency has access to state and federal grant funding for capital projects.
- Funding: Capital and operating expenses are typically funded through a combination of fares, public subsidies, grants, and concession revenue.
- Level of service: The contract with the operator typically stipulates agency control over aspects of the service such as fare levels and service schedules, and stipulates requirements on the operator such as data and revenue reporting and performance measurements and targets.
Direct Agency Delivery
Under direct agency delivery, a public agency manages and operates the service. This model provides to agencies the most control over service levels and standards but also requires the greatest commitment of infrastructure and resources. These agencies establish service policies, provide and maintain assets, and provide crew and staff. Examples of direct agency delivery of service include:
- Ferry systems owned and operated by state agencies, such as WSF, North Carolina Department of Transportation Ferry System, and the Alaska Marine Highway System.
- Ferry systems owned and operated by local entities, including county governments or local transportation districts, such as Staten Island Ferries, operated by New York City Department of Transportation; Kitsap Fast Ferries, operated by Kitsap Transit; King County Water Taxi, operated by King County Metro; and Casco Bay Lines, operated by the Casco Bay Island Transit District.
Capacity planning considerations for agency-operated services include:
- Capital assets: Because service is publicly owned, the governing agency has access to state and federal grant funding for capital projects.
- Funding: Capital and operating expenses are typically funded through a combination of fares, public subsidies, grants, and concession revenue.
- Level of service: The governing agency has direct control over all aspects of the service, including fare levels, service schedules, and performance measurements and targets.
For systems governed through public–private partnerships or direct agency delivery, multiple state, federal, and local sources can be used to fund operating costs, such as through tax districts and levies, and capital costs through grants from state and federal agencies, such as state department of transportation agencies and the FTA or FHWA. Eligibility for specific funding opportunities may depend on service characteristics such as location (urban or rural), system route miles, and annual ridership. When planning service and capacity, operators should consider opportunities that may provide access to funding, such as application of electric charging or alternative fuels and designation as a marine highway system (vehicle ferries only).
Policy Factors
Policies influencing ferry system capacity planning may be established at the governing agency, local municipality, or other levels, depending on the system of governance. Some of the policy factors that can influence capacity planning include:
- Emergency response: Ferry planning and funding can be tied to a system’s readiness and capacity to provide emergency response. For example, the San Francisco Bay Area WETA was established to provide and coordinate water transportation services following natural disasters and transportation disruptions. A component of WETA’s system capacity planning is based on the percentage of downtown San Francisco’s daytime population that could be evacuated following an emergency event (San Francisco Bay Area Water Emergency Transportation Authority 2016).
- Environmental considerations: It is anticipated that emissions reduction goals and evolving technologies will make alternative fuel use in ferries much more common. Potential impacts of electrification and other alternative fuel use on capacity planning include increased dwell time requirements and space requirements at the terminal (discussed in this chapter in the Accounting for Future Space Needs section).
- Equity: Policies aimed at promoting social and environmental equity may influence where service is provided and at what levels.
- Fare policy: Fare levels have an impact on ridership demand and capacity requirements. Additionally, fare options such as integration with regional transit systems and use of proof-of-fare systems affect fare collection facility and terminal capacity requirements. The relationship of fare payment options to terminal capacity planning and dwell time requirements is further discussed for passengers in the Fare Collection and Passenger Counting section of Chapter 3, and for vehicles in the Expediting Fare Collection and Passenger Counting section of Chapter 4.
- Mandated service levels: Minimum levels of service for a ferry system may be established by its governance. As an example, WSF schedules are based on minimum service hours established for each route by the Washington State legislature through the budgeting process.
- Performance measures: Ferry systems often use various performance measures and targets to guide operations and service planning, and these can have an impact on or a relationship with capacity. A system that prioritizes on-time performance may end up reducing overall capacity by increasing scheduled dwell time and operating margin to reduce the risk of late departures, or even of departing without filling a vessel, in order to maintain its sailing schedule. If a priority is reducing passenger or vehicle wait times, a system may require a vessel with capacity to serve peak demand that is oversized for typical, non-peak demand.
- Service goals: The role of ferry service within the regional transportation system strongly influences capacity planning. For example, a system in an urban setting may be used to provide a commute choice in place of bridges, tunnels, or equivalent traffic lanes and be directed to provide schedules and capacity focused on inducing walk-on passengers to remove single-occupancy vehicles from roadways, whereas a lifeline route may be tasked with providing schedule and vessel capacity to accommodate most vehicle traffic and movement of goods to support the livability of a geographically isolated community.
Performance Metrics to Measure Capacity
Many ferry systems monitor how reliable their service is through performance metrics such as on-time performance and number of completed trips. If a system is not meeting these performance measure targets, this can be an indication that there is a capacity issue. Weather, vessel or terminal mechanical issues, and crew shortages can also have an impact on service reliability.
Trends in data such as passenger or vehicle volumes, service reliability, and weather can be evaluated to understand how to address underlying issues and improve service reliability.
Performance Metrics
Specific performance metrics can measure the level of service being provided to users and identify where capacity adjustments or investments are needed. In addition to measuring system performance in relation to quality of service and capacity, performance metrics can also communicate the need for investments to users and decision makers. Examples of performance measures related to capacity planning include:
- Farebox recovery: Revenue from fares divided by total operating costs for a given period. Capacity planning, including vessel and terminal design, may take into account targets for revenue levels, operating costs, or farebox recovery.
- On-time performance: The percentage of trips that arrive or depart within a targeted number of minutes from the schedule. Poor on-time performance can be related to various issues and may be improved through schedule adjustments, increased operating margin, or increased route capacity.
- Passengers or vehicles left behind: The number of passengers or vehicles that are left waiting at the dock (in holding or queuing) after a full sailing departs. While the vessel capacity utilization measures ferry system capacity once passengers and vehicles are on a sailing, this does not provide the number of passengers or vehicles left on the dock. Knowing the number of vehicles or passengers left behind provides the critical information needed to identify when and how extensive the capacity constraints are. Many ferry operators cannot measure the vehicles or passengers left behind due to limited technology or investment needed to track this metric. This has been identified as a gap in existing research that needs further analysis.
- Reliability index: The percentage of scheduled trips that are completed. Reliability can be calculated as actual trips divided by scheduled trips, or as actual trips less weather-, medical-, or rescue-related cancellations divided by scheduled round trips. Reliability affects overall system capacity and quality of service for users. Reliability challenges may require operational or capital investment.
- Vessel utilization: The number of trips with vessel capacity filled, or an average of the amount of total vessel capacity filled on sailings, calculated in the peak travel direction or both directions. Vessel utilization can indicate how well or poorly vessel capacity is aligned with demand.
Table 7 provides examples of capacity-related performance measures and target metrics used by operators.
System Redundancy
System redundancy is necessary to increase the likelihood of maintaining the scheduled system capacity and meeting performance goals. For some systems, governance and policy decisions may dictate reliability requirements and risk tolerance. System components that support system redundancy include:
- Fleet spare ratios: All ferry vessels require some level of time out of service for planned or unplanned maintenance. To maintain all vessels without disrupting service, a fleet must be sized with adequate backup vessels to allow all vessels to receive required maintenance. Backup vessel requirements may be complicated by varying vessel size needs for different routes within the same system. Determining the necessary spare vessel ratio is a policy decision dependent on risk tolerance for maintaining scheduled service and funding.
- Vessel berths: Sufficient operating berths are needed to maintain service without disruption in instances of terminal maintenance or vessel breakdown.
Table 7. Example performance metrics by public ferry systems.
| Agency/System | Metric | Measurement | Target* |
|---|---|---|---|
| British Columbia Ferry Services Inc./BC Ferries1 | On-time performance | Percent of trips departing within 10 minutes of scheduled departure time | 91% |
| Employee safety index | (Frequency x severity) / 1,000 | 0.39–0.60 | |
| Customer safety index | Number of passenger injury incidents / 1,000,000 passengers | 6.90–11.90 | |
| King County Marine Division/King County Water Taxi | On-time performance | Departure within 5 minutes of scheduled sailing time | 98.6% |
| Reliability | Number of completed trips | 98% | |
| NYCEDC/NYC Ferry | On-time percentage | Arrival no more than 5 minutes after the scheduled time Departs no more than one minute before scheduled time | 94% |
| Completed trip percentage | Arrives at landings within 30 minutes of scheduled arrival | 97% | |
| Level of service | Service frequency | Aim to provide service approximately every 30 minutes at peak times, and every 60 minutes at off-peak times | |
| Washington State/WSF | On-time performance | Percent of trips departing within 10 minutes of scheduled time | 95% |
| WETA/San Francisco Bay Ferries | On-time performance | Arrives no more than 10 minutes later than scheduled arrival | 95% |
* Performance targets are the typical targets used by operators and may have been adjusted due to COVID-19 conditions.
1 Source: BC Ferries 2021.
- Vessel tie-up: Vessels that are not in service need adequate space to tie up.
- Workforce: Adequate workforce levels (both the overall size of the workforce and the number of people with specific training and credentials) are needed to maintain reliability and avoid service disruptions. Workforce levels must account for variations in crew numbers that arise from seasonal schedules, on-call and relief crew, and complications in dispatch.
Demand
Ferry system capacity planning requires policy decisions regarding what factors influence service level planning and how reliable the ferry service must be, which determine operating and capital requirements.
Current and Forecast Ridership Demand
Current and forecast ridership demand influence what system capacity the operator must plan for, which determines capital and operating needs. Ridership forecasts and demand models are not exact; rather, they provide a tool for risk analysis in capacity planning for vessel and terminal investments. Demand considerations that influence capacity include:
- Design of capital investments: Vessel size is a key capacity decision for rural systems that operate with one or two vessels that may be expected to serve the system for the length of
- Targeted level of demand: Ridership demand for ferries can be highly variable by season, day of the week, or time of day. In order to plan vessel and system capacity for current and forecast demand, ferry operators or governing agencies must select the level of demand to use as the basis for capacity. Typically, operators do not plan for peak demand capacity (for example, the day of the year with highest demand) because it would leave vessels and facilities extremely oversized most other days. A more reasonable capacity planning target for level of demand could be the 90th percentile demand day, meaning that from 100% of trips sorted in the order from the highest to the lowest volume, the targeted capacity would represent the 90% spot on the list.
- Vessel utilization: Operators and governing agencies must also account for directional, daily, and seasonal variability in demand and their implications on vessel utilization. While it is undesirable to routinely fill vessels and leave passengers or vehicles at the dock to wait for the next sailing, if vessel and terminal capacity are not typically reached, this can represent unnecessary operating and capital costs.
their useful lives (typically 30 to 50 years). Vessel design must take into consideration the size needed to accommodate future demand levels without oversizing the vessel and incurring unnecessary operating costs.


