

CHAPTER 4
Capacity Concepts and Analysis Methods: Vehicle Ferries
While many capacity concepts for vehicle ferries are similar to those of passenger-only ferries, there are key differences due to the operational and terminal infrastructure requirements for carrying vehicles. These requirements include larger terminal space requirements for queuing vehicles, the terminal infrastructure for vehicle loading ramps, and coordination with the capacity of connecting roadway infrastructure. While this chapter focuses on capacity concepts and analysis methods for vehicles, the capacity concepts and analysis methods related to passenger facilities and throughput presented in Chapter 3 also apply to most ferry services carrying vehicles and walk-on passengers.
Quantitative procedures outlined in Chapter 4 include those presented in the discussions of Equation 3: Using AEU to calculate vehicle capacity of the vessel, Equation 4: Estimating vehicles left behind, and Equation 5: Sizing vehicle fare collection facilities.
Optimizing the Service Schedule
The following sections identify ways to optimize the service schedule by accounting for the operating margin, reducing dwell time, and using demand management tools.
Operating Margin
Vehicle ferries experience periods of heavy traffic where dwell time takes longer and sailings become later and later until the heavy traffic subsides. Additionally, systems may experience long dwell times due to incidents such as a stalled vehicle or medical emergency. To account for longer-than-average dwell times in the service schedule, vehicle ferry systems must determine the amount of time that accounts for these periods. Scheduling extra dwell time for designated sailings allows ferry service to get back on schedule.
Equation 1 (in Chapter 3) presents a method for assessing operating margin for both passenger-only and vehicle ferries.
Minimizing Dwell Time
For ferries that serve passengers and vehicles, the time required to load and unload vehicles is typically the largest component of dwell time. The design and layout of terminal elements and operational factors can affect the amount of dwell time required for vehicles to load and unload the vessel. Operators responding to the questionnaire provided best practices for minimizing dwell time. Equation 9-4 of the TCQSM (Ryus et al. 2013) provides a procedure for calculating the total time required to load and unload vehicles. Table 16 provides a summary of best practices identified by operators responding to the questionnaire.
Table 16. Summary of vessel loading best practices from operators.
| Best Practice | Opportunity | Challenges |
|---|---|---|
| Locate fare collection toll booths upland of a prepaid holding area | Maximizing the amount of fare processing that takes place before the vessel loading process allows for faster loading, which decreases dwell time. | Requires adequate upland space for vehicle holding area, ideally with capacity for a full vessel load of vehicles (or multiple vessels for terminals serving more than one route), plus space to accommodate preferential loading lanes and queuing inefficiencies |
| Use a vehicle reservation system | Vehicle numbers and sizes are known before sailings, reducing vehicle processing time and facilitating vessel loading. | Increased cost to implement reservation system; additional holding space required |
Optimizing Capacity with Demand Management
For vehicle ferry services, vehicle capacity is often reached before passenger capacity. Because of this, shifting riders from their vehicles to walking on the ferry or spreading the peak vehicle demand can help increase the capacity of the system to serve more people without requiring capital investment in new vessels.
Potential demand management strategies that can be used by operators to promote mode shift or spread peak demand, thereby maximizing the use of existing assets, include those discussed in the following subsections.
Mode Split Change Strategies
- First- and last-mile connections: Partnership with transit agencies to improve connections, including synchronization of schedules, can help move more passengers from vehicles to walk-on. Additionally, connections to terminals can be improved through coordination with microtransit and improvements to pedestrian and bicycle connections.
- Pricing strategies: Reducing the cost of walk-on or bicycle fares relative to vehicle fares can promote mode shift to increase walk-on ridership.
Demand and Operational Strategies
- Enhanced user information: Through technological improvements, customers can see when there is space available on the vessel or when there are shorter terminal queue lengths, which can help spread the demand over the day.
- Increase service hours: Capacity of a route or system can be increased through expansion of the service day or increased frequency of sailings. While some service expansion can be realized with existing assets, schedule planning must take into account the maintenance and relief needs through redundancy of the fleet, as discussed in the System Redundancy section of Chapter 2. If mode shift is also a focus for the route, a corresponding increase in service hours for connecting transit modes is required.
- Pricing strategies: Implementation of demand-based pricing, where fares are higher during daily, weekly, or seasonally peak travel times, can help spread and balance demand.
- Terminal operational efficiencies: Implementation of operational efficiencies, such as multiple-lane loading/unloading or synching traffic signals for connecting roadway intersections, can increase how quickly vehicles can be loaded and unloaded at the terminal and increase system and route capacity.
- Vehicle reservation system: Where feasible based on availability of queuing space at terminals, operational and staffing support, and on-time performance of the route, implementation of a vehicle reservation system can spread demand throughout the day by directing customers to sailings with available space.
Table 17. Bicycle management examples – vehicle ferries.
| Service | Bicycle Loading | Storage on the Vessel |
|---|---|---|
| BC Ferries | Walked on board the vehicle deck | Stored on the vehicle deck |
| Cape May-Lewes Ferry | Walked on board the vehicle deck (both before and after vehicle loading) | Bicycle racks located on the vehicle deck |
| WSF | Most bicycles load onto the vehicle deck before vehicles; late arrivals load after. | Most bicycles are stored on the forward end of the vehicle deck; late arrivals are stored at the end of the deck. |
An example of demand management strategy use can be found in the Washington State Ferries 2040 Long Range Plan (Washington State Department of Transportation Ferries Division 2019), where specific strategies are identified as key tools for accommodating future growth.
Bicycle Management for Vehicle Ferries
Considerations for accommodating and managing bicycles include those of safety (maintaining separation between bicyclists and vehicles), dwell time (additional time to load and unload bicycles if separated from vehicles and passengers), and space (storage at the terminal and on vessels).
- Loading and unloading: Bicycles can be loaded over passenger walkways or vehicle ramps.
- Storage on the vessel: How and when bicycles are loaded and unloaded from the vessel are affected by where they are stored on the vessel. On shorter, protected routes such as river crossings, bicycles can be leaned against a rail. In most cases, bicycle storage on the vessel requires racks or designated space. If feasible, bicycle storage on the vessel should provide protection from weather and water spray.
Examples of how different vehicle ferry systems manage bicycles are shown in Table 17.
Understanding Vessel Capacity and Vehicle Demand
The number of vehicles a vehicle ferry can carry depends on several factors, including route-specific trends in volume and type of vehicle demand as well as the vessel capacity and design. Vessel design considerations include the vehicle footprint and space requirements (AEU) as well as over-height or large vehicle capacity.
Providing Space for Various Vehicle Sizes
Ferry operators use different standard footprints, or AEUs, to represent the dimensions of a standard vehicle. In Chapter 9, Section 2, Ferry Service and Facilities, the TCQSM (Ryus et al. 2013) provides factors commonly used to compare different vehicle types to a standard-sized vehicle:
- Standard vehicle = 1 AEU
- Recreational vehicle, single-unit truck, or bus = 3 AEU
- Semi-trailer truck = 5 AEU
Depending on the vessel arrangement, capacity for taller vehicles may be limited due to clearance limits. Vessels that do not have an open vehicle deck, such as those with an overhead bridge or two levels of vehicle space, are likely designed with some sections of lower vehicle height clearance than others. Capacity for over-height vehicles must be accounted for in how
vehicles are arranged in holding lanes (possibly requiring a designated lane) and how they are loaded onto the vessel. Operators may plan additional footprint for over-height vehicles to account for the added space needed for staging. For example, BC Ferries plans use the following factor for planning over-height vehicles:
- Over-height vehicle = 1.5 AEU
While the AEU is a standardized measurement used for planning purposes, for planning and communicating vessel capacity, it is advantageous to use an average measurement that realistically represents the number of vehicles that are typically carried on a route. The size of the AEU for a route depends on factors such as what type of vehicles are popular in the area (sedans or trucks), typical commercial vehicle demand, and typical or seasonal demand for recreational vehicles and trailers. Because of differing vehicle demand profiles, a representative AEU may be different between operators, or even between routes for the same operator. Operators must also plan for the space between vehicles, either by including it in the AEU or accounting for it separately. Typically on vehicle ferries, crews direct vehicles onto the ferry and assist drivers in parking as close to the vehicle in front as possible (leaving escape route space between every vehicle or few vehicles as designated by the Coast Guard requirements for that vessel) in order to maximize capacity and minimize the vehicle loading time. Example AEUs used by operators, as provided in responses to the operator questionnaire or found in ferry service planning documents, are presented in Table 18.
Equation 3 can be used to calculate the standard vehicle capacity of a vessel. The equation can also be applied to estimate the capacity of holding or queuing lanes, although that calculation should include more space between vehicles since drivers park themselves and are likely to leave more space between their vehicles than would be left on the ferry.
Equation 3. Using AEU to calculate vehicle capacity of the vessel.
VS = L/(AEU + S) + C
where
| VS |
= number of standard vehicles (rounded down to nearest whole number). |
| L |
= linear feet of straight lanes. |
| AEU |
= length in feet of the AEU used by the service or route. |
| S |
= space between vehicles (if not included in AEU). Note that less space can be planned if crew members assist with vehicle parking on the vessel. |
| C |
= number of standard vehicles that can be accommodated in curved-lane sections. |
Table 18. AEU by operator.
| Operator | AEU Measurement | Over-Height Definition | AEU Basis (if Noted) |
|---|---|---|---|
| BC Ferries | 20 feet by 8 feet 6 inches | 7 feet | Ford F150 |
| Cape May-Lewes Ferry | 18 feet | 13 feet 6 inches | |
| Steamship Authority | 16 feet 11 inches | 13 feet to 13 feet 6 inches (by vessel) | |
| Whatcom County Lummi Island Ferry | 18 feet 6 inches by 8 feet 6 inches | N/A | |
| Non-ferry references | |||
| Car carriers (shipping vessels) | 13 feet 2 inches by 5 feet | 1966 Toyota Corona |
Vehicles Left Behind
Understanding the number of sailings where capacity is exceeded and knowing the number of vehicles left behind during peak periods can support informed capacity planning. Methods for calculating vehicles left behind include those discussed in the following:
- Estimated number of sailings where demand exceeds capacity: This is the count or average of the number of sailings over a certain period of time where any number of vehicles are left behind to wait for the next sailing when a full vessel departs.
- Estimated number of vehicles left behind for capacity planning and real-time wait estimation: For routes with low numbers of vehicles left behind, the number of vehicles remaining in queue or holding lanes can be counted. For routes with higher numbers of vehicles left behind where actual counts are impractical, the number of vehicles can be estimated based on the approximate location of the end of the queue and pre-established vehicle estimates. Equation 4 presents a method for estimating the number of vehicles left behind.
Equation 4. Estimating vehicles left behind.
VLB = L/(AEU + S)
where
| VLB |
= estimated number of vehicles left behind. |
| L |
= linear feet of queuing lanes, including holding area and roadside queuing. For calculating roadside queuing use the distance from holding area minus areas that cannot be used for queuing, such as intersections or driveways. |
| AEU |
= length in feet of the AEU used by the service or route. |
| S |
= space between vehicles (if not included in AEU). Note that space between queued vehicles is greater than the space between vehicles planned on the vessel. |
Vehicle Terminal Capacity Planning and Minimizing Dwell Time
Capacity planning for vehicle ferry terminals focuses on how many vehicles can be held after fare processing, how they are sorted prior to loading, and how quickly they can load and unload the vessel. Habib et al. (1980) provide a detailed overview of procedures used by urban ferry services for processing and holding vehicles at the terminal as well as loading and unloading vessels. The sections that follow provide an overview of operational and terminal design best practices that can help minimize dwell time and support maximization of vessel berthing capacity.
Sizing the Vehicle Holding Area
Planning for queuing and holding lane capacity depends on a variety of factors, including the types of vehicles that use the ferry and the land uses around the terminal. Providing enough space in the vehicle holding area for more than the vessel capacity brings the vehicles closer to where they will load the vessel and provides flexibility for staging vehicles, both of which can serve to reduce the dwell time. The amount of space planned for vehicle holding depends on vessel capacity and the operational practices of the ferry system, as well as the number of routes serving the terminal. Habib et al. (1980) include the recommendation that terminals be sized for the demand estimated to occur 20 to 25 years after the facility is built and for all uses at any one time, including queued vehicles, park-and-ride use, buses, and passenger and employee
parking. However, historical vehicle capacity guidance may become outdated in areas where ridership is anticipated to shift from personal vehicle use to other modes due to mode shift trends or policy decisions.
Table 19 summarizes the design guidelines for holding area capacity used by three vehicle ferry operators. For terminals served by multiple vessel sizes, holding area capacity is designed based on the capacity of the largest vessel.
Lane width requirements often vary by type of use. For example, WSF designates a minimum holding lane width of 9 feet for general traffic lanes; 10 feet for over-height vehicles, carpool/vanpool, and shoulder holding lanes; 11 feet for service and utility vehicles; and 12 feet for accessible lanes.
Optimizing Vehicle Queuing and Holding Area Configuration
Because the amount of space available for vehicle holding at the terminal is often constrained, operators employ different strategies to optimize capacity and vessel loading. The ability to pre-sort vehicle types prior to loading using a reservation system or multiple parallel vehicle lanes allows for faster vehicle loading to minimize dwell time and maximize system capacity. The rate at which vehicles can move through a terminal facility has a direct impact on dwell time requirements.
Table 20 summarizes best practices for holding area design used by different operators to minimize dwell time.
In addition to optimizing the capacity of holding areas and minimizing vehicle loading time, operators may prioritize certain types of vehicles or users when loading, allowing them to move ahead of the general queue and requiring a separate holding area. Operators may choose to designate holding lanes for specific uses, depending on route context and policy decisions, as well as to allow for increased flexibility during vehicle loading. Figure 8 illustrates considerations that affect how much terminal space and how many holding lanes are needed, as well as potential uses that may be given designated lanes or priority loading.
Expediting Fare Collection and Passenger Counting
Fare collection methods and technologies used and the location of fare collection relative to vehicle holding or loading can affect the dwell time and overall capacity of the ferry system. Specific fare processing times depend on the operating systems and policy. For example, the time required for cash transactions can be minimal if exact fare is required, and credit and debit card processing time can vary widely depending on the speed of the network connection
Table 19. Example holding area capacity standards.
| Operator | Planned Holding Area Overload Factor | Separated Queuing Lanes |
|---|---|---|
| BC Ferries | 1.25 times vessel capacity (smaller terminals), 2 times vessel capacity (larger terminals) | Emergency vehicles, large and oversized vehicles, priority vehicles, trucks with livestock or perishable goods, vehicles with reservations |
| Cape May-Lewes Ferry | 2.5 times vessel capacity (Cape May terminal) | Large vehicles, VIPs, mobility-impaired drivers, reservations, standby |
| WSF | 1.5 times vessel capacity (per destination) | Large vehicles, vehicles designated for preferential loading |
Table 20. Best practices for maximizing holding area capacity.
| Best Practice | Opportunity | Challenges |
|---|---|---|
| Add a roadway queuing lane | Extends terminal capacity by accommodating queuing outside of terminal; improves safety and traffic flow by separating queuing vehicles from roadway traffic | Requires coordination with local jurisdiction or department of transportation; may require strategies to minimize impacts to adjacent residents and commercial properties; may be difficult to control queue jumping; reduced quality of service for customers if there is no access to terminal amenities |
| Holding lane length of 10 to 20 vehicles | Allows vehicles to be pulled out as necessary to optimize staging on the vessel while still holding vehicles close to vessel loading | Constrained terminal sites may make optimal lane layouts challenging. |
| Implement technology to support remote queue monitoring | Provides real-time information to users regarding wait times and collects queue length data to inform route and terminal capacity planning | Cost to implement and maintain monitoring systems. Tracking and analysis of queue length data would require dedicated staff time. |
| Stage vehicles as close to the vessel as possible | Maximizes efficiency of vehicle loading and reduces dwell time | Requires space for holding area over or near the water with capacity for at least a full vessel load of vehicles |
and transaction validation requirements. Table 21 provides examples of the time required per transaction based on the type of fare, as presented by Habib et al. (1980).
The average vehicle processing rates experienced by each operator depend on a number of variables, including the rates of use of reservations, credit cards, and multi-fare passes. As an example, the WSF Terminal Design Manual (Washington State Department of Transportation Ferries Division 2016) provides an average vehicle processing rate for planning purposes of 2.5 vehicles per minute per toll booth, or 150 vehicles per hour per toll booth, although it is noted that actual rates vary between terminals and throughout the day.
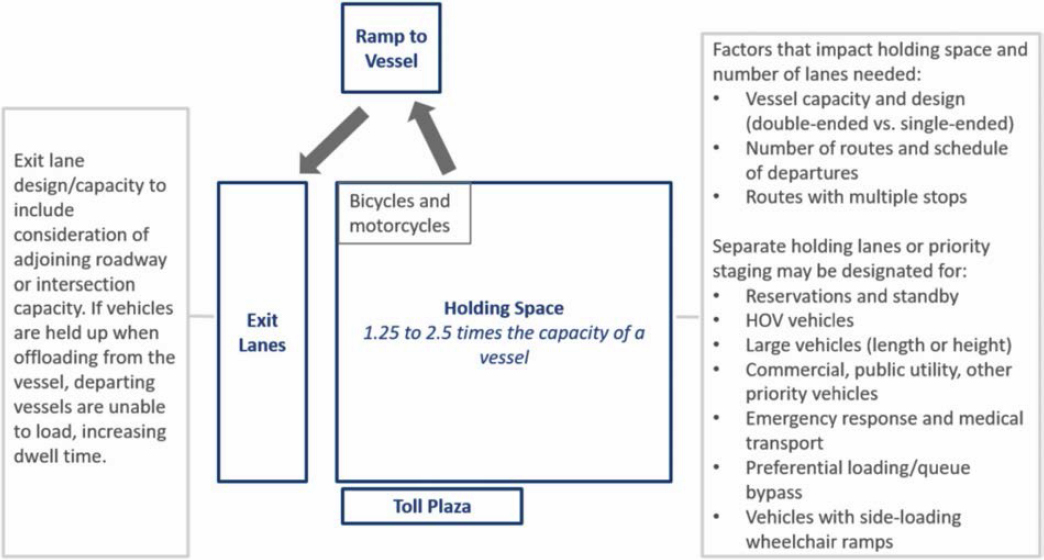
Table 21. Fare collection transaction time (Habib et al. 1980).
| Type of Fare | Number of Destinations | Time per Transaction |
|---|---|---|
| Cash | 1 | 30 seconds (mean) |
| Cash | More than 1 | Up to 2 minutes |
| Multi-fare pass | Any | As little as 10 seconds |
Planning Vehicle Fare Collection Facilities
A method for calculating the number of toll booths needed to provide a targeted vehicle processing rate during the peak hour can be calculated using Equation 5. This method assumes that holding area capacity can accommodate at least a full vessel load of vehicles. For terminals serving multiple routes, additional holding area capacity and fare processing capacity are required to process vehicles arriving at the terminal for different sailings.
Equation 5. Sizing vehicle fare collection facilities.
T = V(FN)/R
where
| T |
= number of required toll booths. |
| V |
= capacity of the largest vessel serving the terminal (number of vehicles). |
| FN |
= number of ferries departing in the peak service hour. |
| R |
= average vehicle processing rate (vehicles per hour per toll booth). |
Fare Collection and Passenger Counting Methods
Because of the Coast Guard requirement that all passengers be counted, including those riding in vehicles, implementation of technologies for automated fare collection such as license plate readers or radio transponders that could speed up fare collection and reduce dwell time is challenging. Review of potential technologies and alternatives for automated vehicle fare processing is recommended for further research.
Other opportunities to reduce the time required for fare collection, thereby minimizing dwell time and maximizing system capacity, are presented in Table 22.
Planning for Terminal Compatibility
The capacity of the intersections and roadways connecting to the terminal must also be accounted for in ferry system capacity planning. If roadway connections outside of the terminal cannot accommodate vehicles at the rate at which they unload from the vessel and exit the terminal, backups can occur, which may delay vessel unloading and cause unacceptable levels of traffic disruption near the terminal. This is a greater concern for higher-capacity systems with vessels that carry a large number of vehicles.
Considerations and best practices for coordinating the capacity of multimodal connections for passengers are addressed in the Multimodal Connections section of Chapter 3.
Connecting Roadways
At most ferry terminals, unloading vehicles exit the terminal at a single point, and all unloading vehicles must clear the area near the vessel before vehicle loading for the next sailing can begin. Therefore, the capacity and timing of the intersection nearest to the terminal is a key capacity
Table 22. Vehicle fare collection and passenger counting best practices.
| Best Practice | Opportunity | Challenges |
|---|---|---|
| Collect fares in one direction | When possible (especially when ferry is the only or a highly preferable travel option), collecting fares on only one end of a route reduces loading time at the non-fare collecting end as well as facility and staffing requirements. | If there are travel alternatives, some fare revenue may be lost if some users only travel in the non-fare collecting direction. |
| Collect fares on the vessel during transit | Processing fares on the vessel removes the need for upland toll facilities and staff. | Only applicable for services that can process all fares during transit, such as those with small vessels or long routes. It can be challenging to ensure walk-on passengers and passengers in vehicles do not avoid fare payment. |
| Expedite vehicle measuring | If online reservations or online fare purchase is offered, a database of vehicle specifications based on make and model can ensure that accurate dimensions and weights are provided. A potential alternative would be implementation of an automatic vehicle measuring technology. | There are costs associated with implementation and maintenance of vehicle size database or automatic vehicle measuring technology. |
| Online system for vehicle reservations and fare purchase | Spreads demand throughout the service day as people can show up for their designated sailing and avoid sold-out sailings. There can be reduced vehicle processing time involved in verifying reservations rather than processing payments. | Cost to implement and operate reservation technology. Requires holding space to accommodate at least a full vessel load of vehicles, as well as space for standbys. For terminals with multiple routes, holding space needs may be greater. Residents or commuters who regularly use a service may dislike reservation systems. |
planning consideration for vehicle ferry services. Unless all unloading vehicles can be accommodated in exit lanes before the nearest intersection, there is potential for that intersection to become a limiting factor in terminal throughput.
The rate at which vehicles load and unload varies by system. For example, the Lummi Island Ferry System Level of Service Alternatives Analysis (Whatcom County Public Works 2018) uses a rate of 10.7 vehicles per minute (or 5.6 seconds per vehicle) per ramp lane for loading and unloading. Factors that may affect the rate at which vehicles unload from the vessel include the type of ridership (regular commuters or first-time users), the number of large or over-height vehicles, the number of vehicle lanes on the ramp, and the design of lanes (straight or curved).
Potential opportunities to address capacity issues in connecting roadways and intersections are presented in Table 23.
Table 23. Best practices for coordinating capacity with connecting roadways.
| Best Practice | Opportunity | Challenges |
|---|---|---|
| Avoid or control pedestrian crosswalks in exit lanes for unloading vehicles. | Minimize interruptions to traffic flow for unloading vehicles. | Feasibility depends on terminal design and location of pedestrian ramps and walkways. |
| Implement controlled intersections and strategic timing of signalized intersections. | Allow unloading vehicles to exit the terminal without stopping at adjacent intersections. | Requires initial and ongoing coordination with local municipality and department of transportation. |
| Provide two intersection approach lanes for ferries discharging from a one-lane ramp, and three intersection approach lanes for ferries discharging from a two-lane ramp. | Reduce instances of traffic backing up to the vessel by providing added exit lane capacity for unloading vehicles. | Increasing exit lane capacity may take space away from vehicle queuing or holding lanes. |
| Use smaller vessels with more frequent sailings to reduce the size of traffic surges. | If traffic surges from unloading vehicles overwhelm connecting roadway capacity, use of more frequent smaller vessels can reduce impacts. | Increased capital and operating costs are associated with increased number of vessels. |


