
2
Wastewater Surveillance for COVID-19
Wastewater infectious disease surveillance was implemented in many locations in the United States and globally during the COVID-19 pandemic and continues to be used to track ongoing disease outbreaks and the spread of variants. In this chapter, the committee reviews how wastewater surveillance has been useful in understanding COVID-19 in communities and in informing local public health decisions. Although the committee’s task (and the National Wastewater Surveillance System [NWSS]) emphasizes community-level surveillance, in this chapter the committee also includes a few examples of institutional and sub-sewershed sampling (labeled as such) to demonstrate how information has been useful at different scales in ways that may inform the broader potential benefits of national wastewater surveillance.
VALUE FOR UNDERSTANDING COVID-19 IN COMMUNITIES
Since the emergence of COVID-19 in early 2020, U.S. epidemiological surveillance has incorporated a number of conventional data sources to track COVID-19 burdens and trends, including clinical test results and case information, COVID-19 hospitalizations (compiled through the HHS [U.S. Department of Health and Human Services] Unified Hospital Data Analytic Dataset1), and COVID-19 deaths. Each of these data types have limitations that have hindered real-time understanding of community COVID-19 burdens and trends. Routine testing results have been regularly reported for
___________________
1 See https://www.cdc.gov/coronavirus/2019-ncov/covid-data/covidview/index.html.
U.S. counties, usually as new cases per 100,000 inhabitants, but there are issues with this source of data, including the large costs of testing all suspected cases and the biases that come from changes in testing availability. Furthermore, home-based antigenic testing increased greatly in 2022, and positive results may not be reported to public health authorities (Ritchey et al., 2022). This has decreased the use of laboratory-based tests and exacerbated case underreporting (Rader et al., 2022). Although COVID-19 hospitalization and death data lack some of the biases associated with clinical test data, hospitalizations and deaths lag behind COVID-19 infections. Deaths from COVID-19, for example, have been shown to cluster approximately 17 to 21 days after infection (Ward and Johnsen, 2021). In addition to the inherent time lags of hospitalizations and deaths from infections that stem from the progression of the disease, each of these conventional data sources take time to reach public health agencies. This leads to time delays in posting and using the data. For example, the Washington State Department of Health requires 7 days to collect, quality check, and report hospitalization data.2 Time delays differ across data sources and locations and can change over time for a given location.
Wastewater surveillance has been increasingly used to supplement these conventional data sources as it addresses some of the information gaps. Regardless of symptomatic status, a large fraction of individuals infected with SARS-CoV-2 shed virus through their stool (Zhang et al., 2021). Although people also shed SARS-CoV-2 in saliva, mucous, and urine, feces has been shown to be the dominant source into wastewater (Crank et al., 2022). Wastewater surveillance is a passive measurement, meaning it does not require the active participation of individuals in the healthcare or testing systems. As such, it avoids testing availability and behavior biases associated with clinical case data and is not affected by the increasing trend of at-home testing.
Once it was demonstrated that SARS-CoV-2 wastewater concentrations correlated with cases, questions were quickly raised about the potential of wastewater data to provide more timely information on the dynamics of COVID-19 in communities than case or hospitalization data. In other words, could wastewater data be a leading indicator of the traditional surveillance data time series and provide an early warning of clinical trends? If so, could they help direct more timely public health decisions? If rising concentration in wastewater during low-incidence periods was an early indicator of rising cases and hospitalizations, public health officials could make earlier recommendations for social distancing or masking and help hospital administrators decide when to cancel elective surgeries. Likewise, if wastewater concentrations peaked before case data or hospitalizations
___________________
2 See https://doh.wa.gov/emergencies/covid-19/data-dashboard.
peaked, communities could make earlier decisions to scale back their emergency responses (e.g., opening additional COVID-19 units) and use the related resources for other purposes.
In the following sections, the committee reviews how wastewater surveillance has been useful in understanding COVID-19 data trends and spatial distribution in communities, the spread of variants, and the potential for early warning.
Data Trends
Early work on wastewater surveillance of COVID-19 sought to demonstrate that wastewater concentrations correlated with case data collected through standard surveillance. Indeed, data from 2020 showed wastewater concentrations of SARS-CoV-2 correlating closely with case data once clinical testing was available (Ahmed et al., 2020; Graham et al., 2021; Medema et al., 2020; Peccia et al., 2020). In addition to case count data, wastewater concentrations correlated to clinical positivity rates (D’Aoust et al., 2021; Hopkins et al., 2022) and hospitalizations (D’Aoust et al., 2021; Peccia et al., 2020). The correlations between wastewater and epidemiological data were poor, however, very early in the pandemic when clinical testing was not routinely available (Graham et al., 2021). Rather than suggesting a problem with wastewater surveillance, this observation highlighted the ability of wastewater measurements to capture COVID-19 levels and dynamics in the absence of widespread access to and use of testing. Combined, these early reports demonstrated that wastewater measurements were, in fact, a valuable data source for COVID-19 surveillance.
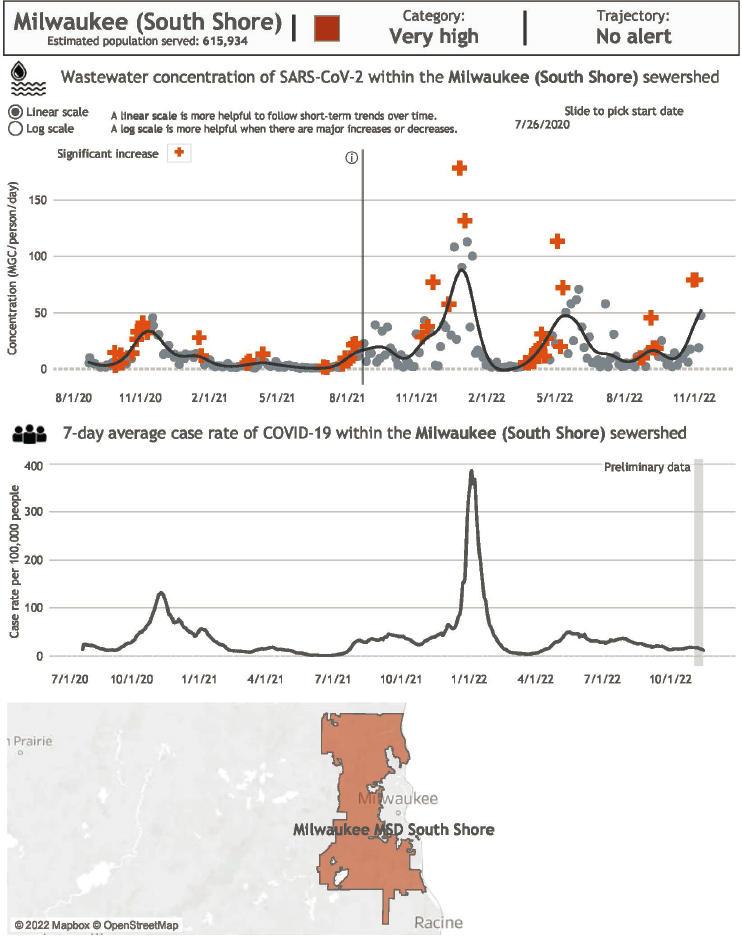
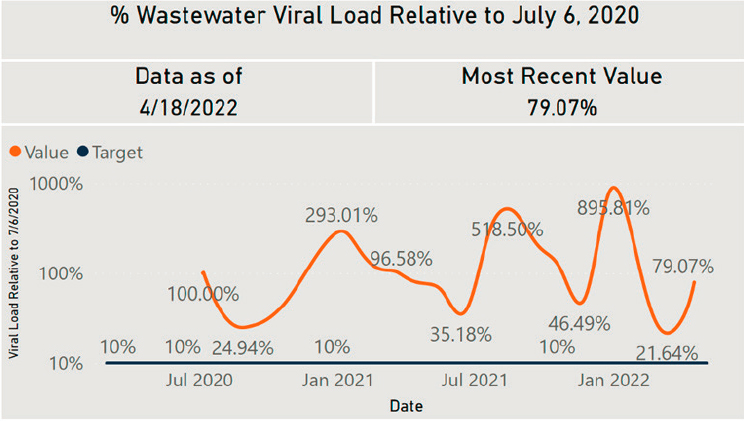
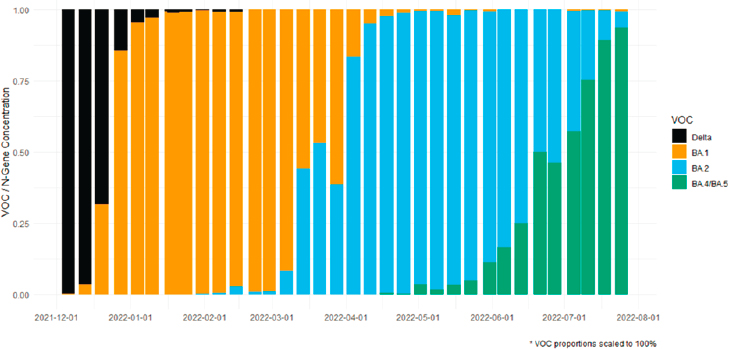
Soon after the early reports showed correlations between wastewater levels and conventional surveillance data for a given locality, both internal and public-facing dashboards were developed to provide up-to-date SARSCoV-2 wastewater levels. Numerous local dashboards have been developed to date, although some have stopped posting data as of summer 2022.3 Some local dashboards present the wastewater data only (see Figure 2-1), whereas others present wastewater data alongside standard surveillance data (see Figure 2-2). In addition to public-facing dashboards, data summaries showing wastewater levels have been posted on internal dashboards and sent in regular emails to stakeholders (see Figure 2-3).
Data in published reports and on dashboards have demonstrated the value of understanding SARS-CoV-2 wastewater data trends in both high and low–infection prevalence settings. In high-prevalence scenarios, quantitative wastewater results identify increasing, plateauing, or declining trends in community infection prevalence. In low-prevalence scenarios, wastewater
___________________
3 See, for example, https://covidwastewatermonitor.wyo.gov.

NOTE: Data are normalized against concentrations of the pepper mild mottle virus (PMMoV), which is commonly found in pepper-based food items and in human feces, to account for dilution by other inflows (e.g., industrial, stormwater) and thereby reduce one source of variability in the data.
SOURCE: Sewer Coronavirus Alert Network, http://wbe.stanford.edu. Courtesy of Zan Armstrong, Alexandria Boehm, and Marlene Wolfe.
SOURCE: https://www.dhs.wisconsin.gov/covid-19/wastewater.htm.
SOURCE: Houston Health Department.
results can help identify when the pathogen begins to circulate in the community or when prevalence starts to increase. The trend data are arguably most valuable when used in combination with other data sources (e.g., to confirm observations from clinical data and investigate abnormal trends). In some cases, wastewater trends are seen before other COVID-19 health metrics (e.g., Peccia et al., 2020), as discussed in more detail below.
Important questions remain about the impacts of different variants, prior infections, vaccination status, and antiviral treatments on the dynamics observed in wastewater, which may affect the correlation between viral load in wastewater and the results of conventional disease surveillance. Vaccination status, for example, may change the shedding levels and dynamics with infection, which would ultimately change the viral trends observed in a sewershed’s wastewater.
There is an interest in using wastewater to estimate the overall COVID-19 disease burden in communities rather than simply using correlations to predict incidence or hospitalization trends (McMahan et al., 2021; Soller et al., 2022). To date, there are limited studies on fecal shedding, especially over time and with different variants, demographics, and vaccine statuses. Ongoing stool shedding studies are critical to help clarify how these variables affect the wastewater trends observed in communities and whether reliable and accurate prevalence predictions are possible with wastewater.
Early Warning
When discussing wastewater data as a potential early warning or leading indicator compared to conventional surveillance data, it is important to understand that the wastewater data could lead conventional surveillance data for two reasons. First, people may excrete the virus in stool before they show symptoms and seek testing. At the time of this writing, there were limited data sets on fecal shedding early in infections (e.g., prior to symptom onset); as a result, there is insufficient mechanistic evidence to establish that measurement of SARS-CoV-2 RNA in wastewater leads clinical testing or hospitalizations by a defined number of days. Second, there may be shorter time delays for wastewater analysis and communication of results to reach public health officials than for analysis and communication of results for clinical tests and reporting of hospitalization data. Wastewater data represent a single measurement per day for a whole sewershed, whereas case data represent many measurements, with samples collected in different clinics and analysis performed in different laboratories with different tests. A hypothetical timeline with the major surveillance steps is presented in Figure 2-4.
Multiple studies have retroactively evaluated the temporal relationship between increases in SARS-CoV-2 RNA in wastewater and reported
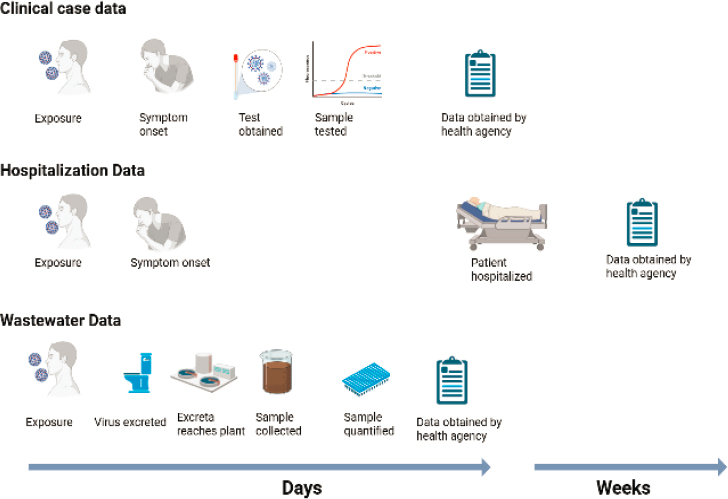
SOURCE: Created with BioRender.
clinical cases (D’Aoust et al., 2021; Fernandez-Cassi et al., 2021; Galani et al., 2022; Peccia et al., 2020; Wu et al., 2022a), and the findings have varied. For example, Wu et al. (2022a) compared retrospective wastewater concentrations (sampling date) from early 2020 with reported cases (testing date) and reported that wastewater trends preceded case data trends by 4–10 days. By contrast, Peccia et al. (2020) reported no wastewater lead time over the same time frame in the COVID-19 pandemic when comparing the wastewater sampling date with clinical specimen collection dates. Feng et al. (2021) also reported no lead time for wastewater surveillance data when sample and clinical specimen collection dates were compared over 12 sewersheds. The different conclusions regarding lead times reported between studies could stem from numerous factors, including
- the phase of the pandemic, with different phases having different testing availability and potentially changing viral shedding characteristics associated with different variants and shifting natural and vaccine-induced immunities (Wu et al., 2022b);
- different amounts of time required for sample transport, analysis, and data reporting;
- different wastewater sampling frequencies;
- the sewershed structure and population; and
- the specifics of the conventional surveillance data to which the wastewater data are compared (e.g., date of specimen collection, date of symptom onset, and date of data reporting).
SARS-CoV-2 wastewater data have the potential to be reported more quickly or along a more consistent time frame compared to conventional surveillance reporting (see Figure 2-4). Indeed, in contrast to what they observed when comparing data by wastewater sampling date and clinical specimen collection date, Peccia et al. (2020) observed a 6- to 8-day lead time in wastewater trends when they compared wastewater sampling date to the date that cases were reported to public health officials. This demonstrates the importance of including reporting time delays when assessing if wastewater data trends lead other surveillance data trends.
Overall, the extent of the wastewater SARS-CoV-2 RNA concentration trends leading clinical case data trends changed over the course of the pandemic (Xiao et al., 2022). Wastewater dynamics data exhibited greater lead times when tests were scarce and when case data reporting to public health agencies was delayed. Whereas studies often consider or discuss case reporting delays in their analyses, they rarely discuss wastewater reporting delays. As with case data, it can take anywhere from a single day to weeks for wastewater samples to be measured and the data to be posted to dashboards or shared with health officials. For accurate assess-
ments of wastewater lead times, it is important to compare the reporting date of both clinical case counts and wastewater concentrations for public health officials.
Whereas the results of wastewater surveillance data leading clinical case data are mixed, wastewater data trends have consistently led hospitalization and death data trends regardless of the phase of the pandemic or the location of the study (D’Aoust et al., 2021; Galani et al., 2022; Peccia et al., 2020). Peccia et al. (2020) reported a 1- to 4-day lead in wastewater data compared to hospitalizations. Similar lead times were reported by Galani et al. (2022), with a mean of 5 days, atlhough Saguti et al. (2021) noted lead times of 19–21 days for wastewater data compared to hospitalization in early 2020. Note that these conclusions did not take reporting delays of either wastewater measurements or hospitalization counts into account. Hospitalization and death reporting delays would result in greater lead times for wastewater surveillance data.
In summary, the upward and downward trends in the levels of wastewater SARS-CoV-2 RNA may not always lead the case data trends when the dates of wastewater sampling and dates of testing are compared. Trends in wastewater SARS-CoV-2 RNA do consistently lead hospitalization trends when dates of wastewater sampling and hospitalization are compared, although with reporting delays, the lead time may be reduced to only a modest amount (1–5 days). The value of wastewater surveillance data as a leading indicator of conventional surveillance data can be enhanced at times when there are significant testing delays and case/hospitalization/death number reporting delays and when wastewater data do not have a significant reporting delay.
Localized Spatial Information
Beyond its use in identifying trends and burdens within a community, wastewater surveillance has been used to compare COVID-19 trends between communities. Throughout COVID-19, numerous organizations and agencies have monitored wastewater in multiple areas served by wastewater treatment facilities (i.e., sewersheds) within a region. The early implementation of wastewater monitoring took place in locations that had the expertise and resources to implement the technology. As such, the sites that participated across the United States were not evenly spaced (see Figure 1-2), and monitoring was not designed to be representative of the U.S. population. Nonetheless, the results from different locations provided insight on the spatial variation in COVID-19 trends and burdens.
Some large cities and counties are served by several wastewater treatment plants and therefore are made up of several sewersheds, allowing more localized spatial information in trend monitoring of SARS-CoV-2
RNA from wastewater treatment plant sampling. For example, to identify localized trends, Houston, Texas collected and analyzed samples from 39 wastewater treatment plants throughout the metropolitan area that collectively serve more than 2 million people (see Figure 2-5). Often, sewersheds within the same U.S. regions exhibited similar SARS-CoV-2 dynamics, but wastewater data can demonstrate when COVID-19 levels are deviating from nearby communities. For example, both Ann Arbor and Ypsilanti are within Washtenaw County, Michigan. The COVID-19 case data are typically aggregated for the entire county on public health dashboards. Wastewater data from the two communities, which are analyzed with the same methods in the same laboratory, have provided higher spatial resolution compared to the aggregated county case data. The wastewater data have identified a number of instances in which the two communities in the same county had opposite trends, as well as different relationships between wastewater levels and reported cases (e.g., Figure 2-6).
Some sewersheds are very large, serving more than 1 million residents. Several studies sampled at locations within a sewershed (e.g., lift stations)

SOURCE: https://covidwwtp.spatialstudieslab.org.
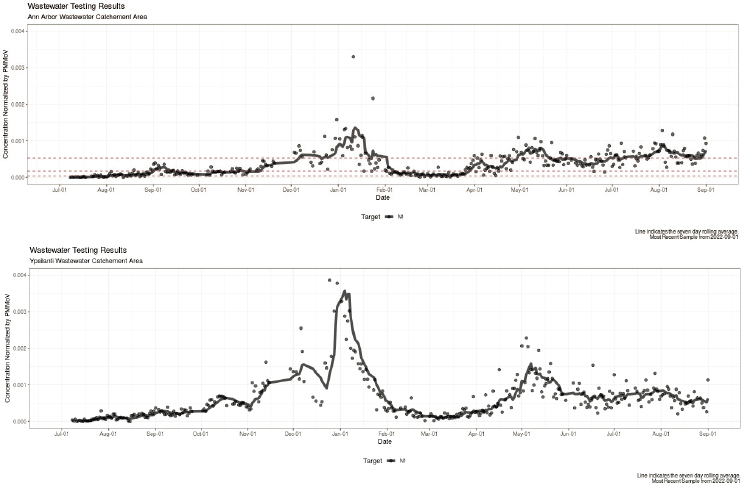
NOTE: PMMoV = pepper mild mottle virus.
SOURCE: https://um.wastewatermonitoring.dataepi.org.
in addition to sampling at the central wastewater treatment plant, which averages trends in viral shedding across the entire sewershed (see Box 1-3). This can identify trends in sub-sewershed data that were not detectable in sewershed-level observations. For example, Layton et al. (2022) divided Newport, Oregon, communities into 22 regions for sub-sewershed wastewater surveillance; the results were combined with other data to identify “hot spots” (see Figure 2-7).
Using wastewater surveillance at a subregional scale can provide information about the spread of disease in areas with reduced availability of clinical testing to improve health equity. Many of the early wastewater surveillance sites focused on college towns, campuses, and urban areas with populations that are not representative of the U.S. population. In their study focused on Jefferson County, Kentucky, Yeager et al. (2021) proposed an approach to site selection that includes overselecting geographic areas

SOURCE: Layton et al. (2022).
that are “often underrepresented in clinical testing, such as low-income neighborhoods and communities of color.”
Comparative analysis of SARS-CoV-2 RNA levels in wastewater across communities is complicated by several factors. Different laboratories and analytical methods can lead to differences in reported SARS-CoV-2 concentrations by greater than an order of magnitude (Islam et al., 2022; Pecson et al., 2021). Different sampling approaches, such as grab versus composite sampling and influent samples versus settled solids sampling, can also affect the SARS-CoV-2 signals. Additionally, variations in the characteristics of a community’s wastewater and wastewater collection system can affect measured SARS-CoV-2 concentrations. Wastewater strength, or the concentration of human fecal matter in the wastewater, is particularly important because the feces are the greatest sources of SARS-CoV-2 in wastewater (Crank et al., 2022). Wastewater strength can vary between sewersheds within a region based on factors such as stormwater contributions to the wastewater, infiltration, the per capita water usage of the community, and various industrial inputs to the wastewater. To address these sources of variation, many groups conducting COVID-19 surveillance have incorpo-
rated normalizing factors (e.g., wastewater flow rates, suspended solids, pepper mild mottle virus [PMMoV], cross-assembly phage [crAssphage]) in their SARS-CoV-2 reporting to facilitate direct comparison of COVID-19 burdens between communities. Normalizing factors are frequently used to adjust for the fecal strength of wastewater. Additional factors that can complicate cross-sample comparisons are the wide ranges in sewershed sizes, which affect the amount of time wastewater spends in the sewage system and thus the degradation of the SARS-CoV-2 signal.
Variants
Mutations in the SARS-CoV-2 genome have led to new variants throughout the course of the COVID-19 pandemic, and some variants have caused increased transmissibility, increased disease severity, and increased ability to escape immunity induced by either vaccination or prior infection, and, as a result, decreased effectiveness of public health measures. Wastewater variant tracking has been used to complement clinical testing for early detection and understanding of the spread of known and emerging variants. Improved understanding of shifts in virus epidemiology can be useful for predicting the risk of a new surge, directing resource allocation and prioritization, and refining public health messaging (Kirby et al., 2021). Two approaches are used to identify variants in wastewater—polymerase chain reaction (PCR) and genome sequencing—each of which has specific advantages.
PCR-based testing for Alpha, Delta, and Omicron variants has become widely implemented in wastewater surveillance efforts (Kirby et al., 2022; Lee et al., 2021; Schussman et al., 2022; Yu et al., 2022) because it provides a more comprehensive representation of circulating variant diversity compared to the small fraction of clinical cases being analyzed for variants (Kantor, 2022). PCR assays are designed based on known variant genome sequences, which are usually determined through sequencing of clinical samples. Although a PCR assay takes time to design, optimize, and validate after an emerging variant is identified, once developed, PCR test results can be generated within hours, producing quantitative data on the relative amounts of variants circulating among the population in a sewershed (see Figure 2-8).
In contrast, sequencing approaches allow for the tracking of emerging variants, including identification of novel lineages, without prior knowledge of the suspected variant sequence (i.e., new variants can be identified de novo). Like PCR-based testing, sequencing wastewater is particularly useful in areas that have low clinical sequencing coverage in the population to determine whether an emerging variant has spread to that area (Crits-Christoph et al., 2021; Karthikeyan et al., 2022; Schussman et al.,
NOTE: VOC = variant of concern.
SOURCE: Hampton Roads Sanitation District.
2022). Sequencing SARS-CoV-2 from wastewater provides substantial information (see Figure 2-9), although sensitivity for detecting low levels is reduced compared to PCR-based methods (Polo et al., 2020). The actual reconstruction of individual genomes is difficult due to the mixture of community lineages and is also time consuming. However, algorithms have been developed to infer the presence and relative abundance of different variants based on key mutations (Grubaugh et al., 2019).
Because of the complexity of the analysis, sequencing has not been performed as frequently as PCR-based testing in some cases. As an example, wastewater from all 14 wastewater treatment plants in New York City has been sequenced twice per month for the presence of novel variants, whereas PCR-based wastewater testing has been conducted weekly since June 2020 (Smyth et al., 2022). Technologies and analysis methods to sequence wastewater have matured substantially since the beginning of the COVID-19 pandemic, and more standardized methods have allowed more laboratories to be able to sequence wastewater samples. While the time from sample collection to results is still longer than a standard PCR test, the time gap between the two is closing.
Wastewater surveillance has in some cases provided information on variants prior to clinical data. For example, in the California Bay Area in late 2021, the Omicron variant was detected with PCR assays in some sewersheds before Omicron cases in the community were detected clini-
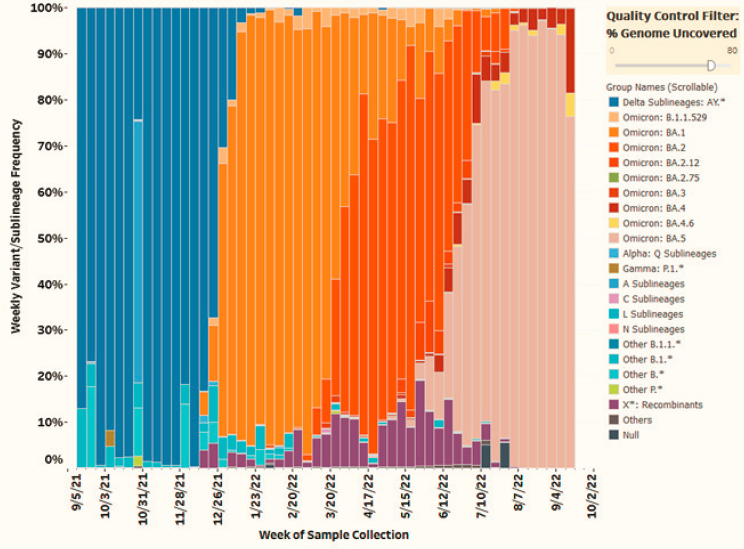
SOURCE: U.S. Food and Drug Administration GenomeTrakr: https://www.fda.gov/food/whole-genome-sequencing-wgs-program/wastewater-surveillance-sars-cov-2-variants.
cally (Boehm and Riley, 2022). In this case, the quantitative PCR assay had been rapidly developed and implemented to capture the introduction of the Omicron variant to the sewershed. Karthikeyan et al. (2022) demonstrated that variants of concern could be identified in wastewater via high-resolution genome sequencing up to 2 weeks prior to their detection in clinical samples.4
USE IN INFORMING PUBLIC HEALTH ACTIONS
In this section, the committee discusses the usefulness of wastewater surveillance data to inform public health decision making and to enhance public awareness of COVID-19 disease transmission, thereby informing public health–related actions.
___________________
4 This retrospective study compared timing based on wastewater sampling date and clinical specimen collection data.
Informing Agency Decision Making
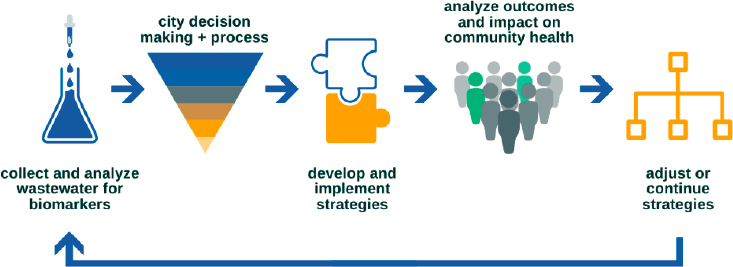
SARS-CoV-2 wastewater data have been used extensively alongside other data sources to better understand the COVID-19 burden in a community in space and time and inform public health actions related to the virus in a community (see Figure 2-10; Kirby et al., 2021). When compared with other sources of information about disease burden, wastewater data can help inform decision making across a wide range of geographical scales (e.g., countries, states, cities, neighborhoods, institutions) and potential public health actions (e.g., warning, testing, vaccination, resource allocation, recommendations and orders concerning masking and social distancing). Although this report focuses on community-scale wastewater surveillance, institutional-scale wastewater surveillance was widely used to guide public health actions at those institutions, particularly colleges and prisons (see Box 2-1 for examples).
SOURCE: https://covid19.tempe.gov.
Wastewater surveillance data have been used to inform agency decision making and support a variety of public health actions at national, state, local, and institutional scales. Four key areas where these data have been particularly valuable include:
- Confirming trends through comparison with other public health surveillance data,
- Informing masking, social distancing, and stay-at-home policies,
- Informing public health resource allocations, and
- Informing clinical resource allocations.
Confirming Trends through Comparison with Other Public Health Surveillance Data
When analyzed in comparison with other disease surveillance information, wastewater surveillance data are particularly useful in informing public health responses. By using multiple metrics in support of decision making, other sources of data are available to investigate anomalous results and increase confidence in observed trends. For example:
- In July 2020, Utah conducted wastewater surveillance across the state to examine the status of viral spread as diagnostic testing decreased. The decrease in levels of SARS-CoV-2 RNA in wastewater provided confidence that disease trends were actually decreasing, consistent with clinical testing data trends (Hopkins et al., 2022; McClary-Gutierrez et al., 2021).
- The Los Angeles County Department of Public Health includes the wastewater SARS-CoV-2 concentration relative to the peak value as one of eight indicators to provide the department with an early alert of concerning trends that could result in future high rates of transmission and/or increased illness severity. The county institutes mitigation measures (e.g., testing, masking indoors, contact tracing) for priority sectors such as skilled nursing units, K–12 schools, and persons experiencing homelessness, depending upon the level of concern.5
- In North Carolina, SARS-CoV-2 wastewater data are one of seven key metrics to monitor for increasing community spread and illness.6 The weekly average SARS-CoV-2 virus copies found per capita from the 25 network sampling sites across the state are evaluated along with the percent of emergency room visits for
___________________
5 See http://www.publichealth.lacounty.gov/media/Coronavirus/data/response-plan.htm.
- COVID-19-like symptoms, the number of COVID-19 hospital admissions, the number of reported COVID-19 cases, vaccination and booster rates, the presence of COVID-19 variants among new cases, and CDC’s COVID-19 community levels by county. All seven metrics are assessed together and compared over time to understand the current threat of the virus in the state.
Informing Masking, Social Distancing, and Stay-at-Home Policies
Together with other disease surveillance data, wastewater surveillance has been cited as a valuable source of information to inform policies regarding social distancing, masking, and lockdowns:
- New Zealand’s Prime Minister Jacinda Arden ended a 3-day lockdown for Auckland based on negative results for wastewater testing despite three new cases of COVID-19 in the county’s largest city. She attributed her decision to community transmission data from wastewater surveillance and announced that the rest of the county would drop to Level 1 restrictions (de Jong, 2021).
- Using wastewater data combined with other surveillance data, the City of Tempe, Arizona, canceled public special events and meetings on March 19, 2020, and the mayor issued an order for the temporary closure of dining, fitness, and recreation venues.
Informing Public Health Resource Allocation
Numerous examples show the value of wastewater surveillance data to inform decisions on the allocation of public health resources, such as testing sites, contact tracing, vaccination centers, and public notification efforts:
- In Ohio, a 10-fold increase in SARS-CoV-2 RNA levels within the state’s wastewater surveillance system triggered an email warning to state and local health departments, utilities, and community leaders. The notifications were used to inform actions and allocate resources (Kirby et al., 2021). Within the warning areas, the state offered local health departments testing, vaccination, and contact tracing unit support. As of May 2022, 1,500 email warnings had been generated (Rebecca Fugitt, Ohio Department of Health, personal communication, 2022).
- In Utah, SARS-CoV-2 RNA levels in wastewater were incorporated in a metric alongside a 7-day positivity rate and 14-day case rates (equally weighted) to rank the state’s 99 small area statistical health units for intervention. Decision makers used this risk rank
- ing, along with other considerations such as the existing resources in the area (e.g., existing testing sites), at a weekly meeting to prioritize where to send resources. An estimated 1.5 million tests were allocated based on this prioritization (Nathan LaCross, Utah, personal communication, 2022).
- In Oklahoma City, ZIP codes with high levels of SARS-CoV-2 RNA in wastewater relative to the rest of the city were identified. The Oklahoma City Public School District then conducted targeted communication to parents of students in high-load areas. Text messages encouraged parents to get tested and vaccinated and provided information on where to get tested and vaccinated. To complement the communication campaign, area hospitals and the health department deployed targeted vaccination and testing efforts in the area (Haley Reeves, University of Oklahoma, personal communication, 2022).
- Through a partnership with the Chesapeake Local Health Department, City Waterworks, Hampton Road Sanitation District, and local university partners, the State of Virginia used sub-sewershed-level wastewater sampling in the Chesapeake area to target vaccination campaigns to high-prevalence areas and educate the public (Cynthia Jackson, Chesapeake Health Department, personal communication, 2022).
- The City of Davis, California, used wastewater surveillance data to determine where to send geotargeted public health communications (e.g., door hangers, texts, phone calls, emails) on how to reduce the risk of contracting COVID-19 and where to get tested.7 For example, in July 2021, 3,000 door hangers (see Figure 2-11) were delivered in response to spikes in levels of SARS-CoV-2 RNA in wastewater in three different neighborhoods.
- In June 2021, the Town of Beaufort, North Carolina, and the state health department issued a joint press release warning that elevated levels of SARS-CoV-2 were detected in the wastewater, although the number of new COVID-19 cases detected had not increased in testing results. Residents of the town were reminded to stay vigilant and get vaccinated (CCHD and NCDHHS, 2021; Virginia Guidry, North Carolina Department of Health and Human Services, personal communication, 2022).
___________________
7 See https://healthydavistogether.org/the-new-pandemic-landscape-and-the-value-of-wastewater-monitoring/.
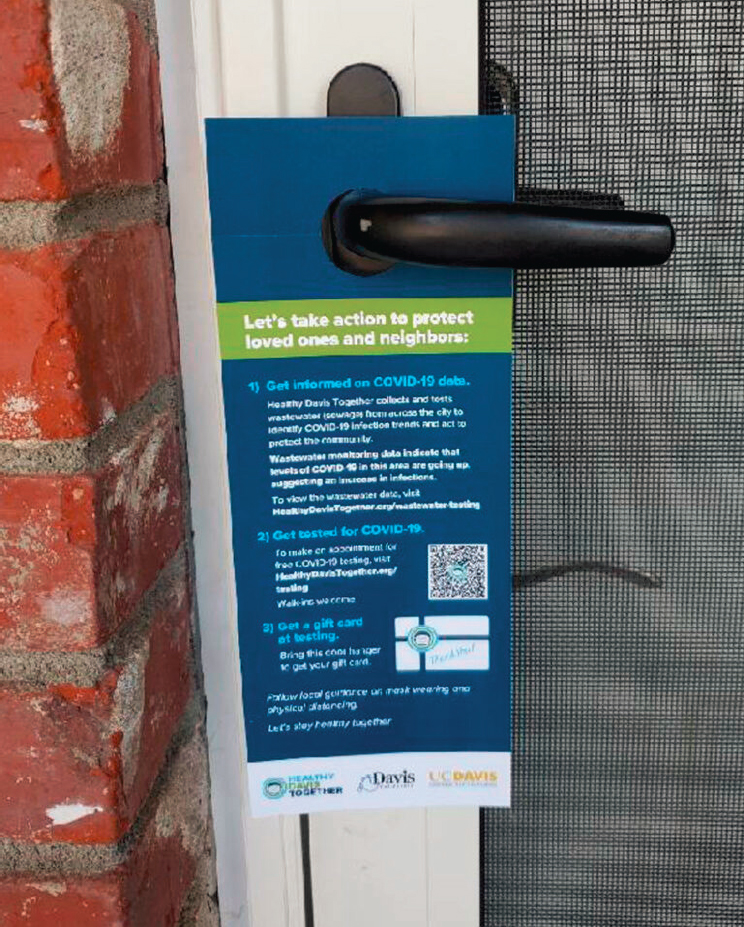
SOURCE: https://healthydavistogether.org/the-new-pandemic-landscape-and-the-value-of-waste-water-monitoring.
Informing Clinical Resource Allocations
A different example of wastewater data use was in the allocation of clinical resources. For example:
- In central Oklahoma, physicians used the breakdown of the Omicron and Delta variants in the wastewater to decide where to allocate monoclonal antibody therapies (Haley Reeves, University of Oklahoma, personal communication, 2022).
- In Houston, Memorial Hermann Health System found the city’s data on levels of SARS-CoV-2 RNA in wastewater to be the most reliable indicator in predicting upcoming hospital capacity needs related to COVID-19. It found that trends of increasing SARS-CoV-2 RNA in wastewater provided an early indicator of an increasing rate of change of hospitalization by 2 weeks and used this information to prepare in the fall of 2021 and in the winter of 2022 when the hospital system’s capacity was stressed. Decisions such as which unit to open next (e.g., post anesthesia care unit or common space), how to ensure adequate staffing for the new unit (e.g., contracts with nursing agencies or rescheduling provider staff), and whether to initiate deferrals of elective surgeries were based on the wastewater trends (Jamie McCarthy, Memorial Hermann Health System, personal communication, 2022).
Challenges Affecting the Use of Wastewater Surveillance Data
There are multiple challenges that prevent local governments from fully adopting wastewater surveillance or fully putting the data to use. According to a survey of local and state governments, either competing priorities or lack of internal capacity was the leading reason for lack of adoption, affecting 72 percent of state and 47 percent of local agencies. Other factors included no clear designation of an agency responsible for wastewater surveillance, lack of funding, lack of buy-in from community leaders, and lack of partnerships with wastewater laboratories or utilities. About 21 percent reported that they did not understand how to interpret the data, and another 17 percent said the wastewater data did not add value to already existing information (Keshaviah et al., 2022b). In addition to the reasons listed, political considerations also play a role in limiting the impact of wastewater surveillance data, and sometimes politicians are not interested in wastewater findings. When wastewater analyses found Omicron to be dominant in Orange County, Florida, before clinical cases were present, Florida’s hands-off policy meant that there was no change to public health actions (Vogel, 2022).
Increasing General Public Awareness
The COVID-19 pandemic has led to a rapid increase in public access to public health metrics, such as numbers of reported cases, vaccination rates, and intensive care unit bed availability (Dixon et al., 2022). This public access has been enabled largely through the widespread adoption by public health agencies, news outlets, and academic research centers of online dashboards that are regularly updated with aggregated data in a straightforward and often interactive format. The public has shown strong interest in wastewater surveillance data. Wisconsin’s dashboard, for example, was visited 127,000 times in the first 18 months (see Figure 2-12a). Likewise, Houston’s dashboard was visited 107,000 times as of May 15, 2022, with as many as 10,000 clicks in a single day (see Figure 2-12b). Both dashboards experienced increased attention during COVID-19 surges. Similarly, the wastewater surveillance page on the U.S. Centers for Disease Control and Prevention’s (CDC’s) COVID Data Tracker has had more than 1 million views, and its public wastewater data have been downloaded more than 50,600 times between February 2, 2022, and July 13, 2022 (Rachel West, CDC, personal communication, 2022).
Early information and anecdotal accounts suggest that mentions of wastewater data by public health officials likely increase public awareness. For example, in the summer of 2020, Oklahoma wastewater surveillance indicated high levels of SARS-CoV-2 RNA in Anadarko, Oklahoma. The wastewater surveillance team informed the city manager who subsequently posted an alert on the city’s Facebook page. The specific post was interacted with more than 6,000 times, in a town of 6,600 residents, in the following few days (Jason Vogel, University of Oklahoma, personal communication, 2022). In a similar example, the University of Louisville launched a geographically targeted awareness and action ad campaign in high-risk areas based on its wastewater surveillance data across the city. Ad campaigns were developed closely with community partners, using trends in wastewater surveillance data to increase vaccination. More than 2,500 people interacted with the ads, which reflects a click-through rate of 0.15 percent, compared to an industry-wide rate of 0.06 percent. The ads were used to inform the community when SARS-CoV-2 RNA levels in wastewater were both high and low (see Figure 2-13; Ted Smith, University of Louisville, personal communication, 2022). Increased risk awareness of COVID-19 trends is one of several factors that predicts increased protective health behaviors among the general public (Cipolleta et al., 2022).
The news media has played a major role in introducing wastewater surveillance to the public. As early as April 2020, U.S. news agencies were describing the research being conducted to track SARS-CoV-2 in sewers (Barber, 2020; Snyder and Cullinane, 2020). Each new COVID-19 surge

SOURCES: Wisconsin Department of Health Services and City of Houston Health Department.
and variant prompted multiple news stories on the application and value of wastewater surveillance. Although this undoubtedly increased public knowledge on the topic, little is known about how media attention has affected public understanding, perception, and use of wastewater data or how wastewater surveillance has attracted readers compared to other COVID-19 surveillance reporting.

SOURCE: Ted Smith, University of Louisville, personal communication, 2022.
With respect to public awareness and perception of wastewater surveillance for SARS-CoV-2, a study of Louisville, Kentucky, residents in August 2021 found that 43 percent were aware that SARS-CoV-2 could be detected in their sewer system; 49 percent said they did not know whether that was possible (Holm et al., 2022a). Approximately one-third of respondents were familiar with the idea that the amounts of SARS-CoV-2 in wastewater reflected the level of community infections. Less than one-third knew that Louisville’s wastewater was being monitored. It is worth noting that the public dashboard had only been available for about 3 months. The same study found that 85 percent of those surveyed were supportive of wastewater surveillance. Those who were aware that SARS-CoV-2 could be measured in wastewater were more likely to be supportive of the activ-
ity. In a follow-up survey in early 2022 (LaJoie et al., 2022), the team conducted an online survey for adults across the United States. Similar to the Louisville results, 42 percent of residents were aware that SARS-CoV-2 could be detected in wastewater and 95 percent supported monitoring for diseases in wastewater.
INNOVATION IN RESPONSE TO IMPLEMENTATION CHALLENGES
The rapid spread of SARS-CoV-2, globally and across the nation, initiated an emergency response to surveillance, including the early implementation of wastewater surveillance. The early voluntary nature of the response initiative, the need for rapid implementation without existing guidance, strained laboratory capacity, and a lack of validated methods and sampling designs were major challenges in developing coordinated surveillance. Innovation, across utilities, analytical laboratories, and health departments, was essential in the rapid scaling and continuous process improvement of SARS-CoV-2 detection.
Early in the COVID-19 pandemic, efforts to collect and analyze wastewater data began with proof-of-concept work that was concentrated in university laboratories familiar with environmental monitoring due to available expertise and laboratory equipment. At the time, there were no straightforward mechanisms to support the validation and scale-up of wastewater surveillance by researchers. As a result, teams took creative approaches to funding their work, including through the National Science Foundation’s (NSF’s) Rapid Response Research (RAPID) research grants8 and internal funding provided by the universities and local agencies. Philanthropy also played a role in funding several projects, with sources including the Rockefeller Foundation, CDC Foundation, and others. Over time, more funding sources became available, such as grants from CDC’s Epidemiology and Laboratory Capacity for Prevention and Control of Emerging Infectious Diseases (ELC) funds for state, territorial, and eligible local health departments.
Even after CDC funding through the ELC program was launched through health departments, there was little initial guidance for utilities that were interested in participating, and partnerships between utilities and public health departments needed to be developed. The launch of the NWSS in
___________________
8 NSF RAPID grants are relatively small research grants that, according to NSF, are “used for proposals having a severe urgency with regard to availability of, or access to data, facilities or specialized equipment, including quick-response research on natural or anthropogenic disasters and similar unanticipated events.” These proposals undergo internal merit review only and so are awarded in a faster time frame than typical NSF proposals (NSF, 2009).
September 2020 created a network of health departments and utilities supported by CDC with peer support for those developing surveillance systems.
Early researchers also dealt with several challenges with respect to laboratory methods and infrastructure, sampling design, and data interpretation. Prior to the pandemic, non-enveloped, enteric viruses dominated the wastewater research world (Polo et al., 2020). An enveloped respiratory virus, SARS-CoV-2 caused early methodological hurdles because many of the wastewater concentration methods had not been validated and optimized for enveloped viruses. Early multilaboratory studies were needed to optimize, validate, and compare these methods (e.g., Pecson et al., 2021). Prior to these studies, identification of appropriate surrogates and controls for PCR-based methods and where to acquire them proved difficult. The need for a central document outlining the minimum quality control information for PCR-based experiments in environmental samples was apparent, and several documents have since been released (e.g., Ahmed et al., 2022; Borchardt et al., 2021).
Laboratory capacity was an issue during the initial phase of the pandemic. Clinical testing was the priority at health laboratories, and most of the environmental microbiology academic and research laboratories were initially closed for the pandemic response. CDC’s biosafety recommendations for laboratory requirements to process wastewater samples created further hurdles as many environmental laboratories now had to meet biosafety Level 2 or higher. Supply chain issues also affected almost every aspect of life during the pandemic, including the availability of sampling kits, laboratory reagents, and autosamplers.
Sampling design considerations were complicated early on by the unknown SARS-CoV-2 environmental persistence and infectivity, and uncertainty about whether special precautions for sample collection, transport, and storage were needed. Sample location and frequency decisions were also an early hurdle, and appropriate data analysis and visualization had almost no precedent. To generate actionable data that can be compared across sewersheds, strategies to transform the data to account for dilution effects and compare data spatially have taken time to develop and are not fully resolved. The committee’s Phase 2 report will review sampling approaches, analytical methods, data analysis, and data visualization and research needs in light of experience gained during the first 2 years of the pandemic.
CONCLUSIONS
The experience with wastewater surveillance during COVID-19, demonstrates that these data are useful for informing public health action and that wastewater surveillance is worthy of further development and
continued investment. Public health agencies that invested in collecting, analyzing, and interpreting the data found them useful to inform policy decisions (e.g., masking and social distancing rules) allocation of public health resources (e.g., testing and vaccination sites, public notification efforts), and allocation of clinical resources (e.g., staffing, hospital beds). These data rarely stood alone but rather were frequently used in conjunction with other disease surveillance data sets (e.g., case and hospitalization counts), each with their own limitations and advantages, to decide on appropriate public health actions and resource allocations. Information on changing SARS-CoV-2 RNA levels in wastewater were shared with the public, often on dashboards, to help inform personal decision making. The launch of CDC’s NWSS created an expanded network of utilities and health departments monitoring SARS-CoV-2 in wastewater, thus strengthening COVID-19 surveillance capacity and providing support and guidance for sampling, analyzing, and interpreting data for public health action.
Wastewater surveillance data have been particularly useful for understanding SARS-CoV-2 trends and the spread of variants. Wastewater surveillance provides a method to passively assess trends in COVID-19 burden in a community unbiased by the availability of testing or test-seeking behavior. As COVID-19 clinical testing and reported case data became less reliable in recent months due to many factors, including increased at-home testing, wastewater surveillance provided continued information on where the virus was circulating and the degree of exposure risk. Although wastewater surveillance is not currently being used as a standalone method to reliably estimate the number of community infections, SARS-CoV-2 wastewater data have correlated with case data and other conventional public health surveillance data. Depending on a number of factors, including wastewater sampling frequency, the time required for sample transport and analysis, and the time required for data reporting, wastewater SARS-CoV-2 viral trends have the potential to be reported more quickly or along a more consistent time frame than conventional disease surveillance reporting. Wastewater surveillance also provides comprehensive information on the relative proportions of known variants, and genome sequencing of wastewater samples is an effective strategy to screen for emerging variants among a large contributing population, thus providing information in advance of clinical testing data.
The emergency response to the COVID-19 pandemic spurred innovation and rapid development and implementation of wastewater surveillance; the challenge is now to unify sampling design, analytical methods, and data interpretation to create a truly representative national system while maintaining continued innovation. Early challenges in initial surveillance sites focused on analytical capacity, sampling design, and data
interpretation. The pandemic inspired innovation, which led to a diversity of approaches and methods rather than a single standard method. To date, sites within the NWSS have been based primarily on wastewater utility and public health jurisdiction willingness to participate, including volunteering time and resources, and thus do not comprise a representative national system. Importantly, participating sites have successfully built new partnerships across professional communities with limited prior interactions, spurring innovation and increased efficiency. The challenge is to formalize these roles and partnerships and ensure national representation with best practices for collection, analysis, and use of the data.
This page intentionally left blank.


