


Below is the uncorrected machine-read text of this chapter, intended to provide our own search engines and external engines with highly rich, chapter-representative searchable text of each book. Because it is UNCORRECTED material, please consider the following text as a useful but insufficient proxy for the authoritative book pages.
63Â Â Data Analysis on FAA V/PD Reports This appendix presents the results of a foundational part of the project research. What follows is a description of the analytical methodology used during the initial phase of the project and key findings of the analysis performed on data relating to V/PDs. The analysis was performed in the early stages of the project, and the research team used the findings as the foundation for the information and recommendations presented in the body of the report. The content of the appendix was submitted to the ACRP Project Panel as a section of a white paper. The white paper was delivered at the conclusion of Phase I of the three-phase project and presented the project status, initial findings, and recommendations for the remaining project phases to the panel. The white paper also contained the results of the literature review performed during Phase I. The white paper in its entirety is available as Appendix C, which is available on the National Academies Press website (www.nap.edu) by searching for ACRP Research Report 246: Airside Operations Safety: Understanding the Effects of Human Factors. A.1 Introduction A key element for meeting the research project objectives was to discover the nature of the issues and the underlying causes behind the events that affect airport safety in the airside environment. One of the primary research goals was to analyze the human factors deemed to cause V/PDs. The problem statement called for the research team to perform the following: An analysis of domestic (and, if practical, international) safety statistics related to runway incursions and V/PDs, sorted by size of airport, type of vehicle operator, and other criteria relevant to the objectives of this research. The research team was granted access to data resident in the FAA Runway Safety Office Runway Incursions (RWS) database. With the assistance of the FAA, the team asked for and received the records for V/PDs for the fiscal years 2017 through 2018. The reason this period was chosen was that it mirrored the time period of the latest in-depth study of V/PDs performed by the Runway Safety Office. The FAA study did not specifically look at the human factors behind the V/PD events, but the findings did provide some additional insight because the FAA had access to the raw information received from the airports in the development of its report. The Runway Safety Office shared a PowerPoint presentation that covered the findings of its study. Relevant findings from that presentation are included here as well. The research team attempted to acquire international data similar to that provided by the FAA. Contact was made with Airports Council International (ACI), the International Civil Aviation Organization (ICAO), the European Union Aviation Safety Agency (EASA), the Civil Avia- tion Safety Authority of Australia, and Cranfield University in the United Kingdom. In all cases, either like databases were not available or access to the data was not approved. A P P E N D I X A
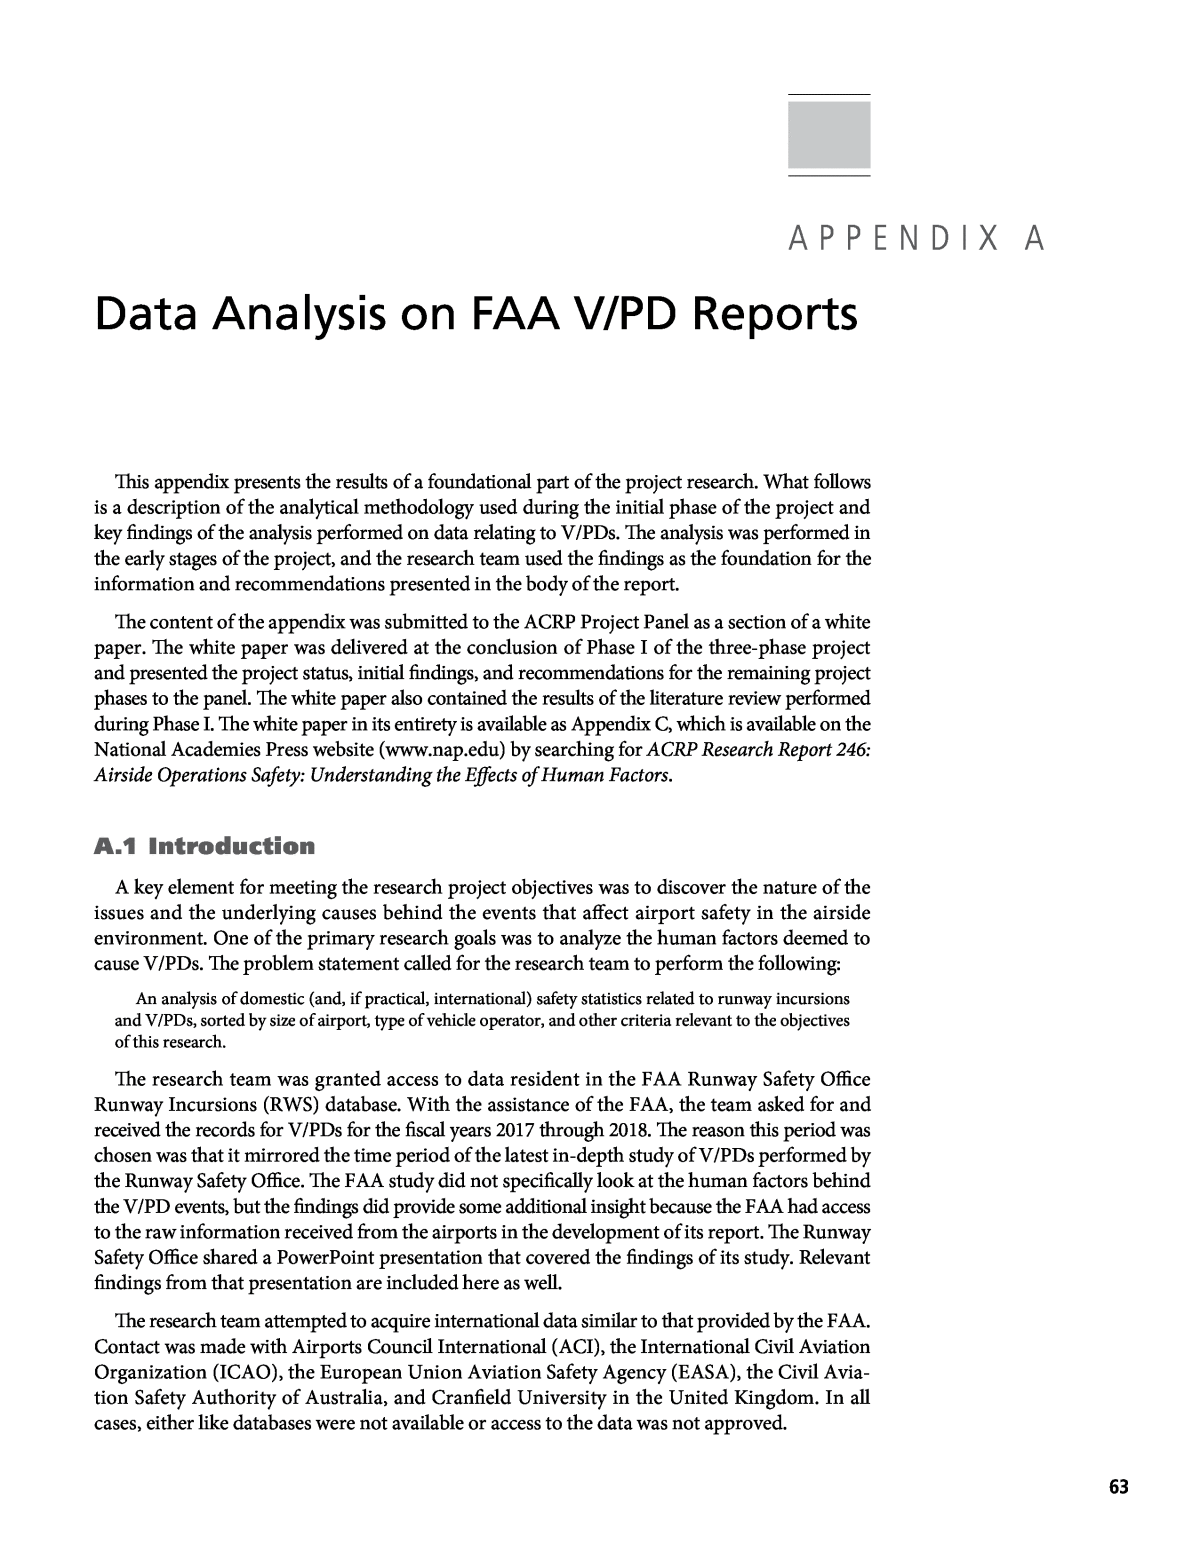
64 Airside Operations Safety: Understanding the Effects of Human Factors A.2 Methodology The data analyzed encompassed 847 V/PD events that occurred in the United States over the selected 2-year period. For each of the events, the following information (if available in the database) was reviewed: ⢠Event number (FAA generated reference number) ⢠Date of the event ⢠Time of day ⢠City and state ⢠Airport identifier ⢠Vehicle type (vehicle or pedestrian) ⢠Vehicle code (car, aircraft, baggage cart, etc.) ⢠Vehicle description (airport ops vehicle, FAA vehicle, fire truck, ambulance, etc.) ⢠Communications equipment ⢠Operator (airline, civilian, military, etc.) ⢠Training available (for the vehicle operator; yes or no) ⢠Training completed (yes or no) ⢠Investigation narrative ⢠Airport region The data were extracted from an Access database received from the FAA, and the team populated a master Excel spreadsheet for ease of analysis. While not a specific field in the FAA database, the research team added the following addi- tional field for analysis: ⢠Airport Size. The research team identified each airport as large hub, medium hub, small hub, non-hub, or general aviation. The data fields were analyzed for trends; however, the main focus of the analysis was the identifi- cation of human factors information within the event narratives. To capture usable and actionable human factors information from the investigation narrative, the research team used the Human Factors Analysis and Classification System (HFACS). HFACS uses causal categories or levels that identify the active and latent failures that occur in incidents and accidents. The categories and levels of the HFACS taxonomy are illustrated in Figure A-1. A complete explanation of the HFACS framework can be found at the following site: http://www.hfacs.com/hfacs-framework.html. Of the 847 events in the FAA database during the selected 2-year period, 786 (93%) included investigation narratives, while 61 had no narrative. Of the 786 events with investigation infor- mation, 679 (86%) had enough information to be coded per the HFACS taxonomy. Thus, in general, 14% of investigations (107 events in this case) did not record enough detailed information to support the analysis of human factors that may be causal. Even for those narratives with enough information for HFACS coding per the taxonomy, the analysis required the research team to default to one unsafe act for the largest percentage of the events: that act being decision error. This will be further discussed in this appendix, but it highlights the need for the airport industry to improve investigation practices for incidents and accidents in order to tackle safety improve- ment with more accurate data. A.3 Findings from Analysis of the Investigation Narratives â HFACS Results While a handful of unsafe acts were categorized as skill-based errors or perceptual errors, the vast majority of unsafe acts were either violations or decision errors. Of the 679 events analyzed via HFACS, 100 (15%) were categorized as violations and 529 (78%) as decision errors. The
Data Analysis on FAA V/PD Reports 65  HFACS findings focus on these two and include example excerpts copied from the investiga- tion narrative write-ups (bulleted and in all caps) to support the findings. A.3.1 Violations In order to code the event as a violation, evidence in the investigation narrative must exist to indicate that the party or parties knowingly performed an action that was contrary to airport rules and regulations. The violations fell into several subcategories. In many cases, pedestrians or vehicle drivers simply penetrated the airport through fencing or open gates. In some cases, they were drunk or otherwise mentally ill, and in other cases, they were evading police. ⢠WHILE EVADING POLICE, THE PEDESTRIAN SCALED THE AIRFIELD PERIMETER FENCE, GAINING ACCESS TO THE AIRFIELD. ⢠THE INDIVIDUAL WAS FLEEING POLICE AND FOUND TO BE MENTALLY INCOM- PETENT. HE USED CLOTHING TO SCALE THE AIRPORT FENCE AND INJURED HIMSELF SIGNIFICANTLY ON THE BARBED WIRE AT THE TOP OF THE FENCE. The other common type of violation involved people simply ignoring the rules and conduct- ing themselves poorly. This included cases where the person knew the rules but did not behave accordingly. ⢠THE PEDESTRIAN CLAIMED TO BE A PILOT AND A PAST EMPLOYEE WITH THE FAA. HE ALSO CLAIMED TO BE AN AVIATION SAFETY INSTRUCTOR AS WELL. Supervisory Factors Inadequate Supervision Planned Inappropriate Operations Failure To Correct Known Problem Supervisory Violation Organizational Influences Organizational Culture Operational Process Resource Management Unsafe Acts Violations Routine Violations Exceptional Violations Errors Decision Errors Skill-based Errors Perceptual Errors Preconditions for Unsafe Acts Communication, Coordination & Planning Fitness for Duty Mental States Physical/Mental Limitations Physical Environment Tools/Technology Situational Factors Physiological States Condition of Operators Personnel Factors Figure A-1. HFACS taxonomy.
66 Airside Operations Safety: Understanding the Effects of Human Factors HE STATED THAT HE KNEW THE RUNWAY WAS CLOSED BECAUSE AIRCRAFT WERE OPERATING FROM THE SECONDARY RUNWAY ON THE AIRPORT. WHEN ASKED IF HE CHECKED ANY NOTAMS [Notice to Airmen], TALKED TO THE TOWER OR LISTENED TO THE ATIS [Automatic Terminal Information System] HE BECAME IRATE, STATED âTHIS CONVERSATION IS OVER,â AND HUNG UP THE PHONE. A.3.2 Decision Errors In many cases, the narratives did not provide enough information to determine whether the person had knowingly violated a rule that led to the incursion. In these cases, the research team defaulted to assigning a decision error code to the scenario. About 80% of the events contained evidence of an error or lacked evidence of a violation. Many of these decision errors were influenced by other factors (as described later). However, in some cases, there was not enough information to determine a link between these other factors and the decision error. ⢠SNOW REMOVAL OPERATIONS WERE ABOUT TO COMMENCE AND PORTABLE 21 AND THE SNOW REMOVAL TEAM WERE GIVEN PERMISSION TO OPERATE ON TWY [taxiway] A & B BUT HOLD SHORT OF RWY [runway] 16L. VEHICLE 21 AND SNOW TEAM PROCEEDED AS INSTRUCTED BUT CONTINUED ON TO RWY 16L WITHOUT PERMISSION FROM AIR TRAFFIC CONTROL TOWER (ATCT) ON FREQUENCY 119.9. In this situation, an incursion ensued, but not enough information was recorded to deter- mine why the person continued without permission. It could have been due to a variety of reasons, but none were listed. In these cases, a decision error code was assigned without any amplifying factors. There were many scenarios like this; in such cases, mitigation strategies are nearly impossible to develop because the true cause for the event was not known. A.4 Other Decision Error Influences, Factors, or Preconditions There were many potential influences, factors, or preconditions to the decision errors that led to the V/PDs recorded in the database. The HFACS analysis identified the following secondary factors behind the errors discovered and their frequency: ⢠214 â Communication, coordination, and planning ⢠140 â Adverse mental states ⢠132 â Inadequate supervision ⢠59 â Tools/technology ⢠26 â Skill-based errors ⢠12 â Physical environment ⢠8 â Failure to correct known problem ⢠2 â Supervisory violation ⢠2 â Operational process This breakdown shows that the four main reasons appeared to be communication, coordina- tion, and planning (CCP); adverse mental state (AMS); inadequate supervision (IS); and tools and technology (TT). Each of these are discussed in the following. A.4.1 Communication, Coordination, and Planning There were 214 narratives examined that contained evidence of CCP errors. This code includes situations where there was poor communication, coordination, or planning that contributed to the decision error taking place. Communication was the issue cited in the vast
Data Analysis on FAA V/PD Reports 67  majority of scenarios where this code was assigned. In some cases, the person simply did not communicate at all. ⢠THE GROUND CONTROLLER (GC) OBSERVED VEHICLES ON TWY V. THE GC THEN ATTEMPTED TO CONTACT THE VEHICLES VIA RADIO W/O RESPONSE. ⢠GC NOTICED THAT OPS 1 HAD EXITED RWY 31 BUT DID NOT REPORT OFF THE RUNWAY. A SHORT TIME LATER, GC OBSERVED OPS 1 PROCEED ON RWY 13/31 WITHOUT CALLING FOR APPROVAL. In some cases, the person was communicating, but did not hear the instructions and falsely assumed there was approval. ⢠FLAGGER 1 REPORTED NOT HEARING OR ACKNOWLEDGING THESE INSTRUC- TIONS AND INCORRECTLY ASSUMING SHE STILL HAD APPROVAL ON 20L, CROSSED THE RUNWAY ONCE MORE. In other cases, the person was communicating in a less-than-optimal way. ⢠LOCAL CONTROL (LC) INSTRUCTED RED2 TO HOLD SHORT. RED2 ACKNOWL- EDGED THE INSTRUCTIONS WITHOUT READING THEM BACK. WHEN THE EMERGENCY AIRCRAFT PASSED THE THRESHOLD, RED2 DROVE ONTO THE RUNWAY BEHIND TANKR14 WITHOUT AUTHORIZATION. Sometimes, the person heard instructions for someone else and thought it was meant for them. ⢠OVERHEARD RADIO TRAFFIC APPROVAL FOR ELECTRIC 1 AND MISTAKENLY THOUGHT HE WAS APPROVED TO ENTER THE MOVEMENT AREA. Other times, the communication was garbled and instructions were not clearly understood. ⢠AFTER LISTENING TO TOWER RECORDING, FURTHER INVESTIGATION REVEALED THAT AFTER AIRPORT 160 REPORTED OFF OF TAXIWAY A (TO THE SOUTH), THERE WAS A GARBLED MESSAGE THAT WAS BARELY READABLE/COULD NOT BE UNDERSTOOD. THERE WAS NO RESPONSE FROM ATCT. A SHORT TIME LATER IS WHEN AIRPORT 160 WAS OBSERVED ON RWY 18-36. A.4.2 Adverse Mental State The research team found that 140 of the investigation narratives included information leading to an AMS code assignment, indicating that there was some issue with situational awareness, distraction, confusion, or an external substance (e.g., alcohol/drugs) that negatively affected the personâs mental state. One common reason for AMS incursions was a lack of situational awareness on the part of the offender. In these cases, the person clearly was not intending to cause an incursion, but instead did not realize where she or he was. ⢠THE DRIVER MOMENTARILY LOST SITUATIONAL AWARENESS WHEN TURNING AROUND ON TAXIWAY; HOWEVER, ONCE HE REALIZED THAT HE CROSSED THE RUNWAY HOLD-SHORT LINE, HE IMMEDIATELY CALLED FOR ASSISTANCE TO CLEAR THE AREA WITHOUT FURTHER INCIDENT. Another common reason for AMS incursions was distraction or not paying attention on the part of the offender. Again, there was no intent to cause an incursion, but the person should have been more focused on avoiding incursions rather than thinking about other things. ⢠DRIVER WAS JUST NOT PAYING ATTENTION TO WHAT WAS GOING ON AS SHE WAS CONDUCTING HER DAILY RUNWAY INSPECTION AND GOT COMPLACENT AS SHE USUALLY DOES NOT HAVE TO WAIT FOR TRAFFIC.
68 Airside Operations Safety: Understanding the Effects of Human Factors A third common reason for AMS incursions was confusion on the part of the offender, or the offender was lost or unfamiliar with the airport. This could be due to the person having never been at the airport before or not being trained on airport procedures. ⢠AMBULANCE DRIVER WAS UNFAMILIAR WITH THE LAYOUT OF THE AIRPORT AND INADVERTENTLY CROSSED RUNWAY 6 ON TAXIWAY SIERRA AND TAXIWAY BRAVO. Lastly, there were several cases where the offender was simply not in his or her right mind. There might have been drugs or alcohol involved, or the person had dementia, or another limit- ing condition. ⢠FURTHER INVESTIGATION REVEALED THE DRIVER OF THE VEHICLE WAS UNAWARE OF HOW HE ARRIVED AT THE AIRPORT. HE STATED TO POLICE THAT LAST HE REMEMBERED HE WAS ON HIS WAY HOME FROM HIS DAUGHTERâS HOUSE. THE GENTLEMAN ALSO REVEALED THAT HE SUFFERS FROM ALZHEIMERâS DISEASE. AFTER BEING TRANSPORTED TO THE HOSPITAL, IT WAS DISCOVERED THAT THE DRIVER WAS REPORTED MISSING EARLIER THAT DAY AND THAT HE HAD DEMENTIA IN ADDITION TO ALZHEIMERâS. A.4.3 Inadequate Supervision There were 132 cases of IS, which can be further broken down into three common situations. In many cases, a supervisor had not trained the employee, and mistakes were probably made due to lack of training. ⢠THE AIRPORT DOES HAVE A MOVEMENT AREA DRIVERâS PROGRAM; HOWEVER, THESE PARTICULAR DRIVERS WERE NOT REQUIRED TO TAKE THE TRAINING. In other cases, they received training, but it was not adequate or was not the appropriate type of training for the job. ⢠THE TRAINING PROGRAM IS A COMPUTER-BASED PROGRAM, AND THE AIRPORT HAD PREVIOUSLY DETERMINED THAT THE COMPUTER-BASED TRAINING WAS NOT ADEQUATE FOR DRIVING ON THE NON-MOVEMENT AREA AFTER A V/PD LAST JULY BY A CONSTRUCTION WORKER. Along a different line, there were several cases where supervisors did not escort the worker when required, left the worker unattended, or let one vehicle leave a caravan of vehicles. ⢠AIRPORT ISSUED STOP-WORK ORDER FOR THE PROJECT UNTIL THE CON- TRACTOR DEVELOPED AND IMPLEMENTED A TRAFFIC PLAN REQUIRING ESCORTS AND ADDITIONAL TRAINING. ⢠THE ROOT CAUSE OF THIS INCIDENT WAS A LACK OF POSITIVE CONTROL OVER PERSONNEL ON THE RAMP AND ESCORT PROCEDURES ON BEHALF OF THE FIXED- BASE OPERATOR (FBO). A.4.4 Tools and Technology There were 59 cases where a TT code applied. In some cases, airports needed to install cameras to monitor employees and ground crew or add signs/stenciling and other aids to help crews find their way around. ⢠AIRPORT CHANGES: (1) INSTALLING CAMERAS, (2) REGULAR VEHICLE/ PEDESTRIAN TRAINING, (3) STENCILING ON TXY [taxiway], (4) ADDED SIGNS TO ACCESS GATES.
Data Analysis on FAA V/PD Reports 69  There were many instances where a driver or pedestrian entered an open gate. This may have been because the gate was unlocked or because someone piggy-backed on another driver who did not ensure that the gate closed immediately after entering the airport operations area (AOA). ⢠THIS DRIVER ENTERED THE AOA FROM AN OPEN GATE AND, AT THE TIME OF ENTRANCE, WAS NOT NOTICED BY ANY OTHER AIRPORT TENANTS OR PERSONNEL. ⢠THE VEHICLE OPERATOR GAINED ACCESS THROUGH A GATE LEFT OPEN BY AN AIRPORT TENANT. Lastly, there were a number of cases where fencing was either nonexistent or inadequate to stop pedestrians from entering the airport ground. ⢠IT WAS DETERMINED INADEQUATE FENCING IN THE FORM OF THIS TYPE OF VEHICLE ENTRY/EXIT GATE WAS DEFINITELY A CONTRIBUTING FACTOR TO THE VEHICLE/PEDESTRIAN DEVIATION. A.5 Potential Mitigation Strategies While recommendations of strategies for mitigating the risks posed by these human factors were developed and presented in the subsequent phases of the project, the findings from the HFACS analysis of the FAA V/PD data led the research team to postulate a number of approaches airports may consider. The following mitigation suggestions were included in the follow-on research phases. A.5.1 Violation Mitigation Suggestions The reasons recorded for violations were fairly straightforward, and the mitigations may be as well. The mitigation will likely reside with individual responsibility and accountability, both of which are influenced by the airportâs cultureâat least for those employed by or at the airport. In some cases, higher fencing might keep out trespassers who are violating airport rules, but violations may require attention on a case-by-case basis. A.5.2 Communications, Coordination, and Planning Mitigation Suggestions During the three airport visits conducted, the research team discovered that this was a key factor in violations. Many communication issues might be alleviated by improved training approaches, particularly for temporary personnel. Many of the ground personnel cited in the CCP events clearly were new to the job, had minimal mandatory training, and were not familiar with airports or communications terminology. Nor were many of them familiar with groundâ tower communication protocol, or simply were not confident communicating via radio with the controllers in the tower. One potential issue that did not show up in the data but may be worth examination was proficiency in English for airport drivers. This subject was mentioned during the airport visits on a couple of occasions. With more airports adopting SMS processes, which include SRM practices, the introduction of easy-to-remember and easy-to-put-into-practice risk management techniques for those working airside could be an effective mitigation strategy that improves communication, coordination, and planning. Branches of the U.S. military and airlines include threat and error management techniques and time-critical risk management processes to minimize errors while personnel are engaged in operations.
70 Airside Operations Safety: Understanding the Effects of Human Factors A.5.3 Suggestions for Adverse Mental State Mitigation When someone is mentally ill or running from the police, then the most effective thing that might stop them from entering the airport would be a barrier. Fences can only be but so effective, and anything more structurally sound would probably not be cost-effective for smaller airports. On the other hand, training could help to alleviate many of the problems associated with unfamiliarity and loss of situational awareness. As mentioned previously, many of the ground personnel cited were new to the airport, had minimal training, or were not familiar with airports in general. Examining the required training and reviewing escort requirements and procedures may help to mitigate these issues. A.5.4 Suggestions for Inadequate Supervision Mitigation Many of the IS cases appear to be solvable through improved training, mentoring, monitoring, and evaluation of those in leadership positions or who perform duties with heightened respon- sibility. Other cases can be addressed by ensuring that supervisors understand escort procedures and monitor their employees to ensure compliance, as well as by reviewing the procedures to certify effectiveness. A.5.5 Suggestions for Tools and Technology Mitigation With regard to issues involving gates, two things came up during the analysis. First, cameras could help to ensure that gates have been closed properly by tenants and other personnel. Given the advances in surveillance technologies and the decreasing costs of systems for homes, simple and inexpensive solutions may be suitable for some airport situations. Additionally, understand- able markings on the pavement may be more effective for drivers less familiar with markings and signage designed for pilots operating aircraft. One example is painting a wide, solid red line to mark where the movement area begins. A.6 V/PD Data Analysis Other Than HFACS In addition to the HFACS analysis performed on the V/PD database, the research team examined the data outside of the investigation narratives to determine if trends appeared. The team looked at the data for evidence of fatigue causal factors, weather as an influence on human performance leading to V/PDs, if airport size or complexity of operations led individuals to make more mistakes, and if the training available and type of equipment used in the field were indicators of problem areas. As a reminder, the data analyzed were for fiscal years 2017 and 2018. A.6.1 Events by Airport Region Figure A-2 shows the distribution of V/PD records for the FAA airport regions. Reports submitted to the database and analyzed came from only five regions: Central (ACE), Western- Pacific (AWP), Eastern (AEA), Great Lakes (AGL), and New England (ANE). The database indicated that 624 (74%) of the events reported occurred in the FAA Central region. While these results did not track with the FAA Runway Safety Office findings, it may indicate large varia- tions in reporting policy and practices in the United States. These results differed from the analysis of V/PDs performed by the FAA Runway Safety Office. The events by region discovered in the FAA analysis are shown in Table A-1. This indi- cates that V/PDs were reported in all nine airport regions, with the fewest occurring in the Central region in 2017.
Data Analysis on FAA V/PD Reports 71Â Â An increased number of reports occurred in 2018 in the Central, Great Lakes, Southern (ASO), Southwest (ASW), and Western-Pacific regions, while the Alaskan (AAL), Eastern, Northeastern, and Northwest Mountain (ANM) regions showed improvements in 2018. Table A-2 displays the percentage of annual V/PDs occurring in each region as per the FAA Runway Safety Office analysis. The reasons for the differences in the results between the research team analysis and the FAA analysis were not explored in any depth because no association with the human causal factors could be made. It is likely that the FAA looked at additional data sources during its analysis that were not available to the research team. A.6.2 Events by Quarter The research team looked at the events per calendar year quarter to see if there was any indication of differences in events per season. Figure A-3 shows the results of the analysis and indicates a relatively flat distribution. The thought was that more incursions might take place during the times of year when snow-removal operations take place. The research indicated no such trend, even given the large reporting numbers in the data analyzed by the research team in the Central region. 624 191 27 4 1 0 100 200 300 400 500 600 700 ACE AWP AEA AGL ANE Total Region FY-17 FY-18 AAL 14 13 ACE 3 14 AEA 37 32 AGL 41 55 ANE 15 5 ANM 36 22 ASO 41 52 ASW 36 66 AWP 47 65 270 324 Figure A-2. Events by airport region. Table A-1. V/PDs per airport region in FY-17 and FY-18. FAA Runway Safety Office analysis. Regions showing improvements in 2018 are in bold.
72 Airside Operations Safety: Understanding the Effects of Human Factors 203 225 230 189 0 50 100 150 200 250 Qtr1 Qtr2 Qtr3 Qtr4 Total Figure A-3. V/PD events by calendar year quarter. Region FY-17 FY-18 AAL 5% 4% ACE 1% 4% AEA 14% 10% AGL 15% 17% ANE 6% 2% ANM 13% 7% ASO 15% 16% ASW 13% 20% AWP 17% 20% 100% 100% Table A-2. Percentage of annual V/PDs per airport region in FY-17 and FY-18. FAA Runway Safety Office analysis. A.6.3 Events by Time of Day The research team wanted to evaluate the number of V/PD events as a function of daylight versus darkness. Given that the reports do not record the sunset or sunrise times, sorting the data according to a typical way of breaking up the workday into shifts was determined to be a starting point for such an analysis. The results are shown in Figure A-4, which shows that 67% of the events occurred during daylight hours. This is the time when more aircraft operations occur and the activity on the airfield is the highest; thus, these data do not seem to show a trend that more V/PDs occur during hours of darkness, or that a lack of ambient light is a large contributing factor. This analysis was also seen as a potential indicator of the influence of cognitive fatigue due to sleep restriction. The hypothesis was that if a significant percentage of the V/PDs occurred in the late night or early morning hours, fatigue might be a factor in such events. This analysis did not indicate such a relationship; however, the data do not contain information on when during a shift the event occurred (beginning, middle, or end of shift). A.6.4 Events per Size of Airport Figure A-5 shows the number of incidents according to the size of the airport. The research team used hub size for commercial service to evaluate V/PDs as a function of airport size. The
Data Analysis on FAA V/PD Reports 73Â Â data show that 325 events (39%) occurred at GA airports, while 168 events (20%) occurred at non-hub airports. Thus, 59% of the recorded events occurred at the airports with the lowest levels of activity. The level of activity is relative given that some GA airports operate at levels similar to many medium-hub airports. With this information in mind, the data indicate that the focus of V/PD mitigations may be more important for smaller airports versus the busiest. FAA airport records for calendar year 2018 indicated that 520 airports had commercial service: 30 large-hub, 31 medium-hub, 69 small-hub, 262 non-hub primary, and 128 non-primary commercial service airports. Thus, the 61 airports carrying the bulk of commercial service flight operations had only 26% of V/PDs. The potential exists that the difference in resources and personnel available at large airports versus small airports may play a significant role. The mitigations that are practical for one size airport may be impractical for another. A.6.5 Events According to Vehicle Information The information available for analysis in the database the research team used proved inconclusive. While the data showed that the vast majority of the events involved a vehicle (Figure A-6), the information available for vehicle code (Figure A-7) and vehicle description (Figure A-8) appears to provide little knowledge with regard to human factors. Note: Key from top to bottom corresponds in figure from left to right; MEC = mechanic. 230 130 129 112 55 95 36 16 14 82 6 1 2 0 50 100 150 200 250 GA N L S M VEH PED MEC Figure A-5. Events as a function of airport size. 107 565 175 0 100 200 300 400 500 600 0000â0800 0800â1600 1600â2400 Total Figure A-4. V/PD events by time of day.
74 Airside Operations Safety: Understanding the Effects of Human Factors 250 152 79 52 39 24 22 21 13 3 2 0 50 100 150 200 250 300 CA R OT RU K OT R TU G AC FT CN ST R FU EL PL OW MO W ER BA GA G CY CL E Total Figure A-7. Events as a function of vehicle code. 9 8 5 4 4 3 2 2 2 2 2 1 1 1 1 1 1 1 1 1 1 1 1 1 1 1 1 1 1 1 1 1 1 1 1 1 1 1 1 1 1 1 1 1 1 1 1 0 1 2 3 4 5 6 7 8 9 10 Total Note: ANG = Air National Guard. TU G W IT H AI RC RA FT FIR E T RU CK AI RP OR T V EH IC LE FO RK LI FT SW EE PE R FIR E R ES CU E PA SS EN GE R C AR CA RT CA SE TR AC TO R CF R V EH IC LE CU ST OM S AI RC RA FT EM ER GE NC Y AI RP OR T F IR E FA A VA N AN D SU V FA A VE HI CL E FIR E 2 W HI TE V AN 3 V EH IC LE S AN G SU PP OR T FIR ET RU CK AI RP OR T O PS V EH IC LE GA RB AG E T RU CK FIR E R ES CU E T RU CK Figure A-8. Events as a function of vehicle description. 657 171 11 0 100 200 300 400 500 600 700 VEH PED MEC Total Note: MEC = mechanic. Figure A-6. Events as a function of vehicle type.
Data Analysis on FAA V/PD Reports 75Â Â In the vehicle type field in the database (Figure A-6), information was submitted for 839 events. Thus, 80% of the events involved a vehicle (11 of those where an aircraft was involved). There- fore, looking at airside driving and vehicle operations on the airfield would appear to provide the most return on investment. For the events where a vehicle code was entered (Figure A-7), cars played a part in 34%. A variety of other vehicles were found to be part of the remainder of the events involving vehicles. A more detailed breakdown of the vehicle types is shown in Figure A-8. Tug with aircraft and fire trucks were the two highest in this data field; however, the number of vehicles involved in V/PDs is far greater than the number of vehicles described in Figure A-8. This could be an indicator of the quality in the investigation techniques used for airport inci- dents and accidents, or simply incomplete reporting of the data due to unfamiliarity with the reporting forms. A.6.6 Events by Operator Figure A-9 provides a breakdown of the information available on those operating the vehicles involved in V/PDs. As with other fields, data were not collected for all events; 584 events (69%) had an entry in the operator field. Of those, 58% of the operators were either airport employees or the operator was unknown. The remainder had a variety of airport stakeholders involved. A.6.7 Events by Communications Of the 847 events in the database, 726 had information in the communications equipment field (Figure A-10). Of those, 53% indicated either no or unknown communications equip- ment availability or use. A radio was available in 43% of the events. Only one event indicated a phone was used; given the situation today, it would be expected that nearly everyone working airside has a phone either on their person or readily available. A.6.8 Events by Training For 582 events (69%), the training availability field was filled in (Figure A-11). For 558 of those events (96%), training was available for those involved in the event. What the field does not indicate is the type of training available or the content or quality of the training. It is assumed 183 154 61 51 42 26 24 15 14 6 5 2 1 0 20 40 60 80 100 120 140 160 180 200 Total Notes: UNK = unknown, EMPL = employee, TEN = tenant, CTR = contractor, AIRL = airline, OTR = other, VSTR = visitor, OGVT = other government, MIL = military, TAXI = taxi cab, and CIVL = civilian. UN K EM PL TE N CT R AI RL OT R FA A VS TR OG VT GA MI L TA XI CI VL Figure A-9. Events as a function of vehicle operator.
76 Airside Operations Safety: Understanding the Effects of Human Factors that the training recorded in this field refers to airside driver training. Reviewing airside driver training was a specific objective of this project. In 544 of the event investigations, training completion by the person or people involved was examined. The investigations reviewed whether or not the training available was completed (Figure A-12). For 65% of the events (352 event write-ups), training was completed; therefore, 35% of the events involved untrained personnel or the status of the training completion was unknown. Driver training programs and curriculum were an important focus of the project. 324 315 63 16 4 2 1 1 0 50 100 150 200 250 300 350 Total Notes: EQUNK = equipment unknown, OTR = other, DIFF = vehicle equipment difficulty, NOPNL = equipment not operational, and FLSHL = flashlight. NO NE RA DI O EQ UN K OT R DI FF NO PN L FL SH L PH ON E 558 24 0 100 200 300 400 500 600 Y N Total Figure A-10. Events as a function of communication equipment. 352 113 79 0 50 100 150 200 250 300 350 400 Yes No Unknown Total Figure A-12. Events as a function of training completion. Figure A-11. Events as a function of training available.
Data Analysis on FAA V/PD Reports 77  A.7 FAA Analysis of V/PDs During FY-17 and FY-18 As previously stated, the FAA Runway Safety Office conducts analysis on runway incursions, including V/PDs. The analysis is performed annually, and comparisons are made between current data and data from previous years. From the analysis summary provided in a PowerPoint presentation to the research team, some relevant information was obtained that adds insight to the project. What follows are some of the key aspects of the FAA analysis performed on FY-17 and FY-18 V/PD data. The FAA found that there was a 20% increase in V/PDs between FY-17 and FY-18. The largest contributor to the increase was airport vehicles. There were also increases in visitor and privately owned vehicles (POVs), construction vehicles, and FAA events. The analysis also showed an increase in the number of unknowns reflected in the investigation reports, which could reflect the accuracy of the reporting or the thoroughness of the investigations. The Runway Safety Office has access to additional information provided by the airports conducting the investigations of the events. This additional information is primarily in the form of expanded narratives of the events and responses to questions posed by the FAA regarding the investigation letters and forms submitted by the airports. These amplifying data were not included in the FAA database provided to the research team. While the FAA Runway Safety Office analysis does not focus on the human factors underlying the event findings, the findings do provide additional insight regarding specific airport activities and their contributions to V/PDs. Key parts of the FAA analysis are described here. A.7.1 Aircraft Rescue and Fire Fighting Vehicle Issues One class of airport vehicles examined that contributed to the increase in V/PDs was ARFF vehicles. ARFF incidents were not frequent in the data, but some of the underlying causes for the events add validity to the findings of the research team. The Runway Safety Office looked at the reasons the ARFF vehicles were on the airfield and found the following: ⢠Ongoing airfield emergency (3) ⢠Participating in a drill (1) ⢠Participating in training/airfield orientation (2) ⢠Foreign object debris (FOD) inspection (1) ⢠Unknown (1) The causes of these events were determined to include the following: ⢠Route assigned by ATC was different from the usual route when traveling to emergency location ⢠ATC replied âRogerâ ⢠Driver talking to trainee ⢠Did not follow ATC instructions ⢠Both ATC trainee and driver used nonstandard phraseology ⢠Unknown Without amplifying information on the events, coding of the human factors per the HFACS taxonomy is not possible. That said, these event causes indicate communications, coordination, and planning errors. A.7.2 Construction Vehicle Issues The Runway Safety Office examined eight events involving vehicles participating in airport construction projects. In one of these events, the driver parked a vehicle in the movement area.
78 Airside Operations Safety: Understanding the Effects of Human Factors Although driver training was completed, the investigation found that the driver was unfamiliar with parking procedures, and the airport inspection failed to detect the vehicle during the night. Other reports revealed drivers being disoriented while on the airfield on two occasions; in another incident, the driver was not aware of the runway safety area boundaries due to differences in the markings and signage on different ends of the runway. As with the ARFF incidents, HFACS coding was not possible given the limited information in the FAA presentation. However, the summary of causes does tend to indicate decision errors, with the potential of tools and technologies (in the form of airport markings and signage) contributing to the incidents. A.7.3 Snow-Removal Operations Issues Ten events related to snow-removal operations were examined. While there is limited information in the summary to add to the human factors discussion, it was determined that inexperienced personnel, poor visibility, and the use of nonstandard phraseology by ATC were contributing causal factors. During airport interviews, snow-removal operations were specifically explored. The research team hypothesized that fatigue could be a key contributor to decision and human performance degradation during snow-removal operations and endeavored to capture practices to mitigate fatigue risk in place in the industry. A.7.4 Other Airport Vehicle Issues The Runway Safety Office looked at an additional 77 incidents where airport vehicles other than ARFF and snow-removal vehicles were involved and where information relating to the reasons the vehicles were on the airfield and the incident causes was available. As to why the vehicles were on the airfield, the following determinations were made: ⢠Conducting airfield/runway inspections (30%) ⢠Performing maintenance (14%) ⢠Escorting aircraft or other vehicles (11%) ⢠Mowing operations (8%) ⢠Responding to an emergency (6%) ⢠Driver training (1%) Information relating to the causes of the incidents other than the nature of the vehicle operation was not available, but the information did confirm for the research team that focusing on vehicles operated by airport personnel, tenants, and contractors was the correct approach. A.7.5 Visitors and POVs When examining incursions where airport visitors and POVs were involved, the Runway Safety Office analysis found the following potential causes: ⢠Driver did not follow instructions ⢠Lack of driver training ⢠Lack of adequate fencing ⢠Piggy-backing through the gate ⢠Tenant let visitor onto the airport ⢠Lost trying to exit the airport
Data Analysis on FAA V/PD Reports 79  ⢠Tenant failed to escort the visitor ⢠Disregard of airport signs This analysis follows closely with that of the research team in the HFACS analysis. Addition- ally, if the assumption is made that the majority of the visitor and POV events happened at smaller airports, it makes sense that access and security procedures at small airports, as well as FBO policies and procedures, should be examined in follow-on research.
