
3
Population Data and Demographics in the United States
The racial and ethnic composition of the U.S. population is changing rapidly. Today, minoritized individuals account for 50 percent of the population of those 18 years and younger, and if current trends continue, minoritized individuals will account for a majority of the U.S. population between 2042 and 2045 (Craig and Richeson, 2014; Frey, 2021). These demographic trends represent both an opportunity and a critical challenge to U.S. science, technology, engineering, mathematics, and medicine (STEMM): the opportunity to draw talent from groups that are currently minoritized in STEMM and the challenge for STEMM educators to attract and retain minoritized students and STEMM employers to attract and retain STEMM graduates in sufficient numbers to reflect the diversity in the population. Meeting this charge is critical to realize the full potential of talent in the United States as well as ensure equal education and professional opportunities for all. Although the representation of minoritized individuals in STEM undergraduate education and STEMM graduate education is increasing, the collective attainment of science and engineering degrees for Black, Indigenous, and Latine Americans lags behind that of the U.S. population as a whole, and these historically minoritized racial and ethnic groups remain minoritized in U.S. STEM and STEMM (Fry et al., 2021).1
___________________
1 This chapter will use both STEM (to refer to science, technology, engineering, and mathematics) and STEMM (to refer to science, technology, engineering, mathematics, and medicine). In many references to undergraduate education, STEM will be used rather than STEMM, to indicate the lack of professional medical degrees in the data sets most often provided by the National Center for Science and Engineering Statistics. Many references used in this chapter refer to STEM (also referenced as S&E) or medicine, and the separation of STEM vs. STEMM should be seen as intentional to reflect the data.
Building on the previous chapter’s examination of how racism works at the systemic level to create obstacles for individuals from historically minoritized racial and ethnic groups to join the STEMM workforce, the current chapter focuses on the end result of those obstacles—the national-level demographic and population data demonstrating the degree to which individuals from systematically minoritized racial and ethnic groups are minoritized in STEMM disciplines in the United States. This chapter focuses on two broad factors: (1) understanding racial and ethnic representation and trends over time in the United States; and (2) understanding who earns STEMM degrees and who enters the STEMM workforce. These factors go hand in hand, as demographic trends signal who is represented (or not) in STEMM broadly and within specific disciplines.
This chapter begins by demonstrating the ways in which race and ethnicity categories have changed over time in U.S history. Such a history is meant to underscore that race and ethnicity are socially constructed categories that are dynamic and changing constantly as a result of sociopolitical forces (See Box 3-1). To this day, capturing racial and demographic data remains a complex issue. After covering the history of racial categories, the chapter addresses demographic trends that are occurring within the United States. This trend has implications for the future STEMM workforce, given that the present STEMM workforce does not currently feature representational diversity in terms of race and ethnicity.
Furthermore, the chapter examines data reflecting current trends within the STEMM educational spaces and the STEMM workforce. Though there have been increases in the numeric representation of individuals from systematically minoritized racial and ethnic groups, there are specific areas in the STEMM educational space and the STEMM workforce where significant disparities continue to exist today. This chapter also discusses other disparities, including pay inequities. The committee found that there are many important missing pieces in the data that would provide a better understanding of how certain racial and ethnic groups are minoritized in STEM and STEMM spaces. The chapter also provides conclusions that outline specific data to collect and areas to cover.
DEMOGRAPHIC DATA, RACIAL CATEGORIES, AND LIMITATIONS
One key way to understand the changing understanding of race in the United States is to review the ways that demographic information has been collected in the census. The practice of collecting demographic data through the U.S. Census Bureau goes back centuries. Understanding which groups exist and in what proportions in a population can
help governments make important policy decisions. For modern U.S. demographics, a main source of data is the decennial census conducted by the Census Bureau. In the 2020 census, the Census Bureau collected race and ethnicity data in accordance with the U.S. Office of Management and Budget (OMB) 1997 Standards for Maintaining, Collecting, and Presenting Federal Data on Race and Ethnicity (Office of Management and Budget, 1997). The OMB standards require two separate race and ethnicity questions for self-response. These standards require collecting answers to the ethnicity question before asking the race question, with the standards requiring two minimum categories for data on ethnicity—Hispanic or Latine and Not Hispanic or Latine—and five minimum categories for data on race—American Indian or Alaska Native, Asian, Black or African American, Native Hawaiian or Other Pacific Islander, and White (U.S. Census Bureau, 2021a). According to the Census Bureau, “race and ethnicity categories generally reflect social definitions in the United States and are not an attempt to define race and ethnicity biologically,
anthropologically, or genetically. We recognize that the race and ethnicity categories include racial, ethnic, and national origins and sociocultural groups” (U.S. Census Bureau, 2021a).
For demographic information related to STEMM, this report relies on several sources for data on race and ethnicity, including the National Center for Science and Engineering Statistics (NCSES), the National Center for Education Statistics (NCES), National Institutes of Health’s (NIH’s) Data-book (NDB), and the American Association of Medical Colleges (AAMC). NCSES, a federal statistical agency located within the National Science Foundation (NSF), is responsible for data on research and development; the science and engineering workforce; United States’ competitiveness in science, engineering, technology, and research and development; and the condition and progress of STEM education in the United States (National Center for Education Statistics, n.d.). NCES, located within the U.S. Department of Education, is “the primary federal entity for collecting and analyzing data related to education” (National Center for Education Statistics, n.d.). NDB “provides basic summary statistics on extramural grants and contract awards, grant applications, the organizations that NIH supports, the trainees and fellows supported through NIH programs, and the national biomedical workforce” (National Institutes of Health, n.d.). Finally, AAMC is a nonprofit, membership organization of over 170 academic medical institutions that makes select data on its institutions available to the public (AAMC, n.d.a).
The following NCSES definitions for race and ethnicity are according to OMB’s 1997 standards:
- American Indian or Alaska Native: A person having origins in any of the original peoples of North and South America (including Central America) and who maintains tribal affiliation or community attachment.
- Asian [or Asian American]: A person having origins in any of the original peoples of the Far East, Southeast Asia, or the Indian subcontinent; for example, Cambodia, China, India, Japan, Korea, Malaysia, Pakistan, the Philippine Islands, Thailand, and Vietnam.
- Black or African American: A person having origins in any of the Black racial groups of Africa.
- Hispanic or Latine: A person of Cuban, Mexican, Puerto Rican, South or Central American, or other Spanish culture or origin, regardless of race.
- Native Hawaiian or Other Pacific Islander: A person having origins in any of the original peoples of Hawaii, Guam, Samoa, or other Pacific islands.
- White: A person having origins in any of the original peoples of Europe, the Middle East, or North Africa.
- More than one race: Respondents who selected one or more racial designations (NCSES, 2021a,b).
These categories, while descriptive of major racial and ethnic groups and aligned generally with other data sources, have considerations attached to them. NCSES describes the challenges of reporting race and ethnicity data as follows:
The collection and reporting of race and ethnicity data pose several problems. First, both the naming of population subgroups and their definitions have changed over time. Second, many of the groups of particular interest are quite small, so it is difficult to measure them accurately without larger samples or surveys of the entire population of interest. In some instances, sample surveys may not have had sufficient sample size to permit the calculation of reliable racial or ethnic population estimates for all groups; consequently, data are not shown for some groups. The Census Bureau’s Current Population Survey, for example, does not provide data on unemployment among American Indians. Third, data on race and ethnicity are often based on self-identification. Fourth, it is easy to overlook or minimize heterogeneity within racial or ethnic subgroups when only a single statistic is estimated for their entire population (NCSES, 2021b).
Pertaining to this last point about heterogeneity within racial and ethnic subgroups, one limitation of the NCSES categories is that they do not adequately capture the diversity of individuals included in a particular group. Every data set and accompanying definitions present advantages and disadvantages in terms of use, and while some methods are better than others, there is no ideal way to capture the full richness of racial and ethnic diversity to describe a population.
The Changing Nature of Racial Categories in the U.S. Census and Beyond
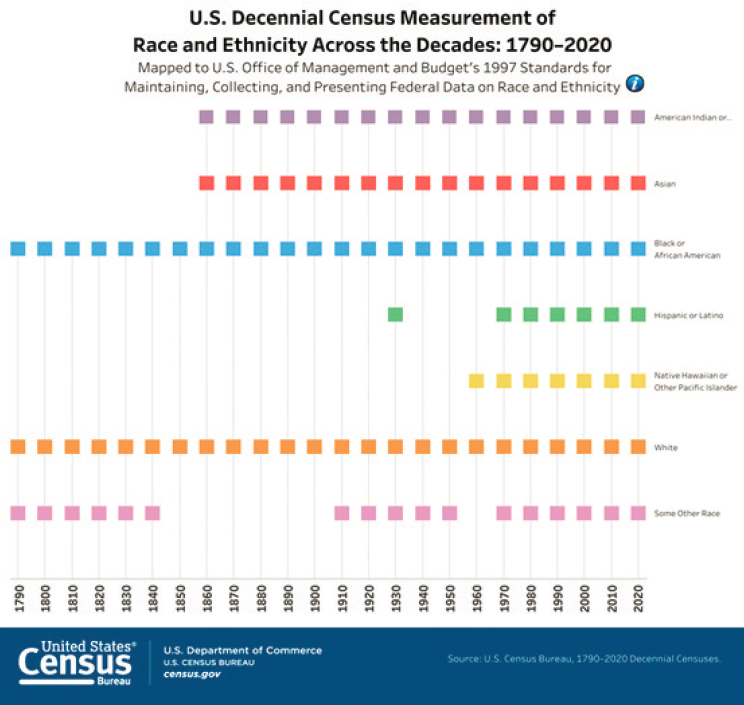
Since the first census in 1790, the U.S. government has included racial categories; however, the ways in which the government has measured race and ethnicity have changed from census to census as the politics and definitions of these categories have evolved (Parker et al., 2015). The history of racial and ethnic categories in the U.S. Census and the ways in which they have changed over time reflects the evolving nature of race in this country and the fact that race and ethnicity are socially constructed
categories (Figure 3-1). Along with the categories themselves, the data collection process has also changed. Prior to the 1960 Census, which introduced by-mail response, the majority of individuals self-identify race or ethnicity on their survey (U.S. Census Bureau, n.d.). Instead, federal census takers or enumerators—and not individual citizens being counted—determined a person’s race based on their direct observations.
Limitations imposed on racial identity by the basic structure of the U.S. Census Bureau go beyond self-identification. Prior to the 2000 Census, individuals could only choose one race to describe themselves (Brown, 2020). This is changing, however. In 2000, people who identify with more than one race were allowed to choose multiple races when responding to
SOURCE: U.S. Census Bureau, 2021b.
the race question (U.S. Census, 2021a,b). The 2020 Census offered a field to further describe national heritage for individuals who listed themselves as either White or Black, such as German, Lebanese, African American, or Somali (Brown, 2020). In addition, in 2020, people who identify with more than one race were allowed to choose multiple races when responding to the race question (U.S. Census Bureau, 2021a,b).
Categorizing Race and Ethnicity
The first census, in 1790, had only three racial categories: free Whites, all other free persons, and slaves. At that point, Indigenous people and Native Americans were not counted in the census. The 1860 census included American Indians living in the general population, and in 1900, for the first time, the census included American Indians on reservations and in the general population. The Census Bureau has acknowledged that American Indian and Alaska Native populations were significantly undercounted in censuses as recently as 2010 (U.S. Census Bureau, 2012, 2022a).
One challenge regarding STEMM-related data is that the population of individuals identifying as American Indian or Alaska Native in STEMM fields is small and often omitted from studies because the numbers are considered statistically insignificant (Shotton, 2013). As one group of scholars noted, this has led to a phenomenon referred to as the “American Indian research asterisk” that fails to include American Indian and Native Alaskan populations in research (Garland, 2007). In some of the tables in this chapter, data are shown separately for (i) American Indian or Alaska Native and (ii) Native Hawaiian or Other Pacific Islander (discussed below). In some of the graphs in this chapter, “Indigenous” is used to represent the sum contribution of these racial and ethnic groups.
Historically, Native Hawaiians and Pacific Islanders were lumped together with Asian American in an umbrella racial category (Asian Pacific Institute on Gender Based Violence, n.d.). Only in 2000 did the U.S. Census make the Native Hawaiian and Pacific Islander a racial category distinct from the Asian American category (Access, Equity and Belonging Committee, n.d.). However, even the category Native Hawaiian or Other Pacific Islander is broad and does not necessarily reflect the full diversity and cultures of these peoples. As with American Indian and Alaska Natives, Native Hawaiians and Pacific Islanders have been undercounted for decades (Georgetown Law, 2017).
Regarding Asian Americans, the census first included data in 1860 for individuals identified as Chinese, with Japanese added as a category in 1870, and Filipino, Hindu, and Korean added in 1910 (Holland and Palaniappan, 2012). Although the Census Bureau has collected demographic information
on Asian American subgroups for quite some time, the census reports typically have not provided disaggregated data and, instead, refer to Asian Americans as a seemingly monolithic group. Furthermore, and as noted above, the census lumped Asian Americans, Native Hawaiians, and Pacific Islanders into one category prior to 2000. It is likely that some of the more than 50 Asian American ethnicities (Chau and Chan, 2021) are underrepresented in STEMM, although the aggregated Asian American population is not (Iporac, 2020).
Even the category definition of White has changed over time. Initially, “white” referred only to Anglo-Saxon people. For example, Italians arriving in the United States in the decades of mass emigration from Europe between the late 1870s and the early 1920s were not regarded as fully “white” but were considered “our temporary negroes” or “not-yet-white ethnics” (Yang and Koshy, 2016). As the Pew Research Center noted in 2015, “In a society where whites had more legal rights and privileges than people of other races, detailed rules limited who was entitled to be called ‘white’ in the census. Until the middle of the 20th century, the general rule was that if someone was both white and any other non-white race (or ‘color,’ as it was called in some early censuses), that person could not be classified as white” (Parker et al., 2015).
In 2020, many media outlets and style guides shifted to the capitalization of the “b” in Black when referring to Black or African American people, prompting a conversation on whether the “w” in “White” when it refers to race should also be capitalized (Daniszewski, 2020; Darling-Hammond, 1998) This is a contentious issue, with some arguing that capitalizing the term “White” risks legitimizing White supremacy (Nguyn and Pendleton, 2020). The committee has taken the position to capitalize White as a matter of consistency and that not capitalizing White when it refers to race could imply that White is the default race. The decision to capitalize “White” has been adopted by the National Academies Press (see Chapter 1 for more information).
Hispanic or Latine
Hispanic and Latine are both ethnicities. Hispanic refers to people from Spain or from Spanish-speaking countries in Latin America who can be of any race; it does not include individuals with Brazilian heritage. Latine refers to people from Latin America regardless of language (Lopez et al., 2022). The inclusion of Hispanic or Latine in the U.S. Census only dates to the 1980 Census (Parker et al., 2015). Since then, OMB developed standards for collecting data on Hispanic individuals in 1997 and revised them in 2016.
Given that Hispanic is an ethnicity and can be combined with any race, it has posed challenges as a data category, and the Census Bureau has acknowledged confusion on the part of many Hispanics over the way race
is categorized and how the census form asks about it (U.S. Census Bureau, 2021a,b). Civil rights advocates have expressed concern that an all-in-one race and Hispanic question could lead to a “possible loss of race data through a combined race and Hispanic origin question, the diminished accuracy of detailed Hispanic subgroup data, and the ability to compare data over time to monitor trends” (Parker et al., 2015).
Intersectionality and the Consideration of Other Demographic Groups
In addition to having data limited by an inadequate number of categories, another challenge in reviewing data by race and ethnicity alone is that it fails to capture trends or insights at the intersection of race, ethnicity, and other demographic characteristics such as sex, gender identity, age, religion, disability, economic status, education, and others. There are several important impacts to consider with intersectionality, particularly at the intersection between race, ethnicity, and gender, as two separate consensus study reports from the National Academies note:
Many employers, including those at educational institutions have adopted programs and the policies aimed at improving equity and diversity in STEMM without considering the complex, cumulative ways in which multiple intersecting identities influence outcomes of the interventions. For women of color in particular, multiple forms of discrimination, such as racism and sexism, intersect to shape their experiences (the National Academies of Sciences, Engineering, and Medicine, 2020).
For example, it is generally understood that women of color experience unique forms of gender and racial discrimination, but what is often lost in translation is the fact that women of color are not a monolithic group. . . . As a whole, women of color require distinct and unique supports, relative to the inequitable power and social systems they experiences; however these supports must be informed by the varying experiences and challenges face by different women of color (the National Academies, 2022).
Whenever possible, the committee looked to disaggregate data and review trends with an intersectional lens; however, given the presentation and limitations of publicly available data, this level of analysis was not always possible. In such instances, given the charge to focus on race and ethnicity, the committee prioritized understanding numerical representation primarily through that lens.
The changing nature of how race and ethnicity categories have been defined and assessed underscores the fact that race and ethnicity are socially constructed categories that are dynamic and changing constantly because of sociopolitical forces. The relevance of these category fluctuations to this
report is that they have created persistent knowledge gaps and challenges for how race and ethnicity data are monitored over time, as well as implications for understanding nuance within race and ethnicity groups. Given that there is no perfect way to capture the full richness of diversity in the U.S. population, collecting racial and demographic data in the United States is likely to remain a complex issue.
The following section presents data that articulates the demographic trends and shifts that have occurred in the United States. As the remainder of the chapter and report will demonstrate, understanding the demographic data and shifts that have occurred in the United States is critical for understanding who is (and who is not) earning STEMM degrees, and who is (and who is not) numerically represented in the STEMM workforce.
U.S. DEMOGRAPHIC TRENDS
For general demographic information regarding the U.S. population, the committee relied on data from the 2020 Census as reported by the Census Bureau. According to census data, nearly all racial and ethnic groups have seen population gains since 2010. Only the White population experienced both an absolute decline and a decline relative to other groups, falling 8.6 percent since 2010 as a percentage of the U.S. population. Relevant highlights from the 2020 Census (Figures 3-2 and 3-3) show:
- White remained the largest racial or ethnic group in the United States, with 204.3 million people identifying as White alone, and 235.4 million people identifying as White alone or in combination with another group. However, the proportion of White people alone has fallen by 8.6 percent since 2010 and continues to be in decline in comparison to all other groups. The decline in the number of White persons in the United States between 2010 and 2020 is unprecedented (Frey, 2020).
- The self-defined multiracial population grew substantially since 2010, increasing from nine million people in 2010 to 33.8 million people in 2020, a 276 percent increase; the “in combination” multiracial populations for all race groups accounted for most of the overall changes in each racial category.2
- The Black population grew 8.5 percent between 2010 and 2020, adding 1.7 million individuals to the nation’s total population; this
___________________
2 As mentioned previously, before 2020, individuals could only select one race. The increase in multiracial may related to the ability to select two races, allowing individuals to select one race in addition to the U.S. census category “Two or More Races.”
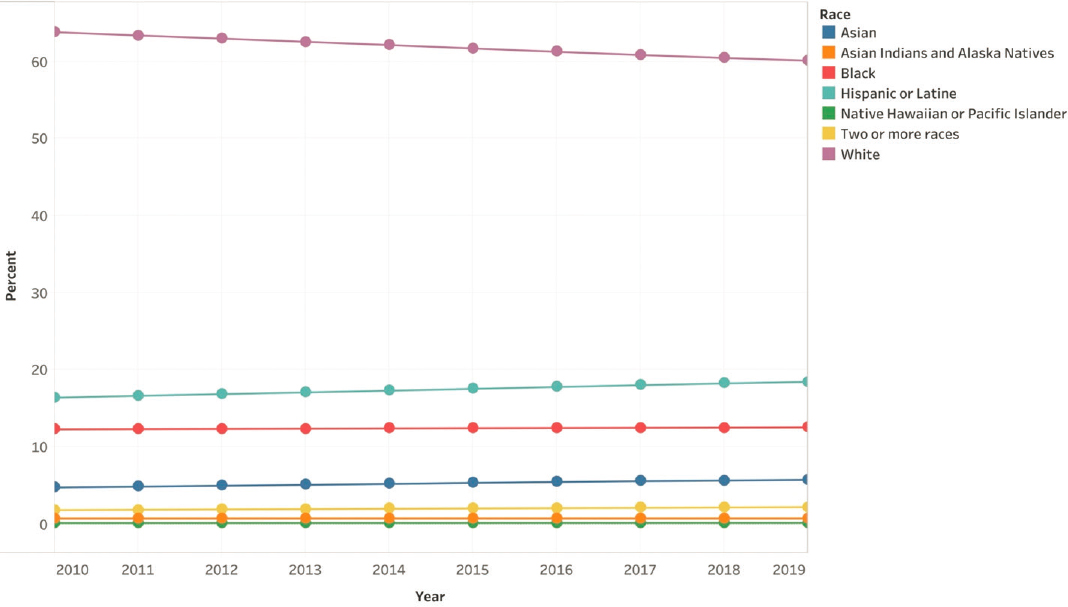
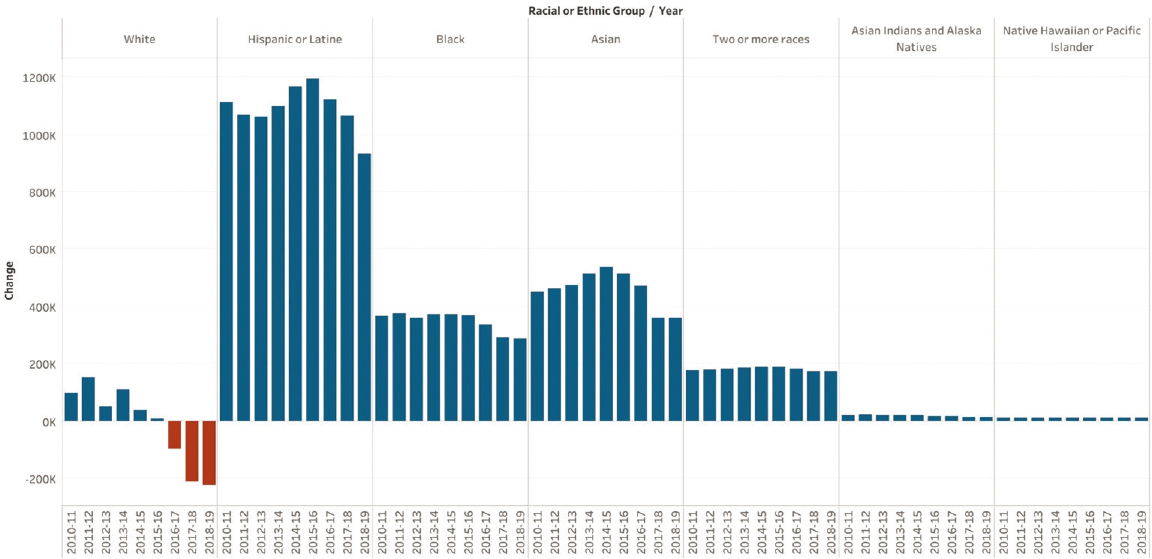
SOURCE: U.S. Census Bureau, 2021d, adapted from Frey, 2021.
___________________
3 For categories other than Hispanic of Latine, these figures reflect the non-Hispanic population figures.
- was the smallest growth in percentage and number among all races and ethnicities (Frey, 2020).
- The Hispanic or Latine population, which includes people of any race, grew by 23 percent between 2010 and 2020, totaling 62.1 million people in 2020. In comparison, the population that was not of Hispanic or Latine origin grew 4.3 percent since 2010 (Jones et al., 2021).
- The Asian racial or ethnic group alone grew 35.5 percent between 2010 and 2020 and totaled 19.9 million people, while Asian in combination with another race grew by 55.5 percent over the same period (Monte and Shin, 2022; U.S. Census Bureau, 2021c).
- The American Indian and Alaska Native alone population grew by 27.1 percent between 2010 and 2020 and totaled 3.7 million people. The American Indian and Alaska Native and another race population totaled 5.9 million individuals, an increase of 160 percent since 2010 (U.S. Census 2022b, 2021c).
- The Native Hawaiian and Other Pacific Islander population grew by 27.8 percent between 2010 and 2020 and totaled just under 690,000 individuals. The Native Hawaiian and Other Pacific Islander in combination population grew by 30.8 percent and included just over 890,000 people (Monte and Shin, 2022; U.S. Census, 2021c).
The Census Bureau urges users of census data to exercise caution when making data comparisons between the 2010 and 2020 census figures to account for changes the Census Bureau made to the Hispanic origin and race questions and the ways it codes how people self-report their race and ethnicity (Jones et al., 2021). The Census Bureau notes that people may change how they self-identify regarding their race given that racial categories are social constructs that have been fluid over time (Brown, 2020). The Census Bureau plans to continue to refine its demographic categories to reduce these ambiguities (U.S. Census Bureau, 2021a).
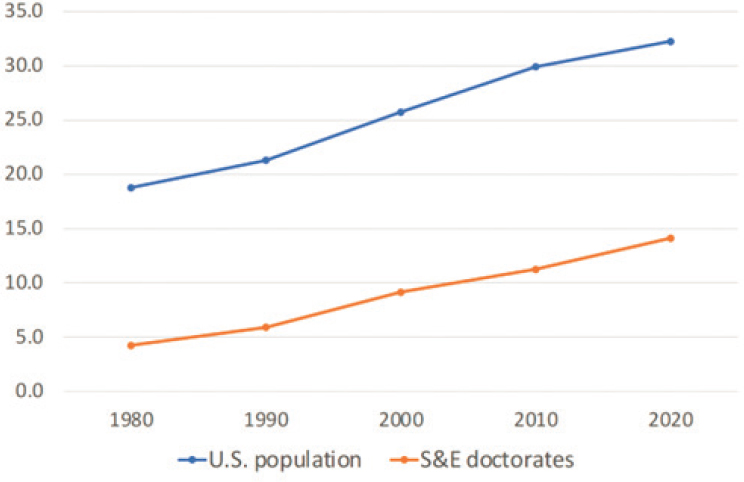
The proportion of the U.S. population that is non-White steadily increases with decreasing age groups; for instance, the group of persons 18 and younger is 50 percent non-White (NCSES, 2021a). Assuming these demographic trends continue, the NCSES estimated that the total population of individuals from historically minoritized racial and ethnic groups will comprise a numeric majority, accounting for more than 50 percent of the total U.S. population, before the year 2050 (Figure 3-4).
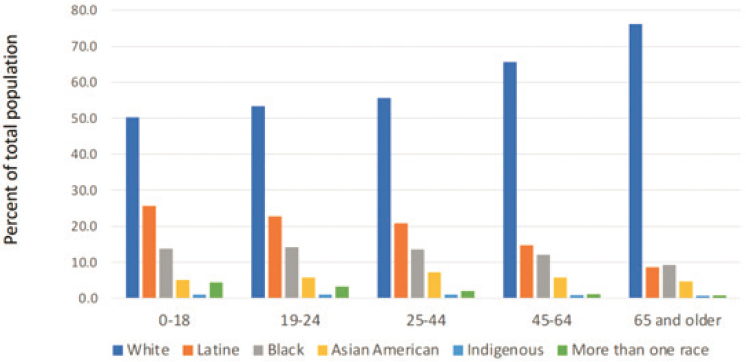
SOURCE: NCSES, 2021a.
REPRESENTATION BY RACE AND ETHNICITY IN U.S. STEMM HIGHER EDUCATION
When it comes to demographic data and trends on enrollment and degree attainment, the focus of observations and research has been on the individuals who stay in the system, with less data available about the individuals who leave STEMM and higher education altogether. With that caveat, U.S. postsecondary education enrollment of individuals who identify as Asian American, Black, Latine, Pacific Islander, or as Two or More Races (in the official parlance of the Census Bureau) has increased in the 1980–2019 period according to NCES (Figure 3-5). The most significant increase occurred in the Latine population, growing from four percent in 1980 to 20.3 percent in 2019. Black enrollment peaked in 2010 at 15 percent before declining to 13.3 percent in 2019 (National Center for Education Statistics Institute of Education Sciences, 2021).
AAMC data for medical school attendees covering the years 2017–2022 (AAMC, 2022) show that total enrollment at U.S. medical schools increased by 20.8 percent, from 51,680 to 62,443 (AAMC, 2022). Enrollment of students who identify as Asian American, Black, Latine, or Native Hawaiian or Pacific Islander increased by 32.9 percent and accounted for 48.7 percent of medical school students in 2022, up from 44.3 percent of medical school students in 2017 (AAMC, 2022). Black student enrollment grew the most over that period, increasing by 47.6 percent, followed by Native Hawaiian or Other Pacific Islander, which increased
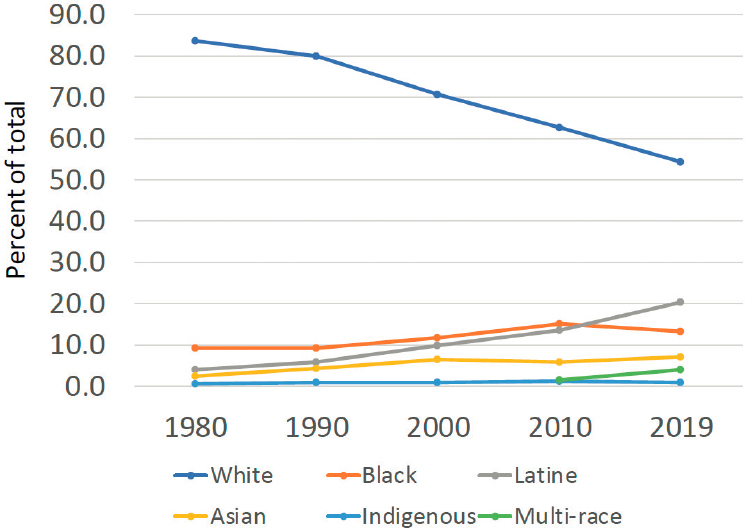
SOURCE: National Center for Education Statistics Institute of Education Sciences, 2021.
by 39.1 percent, American Indian or Alaska Native by 35.0 percent, Hispanic or Latine by 31.1 percent, Asian by 29.1 percent, and White by 7.2 percent (AAMC, 2022).
In terms of medical school, the AAMC data for medical school attendees, and the data covering the years 2018–2019 to 2022–2023 show that total enrollment at U.S. medical schools increased by 5.8 percent, from 91,225 to 96,520 (AAMC, 2022). Enrollment of students who identify as Black, Latine, American Indian or Alaska Native, or Native Hawaiian or Pacific Islander increased by 22.3 percent from 12,113 in the 2018–2019 academic year to 14,818 in 2022–2023 (AAMC, 2022). Most racial and ethnic groups showed growth in enrollment: Black student enrollment increased by 26.0 percent; Native Hawaiian or Other Pacific Islander by 47.0 percent; American Indian or Alaska Native by 8.9 percent; Hispanic or Latine by 18.3 percent; and Asian by 13.6 percent. In that time period, White enrollment decreased by 6.4 percent (AAMC, 2022).
Representation by Race/Ethnicity Among S&E Degree Recipients
Data from NCSES for S&E degree recipients in 2018 reveal the following (Figure 3-6):
- White students earned an increasing share of total degrees in the progression from associate degrees to doctoral degrees, with the total combined percentage of students from all other racial and ethnic groups declining.
- Compared to the U.S. population 18–24 years of age, White people are overrepresented among bachelor’s, master’s and doctoral recipients, and underrepresented among associate degree recipients.
- Compared to the U.S. population 18–24 years of age, Latine people are overrepresented among associate degree recipients, and Asian Americans are overrepresented among all four postsecondary degree recipients.
- Compared to the U.S. population 18–24 years of age, Black individuals are underrepresented in all of the S&E degree recipients.
- Black students have a larger share of the total at the associate’s and master’s degree levels in comparison to their shares of bachelor’s and doctoral degrees.
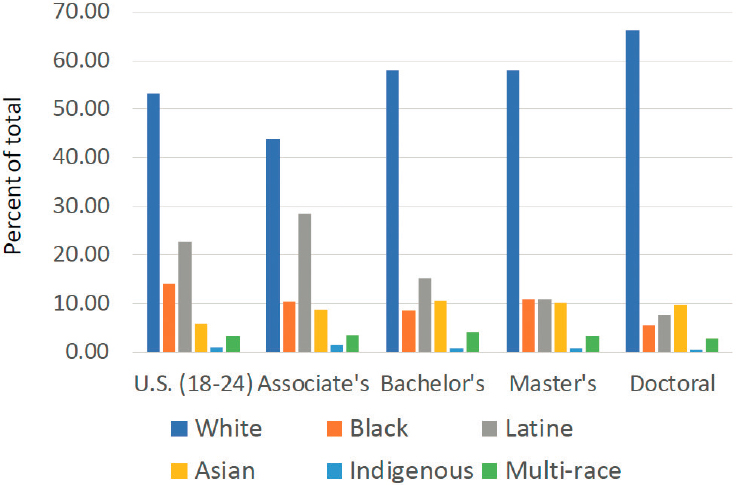
SOURCE: NCSES, 2021a.
- Persons identifying as belonging to groups indigenous to the United States and its territories—including American Indian, Alaska Native, Native Hawaiian, and Other Pacific Islander—are most represented at the associate degree level.
- Persons identifying as Black or Latine or Hispanic are underrepresented among medical school attendees compared to the percentage of 18–24 year olds who identify with those racial and ethnic identities. Persons who identify broadly as Asian are overrepresented numerically in medical schools (AAMC, n.d.b).
Changes in Racial and Ethnic Representation Among Degree Recipients, 2011–2019
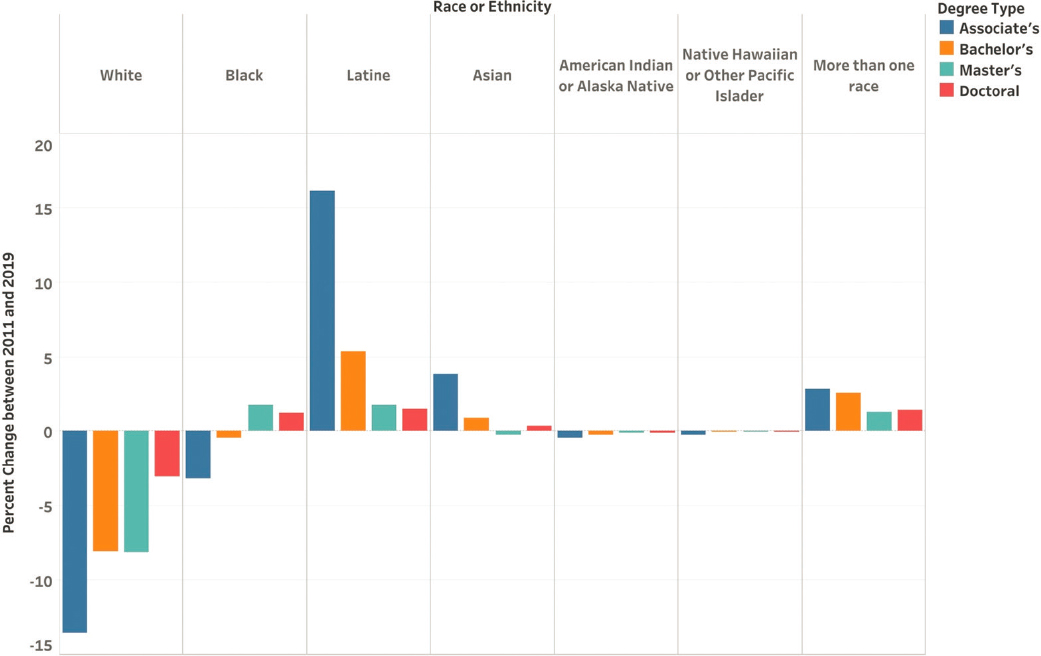
The following tables and accompanying figures summarize NCSES data on the numbers of people who earned postsecondary S&E degrees in 2011 and 2019.4 (NCSES data report “S&E” degrees and do not include individuals in medicine and related degrees.) The degrees include associate’s, bachelor’s, master’s, and doctoral degrees, and these data are provided in two formats, Figure 3-7 below and in a series of tables in Appendix B. Figure 3-7 below illustrates the changes in the proportion of total degrees earned by race and ethnic group and by degree from 2011 to 2019. The exact attainment data can be referenced in Appendix B.
The data for the four postsecondary science and engineering degrees summarized in the tables and graphs above reveal the following trends:
- In all four levels of S&E degrees, the number of degree recipients increased from 2011 to 2019 for Asian American people, Black or African American people, Latine people, or Hispanic American people, and White People.
- The numbers of S&E degree recipients identifying as American Indian, Alaska Native, Native Hawaiian, and Pacific Islander were small relative to the other racial/ethnic groups, and there was little change in the numbers between 2011 and 2019.
- For all four degrees, the proportion of White degree recipients decreased between 2011 and 2019, with the largest decrease among associate’s degree recipients and the smallest decrease among doctoral degree recipients.
- In all four degrees, the proportion of Latine degree recipients significantly increased.
___________________
4 NCSES data report “S&E” degrees and do not include individuals in medicine and related degrees.
SOURCE: U.S. Census Bureau and NCSES Survey of Earned Doctorates, 2022.
- The proportion of Asian American degree recipients significantly increased among associate degree recipients, and more modestly among bachelor’s and doctoral recipients.
- For all four degrees, the proportion of persons identifying as being of more than one race increased significantly.
- As the non-White portion of the U.S. population increases, so too does the proportion of non-White degree recipients. However, the increases for historically minoritized racial and ethnic groups do not appear to keep up with the change in U.S. population (see Figure 3-8 above).
- For all four degrees, the total number of females (all races/ethnicities combined) increased. Females were in the majority among bachelor’s and doctoral degree recipients.
- For all four degrees, the proportion of females identifying as Asian American and Latina increased.
- The proportion of Black females increased among doctoral recipients, but decreased among associate’s and bachelor’s degree recipients.
- For all four degrees, the proportion of White females decreased.
___________________
5 The sources do not include data for Native Hawaiian and Pacific Islander.
CONCLUSION 3-1: Although the representation of minoritized persons in science, technology, engineering, and mathematics higher education is increasing, the collective attainment of science and engineering degrees for Black people, Indigenous people, and Latine people does not reflect their corresponding growth in the U.S. population.
The data shown above from NCSES and NCES, along with data from NSF and the National Science Board (National Science Board, 2019; NCSES, 2021a), demonstrate that in recent history, minoritized individuals’ numeric representation in STEM higher education has increased. Despite improvements, the collective attainment of S&E degrees for Black, Indigenous, and Latine Americans lags behind the U.S. population, and these racial/ethnic groups remain underrepresented throughout all sectors of the U.S. STEM enterprise. When looking into discipline-specific data within STEM from NCSES, Black, Indigenous, and Latine students are better represented in behavioral and social sciences than they are in engineering and natural sciences. Furthermore, some data suggest that minoritized individuals disproportionately leave STEMM (Estrada et al., 2016; Hatfield et al., 2022) and are underrepresented among bachelor’s, master’s, and doctoral degree recipients, though additional data are needed (more on exiting STEMM in Chapter 5).
STEM Higher Education Areas for Further Exploration
The committee identified three topics for further consideration:
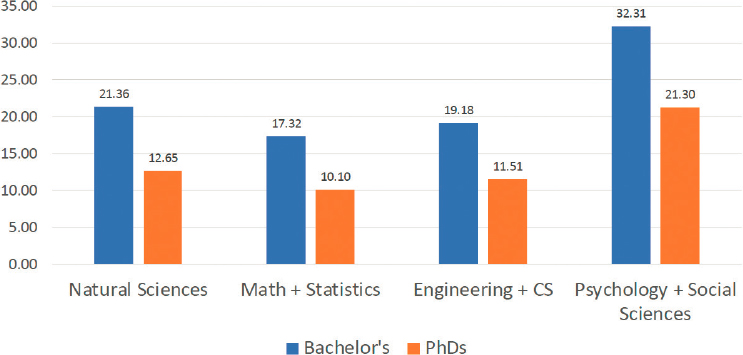
- Differences between STEM disciplines. The tables and graphs above aggregate NCSES data for S&E degree recipients. What is not shown are degree attainment data for individual S&E disciplines, which include a broad swath of disciplines including engineering and computer sciences, the natural sciences, mathematics and statistics, and social and behavioral sciences. There are disciplinary differences in degree attainment by persons from different racial or ethnic groups. An examination of degree recipients who identify as Black, Indigenous, and Latine reveals a significant difference in representation between the behavioral and social sciences and the other STEM disciplines (Figure 3-9). As can be seen from Figure 3-9, within STEM, Black, Indigenous, and Latine Americans are more represented in the behavioral and social sciences than they are in engineering and natural sciences.
- Measuring persistence in STEM. A second area for further analysis is to understand the persistence of students in the STEM degrees.
SOURCE: NCSES, 2021a.
- This requires knowing the demographics of the students entering college intending to study STEM, and their educational outcomes—How many graduated with a STEM bachelor’s degree? How many switched to a non-STEM major? How many left college with no degree? Earlier reports suggest that the persistence rate of persons from excluded ethnic or racial groups—including Black, Indigenous, and Latine persons—is significantly less than that of whites and Asian Americans (e.g., Asai, 2020; Huang et al., 2000; the National Academies, 2011; Riegle-Crumb et al., 2019). The data required to measure persistence would include: (i) by race/ethnicity, who is entering college intending to major in STEM (separated by two- and four-year institutions), (ii) of these students, who completed the STEM bachelor’s degree, and (iii) who completed
___________________
6 Underrepresented groups include Black or African American, persons from Indigenous groups—American Indian, Alaska Native, Native Hawaiian, Other Pacific Islander—and Latine or Hispanic American. NCSES defines “natural sciences” to include agricultural sciences; biological sciences; earth, atmospheric, and ocean sciences; mathematics and computer sciences; and physical sciences (astronomy, chemistry, physics). NCSES defines “social and behavioral sciences” to include psychology, anthropology, area and ethnic studies, economics, linguistics, political science and public administration, and sociology. Shown are the proportions of degree recipients who identify as persons from underrepresented ethnic or racial groups (NCSES, 2022).
- master’s and doctoral degrees in STEM. The committee was unable to assemble the necessary national data to measure persistence.
- Effects of recent disruptions on enrollment and degree attainment. The postsecondary degree data summarized above are from the years prior to the COVID-19 pandemic, which began in 2020 and significantly impacted student enrollment and retention. It appears that the disruption differentially affected students depending on several factors, including their race and ethnicity, first-generation status, and family financial resources. It will be important to revisit the enrollment and degree attainment data in several years (NCSES, 2022).
CONCLUSION 3-2: Currently-available data on students who intend to study science, technology, engineering, and mathematics in their undergraduate degrees leave out important information on educational outcomes, including persistence, completion, and transfer to other degree programs.
RECOMMENDATION 3-1: To understand the relative persistence of students in STEM higher education, data collection organizations, such as the National Center for Science and Engineering Statistics and the National Center for Education Statistics, should collect and share with the public information on the demographics of students entering college planning to study science, technology, engineering, and mathematics (STEM) and their subsequent educational outcomes, disaggregated by race and ethnicity, gender, and field of study, including:
THE U.S. STEMM WORKFORCE
The committee also examined data to gain a deeper understanding of the numeric representation of minoritized individuals in the U.S. STEMM workforce. For the purposes of this report, the committee understood STEMM workplaces to include businesses, the pharmaceutical sector, nonprofit organizations, industry, consultants, hospitals, and institutions of higher education. The committee did not include the significant number of STEMM professionals who work for government, given the scope of the statement of task.
There are many ways to measure the STEMM workforce. According to NCSES, there has been a move for a more inclusive definition of the STEMM workforce that includes workers from all educational backgrounds and in middle-skilled and technical positions rather than the historic definition of people with a bachelor’s degree or above in STEMM. Using this
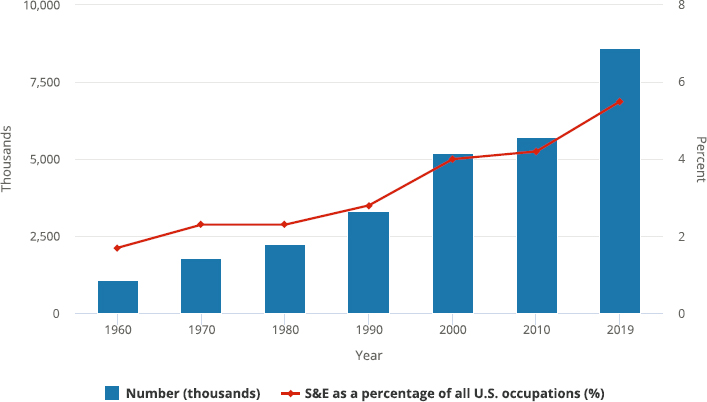
broader definition, the STEMM workforce was approximately 29 million people of all educational backgrounds (National Center for Science and Engineering Statistics, 2021c), while the American Community Survey (ACS) puts the number of individuals working in S&E-specific, S&E-related, and middle-skill occupations at 36 million people of all educational backgrounds, representing 23 percent of the total workforce in 2019. NCSES measured individuals in S&E-specific occupations at nearly seven percent of the total workforce in 2019 (Figure 3-13; National Center for Science and Engineering Statistics, 2021c). ACS recorded a 2.3 percent increase in the STEM workforce from 2010 to 2019, exceeding the 1.4 percent increase for U.S. employment overall (National Center for Science and Engineering Statistics, 2021c). Individuals with bachelor’s degrees and higher account for approximately 7.5 million S&E jobs, according to NCSES data, and NIH supported 46,371 individuals in the biomedical workforce in 2019. The number and proportion of persons employed in S&E-specific occupations have substantially increased over time (Figure 3-10).
The industry sectors that employed the largest number of S&E professionals in 2019 at all levels of education included professional, scientific, and technical services, at 2.4 million; manufacturing, at 1 million; education services, at 713,000; federal, state, and local government, at 672,000; and information, at 614,000. Other significant employers of S&E professionals included finance and insurance, at 414,000; management of companies and
SOURCE: NCSES, 2021a.
TABLE 3-1 Persons Employed in Different S&E Professions by Race and Ethnicity and Discipline
| Total | White | Black | Latine | Asian | Indigenous | |
|---|---|---|---|---|---|---|
| Computer and mathematical sciences | 3,744 (100%) | 2,259 (60%) | 214 (5.7%) | 238 (6.3%) | 955 (25.3%) | 6 (0.2%) |
| Biological and medical sciences | 500 (100%) | 300 (60%) | 18 (3.6%) | 40 (7.9%) | 130 (26%) | S |
| Physical sciences | 409 (100%) | 300 (73.3%) | 18 (4.4%) | 27 (6.7%) | 55 (13.5%) | 1 (0.2%) |
| Behavioral and social sciences | 663 (100%) | 480 (72.4%) | 47 (7.1%) | 77 (11.6%) | 44 (6.7%) | 2 (0.3%) |
| Engineering | 1,921 (100%) | 1,305 (67.9%) | 77 (4%) | 159 (8.3%) | 331 (17.2%) | 5 (0.2%) |
| Health-related professions | 5,728 (100%) | 3,895 (68%) | 399 (7%) | 491 (8.6%) | 754 (13.2%) | 48 (0.8%) |
| S&E managers | 999 (100%) | 679 (68%) | 70 (7%) | 99 (9.9%) | 135 (13.5%) | S |
| S&E precollege teachers | 925 (100%) | 719 (77.8%) | 54 (5.8%) | 95 (10.2%) | 34 (3.7%) | 2 (0.2%) |
| S&E technicians | 973 (100%) | 560 (57.6%) | 84 (8.6%) | 115 (11.8%) | 189 (19.4%) | 3 (0.3%) |
SOURCE: NCSES, 2021a.
enterprises, at 360,000; administrative and support and waste management and remediation, at 285,000; and health care and social assistance, at 248,000. The U.S. Bureau of Labor Statistics projects that the number of jobs available in S&E occupations will grow by 12.7 percent between 2019 and 2029, compared to 3.7 percent for all occupations. The racial/ethnic representation in selected STEMM professions is shown in Table 3-1.
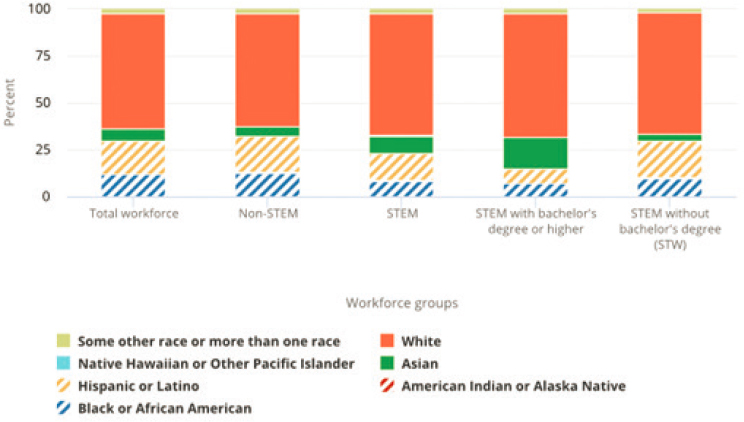
Although individuals from Black or African American, Hispanic or Latine, and American Indian or Alaska Native populations represent greater than 30 percent of the employed U.S. population, they account for only 23 percent of the STEM workforce with bachelor’s degrees or higher (see Figure 3-11). White individuals constitute the largest group in the STEM workforce with bachelor’s degrees or higher, followed by Asian Americans. In contrast, Black or African American individuals, who account for 11 percent of total jobs, constitute only nine percent of all STEM jobs and 5.1 percent of the S&E workforce with bachelor’s degrees or higher. Hispanic and Latine people, who account for over 17 percent of the total jobs, constitute only eight percent of the STEM workforce (broadly) and 7.6 percent of the total S&E workforce. Native Hawaiian or Other Pacific Islander make up 0.2 percent of the total S&E workforce with bachelor’s degrees or higher, while American Indian and Alaska Native figures are not reported because of insufficient numbers, as was noted above.
Of the 191,512 full-time faculty members at U.S. medical schools in 2021 (AAMC, 2021), 119,341 (62.3%) identified as White. In comparison, 40,148 faculty members (21.0%) identified as Asian; 7,231 (3.8%) identified as Black or African American; 6,585 (3.4%) identified as Hispanic or Latine; 4,709 (2.5%) identified as Hispanic and at least one other race or
ethnicity; 4,046 (2.1%) identified as non-Hispanic and at least one other race; 295 (0.15%) identified as American Indian or Alaska Native; and 161 (0.084%) identified as Native Hawaiian or Other Pacific Islander.
In terms of the total health care workforce, 60 percent of health care workers in 2019 were White, 16 percent were Black, 13 percent were Hispanic or Latine, and seven percent were Asian (Laughlin et al., 2021). Black and Hispanic health care workers made up relatively larger shares of aides and personal care workers and direct contact support workers and accounted for fewer health care providers (Figure 3-12). Of all active physicians in 2018 (AAMC, 2019), 56.2 percent identified as White, compared to 17.1 percent who identified as Asian, 5.8 percent who identified as Hispanic or Latine, five percent who identified as Black or African American, 0.3 percent who identified as American Indian or Alaska Native, and 0.1 percent who identified as Native Hawaiian or Pacific Islander; individuals whose race or ethnicity were not known accounted for 13.7 percent of active physicians. One recent study found that Black, Hispanic, and Native American people were underrepresented in ten different health care professions in 2019 (Salsberg et al., 2021).
According to the 2020 U.S. census, approximately seven million people worked in general medical, surgical, or specialty hospitals (Figure 3-13). By race and ethnicity, there was substantial variation across the health
SOURCE: NCSES, 2021c.
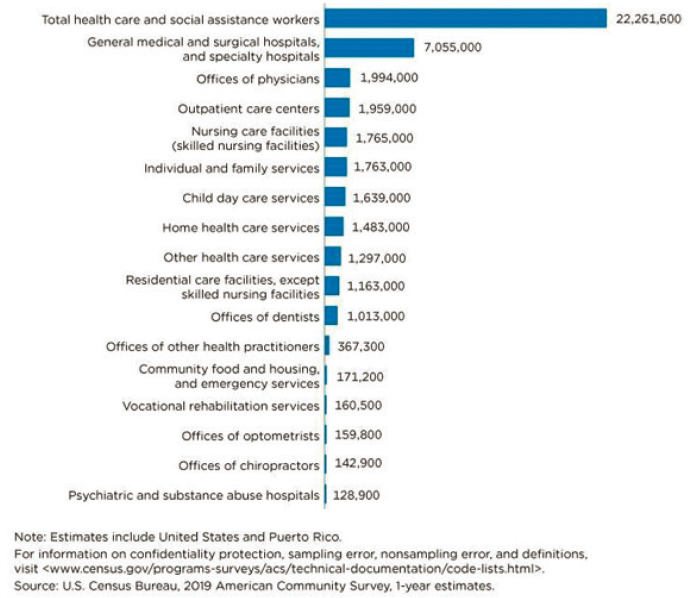
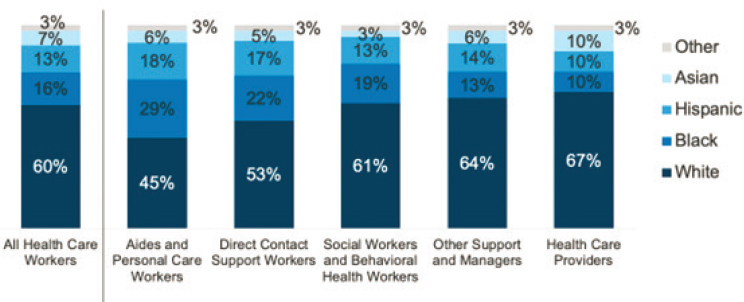
worker categories. White individuals constituted the largest percentage of health care workers at 60 percent. Black individuals accounted for 16 percent of the health care workforce, Hispanic individuals accounted for 13 percent, and Asian individuals constituted seven percent.
Intersection of Race, Ethnicity, and Gender
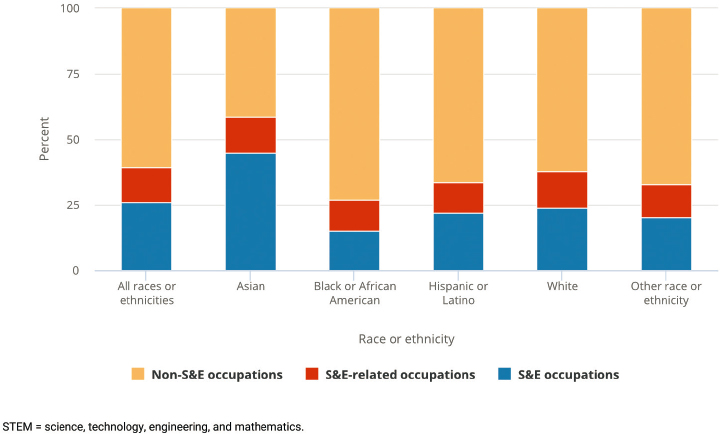
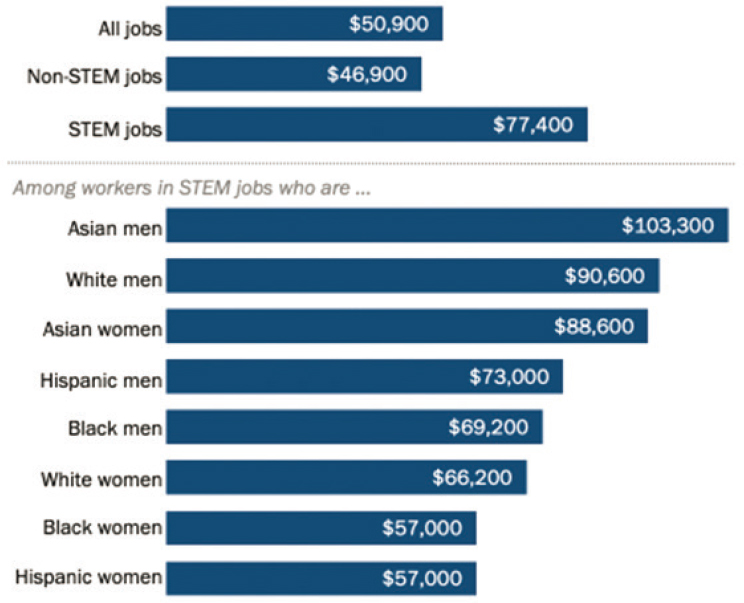
Figure 3-14 highlights the disproportionately low representation of women from minoritized racial and ethnic groups in STEM fields. While over half of employed Asian American women work in S&E-related and S&E occupations, White, Hispanic, Black or African American women, and women of other race or ethnicity work predominantly in non-S&E-related occupations. Futhermore, regardless of the proportion of women in the STEMM fields, women earn less than their men counterparts in all racial and ethnic groups (Figure 3-15), and Asian American women on average make more than Hispanic or Black men. The median salary for all S&E occupations in 2019 was $96,000, compared to $80,000 for all occupations. For women, the median salary for all S&E occupations was $82,000 compared to $100,000 for men.
In terms of promotion and advancement, men are more represented in supervisor ranks than women, and White individuals are more represented
SOURCE: NCSES, 2021a.
SOURCE: Pew Research Trusts (Fry et al., 2021).
than individuals from other racial and ethnic groups. While Asian men and women earn more on average, that does not necessarily translate into supervisory status.
STEM Employees in Industry
According to the U.S. Bureau of Labor Statistics, five industry groups—information; professional, scientific, and technical services; manufacturing; educational services; and government—employed nearly three-quarters of the total S&E workforce across all education levels. Those same five industrial groups accounted for one-third of total U.S. employment. Industries in which S&E jobs accounted for the highest proportion of their total employment included information, utilities, and management of companies and enterprises. Those with the lowest percentage of S&E jobs included health care and social assistance, retail trade, and accommodations and food services (NCSES, 2019).
STEM Employees in Academia
Over 2.3 million individuals whose highest degree was in an S&E field work in higher education, accounting for 15.3 percent of all employed individuals whose highest degree was in an S&E field. Of those individuals with STEM degrees working in higher education, 1.3 million work at four-year institutions, with the remaining 1.0 million working at two-year and precollege institutions. According to NCSES’s National Survey of Doctorate Recipients, which collects workforce data for individuals with science, engineering, or health research doctorates, some 350,000 individuals who received their doctorates in science, engineering, and health in the United States work in academia. While the majority of these individuals are full-time faculty, the percentage employed as full-time faculty has fallen from approximately 90 percent in the early 1970s to 70 percent in 2019 (National Science Board, 2021). Between 1997 and 2019, the percentage of individuals from unrepresented minority groups in science, engineering, and health doctoral degrees working in all academic positions and full-time faculty positions increased from six percent to nine percent (NCSES, 2019).
CONCLUSION
The final sections of this chapter have examined demographic trends over time in the STEMM workforce. In sum, the data demonstrate that the STEMM workforce has been increasing over time, represents a sizable sector of the current U.S. workforce, and is projected to continue growing in the future. Individuals from historically minoritized racial and ethnic groups represent a numerical minority of the STEMM workforce with a bachelor’s degree or higher, indicating a disparity in the positions that require higher education in STEMM. This may have implications on which jobs individuals from these groups can pursue, the salaries they earn, and their long-term job prospects. Data also show that regardless of the proportion of women in the STEMM fields, women earn less than their men counterparts in all racial and ethnic groups. Finally, the data demonstrate that among academic faculty and in all races/ethnicities, men are more likely to be tenured than women.
REFERENCES
Association of Medical Colleges (AAMC). (n.d.a). About us. https://www.aamc.org/about-us
________. (n.d.b) FACTS. https://www.aamc.org/data-reports/students-residents/report/facts
Access, Equity and Belonging Committee. (n.d.). Asian American, Native Hawaiian and Pacific Islanders. https://access-equity-belonging.extension.org/about/racial-and-ethnic-youth/asian-pacific-islander-youth/American
________. (2022). FACTS: Enrollment, graduates, and MD-PhD Data. https://www.aamc.org/data-reports/students-residents/interactive-data/2022-facts-enrollment-graduates-and-md-phd-data
Artiga, S., Rae, M., Pham, O., Hamel, L., Muñana, C., and Rae, M. (2020). COVID-19 risks and impacts among health care workers by race/ethnicity. https://www.kff.org/racial-equity-and-health-policy/issue-brief/covid-19-risks-impacts-health-care-workers-race-ethnicity/
Asai, D.J. (2020). Race matters. Cell, 1814, 754–757. https://doi.org/10.1016/j.cell.2020.03.044
Asian Pacific Institute on Gender Based Violence. (2022). Census data & API identities. https://www.api-gbv.org/resources/census-data-api-identities/
Brown, A. (2020). The changing categories the U.S. Census has used to measure race. https://www.pewresearch.org/fact-tank/2020/02/25/the-changing-categories-the-u-s-has-used-to-measure-race/
Brown, T.N., Sellers, S.L., Brown, K.T., Jackson, J.S. (1999). Race, ethnicity, and culture in the sociology of mental health. Handbook of the Sociology of Mental Health. Springer. https://doi.org/10.1007/0-387-36223-1_9
Chau, V., and Chan, P. 2021. One size does not fit all: Appreciating the diversity of Asian Americans, Native Hawaiians, and Pacific Islanders AANHPIs and the implications for mental health. Substance Abuse and Mental Health Services Administration.
Craig, M.A., and Richeson, J.A. (2014). On the precipice of a “majority-minority” America: Perceived status threat from the racial demographic shift affects White Americans’ political ideology. Psychological Science, 25(6), 1189–1197.
Daniszewski, J. 2020. Why we will lowercase white. Associated Press Blog. https://blog.ap.org/announcements/why-we-will-lowercase-white
Darling-Hammond, L. (1998). Unequal opportunity: Race and education. Brookings Institute. https://www.brookings.edu/articles/unequal-opportunity-race-and-education/
Estrada, M., Burnett, M., Campbell, A.G., Campbell, P.B., Denetclaw, W.F., Gutiérrez, C.G., Hurtado, S., John, G.H., Matsui, J., McGee, R., Okpodu, C.M., Robinson, T.J., Summers, M.F., Werner-Washburne, M., and Zavala, M. (2016). Improving underrepresented minority student persistence in STEM. CBE Life Sciences Education, 15(3), es5.
Frey, W.H. (2020). The nation is diversifying even faster than predicted, according to new Census data. https://www.brookings.edu/research/new-census-data-shows-the-nation-isdiversifying-even-faster-than-predicted/
________. (2021). All recent US population growth comes from people of color, new census estimates show. Brookings Institute. https://www.brookings.edu/research/all-recent-us-population-growth-comes-from-people-of-color-new-census-estimates-show/#:~:text=These%20new%20estimates%20show%20annual,gains%20in%20people%20of%20color.
Fry, R., Kennedy, B., and Funk, C. (2021). STEM jobs see uneven progress in increasing gender, racial and ethnic diversity. Pew Research Center.
Garland, J.L. 2007. Review of serving Native American students new directions for student services, #109. Journal of College Student Development, 485, 612–614.
Georgetown Law. (2017). Asian Americans & Native Hawaiians & Pacific Islanders. https://www.georgetownpoverty.org/issues/democracy/census
Hatfield, N., Brown, N., and Topaz, C.M. (2022). Do introductory courses disproportionately drive minoritized students out of STEM pathways? PNAS Nexus, 1(4), 1–10. https://doi.org/10.1093/pnasnexus/pgac167
Holland, A.T., and Palaniappan, L.P. (2012). Problems with the collection and interpretation of Asian-American health data: Omission, aggregation, and extrapolation. Annals of Epidemiology, 22(6), 397–405. https://doi.org/10.1016/j.annepidem.2012.04.001
Huang, G., Taddese, N., Walker, E., and Peng, S. (2000). Entry and persistence of women and minorities in college science and engineering education. NCES 2000–601. U.S. Department of Education. National Center for Education Statistics.
Iporac, L.A.R. (2020). Are Asians and Asian-Americans excluded in diversity, equity, and inclusion initiatives. Limnology and Oceanography Bulletin, 29(4), 132–133. https://aslopubs.onlinelibrary.wiley.com/doi/full/10.1002/lob.10408
Jones, N., Marks, R., Ramirez, R., and Ríos-Vargas, M. (2021). Improved race and ethnicity measures reveal U.S. population is much more multiracial. 2020 Census illuminates racial and ethnic composition of the country. https://www.census.gov/library/stories/2021/08/improved-race-ethnicity-measures-reveal-united-states-population-much-more-multiracial.html
Laughlin, L., Anderson, A., Martinez, A., and Gayfield, A. (2021). Who are our health care workers? 22 million employed in health care fight against COVID-19. U.S. Census Bureau.
Lopez, M.H., Krogstad, J.M., and Passel, J.S. (2022). Who is Hispanic? Pew Research Center. https://www.pewresearch.org/fact-tank/2022/09/15/who-is-hispanic/
Monte, L.M., and Shin, H.B. (2022). Broad diversity of Asian, Native Hawaiian, Pacific Islander population. https://www.census.gov/library/stories/2022/05/aanhpi-population-diverse-geographically-dispersed.html
National Academies of Sciences, Engineering, and Medicine. (2022). Transforming trajectories for women of color in tech. The National Academies Press. https://doi.org/10.17226/26345
________. (2020). Promising practices for addressing the underrepresentation of women in science, engineering, and medicine: Opening doors. The National Academies Press. https://doi.org/10.17226/25585
________. (2011). Expanding underrepresented minority participation: America’s science and technology talent at the crossroads. The National Academies Press. https://doi.org/doi:10.17226/12984
National Center for Science and Engineering Statistics. (2022). The state of U.S. science and engineering 2022. https://ncses.nsf.gov/pubs/nsb20221
________. (2021a). Women, minorities, and persons with disabilities in science and engineering: 2021. Special Report NSF 21-321. National Science Foundation. https://ncses.nsf.gov/wmpd
________. (2021b). Women, minorities, and persons with disabilities in science and engineering. Technical Notes. https://ncses.nsf.gov/pubs/nsf21321/technical-notes
________. (2021c). The STEM labor force of today: Scientists, engineers and skilled technical workers. https://ncses.nsf.gov/pubs/nsb20212
________. (2019). Employment sector of S&E highest degree holders and workers in S&E occupations: 1993, 2003, and 2019. https://ncses.nsf.gov/pubs/nsb20212/assets/supplemental-tables/tables/nsb20212-tabslbr-013.xlsx
National Center for Education Statistics (NCES). (n.d.). About us. https://nces.ed.gov/about/
NCES Institute of Education Sciences. (2021). List of 2021 digital tables. https://nces.ed.gov/programs/digest/2021menu_tables.asp
NCSES and National Science Foundation. (2021). Doctorate recipients from U.S. universities: 2020. NSF 22-300. https://ncses.nsf.gov/pubs/nsf22300/
National Science Board and National Science Foundation. (2019). Science and engineering indicators 2020: Science and engineering labor force. NSB-2019-8. https://ncses.nsf.gov/pubs/nsb20198/
National Institutes of Health. (n.d.). NIH Data Book. https://report.nih.gov/nihdatabook/
Nguyn, A.T., and Pendleton, A. (2021). Recognizing race in language: Why we capitalize “black” and “white”. Center for the Study of Social Policy. https://cssp.org/2020/03/recognizing-race-in-language-why-we-capitalize-black-and-white/
Office of Management and Budget. (1997, October 30). Revisions to the Standards for the Classification of Federal Data on Race and Ethnicity, 62 Fed. Reg. 58782. https://obamawhitehouse.archives.gov/omb/fedreg_1997standards
Parker, K., Menasce Horowitz, J., Morin, R., and Lopez, H. (2015). Chapter 1: Race and multiracial Americans in the U.S. Census. Pew Research Center. https://www.pewresearch.org/social-trends/2015/06/11/chapter-1-race-and-multiracial-americans-in-the-u-s-census/
Riegle-Crumb, C., King, B., and Irizarry, Y. (2019). Does STEM stand out? Examining racial/ethnic gaps in persistence across postsecondary fields. Educational Researcher, 483, 133–144. https://doi.org/10.3102/0013189x19831006
Salsberg, E., Richwine, C., Westergaard, S., Portela Martinez, M., Oyeyemi, T., Vichare, A., and Chen, C.P. (2021). Estimation and Comparison of Current and Future Racial/Ethnic Representation in the US Health Care Workforce. JAMA network open, 4(3), e213789. https://doi.org/10.1001/jamanetworkopen.2021.3789
Shotton, H.J., Lowe, S.C., and Waterman, S.J. (2013). Beyond the asterisk: Understanding Native students in higher education. Stylus Publishing.
Smithsonian. (n.d.). Historical foundations of race. https://nmaahc.si.edu/learn/talking-about-race/topics/historical-foundations-race
U.S. Census Bureau. (n.d.) Measuring race and ethnicity across the decades: 1790–2010. https://www.census.gov/data-tools/demo/race/MREAD_1790_2010.html
________. (2012). Census bureau releases estimates of undercount and overcount in the 2010 census. https://www.census.gov/newsroom/press-releases/2022/2020-census-estimates-of-undercount-and-overcount.html
________. (2021a). 2020 Census frequently asked questions about race and ethnicity. https://www.census.gov/programs-surveys/decennial-census/decade/2020/planning-management/release/faqs-race-ethnicity.html
________. (2021a). 2020 Census frequently asked questions about race and ethnicity. https://www.census.gov/programs-surveys/decennial-census/decade/2020/planning-management/release/faqs-race-ethnicity.html
________. (2021b) U.S. decennial census measurement of race and ethnicity across the decades: 1790–2020. https://www.census.gov/library/visualizations/interactive/decennial-census-measurement-of-race-and-ethnicity-across-the-decades-1790-2020.html
________. (2021c). Race and ethnicity in the United States: 2010 Census and 2020 Census. https://www.census.gov/library/visualizations/interactive/race-and-ethnicity-in-the-united-state-2010-and-2020-census.html
________. (2021d). National population by characteristics: 2010–2020. https://www.census.gov/programs-surveys/popest/technical-documentation/research/evaluation-estimates/2020-evaluation-estimates/2010s-national-detail.html
________. (2022a). Decennial Census records: Censuses of American Indians. https://www.census.gov/history/www/genealogy/decennial_census_records/censuses_of_american_indians.html
________. (2022b) Facts for features: American Indian and Alaska Native heritage months: November 2022. https://www.census.gov/newsroom/facts-for-features/2022/aian-month.html
Yang, P.Q., and Koshy, K. (2016) The “Becoming White Thesis” revisited. The Journal of Public and Professional Sociology, 8(1).


