
5
Development of Prediction Equations for Estimated Energy Requirements
To address its task to perform data analyses to validate and/or update the Estimated Energy Requirement (EER) equations, the committee commissioned an independent analysis of databases of doubly labeled water (DLW) measures of energy expenditure in population groups. A report summarizing the consultant’s work is presented in Appendix G, and the expanded details are provided in Supplemental Appendixes N to W.1 To validate the results from the commissioned analysis, the committee conducted a review of the peer-reviewed published literature not included in the analyzed databases. Further, the committee identified additional data from systematic reviews and the broader peer-reviewed published literature on evidence to determine the energy cost of growth across selected life stages (childhood, adolescence, pregnancy, and lactation). The committee synthesized all information used to derive Estimated Energy Requirements, which are presented at the end of this chapter (Tables 5-15 through 5-18) for all life-stage groups relevant to the Dietary Reference Intakes (DRIs). Applications of the equations for individuals and groups are discussed in Chapter 7.
USE OF DOUBLY LABELED WATER TO ASSESS ENERGY REQUIREMENTS
Adequate dietary intake of energy is critical for optimal cellular and body functions, growth, pregnancy outcomes, and lactation performance.
___________________
1 Supplemental appendixes are available at https://nap.nationalacademies.org/catalog/26818.
Determination of dietary energy intake requirements relies on the ability to accurately measure energy intake. Many methods are available to assess dietary energy intake (Lam and Ravussin, 2016), although accuracy and precision vary considerably by method. Until the widespread adoption of the DLW method, described below, determination of EERs for humans across the life span relied on less accurate and less precise measures (FAO, 2004).
Common methods for assessing dietary energy intake rely on self-reported food intakes, such as from 24-hour dietary recalls, food diaries, and food frequency questionnaires. Prior to the 2004 Food and Agriculture Organization/World Health Organization/United Nations University (FAO/WHO/UNU) report on human energy requirements, recommendations for energy intake were based on data obtained using the factorial method of estimating energy expenditure (FAO, 2004). The factorial method involves summing the energy costs of occupational activities, nonoccupational activities, and sleeping to equal total energy expenditure (WHO, 1985). The method involves multiple assumptions about representative daily activities across the life span. This method of estimating energy expenditure and, by extension, energy intake was the best option for the determination of energy requirements prior to the use of DLW in humans.
The DLW method is considered by the nutrition community to be the benchmark standard for measurement of total energy expenditure (TEE) in humans under free-living conditions. The DLW method involves enrichment of the body water with the natural, nonradioactive isotopes of deuterium (2H) and oxygen-18 (18O). The disappearance rate of 2H from the total body water pool reflects water turnover rate, and the disappearance rate of 18O reflects both water and carbon dioxide turnover rates. The difference between the two turnover rates represents the carbon dioxide production rate (Black et al., 1986; Speakman et al., 2021), and carbon dioxide production is one of the final products of energy metabolism. The rate of carbon dioxide production can then be converted to TEE using Weir’s equation (Weir, 1949).
The DLW method has several desirable features when compared to the other methods for measuring energy expenditure under free-living conditions. First, it imposes zero restriction or interference with participants’ daily activities and eating habits; participants need only drink a small amount of water labeled with the two isotopes, 2H and 18O. Second, the method is noninvasive because it requires only collection of spot urine samples. Third, the method is robust and portable; the DLW procedure can be implemented anywhere. Fourth, the duration of the DLW procedure is flexible and can be implemented between 7 and 14 days. This flexibility allows for a more representative measure
of the actual energy expenditure because the duration can, for example, include weekend days, when activities and food intakes might be different than those during weekdays. Fifth, since the two isotopes are naturally occurring and are found naturally in the water, foods, and beverages that people consume every day, the method can be safely implemented in humans with no adverse effects, including premature infants, newborns, toddlers, teenagers, aged individuals, and pregnant and lactating women.
Critically, accuracy of the DLW method has been validated against indirect calorimetry (Klein et al., 1984; Melanson et al., 2018; Ravussin et al., 1991; Schoeller and Webb, 1984; Schoeller et al., 1986; Seale et al., 1993; Westerterp et al., 1988). Furthermore, TEE measurements using the DLW method have also been documented to be reproducible over a 4-year period (Wong et al., 2014), allowing evaluation of long-term effects of nutritional, physical, and medical interventions and treatments. Both the 2004 FAO/WHO/UNU and the Institute of Medicine (IOM) (2002/2005) energy requirement recommendations depended on DLW data to develop the respective EERs. A comparison of EERs for infants between the FAO/WHO/UNU 1985 report and its 2004 report found significantly lower requirements based on DLW data than were proposed by the factorial method (FAO, 2004). Energy requirements of infants in the FAO/WHO/UNU 1985 report were estimated from dietary intake studies, which are prone to overestimation.
The DLW method provides an objective measurement of TEE integrated over days, if not weeks, and in combination with basal metabolism measured using indirect calorimetry, it allows for the objective measurement of energy expended in physical activity. As illustrated in Chapter 4 (Figure 4-1), TEE comprises basal (or resting) metabolic rate (BMR), thermic effect of food (TEF), and physical activity level (PAL). Energy expended in physical activity, therefore, can be calculated as the difference between TEE and BMR plus TEF (generally accepted to be approximately 10 percent of TEE) (Schutz and Jequier, 1998). In this report, BMR refers to the energy required when the human body is at complete physical, mental, and digestive rest (see Chapter 4, Table 4-1). Physical activity can also be expressed as the ratio of TEE-to-BMR, referred to as the physical activity level, or PAL. The inclusion of BMR in this expression allows for some adjustment for body size, as BMR is highly dependent on height and body weight (Butte and Caballero, 2014). The DLW method provides for objective measures of TEE and physical activity.
Relationship Between TEE and EER
In a weight-stable person, TEE is the most accurate measure of a person’s EER. For a growing individual, such as an infant or a child, EER
is the sum of TEE and the energy cost of growth (ECG). The ECG can be calculated from the energy contained in tissue deposited during growth phases, based on the proportion of protein and fat being deposited in the new tissues. For a pregnant woman, particularly during the second and third trimesters, EER is the sum of TEE and the energy cost of tissue accretion during pregnancy in both the fetal and maternal tissues. For a lactating woman, EER is the sum of TEE and the energy cost of milk production. For children and adolescents between 3 and 18 years of age, the ECG represents a small increase above TEE, merely 1 to 3 percent of TEE. For a pregnant woman, the energy cost of tissue accretion represents approximately 10 percent above TEE. For a lactating woman, the energy cost of milk production is approximately 15 to 20 percent of TEE, depending on the amount of milk volume and milk energy content. In contrast, among infants under 1 year of age, ECG could be as high as 32 percent of TEE.
Because TEE comprises basal energy expenditure, energy expenditure for physical activities, and the thermic effect of food, an accurate measure of TEE would provide a good approximation of EER, with additions for the life stages of growth, pregnancy, and lactation. The committee noted the uniqueness and value of the DLW method for measuring TEE compared to other measures of energy expenditure. Based on the large number of DLW studies that have become available since the prior update to the DRIs for energy (IOM, 2002/2005), the sponsors asked the committee to reevaluate the EER of the general population in the United States and Canada using DLW data that were not available at the time of the 2002/2005 report.
ACQUISITION OF DOUBLY LABELED WATER DATA
The combined DLW database described in this chapter was composed of data obtained from the International Atomic Energy Agency (IAEA), the Institute of Medicine (IOM, 2002/2005), the National Heart, Lung, and Blood Institute (NHLBI), Biologic Specimen and Data Repository Study of Latinos: Nutrition & Physical Activity Assessment Study (SOLNAS), and the Children’s Nutrition Research Center at the Baylor College of Medicine (CNRC) (Appendix H). The pregnancy data sets were harmonized and then combined with the other three data sets, resulting in 8,722 observations. After removing implausibly high TEEs and PALs, the combined data set had 8,600 observations including all ages, as well as pregnant and lactating women.
IAEA DLW Database
The IAEA DLW Database represents the largest collection of DLW data globally. This database (version 3.6.1) consists of 128 DLW studies
from 25 countries with 7,696 data points (4,987 females and 2,709 males). The idea to gather data from DLW studies around the world was first discussed during the 3rd International Conference on Recent Advances and Controversies in the Measurement of Energy Metabolism 2014, held in Tokyo, Japan. The agreement among the major users to create the collaborative DLW database was finalized in 2015, and in 2016, IAEA agreed to host the database. In 2018, the IAEA DLW Database website was finalized, granted web security at IAEA, and officially launched. The IAEA DLW Database has an informal management group that approves requests for data acquisition.2
The National Academies of Sciences, Engineering, and Medicine (National Academies) consultants (Indiana University School of Public Health-Bloomington) submitted a request for data for the present analyses. Variables including participant identifier (ID), study ID (i.e., citation for published works and lead investigator for unpublished work), age, sex, body mass index (BMI), height, weight at the beginning of the DLW study period, TEE, fat-free mass, fat mass, percent fat mass, BMR, method of BMR measurement, and international standard country codes were requested with no a priori exclusions.
The majority of the observations included in the IAEA DLW Database came from studies in the United States (78.1 percent), followed by Europe (4.8 percent); there were no DLW studies from Canada. The majority of these DLW studies were published in peer-reviewed journals between 1982 and 2020. To corroborate the data reported in the IAEA database, a literature search was carried out based on the lead author and year of publication; a full copy of each publication was retrieved. Each publication was used to verify health status and athletic or military involvement of the study participants. The publication also helped to confirm the data were collected as reported—at baseline or prior to treatment in intervention studies. Because the committee was charged with defining EERs for the general population, the following exclusion criteria were established following consensus among committee members:
- Studies from non-high-income countries were excluded because the living, health care, and physical activity environments, as well as food availability in low- and middle-income countries, might be very different from those in high-income countries such as the United States and Canada; thus influencing calculation of the EERs.
- Study participants with genetic, infectious, and health conditions such as Down syndrome, Prader-Willi syndrome, human
___________________
2https://doubly-labelled-water-database.iaea.org (accessed February 8, 2023).
- immunodeficiency virus (HIV) infection, anorexia nervosa, narcolepsy, Parkinson’s disease, cystic fibrosis, chronic obstructive pulmonary disease, coronary heart disease, and diagnosed Type 1 diabetes, other non-communicable diseases such as Type 2 diabetes, as well as postsurgical patients, including bariatric surgery, were excluded because these conditions may affect TEE and EERs.
- Athletes such as soccer players, rugby players, and jockeys were excluded from analysis because their extremely high physical activity levels (PAL greater than 2.5) do not reflect a sustainable metabolic rate (Black et al., 1996; Westerterp, 2001).
- Study participants who took part in strenuous physical activities specifically during the DLW measurement period, such as intensive military training, climbing Mt. Everest, running marathons, cross-country ski racing, or multiday cycling, were excluded from analysis with the same reasoning for athletes.
- Premature infants were excluded from analysis.
- Data following weight loss, exercise, or dietary interventions were excluded; only baseline data were included, where available.
- Institutionalized older adults were excluded because of potential unidentified health concerns, as well as limited mobility.
As indicated above, the IAEA DLW Database began with 7,696 study participants; after excluding 707 from non-high-income countries, 239 with infectious and chronic diseases, 50 professional athletes and study participants who took part in strenuous physical activities during the measurement period, 673 institutionalized elders, 222 observations with no age or sex reported, and 88 study participants with PAL greater than 2.5, there were 5,717 observations available for DRI analysis. The ages of the study participants included in the final IAEA dataset ranged from 0 to 90 years and above.
SOLNAS DLW Database
The Hispanic Community Health Study/Study of Latinos is the largest cohort of Hispanics being followed in the United States. The study, funded by the NHLBI and other NIH institutes, recruited 16,415 individuals from randomly selected households. Baseline (wave 1) of data collection (2008–2011) included protocols similar to those of the National Health and Nutrition Examination Study (NHANES) (Mossavar-Rahmani et al., 2015; Sorlie et al., 2010). An ancillary study was carried out between 2010 and 2012 for the purpose of calibrating random and systematic bias of self-reported dietary and physical activity behaviors that included the use of DLW called the Study of Latinos: Nutrition and Physical Activity
Assessment Study (SOLNAS) (Mossavar-Rahmani et al., 2015). This study was conducted in the four field centers located in major U.S. cities, with a goal of recruiting 120 persons from each center: Chicago, Illinois; Miami, Florida; Bronx, New York; and San Diego, California and was supported by a coordinating center at the University of North Carolina at Chapel Hill.
Protocols were implemented in 485 participants in the Hispanic Community Health Study by trained and certified staff that consisted of weight measurements, completing a 24-hour recall, reporting on current supplement use and sedentary activity, receiving a single dose of DLW, spot urine tests, 24-hour urine specimens, and for those over 60 years of age a blood specimen (Mossavar-Rahmani et al., 2015). In a subsample of 96 participants, protocols were repeated for a reliability study. All study participants were invited to participate within 7 months of completing the baseline exam. Ages of the study participants ranged between 18 and 74 years, and all self-identified as Hispanic/Latino, representing Central American, Cuban, Dominican, Mexican, Puerto Rican, and South American ancestry.
Data from SOLNAS are publicly available on NHLBI’s Biological Specimen and Data Repository Information Coordinating Center (BIOLINCC) site.3 The National Academies requested use of the data on behalf of the Indiana University consultants. Requested variables included age, sex, starting weight, height, BMI, ethnicity, final weight, lean body mass, physical activity, smoking status, and health status. See Appendix H, Box, H-1 for the full list of requested data sets and variables. After exclusion of individuals with medical conditions, data on 380 study participants (157 males and 223 females) were included in the analysis.
IOM DLW Database
The IOM (2002/2005) report included DLW data that were available to the committee and published by the end of the year 2000; the data pertained to study participants with normal weight, overweight, and obesity, as well as pregnant and lactating women. For the present analyses, these data were added to the IAEA and the SOLNAS data after removing data with PAL values greater than 2.5 or in the case of infants, a PAL less than 1.0. The IOM (2002/2005) database consisted of 1,145 observations on infants and children between 0 and 18.99 years of age; 842 observations on adults 19 years of age or older with normal weight, overweight, or obesity; and 173 observations on pregnant women and 123 on lactating women, for a total of 2,283 study observations. The number of pregnant and lactating women with DLW data was relatively limited, and participants with body mass indices less than 18.5 were excluded from analyses.
___________________
3https://biolincc.nhlbi.nih.gov/home/ (accessed February 8, 2023).
CNRC DLW Database
To augment the number of DLW observations of pregnant and lactating women to define the EER for pregnancy and lactation, the committee obtained DLW data on 63 women studied longitudinally from preconception, during the second and third trimesters of pregnancy, and 6 months postpartum at the Children’s Nutrition Research Center (CNRC) at Baylor College of Medicine, providing 220 observations for analysis after removal of data with PAL values greater than 2.5.
Combined DLW Database
As shown in Table 5-1, a total of 8,600 study participants or individual observations were identified from these DLW databases following the exclusions described.
The combined DLW data set used to generate equations for EERs comprised a total of 8,600 observations representing the major human life stages. DLW data on pregnant, lactating, and non-pregnant non-lactating (NPNL) women were derived from longitudinal studies. Among pregnant women, the majority of measurements were made during the second and third trimesters, 35.1 percent and 36.2 percent, respectively, of the total number of observations. The total number of observations also include measurements made at preconception (23.2 percent). Approximately 50 percent of the measurements among lactating women were made between
TABLE 5-1 Distribution of Observations by Life Stage and DLW Database
| Life Stages | IAEA | SOLNAS | IOM, 2002/2005 | CNRC | Totals |
|---|---|---|---|---|---|
| Infants, 0–11 months | 378 | 0 | 177 | 0 | 555 |
| Children, 1–8 years | 432 | 0 | 689 | 0 | 1,121 |
| Children, 9–18 years | 425 | 0 | 279 | 0 | 704 |
| Adults, 19+ years | 4,309 | 380 | 767 | 0 | 5,456 |
| Pregnant/lactating/NPNL women | 173 | 0 | 371 | 220 | 764 |
| Totals | 5717 | 380 | 2,283 | 220 | 8,600 |
NOTES: IAEA = International Atomic Energy Agency; SOLNAS = Study of Latinos: Nutrition and Physical Activity Assessment Study; IOM = Institute of Medicine; CNRC = Children’s Nutrition Research Center at Baylor College of Medicine; NPNL = nonpregnant nonlactating women who were included in the studies of pregnant or lactating women. DLW data on pregnant, lactating, and NPNL women represent repeated measures derived from longitudinal studies.
1 and 3 months postpartum, and the other 50 percent between 4 and 6 months postpartum. Descriptive characteristics of the participants in the combined DLW data set are in Table 5-2, and more detailed descriptive statistics are in Appendix H.
TABLE 5-2 Descriptive Characteristics by Life Stage in Combined DLW Data Set
| Life Stage | |||||
|---|---|---|---|---|---|
| Infants 0–11 mo | Children 1–8 y | Children 9–18 y | Adults 19+ y | Pregnant/lactating/NPNL women | |
| Total number of subjects | 555 | 1,121 | 704 | 5,456 | 764 |
| Female (n) | 320 | 634 | 434 | 3,585 | 764d |
| Female (%) | 57.7 | 56.6 | 61.6 | 65.7 | 100 |
| Age (y), Mean (SD) | 0.39 (0.26) | 5.1 (2.1) | 13.7 (3.1) | 52.6 (19.7) | 30.0 (4.2) |
| Heighta (cm), Mean (SD) | 63.4 (6.7) | 10.4 (16.2) | 159.0 (15.4) | 167.0 (9.7) | 164.3 (6.5) |
| Weight (kg), Mean (SD) | 6.8 (1.8) | 21.3 (8.0) | 55.8 (17.0 | 75.7 (17.1) | 73.7 (20.1) |
| Fat-free mass (kg), Mean (SD nb | ) 4.7 (1.1) 376 | 14.2 (4.2) 431 | 43.0 (11.5) 423 | 47.7 (10.4) 4,659 | 56.3 (9.6) 173 |
| Fat mass (kg), Mean (SD) nb | 1.7 (0.8) 375 | 5.4 (3.4) 431 | 18.1 (19.9 423 | 28.1 (11.4) 4,652 | 44.9 (12.0) 173 |
| Fat mass (%), Mean (SD) nb | 25.1 (7.2) 375 | 26.4 (6.9) 431 | 28.8 (9.7) 423 | 36.3 (9.3) 4,652 | 43.9 (6.1) 173 |
| Percentilec | 51.2 (28.0) | 60.3 (28.1) | 63.7 (26.0 | — | — |
| TEE (kcal/d), Mean (SD) | 504 (171) | 1,392 (370) | 2,491 (668) | 2,437 (592) | 2,531 (472) |
| BMR (kcal/d), Mean (SD) nb | 457 (93) 164 | 966 (205) 487 | 1,454 (319) 354 | 1,487 (308) 2,364 | 1,478 (225) 582 |
NOTE: BMR = basal metabolic rate; cm = centimeter; d = day; mo = months; kcal = kilocalorie; kg = kilogram; n = sample size; NPNL = nonpregnant nonlactating; SD = standard deviation; TEE = total energy expenditure; y = years.
a Height equivalent to length in infants.
b Sample sizes (n) indicated for variables with significant missing data.
c Weight-for-length percentile (WHO) calculated for children 0–1.99 years; BMI percentile (Centers for Disease Control and Prevention [CDC]) calculated for children 2–18 y.
d Sample size does not represent unique observations.
DERIVATION OF TOTAL ENERGY EXPENDITURE PREDICTION EQUATIONS
General Approach to Develop Prediction Equations for Total Energy Expenditure
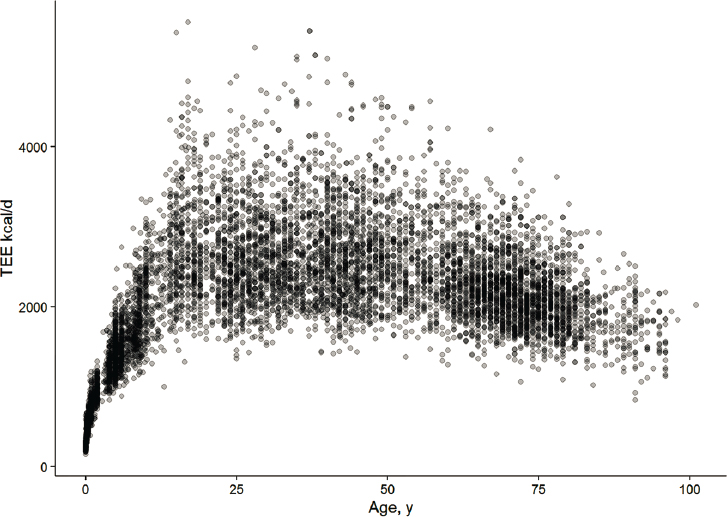
When the combined DLW database was assembled and graphically displayed (see Appendix G and Supplemental Appendixes N to W for a detailed description of database assembly and full statistics), it was apparent that TEE changed in a curvilinear manner across the life span. To address this curvilinearity, the committee developed sex-specific TEE prediction equations for infants and young children (0 to 2.99 years), children (3.0 to 18.99 years), and adults (19.0+ years). A separate TEE prediction equation was developed for pregnant women.
An integral and highly variable component of TEE, and therefore of TEE prediction equations, is energy expended in physical activity. The original EERs (IOM, 2002/2005) accounted for variability in physical activity by incorporating PAL, representing four categories as sedentary, low active, active, and very active as a variable in the modeling. The same PAL thresholds were used to define the categories across all life stages except infancy. From the graphic display of the current data, however, it was apparent that the mean PAL value was age dependent in the first 2 decades of life, and the same PAL coefficients could not be used for all life stages. An approach was needed to incorporate the age dependency into PAL categories for the development of the TEE prediction equations.
Another major question that arose was whether separate equations were warranted for select BMI groups, as was done in the previous report on energy and macronutrients (IOM, 2002/2005). To address this question, separate TEE prediction equations were developed for normal weight and overweight/obesity and tested for significant differences in coefficients at the 2-tailed 0.05 level. Also, prediction equations based on anthropometric variables, weight, and height were compared against body composition variables, fat-free mass (FFM), and fat mass (FM).
Statistical Methods
Database Preparation
The committee’s database provided the following variables: TEE, age category, age, sex, life stage, race/ethnicity, BMI, height, weight, BMR observed, BMR predicted, lactating, pregnant, pregnancy stage, gestational weeks, PAL observed, PAL category observed, PAL predicted, PAL category predicted, FFM, FM, and FM percent.
BMI categories were applied to classify participants into a select weight-for-length percentile, BMI percentile, or BMI group. For infants and children (0 to 2 years), weight-for-length percentiles were based on the WHO (2022) expanded tables. For children 2 to 18 years of age, BMI percentiles were calculated based on age/sex-specific growth charts from the Centers for Disease Control and Prevention (CDC, 2009). For adults, BMI cutoffs defined as underweight (BMI < 18.5), normal weight (BMI 18.5 to < 25), overweight (BMI 25.0 to 29.9), and obese (BMI ≥ 30.0) were used (NHLBI/NIDDK, 1998; WHO, 1998).
A measure or estimate of BMR is required to calculate PAL. In the combined DLW database, BMR was missing for more than 50 percent of the observations. Thus, two methods were used to account for missingness: use of prediction equations and multiple imputation. An examination of existing systematic reviews was undertaken to identify the most appropriate equation(s) for the estimation of BMR for use in the analyses (see Appendix D for a description of the literature search criteria and outcomes). The identified prediction equations were evaluated based on the reported percentage of bias [(mean measured BMR – mean predicted BMR)/mean measured BMR × 100], precision (percentage of participants with predicted BMR within 10 percent of measured BMR), and/or R2 values. The committee decided to use the sex- and age-specific Schofield equations based on weight and height to estimate BMR where the value was missing in the combined DLW database (Schofield, 1985), and an estimated PAL was calculated accordingly. Participants with observed or estimated values of PAL greater than 2.5 were considered unsustainable and removed from the database. Values of PAL less than 1.0 are nonphysiological and were made missing to be imputed and bounded at 1.0.
Multiple Imputation
Multiple imputation was used to estimate missing data based on the other measures in the database. The imputation used the observed BMR values and the estimated BMR values from the Schofield equations as proxy variables, because the Schofield values are highly correlated with the true BMRs that are being imputed, thereby improving the precision of the imputation. In multiple imputation, missing data are imputed by randomly generating multiple values consistent with the multivariate distribution of observed data (Little and Rubin, 2019). The SAS software (version 9.4, SAS Institute, Cary, NC) procedure Proc MI was used with Markov Chain Monte Carlo methods with multiple chains, using 20 imputations. For the combined analysis data set (n = 8,600), all missing data for all variables in the data set were simultaneously imputed (e.g., PAL, FM, FFM) providing 20 versions of a complete data set. Statistical
models were then fit on each version of the data set, and the results were pooled using Rubin’s methods (Rubin, 1987) in SAS Proc MIanalyze (see Appendix G and supplemental appendixes).
STATISTICAL MODELING:
DEVELOPMENT OF TEE PREDICTION EQUATIONS
Prediction equations were developed fitting general linear models on TEE based on sex, age, weight, height, and PAL category, or, alternatively, based on sex, age, height, body composition variables (FFM and FM), and PAL category. For the pregnancy equations, the number of gestational weeks was included as an additional variable. Analysis of pregnancy data included longitudinal data for women at multiple time points. In this case, linear mixed models were performed with Proc Mixed in SAS using a repeated statement to account for correlation of data within women. In sum, TEE models were fit separately for each of the following strata: boys (0 to 2.99 years), girls (0 to 2.99 years), boys (3.0 to 18.99 years), girls (3.0 to 18.99 years), men (19+ years), women (19+ years), and pregnant women.
TEE prediction models were fit for all available data within each stratum, as well as for subsets based on select BMI criteria (BMI group): BMI 18.5 to 40 (sensitivity, removing extremes BMI < 18.5 and > 40); BMI 18.5 to < 25 (normal weight only); and BMI ≥ 25 (overweight/obesity only). The five resultant prediction equations, model performance, and model comparisons are shown in detail in Appendix G and the supplemental appendixes. In this chapter, the TEE prediction equation using all available data within each stratum is presented. In Appendix G, detailed analyses are provided for the five models: all-included model, sensitivity model, normal weight BMI model, overweight/obese BMI model, and fat-free mass/fat mass model.
In all TEE prediction equations except those for children 0 to 2 years of age, a four-level ordinal variable was used to represent PAL category (PALCAT). Given the age dependency of PAL, the cutoffs for inactive, low active, active, and very active levels of physical activity were defined for specific age groups, based on observed data.
TEE was modeled as a function of age, weight, height, and PAL category as predictors and also included interactions of PAL category with height and weight as follows:
where PALCATi represents 3 indicator variables for PAL category (Active, Low Active, Inactive) that are coded as 0 or 1; ‘A’, ‘B0’, ‘C0’, and ‘Di’
are the model coefficients for the main effects of age, height, weight and the 3 PAL categories, respectively; and ‘B0I’ and ‘C0I’ are the model coefficients for the interaction of the 3 PAL categories with height and weight, respectively. (The full model output including all the coefficients for interaction terms of height and weight by PAL category are provided in Supplemental Appendix Q; Details on the redefining of the TEE model are provided in the addendum to Appendix G.) For simplicity and ease of use, the TEE prediction equation is presented by redefining the parameters of the model above with slopes for height and weight separately for each PAL category in the following format:
In this equation ‘A,’ ‘B,’ and ‘C’ are the model-derived coefficients for the slopes of Age, Height, and Weight, respectively, for each PAL category. (The details of how the model is redefined is described in an addendum to Appendix G.) Slopes for height and weight are each allowed to vary by PAL category, whereas the slope for Age remains constant.
The 2005 EER could also computed by PAL category, and, as in the equation above, the coefficient for Age did not vary by PAL category. However, unlike the equation above, the intercept also did not vary by PAL category, and, although the coefficients for Height and Weight varied by PAL category, they were multiplied by the same PAL coefficient, whereas in the equation above, the parameters represent a deviation from the overall slope, which is not restricted to be the same for Height and Weight. A comparison of the EER values from 2005 and this report is presented in Chapter 7.
In addition, the TEE prediction equations for normal weight BMI and overweight/obesity BMI were compared further using three-way interaction terms with BMI group. This allowed comparison of the slopes of height and weight between normal weight BMI and overweight/obesity BMI, within each PAL category.
Race/ethnicity was not included as a covariate in any of the analyses associated with the development of the EERs due to the magnitude of missing data across the life stages. Among infants, 59.5 percent of observations were missing race/ethnicity; among children, 75.4 percent; among adolescents, 52.3 percent; and among adults, 21.8 percent.
Model Performance: Model Fit
Model fit was evaluated for the TEE prediction equations (all-included, sensitivity, normal weight BMI, overweight/obesity BMI, FFM/FM), broken down by strata (boys 0–2 years, girls 0–2 years, boys 3–18
years, girls 3–19 years, men 19+ years, women 19+ years, and pregnant women) comparing predicted values of TEE from the final equations to the observed data for TEE. The summary statistics include sample sizes, R2, adjusted R2, shrunken R2 (Browne formula; Yin and Fan, 2001), Pearson r correlation, mean square error (MSE), mean absolute percentage error (MAPE), and mean absolute error (MAE). MAPE and MAE describe the average difference between the observed and predicted values of TEE in either percent difference or absolute difference, respectively, where MAE is in units of kcal/day. Bland-Altman plots were used to visualize the difference between observed and predicted TEE values (Myles and Cui, 2007). Details are provided in Appendix G and the supplemental appendixes.
Prediction Error
TEE was predicted for an individual at the average levels of age, height, and weight with an active PAL in each strata, along with the standard error (SE) of the predicted values. A 95 percent prediction interval can be calculated using the predicted value ±1.96 × SE, such that there is a 95 percent probability that a future observation of TEE for someone at the same levels of covariates will be contained within the prediction interval.
RESULTS
Statistical Modeling: Development of TEE Prediction Equation
As seen in Figure 5-1, TEE measured by the DLW method increased sharply in infancy, continued to rise during childhood, and plateaued through adulthood with a gradual decline in older adults. This curvilinear pattern motivated the age strata used to develop the TEE prediction equations. Within the specific strata, TEE clearly increased across the BMI categories, as seen in adults in Figure 5-2.
Physical Activity Categories
The graphic display of PAL as a function of age demonstrated a curvilinear pattern, justifying the need to define PAL categories by age group (Figure 5-3).
To derive the age-specific PAL categories for children, the committee examined PAL quartiles by age. Histograms (Figure 5-4) of the distribution of PAL values by age groups and BMI status showed that the data were approximately symmetric for most subgroups, except among children 0 to 2.99 years, for whom the median PAL values were about 1.3. Consequently,
NOTE: TEE = total energy expenditure.
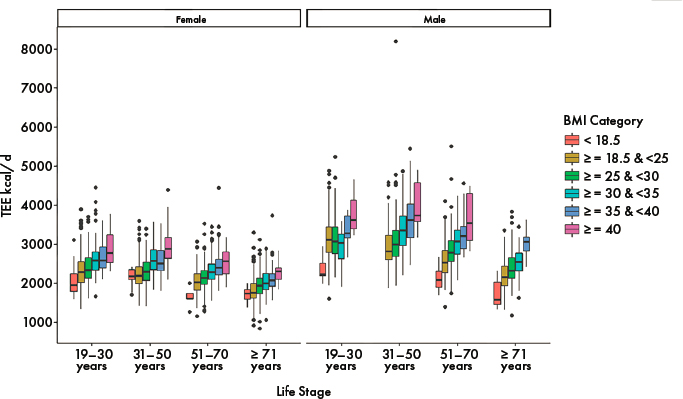
NOTES: BMI = body mass index; kg = kilogram; m = meter; TEE = total energy expenditure. Some categories do not have both upper and lower limits.
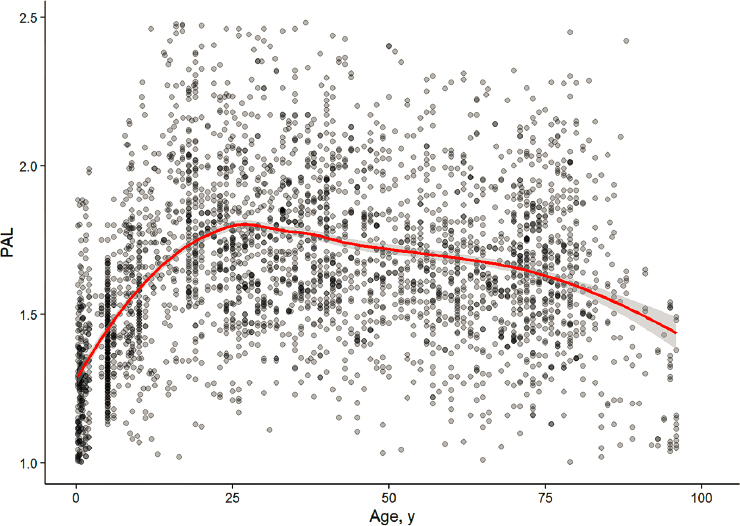
NOTE: PAL = physical activity level.
PAL categories were not incorporated into the prediction equations for infants and children 0 to 2.99 years because of their limited range of physical activity. For age groups 3 to 8.99 years, 9 to 13.99 years, and 14 to 18.99 years, the committee opted to use percentiles (25, 50, and 75). For adults, PAL categories (based on observed data plus predicted data) were defined by percentiles (25, 50, 75) for 19 to 70 years; these PAL categories were then applied to adults of all ages (Table 5-3).
The PAL categories are defined as inactive, low active, active, and very active for age groups 3 to 8.99 years, 9 to 13.99 years, 14 to 18.99 years, and 19 years and over (Table 5-4). PAL is a complex aggregate of lifestyle dependent on occupation, transportation, recreation, sleep patterns, and environmental factors. In general, the inactive category reflects a level of TEE covering basal metabolism, thermic effect of food, and a minimal level of physical activity required for independent living. The low active category reflects a level of physical activity beyond the minimal, involving more ambulation, and some occupational and recreational activities. The active category involves even more ambulation, and occupational or recreational activities. The very active category encompasses not only the demands of daily living but also vigorous exertion in occupation or recreation.
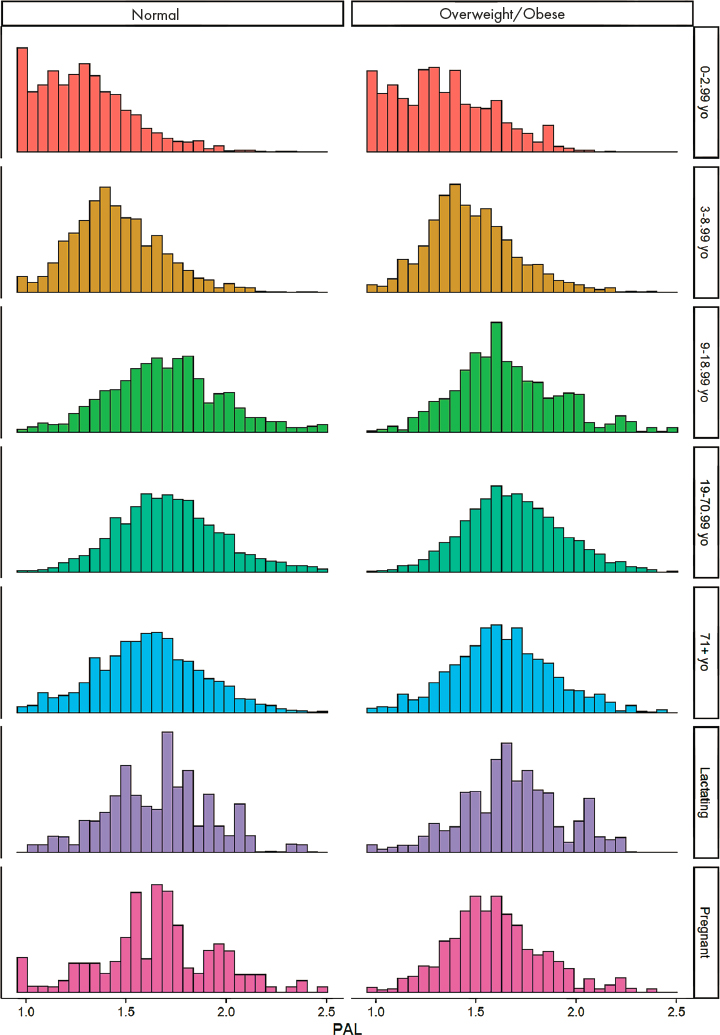
TABLE 5-3 PAL Percentiles for Age Groups Used to Define the Cutoffs for Inactive, Low Active, Active, and Very Active Physical Activity Level (PAL) Categories
| Percentile | 0–2.99 years n = 750 |
3–8.99 years n = 926 |
9–13.99 years n = 304 |
14–18.99 years n = 403 |
19–70.99 years n = 4,299 |
71+ years n = 1,281 |
|---|---|---|---|---|---|---|
| 10% | 1.00 | 1.20 | 1.29 | 1.40 | 1.39 | 1.31 |
| 25% | 1.11 | 1.31 | 1.44 | 1.56 | 1.53 | 1.46 |
| 50% | 1.27 | 1.44 | 1.59 | 1.73 | 1.68 | 1.62 |
| 75% | 1.44 | 1.59 | 1.77 | 1.92 | 1.85 | 1.79 |
| 90% | 1.61 | 1.75 | 1.92 | 2.11 | 2.03 | 1.95 |
TABLE 5-4 Physical Activity Level (PAL) Categories Defined for Inactive, Low Active, Active, and Very Active Levels for Age Groups 3–8.99 Years, 9–13.99 Years, 14–18.99 Years, and 19 Years and Over
| Age Group (years) | PAL Category | PAL Range |
|---|---|---|
| 3–8.99 | Inactive | 1.0 ≤ PAL <1.31 |
| Low active | 1.31 ≤ PAL < 1.44 | |
| Active | 1.44 ≤ PAL < 1.59 | |
| Very active | 1.59 ≤ PAL < 2.50 | |
| 9–13.99 | Inactive | 1.00 ≤ PAL < 1.44 |
| Low active | 1.44 ≤ PAL < 1.59 | |
| Active | 1.59 ≤ PAL < 1.77 | |
| Very active | 1.77 ≤ PAL < 2.50 | |
| 14–18.99 | Inactive | 1.00 ≤ PAL < 1.56 |
| Low active | 1.56 ≤ PAL < 1.73 | |
| Active | 1.73 ≤ PAL < 1.92 | |
| Very active | 1.92 ≤ PAL < 2.50 | |
| 19 and over | Inactive | 1.00 ≤ PAL < 1.53 |
| Low active | 1.53 ≤ PAL < 1.68 | |
| Active | 1.68 ≤ PAL < 1.85 | |
| Very active | 1.85 ≤ PAL < 2.50 |
The general model performed to predict TEE used age, height, weight, and PAL category as predictors and also included interactions of PAL category with height and weight. The model performed to predict TEE used the following format:
The full model output including all the coefficients for interaction terms of height and weight by PAL category are provided in Appendix G. For simplicity the TEE prediction equation is presented with slopes for height and weight separately for each PAL category in the following format:
In this equation A, B, and C are the model-based coefficients for the slopes of age, height, and weight, respectively, for each PAL category. Slopes for height and weight are allowed to vary by PAL category, whereas the slope for age did not vary across PAL categories.
A summary of TEE prediction equations for each age/sex group by PAL category is presented in Table 5-5. For boys and girls 0 to 2 years, TEE prediction equations were shown to differ by sex. Therefore, separate equations are presented for boys and girls. The sex-specific TEE prediction equations based on age, weight, and length/height are recommended for general use. Because of the limited range of physical activity in this youngest age group, TEE is not partitioned by PAL category.
Sex-specific TEE prediction equations using age, height, and weight for each PAL category are also shown by life-stage group in Table 5-5. See Appendix G for TEE prediction equations based only on weight (for children 0–2 years only) or body composition (FFM and FM).
For lactating women, TEE was not different from the nonpregnant, nonlactating state. Adjusted for current weight and PAL, TEE was not shown to be significantly different in lactating women (1–3 months postpartum, p = .311; 4–6 months postpartum, p = .811) compared to their nonpregnant, nonlactating state. Therefore, TEE prediction equations for women, 19+ years, or girls, 3 to 18 years, are recommended for lactating women and adolescents during the postpartum period.
Model Performance: Model Fit
The robustness of the TEE prediction equations was tested for all data within each strata and for subsets of data for each strata (all-included,
TABLE 5-5 TEE Prediction Equations by Age/Sex and Life-Stage Group
| Men, 19 years and above | |
| Inactive | TEE = 753.07 – (10.83 × age) + (6.50 × height) + (14.10 × weight) |
| Low active | TEE = 581.47 – (10.83 × age) + (8.30 × height) + (14.94 × weight) |
| Active | TEE = 1,004.82 – (10.83 × age) + (6.52 × height) + (15.91 × weight) |
| Very active | TEE = – 517.88 – (10.83 × age) + (15.61 × height) + (19.11 × weight) |
| NOTE: R2 = 0.73; R2 adj = 0.73; R2 shr = 0.73; RMSE = 339 kcal/d; MAPE = 9.4%; MAE = 266 kcal/d. | |
| Women, 19 years and above | |
| Inactive | TEE = 584.90 – (7.01 × age) + (5.72 × height) + (11.71 × weight) |
| Low active | TEE = 575.77 – (7.01 × age) + (6.60 × height) + (12.14 × weight) |
| Active | TEE = 710.25 – (7.01 × age) + (6.54 × height) + (12.34 × weight) |
| Very active | TEE = 511.83 – (7.01 × age) + (9.07 × height) + (12.56 × weight) |
| NOTE: R2 = 0.71; R2 adj = 0.70; R2 shr = 0.70; RMSE = 246 kcal/d; MAPE = 8.7%; MAE = 191 kcal/d. | |
| Boys, 3–18 years | |
| Inactive | TEE = – 447.51 + (3.68 × age) + (13.01 × height) + (13.15 × weight) |
| Low active | TEE = 19.12 + (3.68 × age) + (8.62 × height) + (20.28 × weight) |
| Active | TEE = – 388.19 + (3.68 × age) + (12.66 × height) + (20.46 × weight) |
| Very active | TEE = – 671.75 + (3.68 × age) + (15.38 × height) + (23.25 × weight) |
| NOTE: R2 = 0.92; R2 adj = 0.92; R2 shr = 0.92; RMSE = 259 kcal/d; MAPE = 7.1%; MAE = 163 kcal/d. | |
| Girls, 3–18 years | |
| Inactive | TEE = 55.59 – (22.25 × age) + (8.43 × height) + (17.07 × weight) |
| Low active | TEE = – 297.54 – (22.25 × age) + (12.77 × height) + (14.73 × weight) |
| Active | TEE = – 189.55 – (22.25 × age) + (11.74 × height) + (18.34 × weight) |
| Very active | TEE = – 709.59 – (22.25 × age) + (18.22 × height) + (14.25 × weight) |
| NOTE: R2 = 0.84; R2 adj = 0.84; R2 shr = 0.83; RMSE = 237 kcal/d; MAPE = 8.2%; MAE = 165 kcal/d. | |
| Boys, 0–2 years | |
| TEE = –716.45 – (1.00 × age) + (17.82 × height) + (15.06 × weight) | |
| NOTE: R2 = 0.83; R2 adj = 0.83; R2 shr = 0.83; RMSE = 104 kcal/d; MAPE = 13.6%; MAE = 79 kcal/d | |
| Girls, 0–2 years | |
| TEE = –69.15 + (80.0 × age) + (2.65 × height) + (54.15 × weight) | |
| NOTE: R2 = 0.83; R2 adj = 0.83; R2 shr = 0.83; RMSE = 95 kcal/d; MAPE = 12.8%; MAE = 74 kcal/d. | |
| Pregnant women in their second and third trimester of pregnancy | |
| Inactive | TEE = 1,131.20 – (2.04 × age) + (0.34 × height) + (12.15 × weight) + (9.16 × gestation) |
| Low active | TEE = 693.35 – (2.04 × age) + (5.73 × height) + (10.20 × weight) + (9.16 × gestation) |
| Active | TEE = –223.84 – (2.04 × age) + (13.23 × height) + (8.15 × weight) + (9.16 × gestation) |
| Very active | TEE = –779.72 – (2.04 × age) + (18.45 × height) + (8.73 × weight) + (9.16 × gestation) |
| NOTE: R2 = 0.63; R2 adj = 0.62; R2 shr = 0.61; RMSE = 282 kcal/d; MAPE = 8.8%; MAE = 222 kcal/d. | |
NOTES: TEE = total energy expenditure; kcal/d = kilocalorie per day; TEE is in kilocalories/day, age is in years, weight is in kilograms, height is in centimeters, and gestation is in weeks. R2 = R squared; R2 adj = adjusted R squared; R2 shr = shrunken R squared; RMSE = root mean squared error; MAPE = mean absolute percentage error; MAE = mean absolute error. RMSE is the same as standard error of the estimate (SEE).
sensitivity, normal weight BMI, overweight/obese BMI, FFM/FM), broken down by strata (men 19+ years, women 19+ years, boys 3–18 years, girls 3–19 years, boys 0–2 years, girls 0–2 years, and pregnant women). The summary statistics, including sample sizes, R2, adjusted R2, shrunken R2, MSE, Pearson correlation r for predicted TEE versus observed TEE, MAPE, and MAE, are shown in Table 5-6 for the general TEE prediction equation based on weight and height/length and including all data within each strata. Performance of the other prediction equations are in Appendix G (and the supplemental appendixes).
The general TEE prediction models were compared against the other models based on the subsets of data for each strata (all-included versus sensitivity, normal BMI, overweight/obese BMI, FFM/FM). The first comparison evaluated the sensitivity of the general equation to extreme values observed in the underweight BMI and extreme obesity BMI categories. Elimination of participants with underweight or extreme obesity did not alter the performance of the general model, in terms of R2, R2 adj, r, MSE, or RMSE. (Implications of the prediction error on the application of the EER are discussed in Chapter 7.) Likewise, limiting the model to normal weight BMI only or overweight/obese BMI only did not significantly change these test statistics. Lastly, the prediction equation based on body composition (FFM and FM) performed slightly better than that based on weight in the adult model but not the child models.
TABLE 5-6 Evaluation of Model Fit for the General Total Energy Expenditure (TEE) Prediction Equations Based on Weight and Height/Length, by Strata
| Men | Women | Boys, 3–18 years | Girls, 3–18 years | Boys, 0–2 years | Girls, 0–2 years | Pregnancy | |
|---|---|---|---|---|---|---|---|
| n | 1,016 | 1,342 | 250 | 477 | 317 | 432 | 413 |
| R2 | 0.73 | 0.71 | 0.92 | 0.84 | 0.83 | 0.83 | 0.63 |
| R2 adj | 0.73 | 0.70 | 0.92 | 0.84 | 0.83 | 0.83 | 0.62 |
| R2 shr | 0.73 | 0.70 | 0.91 | 0.83 | 0.83 | 0.83 | 0.61 |
| MSE (kcal/d) | 114,615 | 60,393 | 66,831 | 56,049 | 10,733 | 9,059 | 79,770 |
| RMSE (kcal/d) | 339 | 246 | 259 | 237 | 104 | 95 | 282 |
| MAPE (%) | 9 | 9 | 7 | 8 | 14 | 13 | 9 |
| MAE (kcal/d) | 266 | 191 | 163 | 165 | 79 | 74 | 222 |
NOTES: R2 = R squared; R2 adj = adjusted R squared; R2 shr = shrunken R squared; MSE = mean squared error; RMSE = root mean squared error; MAPE = mean absolute percentage error; MAE = mean absolute error. RMSE is the same as standard error of the estimate (SEE).
Model Performance by PAL Category, BMI Category, and Life Stage
The general TEE prediction equations were further tested by PAL category, BMI category, and life stage for each of the strata. In general, Pearson correlations (r) between predicted and observed values for PAL categories, BMI categories, and life stages ranged from ~0.75 to 0.95. Exceptions were seen for girls and boys, 0 to 2 years, where correlations were lower for 7- to 11-month-old and 1- to 3-year-old children compared with 0- to 6-month-old children, possibly owing to lower sample sizes in the former groups.
Model Comparisons: Normal BMI Compared to Overweight/Obese BMI
A major question for the committee was whether the general TEE prediction equation differed by BMI group, specifically for the normal weight versus overweight/obese BMI categories. In addition to the evaluations performed above, two-way and three-way interaction terms with BMI group were incorporated into the TEE prediction models. Differences in the slopes for height and weight were compared for each PAL category for adult men and women, boys and girls 3 to 18 years, and pregnant women. Importantly, none of the slopes were found to be significantly different at the p = .05 level.
Bland-Altman Plots
Bland-Altman plots of the predicted TEE versus observed TEE are displayed in Figure 5-5 for the general TEE prediction equations. On the x-axis is the mean of TEE observed and TEE predicted for each data point, and on the y-axis is the difference of TEE observed minus TEE predicted. Horizontal lines for the bias (i.e., the mean error) and the 95 percent limits of agreement (mean ±1.96 standard deviation) for the differences are also plotted. The mean and sample standard deviation for the difference between the observed and predicted TEE are shown in Table 5-7.
TABLE 5-7 Bias and Standard Deviation of the Differences Between the Observed Minus Predicted Values for TEE, by Strata
| Strata | n | Bias (kcal/d) | Standard Deviation |
|---|---|---|---|
| Men, 19+ y | 1,016 | 29.39 | 337 |
| Women, 19+ y | 1,342 | 0.61 | 246 |
| Boys, 3–18 y | 250 | 43.16 | 255 |
| Girls, 3–18 y | 477 | 11.45 | 237 |
| Boys, 0–2 y | 317 | 0.06 | 104 |
| Girls, 0–2 y | 432 | 0.51 | 95 |
| Pregnant women | 413 | 39.59 | 280 |

Model Comparisons
The predicted TEE values from the five models (all-included, sensitivity, normal weight BMI, overweight/obese BMI, FFM/FM) were compared to inspect similarities or differences between how models fit on different subsets of participants based on BMI category. Pairwise comparisons for each pair of models were performed using Pearson r correlation of predicted TEE, the symmetric mean absolute percentage error (sMAPE), the MAE, MSE, and the RMSE. As expected, the predicted values from the five models were highly correlated. Results are shown in Appendix G.
Lastly, results from the different models can be visualized with plots showing TEE predictions for randomly selected people (see Supplemental Appendix R). About 100 people were randomly selected, with one from each combination of sex, age (life-stage group), BMI range, and PAL category. Their observed TEE data are shown in Panel 1, and their predicted TEE values from each of the five models are shown in the other panels. The predicted values can then be visually compared between models.
Prediction Error
The prediction errors for each of the TEE prediction equations are shown as the standard error (SE) of the predicted values for an individual at average levels of age, height, and weight, with an active PAL, within each stratum (Table 5-8). A 95 percent prediction interval can be calculated using the predicted value of TEE ±1.96 × SE, such that there is a 95 percent probability that an observation of TEE for a new person at the same levels of covariates will be contained within the prediction interval.
TABLE 5-8 Prediction Errors for the TEE Prediction Equations by Strata
| Strata | Age (y) | Height (cm) | Weight (kg) | Weeks Pregnant | Predicted TEE (kcal/d) | SE of the Predicted Value (kcal/d)* |
|---|---|---|---|---|---|---|
| Men, 19+ years | 50.3 | 175.9 | 83.1 | — | 2,930 | 342 |
| Women, 19+ years | 53.9 | 162.3 | 71.9 | — | 2,281 | 241 |
| Boys, 0–2 years | 0.7 | 68.5 | 8.0 | — | 624 | 104 |
| Boys, 3–18 years | 8.7 | 134.0 | 37.1 | — | 2,099 | 258 |
| Girls, 0–2 years | 0.7 | 68.3 | 7.8 | — | 593 | 96 |
| Girls, 3–18 years | 9.6 | 135.0 | 37.6 | — | 1,873 | 221 |
| Pregnant | 29.4 | 164.1 | 74.9 | 19.9 | 2,680 | 302 |
* Predicted values are reported as SE of the predicted values for each strata at average age, height, and weight. — No data are applicable in this category.
EXTERNAL MODEL VALIDATION
The committee, recognizing that the contents of the combined DLW database represent only a fraction of existing published data, determined to validate the TEE equations against existing published data for an out-of-sample model validation. A literature search was conducted to identify studies published between 2000 and 2022 that used DLW to measure TEE, contained the minimum necessary variables (i.e., sex and mean (standard deviation [SD]) age, height, weight, and TEE), and were not found in the combined DLW database (see Appendix D for details of the literature search). Using the same exclusion criteria applied to the combined DLW database, 65 studies were identified after full-text screening. These 65 studies comprised 144 age/sex-specific cohorts, representing 5,056 individual participants.
Only two studies with infant data were identified and dropped owing to the small sample size. Of the 144 cohorts, mean PAL values were presented for only 54 (38 percent). For cohorts without BMR or PAL values, estimated mean BMR was calculated using the age- and sex-specific Schofield equations and PAL was estimated accordingly. Details of the literature search, a summary of the DLW data extraction, and summary statistics for the included cohorts are found in Appendix I and Supplemental Appendix U.
The parameter estimates from the TEE equations developed on the combined DLW data set were used to calculate the “average participant’s” TEE, based on sex, age, height, weight, and PAL category, for each validation cohort. The predicted value for each cohort was then compared to the observed TEE value using measures and assessed for model fit and performance. Two comparisons were made. First, predicted TEE was compared to observed TEE in those cohorts in which BMR and/or PAL were measured (n = 54) (Figure 5-6). The data points on Figure 5-6 are color-coded to represent the different PAL categories. As shown in Table 5-9, the model fits were very good across all sex-age groups, according to the selected model performances.
The second comparison used all validation study data, including observed and imputed PAL (144 cohorts) (Figure 5-7). As with observed PAL, the model fit was very good across all age/sex groups (Table 5-10).
ENERGY COSTS OF GROWTH, PREGNANCY, AND LACTATION
Growth of Infants, Children, and Adolescents
The energy requirements of infants, children, and adolescents includes the energy required for deposition of tissues consistent with health. Humans’ relatively slow growth rates as a species mean that the energy
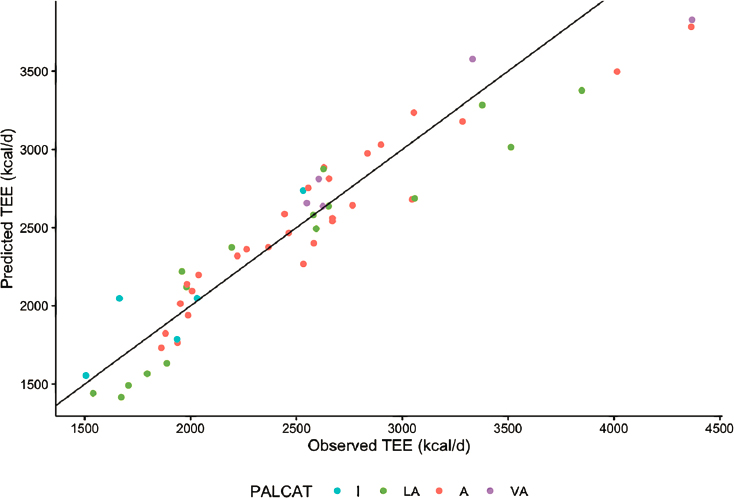
NOTE: A = active; LA = low active; I = inactive; VA = very active; TEE = total energy expenditure; PALCAT = physical activity level category.
TABLE 5-9 Evaluation of Model Fit for the TEE Prediction Equations Compared to External Validation Studies with Observed PAL Values (n = 54 cohorts)
| Number of cohorts | R2 | R | MSE | RMSE (kcal/d) | MAPE (%) | |
|---|---|---|---|---|---|---|
| Boy | 8 | 0.90 | 0.96 | 95,651 | 309 | 7.90 |
| Girl | 7 | 0.82 | 0.97 | 56,812 | 238 | 10.38 |
| Man | 14 | 0.85 | 0.93 | 45,699 | 213 | 6.00 |
| Woman | 25 | 0.85 | 0.94 | 44,940.87 | 212 | 6.83 |
NOTES: R2 = R squared; R = correlation; MSE = mean squared error; RMSE = root mean squared error; MAPE = mean absolute percentage error.
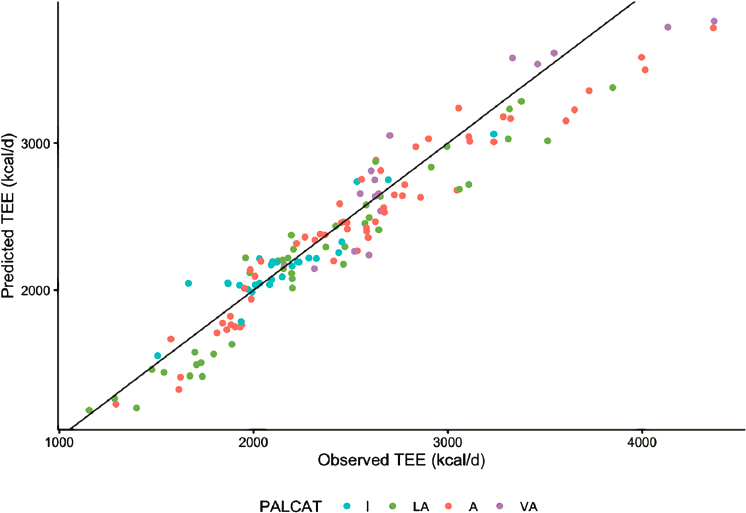
NOTES: A = active; LA = low active; I = inactive; VA = very active; TEE = total energy expenditure; PALCAT = physical activity level category.
TABLE 5-10 Evaluation of Model Fit for the TEE Prediction Equations Compared to External Validation Studies with Observed PAL Values (n = 144 cohorts)
| Number of Cohorts | R2 | R | MSE | RMSE (kcal/d) | MAPE (%) | |
|---|---|---|---|---|---|---|
| Boy | 21 | 0.92 | 0.96 | 61,755 | 248 | 7.72 |
| Girl | 20 | 0.87 | 0.97 | 35,342 | 188 | 8.01 |
| Man | 32 | 0.82 | 0.92 | 49,684 | 222 | 5.57 |
| Woman | 71 | 0.82 | 0.93 | 28,833 | 169 | 5.46 |
NOTE: R2 = R squared; R = correlation; MSE = mean squared error; RMSE = root mean squared error; MAPE = mean absolute percentage error.
requirements for growth relative to maintenance are small, except during the first months of life. To estimate the energy cost of growth, one must estimate weight velocity and the energy content of the newly synthesized tissues, preferably from the separate costs of protein and fat deposition. The committee estimated the energy cost of growth for children 0 to 2 years from the energy cost of tissue deposition based on protein and fat accretion (Butte, 2005; Butte et al., 2000a,b) and WHO weight velocities4 rounded to 5-kcal increments, grouping 0 to 2.99 months, 3 to 5.99 months, 6 to 11.99 months, and 12 to 24 months (Table 5-11). For boys, the energy cost of growth is approximately 200 kcal/d for 0 to 2.99 months, 50 kcal/d for 3 to 5.99 months, and 20 kcal/d for 6 to 24 months of age. For girls, the energy cost of growth is approximately 180 kcal/d for 0 to 2.99 months, 60 kcal/d for 3 to 5.99 months, 20 kcal/d for 6 to 11 months, and 15 kcal/d for 12 to 24 months of age.
Data for the energy cost of growth from 24 to 35 months were lacking for both sexes, and thus the committee recommended extending the additional calories from the previous time frame, 20 kcal/d for boys and 15 kcal/d for girls.
The energy costs of growth for children 3–18 years were estimated based on rates of weight gain of children enrolled in the Fels Longitudinal Study (Baumgartner et al., 1986) (Table 5-12). Body composition increments were used to estimate the energy cost of tissue deposition (Fomon et al., 1982; Haschke, 1989). The energy cost of growth was about 15 kcal/d in children 4 to 8 years, 25 kcal/d in boys 9 to 13 years, 30 kcal/d in girls 9 to 13 years, and 20 kcal/d in children 14 to 18 years. Data for 3-year-olds were estimated by averaging the values for 12- to 24-month-olds and 3- to 3.5-year-olds from the Fels study, resulting in values that were consistent with the 1- to 3-year-olds, 20 kcal/d for boys and 15 kcal/d for girls.
Energy Cost of Tissue Accretion During Pregnancy
Guidelines for weight gain during pregnancy stipulate a range of weight gain, based on prepregnancy BMI, that will optimize both maternal and fetal outcomes (IOM and NRC, 2009). Consistent with this premise, the committee determined that the energy cost of tissue accretion during the second and third trimesters of pregnancy should be based on body composition changes in women who gained within the IOM weight gain guidelines for their prepregnancy BMI category (IOM and NRC, 2009). Weight gain in the first trimester is minor and therefore not considered here.
___________________
4https://www.who.int/tools/child-growth-standards/standards/weight-velocity (accessed November 14, 2022).
TABLE 5-11 Energy Cost of Growth, Infants, and Children Aged 0–2 Years
| Age Range (months) | WHO Weight Velocity (g/d)a | Cost of Tissue Deposition (kcal/g)b | Energy Deposition (kcal/d)c | |
|---|---|---|---|---|
| Boys | 0–2.99 | 32.77 | 6.0 | 196.6 |
| 3–5.99 | 17.35 | 2.8 | 48.6 | |
| 6–8.99 | 10.55 | 1.5 | 15.8 | |
| 9–11.99 | 8.09 | 2.7 | 21.8 | |
| 12–14.99 | 7.03 | 2.2 | 15.5 | |
| 15–17.99 | 6.6 | 2.2 | 14.5 | |
| 18–20.99 | 6.43 | 4.7 | 30.2 | |
| 21–24 | 6.11 | 4.7 | 28.7 | |
| Girls | 0–2.99 | 28.55 | 6.3 | 179.9 |
| 3–5.99 | 16.21 | 3.7 | 60.0 | |
| 6–8.99 | 10.14 | 1.8 | 18.3 | |
| 9–11.99 | 7.74 | 2.3 | 17.8 | |
| 12–14.99 | 7.04 | 2.5 | 17.6 | |
| 15–17.99 | 6.9 | 2.5 | 17.3 | |
| 18–20.99 | 6.68 | 2.2 | 14.7 | |
| 21–24 | 6.26 | 2.2 | 13.8 |
NOTE: d = day; g = grams; kcal = kilocalorie; WHO = World Health Organization.
a Weight velocity (https://www.who.int/tools/child-growth-standards/standards/weight-velocity (accessed November 14, 2022).
b Body composition increments used to estimate energy costs of tissue deposition (kcal/g) (Butte, 2005; Butte et al., 2000a,b).
c Energy deposition (kcal/d) estimated by applying energy costs of tissue deposition (kcal/g) to WHO weight velocities (g/d).
The committee found only three studies that differentiated weight gain by IOM guidelines (IOM and NRC, 2009), which it used in estimating these costs (Butte et al., 2004; Lederman et al., 1997; Most et al., 2019). Combined sample sizes were 11 women with underweight, 66 with normal weight, 19 with overweight, and 14 with obesity. Across BMI categories, approximately 7 g/d of protein was deposited in fetal and maternal tissues. In contrast, fat mass deposition was variable within and across BMI categories. In underweight, normal weight, and overweight BMI categories, FM deposition averaged about 35 g/d, whereas in the obese BMI category, FM was mobilized (approximately –10 g/d). These body composition changes were used to calculate the energy cost of tissue deposition per gram gained (Table 5-13). These energy costs of tissue deposition per gram gained were then multiplied by the IOM recommendations for gestational weight gain (GWG).
TABLE 5-12 Energy Cost of Growth in Children, Aged 3–18 Years
| Age at End of Interval (y) | Weight Gain (kg/6 month)a | Weight Gain (g/d)a | Energy Cost of Tissue Deposition (kcal/g)b | Energy Deposition (kcal/d)c | |
|---|---|---|---|---|---|
| Boys | 3.5 | 1 | 5.5 | 1.5 | 8.2 |
| 4.5 | 1.1 | 6.0 | 1.5 | 9.0 | |
| 5.5 | 1.2 | 6.6 | 1.5 | 9.9 | |
| 6.5 | 1.2 | 6.6 | 1.7 | 11.1 | |
| 7.5 | 1.4 | 7.7 | 2.4 | 18.4 | |
| 8.5 | 1.4 | 7.7 | 2.4 | 18.4 | |
| 9.5 | 1.5 | 8.2 | 2.6 | 21.3 | |
| 10.5 | 1.6 | 8.7 | 2.9 | 25.4 | |
| 11.5 | 1.9 | 10.4 | 3.1 | 32.2 | |
| 12.5 | 2.5 | 13.7 | 1.8 | 24.6 | |
| 13.5 | 3.1 | 16.9 | 1.3 | 22.0 | |
| 14.5 | 3.7 | 20.2 | 1.5 | 30.3 | |
| 15.5 | 2.6 | 14.2 | 1.7 | 24.2 | |
| 16.5 | 1.7 | 9.3 | 1.9 | 17.7 | |
| 17.5 | 1.1 | 6.0 | 2 | 12.0 | |
| Girls | 3.5 | 1 | 5.5 | 1.7 | 9.3 |
| 4.5 | 0.9 | 4.9 | 2 | 9.8 | |
| 5.5 | 1 | 5.5 | 2.2 | 12.0 | |
| 6.5 | 1.2 | 6.6 | 2.6 | 17.0 | |
| 7.5 | 1.3 | 7.1 | 2.9 | 20.6 | |
| 8.5 | 1.5 | 8.2 | 3.1 | 25.4 | |
| 9.5 | 1.5 | 8.2 | 3.3 | 27.0 | |
| 10.5 | 2 | 10.9 | 2.8 | 30.6 | |
| 11.5 | 2.5 | 13.7 | 2.3 | 31.4 | |
| 12.5 | 2.8 | 15.3 | 1.9 | 29.1 | |
| 13.5 | 2.3 | 12.6 | 3 | 37.7 | |
| 14.5 | 1.5 | 8.2 | 4.1 | 33.6 | |
| 15.5 | 0.9 | 4.9 | 5.1 | 25.1 | |
| 16.5 | 0.8 | 4.4 | 4.9 | 21.4 | |
| 17.5 | 0.4 | 2.2 | 4 | 8.7 |
NOTE: d = day; g = grams; kcal = kilocalorie; kg = kilogram; y = years.
a Increments in weight 50th percentile (Baumgartner et al., 1986).
b Body composition increments used to estimate energy cost of tissue deposition (Fomon et al., 1982; Haschke, 1989).
c Energy deposition (kcal/d) estimated by applying energy cost of tissue deposition (kcal/g) to Baumgartner et al. (1986) rates of weight gain (g/d).
TABLE 5-13 Energy Cost of Tissue Deposition in Pregnancy Based on Recommended Rates of Weight Gaina
| Recommended rates of GWG in 2nd and | Recommended rates of GWG in 2nd and | Energy cost of tissue deposition per gram gained, weighted for | Energy cost of tissue | Energy cost of tissue deposition, | |
|---|---|---|---|---|---|
| Prepregnancy BMI | 3rd trimesters (kg/wk)a | 3rd trimesters (g/d)a | sample size (kcal/g)b | deposition (kcal/d) | rounded (kcal/d) |
| Underweight | 0.51 | 72.86 | 4.08 | 297.18 | 300 |
| Normal weight | 0.42 | 60.00 | 3.41 | 204.46 | 200 |
| Overweight | 0.28 | 40.00 | 3.80 | 152.02 | 150 |
| Obese | 0.22 | 31.43 | –2.06 | –64.63 | –50 |
NOTE: d = day; g = grams; GWG = gestational weight gain; kcal = kilocalorie; kg = kilogram; wk = week.
a Recommended rates of gestational weight gain are from the Institute of Medicine guidelines (IOM and NRC, 2009).
b Energy cost of tissue deposition based on longitudinal changes in body composition; calculated using energy equivalences of 5.65 kcal/g protein and 9.25 kcal/g fat (Butte et al., 2004; Lederman et al., 1997; Most et al., 2019).
For women with underweight, the IOM recommended rate of GWG is 73 g/d in the second and third trimesters, which translates to approximately 300 kcal/d (IOM and NRC, 2009). For women with normal weight, the IOM recommended rate of GWG is 60 g/d in the second and third trimesters, which translates to approximately 200 kcal/d (IOM and NRC, 2009). For women with overweight, the IOM recommended rate of GWG is 40 g/d, which translates to approximately 150 kcal/d (IOM and NRC, 2009). For women with obesity, the IOM recommended rate of GWG is 31 g/d, which translates to approximately –50 kcal/d (IOM and NRC, 2009). Mobilization of tissue such as fat is considered negative energy cost.
Energy Cost of Milk Production
The American Academy of Pediatrics, the Canadian Pediatric Society, and WHO recommend exclusive breastfeeding for about 6 months, with complementary foods introduced around 6 months, and continued breastfeeding until 2 years or beyond, as mutually desired by mother and child (Critch et al., 2013, 2014; Meek et al., 2022; WHO, 2021). In this report, the energy cost of milk production was based on rates of human milk production in exclusively breastfeeding women in the first 6 months postpartum (Allen et al., 1991; Butte et al., 1984a; Reilly et al., 2005), and in partially breastfeeding women in the second 6 months
TABLE 5-14 Energy Cost of Milk Production in Breastfeeding Women During the First Year Postpartum
| Time Postpartum | |||||
|---|---|---|---|---|---|
| 0–2 months | 3–4 months | 5 months | 6 months | 7–12 months | |
| Human milk production (g/d) a,b | 732a | 779b | 826b | 894b | 568c |
| Gross energy content (kcal/g)b | 0.67 | 0.67 | 0.67 | 0.67 | 0.67 |
| Total cost of milk production (kcal/d) | 490 | 522 | 553 | 599 | 381 |
| Maternal weight loss (kcal/d)d | –137 | –137 | –137 | –137 | NA |
| Net energy cost of milk production (kcal/d) | 353 | 385 | 416 | 462 | 381 |
NOTE: d = day; g = grams; kcal = kilocalorie.
a Exclusively breastfeeding women (Allen et al., 1991; Butte et al., 1984a).
b Exclusively breastfeeding women (Reilly et al., 2005).
c Partially breastfeeding women (Dewey et al., 1984; Heinig et al., 1993; Pereira et al., 2019).
d Mean weight loss (0.64 kg/mo) and energy content of tissues mobilized (6,500 kcal/kg) based on 2,393 longitudinal studies: (Brewer et al., 1989; Butte et al., 1984b, 2001; Dewey et al., 1993; Goldberg et al., 1991; Manning-Dalton and Allen, 1983; Naismith and Ritchie, 1975; Sadurskis et al., 1988; Sohlstrom and Forsum, 1995; van Raaij et al., 1991; Wosje and Kalkwarf, 2004).
postpartum (Dewey et al., 1984; Heinig et al., 1993; Pereira et al., 2019) (see Table 5-14). The gross energy content of milk was derived from bomb calorimetry or proximate macronutrient analysis, averaging 0.67 kcal/g (Reilly et al., 2005). The total cost of milk production may be subsidized by mobilization of tissue reserves in the postpartum period. During the first 6 months postpartum, breastfeeding women had a gradual weight loss averaging 0.64 kg/month (Brewer et al., 1989; Butte et al., 1984b, 2001; Dewey et al., 1993; Goldberg et al., 1991; Manning-Dalton and Allen, 1983; Naismith and Ritchie, 1975; Sadurskis et al., 1988; Sohlstrom and Forsum, 1995; van Raaij et al., 1991; Wosje and Kalkwarf, 2004).
From 0 to 6 months postpartum, the net energy cost of milk production averages 404 kcal/d to support an average milk volume of 808 g/d in exclusively breastfeeding women experiencing gradual weight loss (0.64 kg/month). In the second 6 months postpartum, weight changes are variable depending on the amount of milk produced, complementary feeding, maternal food intake, and physical activity. If weight is stable, an extra 380 kcal/d are required to support milk production at a level of 570 g/d. In the second year of lactation, the energy cost of milk production is variable, depending on child demand and maternal factors.
ESTIMATED ENERGY REQUIREMENTS
Boys and Girls, 0 to 2.99 Years
The EER for young children are based on an allowance for growth in addition to TEE (Table 5-15). For boys and girls, 0 to 2.99 years, the sex-specific TEE prediction equations based on age, weight, and height are recommended for general use. See Appendix G for TEE prediction equations based on weight only or on body composition (FFM and FM). For boys, the energy cost of growth is estimated to be 200 kcal/d for 0 to 3 months, 50 kcal/d for 3 to 6 months, and 20 kcal/d for 6 to 35.99 months of age. For girls, the energy cost of growth is estimated to be 180 kcal/d for 0 to 3 months, 60 kcal/d for 3 to 6 months, 20 kcal/d for 6 to 11 months, and 15 kcal/d for 12 to 35.99 months of age. Therefore, the EER for boys and girls is the sum of TEE and the age- and sex-specific energy cost of growth.
Boys and Girls, 3 to 18.99 Years
The EER for children 3 to 18.99 years is based on sex-specific TEE prediction equations using age, height, and weight for each PAL category (Table 5-15). Importantly, the general TEE prediction equations are recommended for all BMI categories, as testing of separate prediction equations did not show significant differences by BMI category at the p = .05 level. See Appendix G for TEE prediction equations based on body composition (FFM and FM). The energy cost of growth from 24 to 35 months was set at 20 kcal/d for boys and 15 kcal/d for girls; these same values were also set for 3-year-olds. The energy cost of growth was about 15 kcal/d in children 4 to 8 years, 25 kcal/d in boys 9 to 13 years, 30 kcal/d in girls 9 to 13 years, and 20 kcal/d in boys and girls 14 to 18 years. Therefore, the EER for boys and girls 3 to 18.99 years is the sum of TEE and the age-specific energy cost of growth.
Men and Women, 19 Years and Above
The EER for adults, 19 years and above, is based on sex-specific TEE prediction equations using age, height, and weight for each PAL category (Table 5-16). Importantly, the general TEE prediction equations are recommended for all BMI categories, as testing of separate prediction equations did not show significant differences by BMI category at the p = .05 level. TEE prediction equations based on body composition (FFM and FM) are available in Appendix G. In weight-stable men and women, TEE represents their EER.
TABLE 5-15 Summary Table of EER Equations by Age, Sex, Physical Activity, and Energy Cost of Growth: Children and Adolescents
| Age Group | Sex | PAL Category | EER Equation (kcal/d) |
|---|---|---|---|
| 0–2.99 months | M | – | EER = –716.45 – (1.00 × age) + (17.82 × height) + (15.06 × weight) + 200 |
| F | – | EER = –69.15 + (80.0 × age) + (2.65 × height) + (54.15 × weight) + 180 | |
| 3–5.99 months | M | – | EER = –716.45 – (1.00 × age) + (17.82 × height) + (15.06 × weight) + 50 |
| F | – | EER = –69.15 + (80.0 × age) + (2.65 × height) + (54.15 × weight) + 60 | |
| 6 months–2.99 years | M | – | EER = –716.45 – (1.00 × age) + (17.82 × height) + (15.06 × weight) + 20 |
| F | – | EER = –69.15 + (80.0 × age) + (2.65 × height) + (54.15 × weight) + 20/15a | |
| 3–13.99 years | M | Inactive | EER = –447.51 + (3.68 × age) + (13.01 × height) + (13.15 × weight) + 20/15/25b |
| Low active | EER = 19.12 + (3.68 × age) + (8.62 × height) + (20.28 × weight) + 20/15/25 | ||
| Active | EER = –388.19 + (3.68 × age) + (12.66 × height) + (20.46 × weight) + 20/15/25 | ||
| Very active | EER = –671.75 + (3.68 × age) + (15.38 × height) + (23.25 × weight) + 20/15/25 | ||
| F | Inactive | EER = 55.59 – (22.25 × age) + (8.43 × height) + (17.07 × weight) + 15/30c | |
| Low active | EER = –297.54 – (22.25 × age) + (12.77 × height) + (14.73 × weight) + 15/30 | ||
| Active | EER = –189.55 – (22.25 × age) + (11.74 × height) + (18.34 × weight) + 15/30 | ||
| Very active | EER = –709.59 – (22.25 × age) + (18.22 × height) + (14.25 × weight) + 15/30 | ||
| 14–18.99 years | M | Inactive | EER = –447.51 + (3.68 × age) + (13.01 × height) + (13.15 × weight) + 20 |
| Low active | EER = 19.12 + (3.68 × age) + (8.62 × height) + (20.28 × weight) + 20 | ||
| Active | EER = –388.19 + (3.68 × age) + (12.66 × height) + (20.46 × weight) + 20 | ||
| Very active | EER = –671.75 + (3.68 × age) + (15.38 × height) + (23.25 × weight) + 20 | ||
| F | Inactive | EER = 55.59 – (22.25 × age) + (8.43 × height) + (17.07 × weight) + 20 |
| Age Group | Sex | PAL Category | EER Equation (kcal/d) |
|---|---|---|---|
| Low active | EER = –297.54 – (22.25 × age) + (12.77 × height) + (14.73 × weight) + 20 | ||
| Active | EER = –189.55 – (22.25 × age) + (11.74 × height) + (18.34 × weight) + 20 | ||
| Very active | EER = –709.59 – (22.25 × age) + (18.22 × height) + (14.25 × weight) + 20 |
NOTES: kcal/d = kilocalories per day; PAL = physical activity level; EER = Estimated Energy Requirement. Age is in years, weight is in kilograms, and height is in centimeters.
a Energy cost of growth for girls: 6–11.99 months: 20 kcal/d; 12–35.99 months: 15 kcal/d.
b Energy cost of growth for boys: 3 y: 20 kcal/d; 4 to 8 y: 15 kcal/d; 9 to 13 y: 25 kcal/d.
c Energy cost of growth for girls: 3 y: 15 kcal/d; 4 to 8 y: 15 kcal/d; 9 to 13 y: 30 kcal/d.
TABLE 5-16 Summary Table of EER Equations Based on the TEE Prediction by Age, Sex, and Physical Activity: Adults
| Age Group | Sex | PAL Category | EER Equation (kcal/d) |
|---|---|---|---|
| 19+ years | M | Inactive | EER = 753.07 – (10.83 × age) + (6.50 × height) + (14.10 × weight) |
| Low active | EER = 581.47 – (10.83 × age) + (8.30 × height) + (14.94 × weight) | ||
| Active | EER = 1,004.82 – (10.83 × age) + (6.52 × height) + (15.91 × weight) | ||
| Very active | EER = –517.88 – (10.83 × age) + (15.61 × height) + (19.11 × weight) | ||
| F | Inactive | EER = 584.90 – (7.01 × age) + (5.72 × height) + (11.71 × weight) | |
| Low active | EER = 575.77 – (7.01 × age) + (6.60 × height) + (12.14 × weight) | ||
| Active | EER = 710.25 – (7.01 × age) + (6.54 × height) + (12.34 × weight) | ||
| Very active | EER = 511.83 – (7.01 × age) + (9.07 × height) + (12.56 × weight) |
NOTES: kcal/d = kilocalories per day; PAL = physical activity level; EER = Estimated Energy Requirement; TEE = total energy expenditure. For weight stable adults, EER (kcal/d) = TEE (kcal/d). Age is in years, weight is in kilograms, and height is in centimeters.
Pregnancy
The EER for pregnant women during the second and third trimesters is based on the TEE prediction equations using age, height, current weight, and gestational weeks for each PAL category, plus the energy deposition
in maternal and fetal tissues (Table 5-17). Importantly, the general TEE prediction equations are recommended for all BMI categories, as testing of separate prediction equations did not show significant differences by BMI category at the p = .05 level. Because of the paucity of data on pregnant adolescents, the EERs derived from adults are recommended for this age group. See Appendix G for TEE prediction equations based on body composition (FFM and FM).
The EER for the first trimester of pregnancy should be estimated from the nonpregnant TEE prediction equations. Because weight gain is minor and variable in the first trimester, no allowance is made for energy deposition. Energy deposition is based on the IOM recommended GWG for the second and third trimesters. For underweight women, the IOM recommended rate of GWG is 73 g/d in the second and third trimesters, which translates to an energy deposition of approximately 300 kcal/d. For normal weight women, the IOM and NRC (2009) recommended rate of GWG is 60 g/d in the second and third trimesters, which translates to an energy deposition of approximately 200 kcal/d. For women with overweight, the IOM recommended rate of GWG is 40 g/d, which translates to an energy deposition of approximately 150 kcal/d. For women with obesity, the IOM and NRC (2009) recommended rate of GWG is 31 g/d, which translates to an energy mobilization of approximately –50 kcal/d. The EER for pregnant women is thus calculated as the sum of TEE and energy deposition/mobilization.
TABLE 5-17 Summary Table of EER Equations for Pregnant Women During the Second and Third Trimesters of Pregnancy
| Life Stage | PAL Category | EER Equation (kcal/day) |
|---|---|---|
| 2nd and 3rd trimester of pregnancya | Inactive | EER = 1,131.20 – (2.04 × age) + (0.34 × height) + (12.15 × weight) + (9.16 × gestation) + energy deposition |
| Low active | EER = 693.35 – (2.04 × age) + (5.73 × height) + (10.20 × weight) + (9.16 × gestation) + energy deposition | |
| Active | EER = –223.84 – (2.04 × age) + (13.23 × height) + (8.15 × weight) + (9.16 × gestation) + energy deposition | |
| Very active | EER = –779.72 – (2.04 × age) + (18.45 × height) + (8.73 × weight) + (9.16 × gestation) + energy deposition |
NOTES: For pregnancy: EER (kcal/d) = TEE (kcal/d) + energy deposition (kcal/d). Energy deposition/mobilization (kcal/d) estimated for underweight (UW), normal weight (NW), overweight (OW), and obese (OB) pregnant women during the 2nd and 3rd trimesters of pregnancy: + 300 kcal/d for UW; + 200 kcal/d for NW; + 150 kcal/d for OW; –50 kcal/d for OB. EERs are in kilocalories/day, age is in years, height is in centimeters, weight is in kilograms, gestation is in weeks, energy deposition is in kilocalories/day.
a For the 1st trimester of pregnancy, the nonpregnant TEE prediction equation should be used. It is assumed that energy deposition/mobilization is negligible and therefore ignored.
Lactation
The EERs for lactating women are based on rates of TEE, milk energy output, and energy mobilization from stores (Tables 5-18 and 5-19). Because TEE adjusted for weight and PAL were not shown to be significantly different in lactating women compared to their nonpregnant and nonlactating state, the TEE prediction equations for women, 19 years and above, are recommended. For lactating adolescents, less than 19 years, the TEE prediction equations for girls 14 to 18.99 years are recommended. See Appendix G for TEE prediction equations based on body composition (FFM and FM). Weight stability is assumed after 6 months postpartum.
TABLE 5-18 Summary Table of EER Equations for Women and Girls Exclusively Breastfeeding 0 to 6 Months Postpartum
| Age Group | PAL Category | EER Equation (kcal/day) |
|---|---|---|
| Women, 19 years and above | Inactive | EER = 584.90 – (7.01 × age) + (5.72 × height) + (11.71 × weight) + energy cost of milk production – energy mobilization |
| Low active | EER = 575.77 – (7.01 × age) + (6.60 × height) + (12.14 × weight) + energy cost of milk production – energy mobilization | |
| Active | EER = 710.25 – (7.01 × age) + (6.54 × height) + (12.34 × weight) + energy cost of milk production – energy mobilization | |
| Very active | EER = 511.83 – (7.01 × age) + (9.07 × height) + (12.56 × weight) + energy cost of milk production – energy mobilization | |
| Girls, < 19 years | Inactive | EER = 55.59 – (22.25 × age) + (8.43 × height) + (17.07 × weight) + energy cost of milk production – energy mobilization |
| Low active | EER = –297.54 – (22.25 × age) + (12.77 × height) + (14.73 × weight) + energy cost of milk production – energy mobilization | |
| Active | EER = –189.55 – (22.25 × age) + (11.74 × height) + (18.34 × weight) + energy cost of milk production – energy mobilization | |
| Very active | EER = –709.59 – (22.25 × age) + (18.22 × height) + (14.25 × weight) + energy cost of milk production – energy mobilization |
NOTES: For exclusively breastfeeding 0–6 months postpartum: EER (kcal/d) = TEE (kcal/d) + energy cost of milk production (kcal/d) – energy mobilization (kcal/d). Energy cost of milk production estimated for women and girls exclusively breastfeeding 0–6 months postpartum: 540 kcal/d. Energy mobilization estimated for women and girls exclusively breastfeeding 0 to 6 months postpartum: 140 kcal/d. EERs are in kilocalories/day, age is in years, height is in centimeters, weight is in kilograms, energy cost of milk production is in kilocalories/day, and energy mobilization is in kilocalories/day.
TABLE 5-19 Summary Table of EER Equations for Women and Girls Partially Breastfeeding 7 to 12 Months Postpartum
| Age Group | PAL Category | EER Equation (kcal/day) |
|---|---|---|
| Women, 19 years and above | Inactive | EER = 584.90 – (7.01 × age) + (5.72 × height) + (11.71 × weight) + energy cost of milk production |
| Low active | EER = 575.77 – (7.01 × age) + (6.60 × height) + (12.14 × weight) + energy cost of milk production | |
| Active | EER = 710.25 – (7.01 × age) + (6.54 × height) + (12.34 × weight) + energy cost of milk production | |
| Very active | EER = 511.83 – (7.01 × age) + (9.07 × height) + (12.56 × weight) + energy cost of milk production | |
| Girls, < 19 years | Inactive | EER = 55.59 – (22.25 × age) + (8.43 × height) + (17.07 × weight) + energy cost of milk production |
| Low active | EER = –297.54 – (22.25 × age) + (12.77 × height) + (14.73 × weight) + energy cost of milk production | |
| Active | EER = –189.55 – (22.25 × age) + (11.74 × height) + (18.34 × weight) + energy cost of milk production | |
| Very active | EER = –709.59 – (22.25 × age) + (18.22 × height) + (14.25 × weight) + energy cost of milk production |
NOTES: For partially breastfeeding 7–12 months postpartum: EER (kcal/d) = TEE (kcal/d) + energy cost of milk production (kcal/d). Energy cost of milk production estimated for women and girls partially breastfeeding 7–12 months postpartum: 380 kcal/d. EERs are in kilocalories/day, age is in years, height is in centimeters, weight is in kilograms, and energy cost of milk production is in kilocalories/day.
FINDINGS AND CONCLUSIONS
Findings
Based on its analysis of the assembled DLW database of 8,600 values representing infants, children, adolescents, adults, and reproductive age women, the committee finds that TEE and PAL changed in a curvilinear fashion across the life span, which influenced development of the TEE prediction equations. Specifically, the committee found that sex differences in TEE were observed across the life span.
Testing of separate TEE prediction equations for normal weight BMI compared to the overweight/obese BMI did not reveal statistically significant differences. Similarly, the committee finds that TEE prediction equations for pregnant women in the second and third trimesters of pregnancy did not differ significantly between women with normal weight BMI and those with overweight/obese BMI. When TEE was adjusted for weight and PAL, there was no statistically significant difference among lactating women compared to their
nonpregnant state. The committee also found that its calculated EER equations were consistent with the IOM and NRC (2009) weight gain guidelines, and with the TEE plus the energy cost of milk production during lactation.
The committee finds that alternative TEE prediction equations developed based on height and body composition (FFM and FM) performed slightly better than those based on weight and height for adults, but not for children. Pearson correlations (r) between predicted and observed values for PAL categories, BMI categories, and life stages ranged from approximately 0.75 to 0.95. The standard error (SE) of the predicted values for people at average levels of age, height, and weight within each strata ranged from 96 to 342 kcal/d. In an external validation of the TEE prediction equation based on 65 studies representing 5,056 participants, the Pearson correlations (r) between predicted and observed TEE (n = 144) ranged from 0.92 to 0.97.
Conclusions
From its analysis of representative DLW values across the life span, the committee concludes that in order to address the age-dependent curvilinearity of TEE, sex-specific TEE prediction equations were needed for children, 0 to 2 years and 3 to 18 years, and adults, 19 years and above. Additionally, age-specific coefficients for PAL categories defined as inactive, low active, active, and very active were incorporated into the TEE prediction equations to address the age dependency of PAL. However, because of the limited range of physical activity in children 0 to 2 years old, TEE could not be partitioned by PAL category.
Based on the testing of TEE equations in normal and overweight/obese BMI categories, the committee concludes that the same TEE prediction equations are recommended for infants, children, and adults, regardless of BMI classification. Further, the TEE prediction equations are also recommended for all pregnant women, regardless of BMI classification, and the TEE of lactating women and adolescents may be predicted from nonpregnant TEE equations.
From its findings on the TEE prediction equations based on height and body composition, the committee concludes that TEE prediction equations based on height and body composition are marginally better than those based on weight and height in adults, and may be used where body composition data are available. Additionally, the committee concludes that correlations between predicted and observed values for TEE are moderate to high across
PAL categories, BMI categories, and life stages; standard errors of the predicted values ranging from 96 to 342 kcal/d depending on sex-age strata indicated a level of uncertainty in predicting an individual’s TEE.
The committee concludes from its external validation of the new TEE prediction equations that close agreement between the observed mean TEE in studies and predicted means confirmed the robustness of the prediction equations.
Overall, the committee concludes that its calculated EER equations were based upon TEE in weight stable adults, and on TEE plus the energy cost of growth in children, on TEE plus the energy cost of tissue accretion during the second and third trimesters of pregnancy consistent with the IOM and NRC (2009) weight gain guidelines, and TEE plus the energy cost of milk production during lactation.
REFERENCES
Allen, J. C., R. P. Keller, P. Archer, and M. C. Neville. 1991. Studies in human lactation: Milk composition and daily secretion rates of macronutrients in the first year of lactation. American Journal of Clinical Nutrition 54(1):69-80.
Baumgartner, R. N., A. F. Roche, and J. H. Himes. 1986. Incremental growth tables: Supplementary to previously published charts. American Journal of Clinical Nutrition 43(5):711-722.
Black, A. E., A. M. Prentice, and W. A. Coward. 1986. Use of food quotients to predict respiratory quotients for the doubly-labelled water method of measuring energy expenditure. Human Nutrition: Clinical Nutrition 40(5):381-391.
Black, A. E., W. A. Coward, T. J. Cole, and A. M. Prentice. 1996. Human energy expenditure in affluent societies: An analysis of 574 doubly-labelled water measurements. European Journal of Clinical Nutrition 50(2):72-92.
Brewer, M. M., M. R. Bates, and L. P. Vannoy. 1989. Postpartum changes in maternal weight and body fat depots in lactating vs nonlactating women. American Journal of Clinical Nutrition 49(2):259-265.
Butte, N. F. 2005. Energy requirements of infants. Public Health Nutrition 8(7A):953-967.
Butte, N. F., and B. Caballero. 2014. Energy needs: Assessment and requirements. In Modern nutrition in health and disease. 11th ed., edited by A. C. Ross, B. Caballero, R. J. Cousins, K. L. Tucker and T. R. Ziegler. Baltimore, MD: Lippincott, Williams and Wilkins.
Butte, N. F., C. Garza, E. O. Smith, and B. L. Nichols. 1984a. Human milk intake and growth in exclusively breast-fed infants. Journal of Pediatrics 104(2):187-195.
Butte, N. F., C. Garza, J. E. Stuff, E. O. Smith, and B. L. Nichols. 1984b. Effect of maternal diet and body composition on lactational performance. American Journal of Clinical Nutrition 39(2):296-306.
Butte, N. F., J. M. Hopkinson, W. W. Wong, E. O. Smith, and K. J. Ellis. 2000a. Body composition during the first 2 years of life: An updated reference. Pediatric Research 47(5):578-585.
Butte, N. F., W. W. Wong, J. M. Hopkinson, C. J. Heinz, N. R. Mehta, and E. O. Smith. 2000b. Energy requirements derived from total energy expenditure and energy deposition during the first 2 y of life. American Journal of Clinical Nutrition 72(6):1558-1569.
Butte, N. F., W. W. Wong, and J. M. Hopkinson. 2001. Energy requirements of lactating women derived from doubly labeled water and milk energy output. Journal of Nutrition 131(1):53-58.
Butte, N. F., W. W. Wong, M. S. Treuth, K. J. Ellis, and E. O’Brian Smith. 2004. Energy requirements during pregnancy based on total energy expenditure and energy deposition. American Journal of Clinical Nutrition 79(6):1078-1087.
CDC (Centers for Disease Control and Prevention). 2009. Percentile data files with LMS values. https://www.cdc.gov/growthcharts/percentile_data_files.htm (accessed November 28, 2022).
Critch, J. N., Canadian Paediatric Society, Nutrition and Gastroenterology Committee. 2013. Nutrition for healthy term infants, birth to six months: An overview. Paediatrics & Child Health 18(4):206-209.
Critch, J. N., Canadian Paediatric Society, Nutrition and Gastroenterology Committee. 2014. Nutrition for healthy term infants, six to 24 months: An overview. Paediatrics & Child Health 19(10):547-552.
Dewey, K. G., D. A. Finley, and B. Lonnerdal. 1984. Breast milk volume and composition during late lactation (7-20 months). Journal of Pediatric Gastroenterology and Nutrition 3(5):713-720.
Dewey, K. G., M. J. Heinig, and L. A. Nommsen. 1993. Maternal weight-loss patterns during prolonged lactation. American Journal of Clinical Nutrition 58(2):162-166.
FAO (Food and Agriculture Organization of the United Nations). 2004. Human energy requirements: Report of a joint FAO/WHO/UNU expert consultation. https://www.fao.org/3/y5686e/y5686e00.htm (accessed November 11, 2022).
Fomon, S. J., F. Haschke, E. E. Ziegler, and S. E. Nelson. 1982. Body composition of reference children from birth to age 10 years. American Journal of Clinical Nutrition 35(5 Suppl):1169-1175.
Goldberg, G. R., A. M. Prentice, W. A. Coward, H. L. Davies, P. R. Murgatroyd, M. B. Sawyer, J. Ashford, and A. E. Black. 1991. Longitudinal assessment of the components of energy balance in well-nourished lactating women. American Journal of Clinical Nutrition 54(5):788-798.
Haschke, F. 1989. Body composition during adolescence. In Body composition measurements in infants and children: Report of the 98th Ross conferences on pediatric research. Columbus, OH: Ross Laboratories. Pp. 76-83.
Heinig, M. J., L. A. Nommsen, J. M. Peerson, B. Lonnerdal, and K. G. Dewey. 1993. Intake and growth of breast-fed and formula-fed infants in relation to the timing of introduction of complementary foods: The darling study. Davis area research on lactation, infant nutrition and growth. Acta Paediatrica 82(12):999-1006.
IOM (Institute of Medicine). 2002/2005. Dietary Reference Intakes for energy, carbohydrate, fiber, fat, fatty acids, cholesterol, protein, and amino acids. Washington, DC: The National Academies Press.
IOM and NRC (National Research Council). 2009. Weight gain during pregnancy: Reexamining the guidelines. Washington, DC: The National Academies Press.
Klein, P. D., W. P. James, W. W. Wong, C. S. Irving, P. R. Murgatroyd, M. Cabrera, H. M. Dallosso, E. R. Klein, and B. L. Nichols. 1984. Calorimetric validation of the doubly-labelled water method for determination of energy expenditure in man. Human Nutrition: Clinical Nutrition 38(2):95-106.
Lam, Y. Y., and E. Ravussin. 2016. Analysis of energy metabolism in humans: A review of methodologies. Molecular Metabolism 5(11):1057-1071.
Lederman, S. A., A. Paxton, S. B. Heymsfield, J. Wang, J. Thornton, and R. N. Pierson, Jr. 1997. Body fat and water changes during pregnancy in women with different body weight and weight gain. Obstetrics and Gynecology 90(4 Pt 1):483-488.
Little, R. J., and D. B. Rubin. 2019. Statistical analysis with missing data. Hoboken, NJ: John Wiley & Sons.
Manning-Dalton, C., and L. H. Allen. 1983. The effects of lactation on energy and protein consumption, postpartum weight change and body composition of well-nourished North American women. Nutrition Research 3(3):293-308.
Meek, J. Y., L. Noble, and the Section on Breastfeeding. 2022. Policy statement: Breastfeeding and the use of human milk. Pediatrics 150(1).
Melanson, E. L., T. Swibas, W. M. Kohrt, V. A. Catenacci, S. A. Creasy, G. Plasqui, L. Wouters, J. R. Speakman, and E. S. F. Berman. 2018. Validation of the doubly labeled water method using off-axis integrated cavity output spectroscopy and isotope ratio mass spectrometry. American Journal of Physiology: Endocrinology and Metabolism 314(2):E124-E130.
Mossavar-Rahmani, Y., P. A. Shaw, W. W. Wong, D. Sotres-Alvarez, M. D. Gellman, L. Van Horn, M. Stoutenberg, M. L. Daviglus, J. Wylie-Rosett, A. M. Siega-Riz, F. S. Ou, and R. L. Prentice. 2015. Applying recovery biomarkers to calibrate self-report measures of energy and protein in the Hispanic Community Health Study/Study of Latinos. American Journal of Epidemiology 181(12):996-1007.
Most, J., M. S. Amant, D. S. Hsia, A. D. Altazan, D. M. Thomas, L. A. Gilmore, P. M. Vallo, R. A. Beyl, E. Ravussin, and L. M. Redman. 2019. Evidence-based recommendations for energy intake in pregnant women with obesity. Journal of Clinical Investigation 129(11):4682-4690.
Myles, P. S., and J. Cui. 2007. Using the Bland-Altman method to measure agreement with repeated measures. British Journal of Anaesthesia 99(3):309-311.
Naismith, D. J., and C. D. Ritchie. 1975. The effect of breast-feeding and artificial feeding on body-weights, skinfold measurements and food intakes of forty-two primiparous women. Proceedings of the Nutrition Society 34(3):116A-117A.
NHLBI/NIDDK (National Heart, Lung, and Blood Institute/National Institute of Diabetes and Digestive and Kidney Diseases). 1998. Clinical guidelines on the identification, evaluation, and treatment of overweight and obesity in adults. The evidence report. NIH publication no. 98-4083. Bethesda, MD: NIDDK.
Pereira, L. C. R., S. A. Purcell, S. A. Elliott, L. J. McCargar, R. C. Bell, P. J. Robson, C. M. Prado, and T. Enrich Study. 2019. The use of whole body calorimetry to compare measured versus predicted energy expenditure in postpartum women. American Journal of Clinical Nutrition 109(3):554-565.
Ravussin, E., I. T. Harper, R. Rising, and C. Bogardus. 1991. Energy expenditure by doubly labeled water: Validation in lean and obese subjects. American Journal of Physiology 261(3 Pt 1):E402-E409.
Reilly, J. J., S. Ashworth, and J. C. K. Wells. 2005. Metabolisable energy consumption in the exclusively breast-fed infant aged 3–6 months from the developed world: A systematic review. British Journal of Nutrition 94(1):56-63.
Rubin, D. B. 1987. Multiple imputation for nonresponse in surveys. New York: John Wiley & Sons.
Sadurskis, A., N. Kabir, J. Wager, and E. Forsum. 1988. Energy metabolism, body composition, and milk production in healthy Swedish women during lactation. American Journal of Clinical Nutrition 48(1):44-49.
Schoeller, D. A., and P. Webb. 1984. Five-day comparison of the doubly labeled water method with respiratory gas exchange. American Journal of Clinical Nutrition 40(1):153-158.
Schoeller, D. A., E. Ravussin, Y. Schutz, K. J. Acheson, P. Baertschi, and E. Jéquier. 1986. Energy expenditure by doubly labeled water: Validation in humans and proposed calculation. American Journal of Physiology 250(5 Pt 2):R823-R830.
Schofield, W. N. 1985. Predicting basal metabolic rate, new standards and review of previous work. Human Nutrition: Clinical Nutrition 39(Suppl 1):5-41.
Schutz, Y., and E. Jequier. 1998. Resting energy expenditure, thermic effect of food, and total energy expenditure. In Handbook of obesity, edited by G. A. Bray, C. Bouchard, and W. P. T. James. New York: Marcel Dekker.
Seale, J. L., J. M. Conway, and J. J. Canary. 1993. Seven-day validation of doubly labeled water method using indirect room calorimetry. Journal of Applied Physiology (1985) 74(1):402-409.
Sohlstrom, A., and E. Forsum. 1995. Changes in adipose tissue volume and distribution during reproduction in Swedish women as assessed by magnetic resonance imaging. American Journal of Clinical Nutrition 61(2):287-295.
Sorlie, P. D., L. M. Aviles-Santa, S. Wassertheil-Smoller, R. C. Kaplan, M. L. Daviglus, A. L. Giachello, N. Schneiderman, L. Raij, G. Talavera, M. Allison, L. Lavange, L. E. Chambless, and G. Heiss. 2010. Design and implementation of the Hispanic Community Health Study/Study of Latinos. Annals of Epidemiology 20(8):629-641.
Speakman, J. R., Y. Yamada, H. Sagayama, E. S. F. Berman, P. N. Ainslie, L. F. Andersen, L. J. Anderson, L. Arab, I. Baddou, K. Bedu-Addo, E. E. Blaak, S. Blanc, A. G. Bonomi, C. V. C. Bouten, P. Bovet, M. S. Buchowski, N. F. Butte, S. Camps, G. L. Close, J. A. Cooper, S. A. Creasy, S. K. Das, R. Cooper, L. R. Dugas, C. B. Ebbeling, U. Ekelund, S. Entringer, T. Forrester, B. W. Fudge, A. H. Goris, M. Gurven, C. Hambly, A. El Hamdouchi, M. B. Hoos, S. Hu, N. Joonas, A. M. Joosen, P. Katzmarzyk, K. P. Kempen, M. Kimura, W. E. Kraus, R. F. Kushner, E. V. Lambert, W. R. Leonard, N. Lessan, D. S. Ludwig, C. K. Martin, A. C. Medin, E. P. Meijer, J. C. Morehen, J. P. Morton, M. L. Neuhouser, T. A. Nicklas, R. M. Ojiambo, K. H. Pietiläinen, Y. P. Pitsiladis, J. Plange-Rhule, G. Plasqui, R. L. Prentice, R. A. Rabinovich, S. B. Racette, D. A. Raichlen, E. Ravussin, R. M. Reynolds, S. B. Roberts, A. J. Schuit, A. M. Sjödin, E. Stice, S. S. Urlacher, G. Valenti, L. M. Van Etten, E. A. Van Mil, J. C. K. Wells, G. Wilson, B. M. Wood, J. Yanovski, T. Yoshida, X. Zhang, A. J. Murphy-Alford, C. U. Loechl, E. L. Melanson, A. H. Luke, H. Pontzer, J. Rood, D. A. Schoeller, K. R. Westerterp, and W. W. Wong. 2021. A standard calculation methodology for human doubly labeled water studies. Cell Reports Medicine 2(2):100203.
van Raaij, J. M., C. M. Schonk, S. H. Vermaat-Miedema, M. E. Peek, and J. G. Hautvast. 1991. Energy cost of lactation, and energy balances of well-nourished Dutch lactating women: Reappraisal of the extra energy requirements of lactation. American Journal of Clinical Nutrition 53(3):612-619.
Weir, J. B. 1949. New methods for calculating metabolic rate with special reference to protein metabolism. Journal of Physiology 109(1-2):1-9.
Westerterp, K. R. 2001. Limits to sustainable human metabolic rate. Journal of Experimental Biology 204(Pt 18):3183-3187.
Westerterp, K. R., F. Brouns, W. H. Saris, and F. ten Hoor. 1988. Comparison of doubly labeled water with respirometry at low- and high-activity levels. Journal of Applied Physiology (1985) 65(1):53-56.
WHO (World Health Organization). 1985. Energy and protein requirements. Report of a joint FAO/WHO/UNU expert consultation. World Health Organization Technical Report Series 724:1-206.
WHO. 1998. Obesity: Preventing and managing the global epidemic: Report of a WHO consultation on obesity, Geneva, 3-5 June 1997. Geneva: World Health Organization.
WHO. 2021. Infant and young child feeding. https://www.who.int/news-room/fact-sheets/detail/infant-and-young-child-feeding (accessed November 14, 2022).
WHO. 2022. Weight-for-length tables. https://www.who.int/tools/child-growth-standards/standards/weight-for-length-height (accessed November 28, 2022).
Wong, W. W., S. B. Roberts, S. B. Racette, S. K. Das, L. M. Redman, J. Rochon, M. V. Bhapkar, L. L. Clarke, and W. E. Kraus. 2014. The doubly labeled water method produces highly reproducible longitudinal results in nutrition studies. Journal of Nutrition 144(5):777-783.
Wosje, K. S., and H. J. Kalkwarf. 2004. Lactation, weaning, and calcium supplementation: Effects on body composition in postpartum women. American Journal of Clinical Nutrition 80(2):423-429.
Yin, P., and X. Fan. 2001. Estimating r 2 shrinkage in multiple regression: A comparison of different analytical methods. Journal of Experimental Education 69(2):203-224.
This page intentionally left blank.


