
6
Assessing Energy Intakes, Physical Activity, and Indicators of Overweight and Obesity
In this chapter, the committee discusses the intake assessment component of the DRI organizing framework described in Chapter 2, which involves an assessment of the current intakes and energy status among U.S. and Canadian life-stage groups and provides background information for Chapter 8 on evaluating the relationships between weight status and the risk of chronic diseases and other adverse health outcomes. In this context, weight gain that places an individual in the overweight or obese BMI category is indicative of long-term energy imbalance that is associated with increased risk for chronic disease. In approaching this chapter, the committee evaluated direct estimates of energy intakes and indicators of adiposity. The committee also evaluated methodological challenges involved in assessing both energy intake and physical activity expenditures. The inclusion of a chapter that focuses on intake and status assessments of the U.S. and Canadian populations is one of four key components of the DRI organizing framework that is now a routine component of the DRI process, as described in Chapter 2.
APPROACH TO ASSESSING ENERGY INTAKES AND PHYSICAL ACTIVITY EXPENDITURES
As part of its task, the committee considered methods used to estimate energy intakes and physical activity and to evaluate the prevalence of long-term energy intake imbalances. The committee began by discussing methodological challenges in estimating intakes and physical activity levels. To assess the status of energy intakes among U.S. and Canadian life--
stage groups, the committee used nationally representative population-based health surveys from the U.S. National Health and Nutrition Examination Survey (NHANES), the Canadian Health Measures Survey (CHMS), and the Canadian Community Health Survey (CCHS) to present data on self-reported energy intakes within the EER context as presented in Chapter 5, as well as relying upon indicators of long-term intake imbalances as measured by anthropometry and bone density scan (DXA) for body weight and adiposity. Data on physical activity behaviors for the United States and Canada from NHANES and CHMS were not provided directly to the committee and thus, prevalence on meeting guidelines or average activity levels were obtained from published articles. These population-based data provide background information for subsequent discussions in Chapter 8 on the public health risks associated with energy intake imbalances among population groups.
METHODS FOR ASSESSING ENERGY INTAKE
Self-Reported Dietary Assessment
Accurate dietary assessment methods are needed to identify not only intake deviations from EERs, but also to relate energy intakes to health outcomes in research contexts. These data can then be used to develop public policies and recommendations aimed to reduce the risk of chronic disease. Clinicians and nutrition professionals also use such data to plan menus at the individual and group level. Various means of direct observation exist, but they are not routinely used in research settings. In free-living populations most traditional dietary assessment methods rely on proxy or self-report. Proxy report is mainly used for populations that may depend on caregivers (e.g., young children) or whose literacy level does not meet the requirement for the method of assessment. Self-report is generally regarded as more accurate than proxy reporting in the age range of 8 to 10 years, depending on the memory and attention of the child and how often foods are consumed away from their proxy reporter (Livingstone and Robson, 2000; Livingstone et al., 2004).
Several detailed publications exist to describe the background on current dietary assessment methods (Bailey, 2021; McClung et al., 2018; Thompson et al., 2015). While methods are evolving rapidly in step with technological advances in measuring dietary intakes, advances in image-based and technology-driven dietary assessment have not yet been shown to improve the accuracy of measuring foods and beverages (Ho et al., 2020), or to be equivalent to nontechnological methods (Gemming et al., 2015; Ho et al., 2020). However, another systematic review found that image-assisted methods reduce energy underreporting (Boushey et al., 2017).
Methods of self-reported dietary assessment to estimate energy intakes include 24-hour recall (24HR), food records (FR), and food-frequency questionnaires (FFQ). These are available for administration by phone, in person, or through mobile-, image-, or web-based platforms. In general, the goal of self-report dietary assessment is to provide an estimate of usual intakes (i.e., long-term average or habitual diet) (Kirkpatrick et al., 2018). The 24HR and FR are short-term methods, and FFQs generally tend to capture longer-term intakes. An FR is ideally collected by weighing all foods and beverages consumed, but it is subject to reactivity–—that is, when recording food intake, individuals tend to change their usual dietary patterns. A 24HR is currently the least-biased estimator of energy, but because of variability in what people eat, a large number of 24HRs on random days averaged across days of the week and seasons of the year would be needed to provide true estimates of an individual’s usual intakes, which is generally impractical (Bailey, 2021; Basiotis et al., 1987; Souverein et al., 2011).
However, given two or more 24HRs on individuals, statistical methods have been developed to provide estimates of the distribution of usual intakes in a group. Although FFQs directly query long-term intake, they are prone to systematic bias. A complete discussion on measurement errors, including systematic bias and methods to improve estimating usual dietary exposures follows. Given that the national surveys examined for this report rely exclusively on 24HR to estimate energy needs, this chapter will primarily focus on the 24HR. More detail on the collection procedures from the 24HRs follows.
Measurement Error with Dietary Assessment
All methods of dietary assessment have measurement error, which is defined as the deviation of an instrument or measurement tool from “truth.” Truth in this context is the energy required to maintain body weight and function. Any deviation from truth, then, is considered measurement error. Measurement error is broadly classified into systematic and random, and an error in self-reported dietary assessment is often referred to as misreporting. Understanding of the types and structure of measurement error with regard to dietary energy comes from studies that use doubly labeled water (DLW).
DLW represents a recovery biomarker that approximates energy expenditure; when weight is stable, in theory, energy intake should be similar to that of energy expenditure (Speakman, 1998). It has been estimated that DLW is within 1 to 2 percent of actual expenditure overall (Schoeller and van Santen, 1982), but it may vary during periods of growth and life stages with increased energy needs (e.g., lactation or pregnancy). Chapter 5 provides an in-depth description of the DLW method. DLW
validation studies have consistently determined that all self-reported dietary assessment methods are subject to both random error and systematic bias but that 24HRs has less systematic error for reporting energy than FFQs. In addition, statistical methods can be used to adjust for random error.
Random error in regard to energy intake often manifests as within-person variability. This is the difference, for example, of one 24HR when compared with the average of multiple 24HRs for a given individual. Random error decreases precision of an instrument, which can lower statistical power to detect relationships. While random error does not affect the group mean, it does result in a wider estimated distribution of energy intake with wider tails (Gibson, 1990). Collecting a large number of 24HRs is impractical, but several statistical modeling techniques have been developed to isolate the random error and estimate a distribution of usual intake using as few as two 24HRs per person.
If multiple recall days are not available for all members of a group, a representative subset from the group can be used, or external—but representative—data can also be used. A number of approaches have been developed to estimate the distribution of usual intakes when only a small number of 24HRs are available per individual (Dodd et al., 2006; NRC, 1986; Nusser et al., 1996; Subar et al., 2006; Tooze et al., 2006, 2010). These usual intake methods vary; the data reported herein come from usual intake modeling of national survey data of 24HRs using one of these methods, the National Cancer Institute (NCI) method (Tooze et al., 2006, 2010) (described below).
Systematic error is defined as a deviation from the truth in a specific direction. It causes a change in both the mean and the distribution of a data set. In terms of energy intakes, systematic error often commonly manifests as energy underreporting in adults; but overreporting is also an issue, particularly in younger children. Multiple types of measurement error have been described with self-reported dietary data, including social desirability, intrusions, and omissions. Individuals vary in their memory and ability to estimate portion size as well as their perceived need for social desirability, this is a type of person-specific bias that may relate to certain factors, like age, but is not well characterized and is not predictable (Dwyer et al., 1989).
DATA ON VALIDITY FROM STUDIES WITH DLW FOR ENERGY INTAKE ACROSS THE LIFE COURSE
Chapter 3 provides details on the committee’s methodological approach to identify and review relevant scientific literature, as no systematic reviews were provided a priori. The committee’s literature search identified eight systematic reviews of measurement error in dietary assessment (See Appendix J, Table J-14). One study was excluded because it was not a systematic review and did not include 24HR data. Other systematic reviews were not
relevant to the committee’s task because the focus was not on 24HR data collected in a manner similar to that of NHANES and CCHS-Nutrition used in this report. One systematic review assessed the validity of food records in athletes and found that energy underreporting across 11 pooled studies was, on average, 19 percent below what was estimated from DLW (Capling et al., 2017). One systematic review examined the ability and validity of children to recall specific meal occasions only (Tugault-Lafleur et al., 2017).
One systematic review of image-assisted methods (i.e., use of a handheld [n = 10] or wearable camera [n = 3]) of dietary assessment among adults found that these methods as a primary assessment tool tended to underestimate energy intake and that image-assisted 24HR recalls tended to overestimate energy intake (Gemming et al., 2015). The systematic review determined that future work would need to be conducted in different age groups than were examined (ranging from 18 to 70 years). A similar systematic review of image-based dietary assessments (n = 13) also confirmed that these tools are not inferior to more traditional methods, but similarly result in substantial energy underreporting (Ho et al., 2020). One systematic review specifically focused on adults with a body mass index (BMI) greater than or equal to 30 found significant underreporting of food intake; however, only one study focused on comparing energy intake from 24HR relative to energy expenditure determined using DLW, and it was conducted outside of North America (Wehling and Lusher, 2019).
Another systematic review of the validity of dietary assessment methods compared to DLW specifically in children did not include any studies with traditional 24HR methods but found that among children and adolescents, the accuracy of energy reporting was not related to the sex, age, or weight status of the child (Burrows et al., 2020), which differs from previous reports (Burrows et al., 2010). Given the limited data on children in these age groups, Burrows et al. (2020) noted that more data are needed on children from diverse ethnic and socioeconomic backgrounds given the limited scope of the available data.
A systematic review of the validity of dietary assessment methods compared to DLW specifically in children concluded that 24HRs were valid for energy intake reporting at the group but not at the individual level and that the accuracy of energy reporting was not related to the sex, age, or weight status of the child (Burrows et al., 2020), which differs from previous reports (Burrows et al., 2010).
A systematic review of studies in adults included seven studies with DLW and 24HR, evaluated by sex. This review found that energy underreporting may vary based on participant characteristics; for example, all seven studies suggest that women are more likely to underreport energy intake but only two suggested there was a differential reporting by body weight status (i.e., individuals with overweight and obesity had more underreporting) (Burrows et al., 2019). The range of underreporting on
the 24HR was 8 to 30 percent. Overall, there were 59 studies, the majority of which used FFQs (n = 21) or FR (n = 36) as the dietary assessment tool and DLW, and five studies used a diet history method (Burrows et al., 2019). Energy underreporting was 4.6 to 42 percent using FFQ data, and this varied by the type of questionnaire that was used. The FR estimates range from 11 to 41 percent energy underreporting and estimates for diet histories ranged from 1.3 to 47 percent. The authors concluded that the 24HR is the method with the least amount of variation in estimates and the least amount of underreporting. Energy underreporting remains pervasive, however, and is an important source of bias in self-reported dietary assessment (Burrows et al., 2019). More data are also needed on children from diverse ethnic and socioeconomic backgrounds.
METHODS FOR ASSESSING PHYSICAL ACTIVITY
Physical activity can be viewed as a continuum of trade-offs to consider when selecting a physical behavior assessment method based on validity, participant and researcher burden, cost, practicality, and feasibility (Figure 6-1).
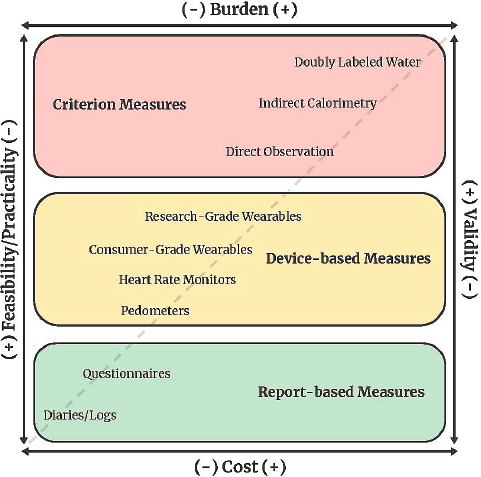
SOURCE: Reprinted from Crouter S. E., Hibbing P. R., and S. R. LaMunion. In Press. Physical activity assessment. In: Raynor HA, Gigliotti L, eds. Health Professional’s Guide to Obesity and Weight Management. Chicago, IL: Academy of Nutrition and Dietetics, with permission from The Academy of Nutrition and Dietetics.
Doubly Labeled Water and Indirect Calorimetry
DLW and indirect calorimetry are considered the primary methods for measuring energy expenditure (Dowd et al., 2018; Strath et al., 2013; Sylvia et al., 2014). DLW is ideal for measuring total daily energy expenditure in free-living individuals because it has low subject burden and does not interfere with daily activities. It lacks temporal resolution for examination of shorter time periods (e.g., hours), however, and is costly (Sylvia et al., 2014). Indirect calorimetry has multiple applications (e.g., whole-room metabolic chamber, metabolic systems with a face mask).
Whole-room metabolic chambers can last for a few hours up to several days and provide temporal time resolution to examine different components of energy expenditure (e.g., sleep, activity energy expenditure, thermic effect of feeding). Portable indirect calorimeters allow for a broader range of activities to be captured and can be used in free-living applications (Macfarlane, 2017; Overstreet et al., 2017; Schoffelen et al., 2019). Use of indirect calorimetry is typically found in high-level research and clinical spaces and requires a multidisciplinary team to operate.
To more practically assess free-living physical activity, report-based methods (e.g., self-report questionnaires) and device-based methods (e.g., pedometers, accelerometer-based devices) are typically used. These methods are validated against DLW and indirect calorimetry. In general, device-based methods provide better estimates of total energy expenditure compared to report-based methods.
Self-Report Estimates of Physical Activity
Several systematic reviews have explored comparisons of self-report estimates of total energy expenditure to estimates via DLW. Adamo et al. (2009) found that self-report measures (activity diaries or logs, questionnaires, surveys, and recall interviews) in general overestimated physical activity or energy expenditure (compared to DLW) in both boys and girls by an average of 22 percent (range, 25 to 78 percent). Helmerhorst et al. (2012) also found in youth less than 18 years of age that self-report measures and DLW had Spearman r that ranged from 0.49 to 0.65 for total energy expenditure, with a mean difference of 2,800 kJ/day.
In adults, Dowd et al. (2018) found that compared to DLW, mean percent differences for self-reported physical activity measures from the previous past 12 months ranged from –77.6 to 112.5 percent. Specifically, reports of physical activity from diaries ranged from 12.9 to 20.8 percent. Self-reported physical activity energy expenditure recalled from the previous 7 days ranged from –59.5 to 62.1 percent and self-reported physical activity energy expenditure for the previous month ranged from –13.3 to 11.4 percent.
Helmerhorst et al. (2012) found that, in adults, TEE from DLW compared to self-report measures had a Spearman correlation that ranged from 0.15 to 0.47 (Pearson correlation ranged from 0.12 to 0.69) and mean differences ranged from 3,451.9 to 7,455 kJ/day. In older adults (older than 65 years), Helmerhorst et al. found that TEE for DLW compared to self-report measures had a Spearman correlation that ranged from 0.10 to 0.64 (Pearson correlation ranged from 0.11 to 0.65) and mean differences ranged from 435 to 3,146 kJ/day for men and 37 to 2,037 kJ/day for women.
Device-Based Estimates of Physical Activity
Several systematic reviews have explored how device-based estimates from wearable physical activity monitors compare to DLW and indirect calorimetry. Dowd et al. (2018) compared activity monitor energy expenditure to DLW, indirect calorimetry, and whole-room calorimetry. In this review, activity monitor estimates compared to DLW had a mean percent difference ranging from 56.6 to 96.8 percent. However, a trend for activity monitor–determined energy expenditure to underestimate the criterion measure of energy expenditure by DLW was found. For indirect calorimetry and whole-room calorimetry, activity monitor estimates of energy expenditure mean percent differences ranged from 41.4 to 115.7 percent (indirect calorimetry) and –16.7 to –15.7 percent (whole-room calorimetry).
O’Driscoll et al. (2020) examined energy expenditure estimates of wrist and arm devices (40 different devices, 33 worn on the wrist) compared to DLW, indirect calorimetry, and room calorimetry. Overall, the devices underestimated energy expenditure (effect size: –0.23, 95% CI, –0.44 to –0.03; n = 104; p = .03) and showed significant heterogeneity between devices (I2 = 92.18%; p ≤ .001). For those devices that were compared only to DLW (10 different devices), the pooled effect for TEE showed that energy expenditure was significantly underestimated (effect size: –0.68, 95% CI, –1.15 to –0.21; n = 16; p = .005), and significant heterogeneity was observed between devices (I2 = 92.71%; p < .01).
Fewer data are available for pedometers and counting. Dowd et al. (2018) compared pedometer-determined energy expenditure to DLW. In free-living studies, pedometers were worn for 2 and 8 days and had mean percent errors ranging from –62.3 percent to –0.8 percent. A systematic review by Tudor-Locke et al. (2002) examined pedometer values compared to DLW. A single study comparing pedometer outputs with energy expenditure derived from DLW reported a significant correlation of r = 0.61 in a patient population; however, two other studies reported no significant correlations in different populations (no r values reported). Tudor-Locke et al. (2002) also reported that pedometers generally correlated with indirect calorimetry (r = 0.49 to 0.81).
DESCRIPTION OF U.S. AND CANADIAN NATIONAL SURVEYS
National surveillance data in the United States and Canada use the 24HR method to assess energy intakes. For this report, data on U.S. energy intakes and various body composition measures were estimated using the 2015–2018 NHANES. Data from Canada were examined from two sources: the 2015 CCHS and the CHMS, cycles 3 to 6 (January 2012 to December 2019). Data on energy intakes for the populations were estimated from NHANES and CCHS, whereas anthropometry data were examined using NHANES and CHMS. NHANES operates on a continuous basis in 2-year cycles. CHMS also collects data in 2-year cycles, whereas CCHS has periodic data collection. The survey years for three data sets were chosen for the report because of the temporal proximity between the two countries. Complete details on how the surveys operate are detailed online for CCHS,1 CHMS,2 and NHANES3 and described briefly herein.
National Health and Nutrition Examination Survey (NHANES)
NHANES is a nationally representative survey designed to assess the health and nutritional status of adults and children in the United States. Through interviews and physical examinations, the survey collects demographic, socioeconomic, dietary, and health-related information, as well as medical, dental, and physiological measurements and laboratory tests. NHANES collects information on demographic and lifestyle factors of the household during an in-home interview, anthropometric and dietary data during a visit to a mobile examination center, and additional dietary data during the follow-up telephone interview. Details of the interview process are in Appendix K.
Canadian Community Health Survey
The CCHS is a joint effort of Health Canada, the Public Health Agency of Canada, Statistics Canada, and the Canadian Institute for Health Information. Since 2000, this annual survey has collected population-level data on health determinants, health status, and health system use. In addition to the annual survey, occasional survey modules (the most recent in 2015) have focused on food- and nutrition-related data such as nutrient intakes, food insecurity, and anthropometric measures.
___________________
1https://www.canada.ca/en/health-canada/services/food-nutrition/food-nutrition-surveillance/health-nutrition-surveys/canadian-community-health-survey-cchs.html (accessed February 8, 2023).
2https://www23.statcan.gc.ca/imdb/p2SV.pl?Function=getSurvey&SDDS=5071&lang=en&db=imdb&adm=8&dis=2 (accessed February 8, 2023).
3https://www.cdc.gov/nchs/nhanes/about_nhanes.htm (accessed February 8, 2023).
The 2015 CCHS-Nutrition is a nationally representative cross-sectional survey of the civilian Canadian population (aged 1 year or more; residing in the 10 provinces) that uses a complex, multistage cluster sampling design.4 This was the first cycle since 2004 to comprehensively collect dietary data. Results are available for 13 geographic areas: Canada excluding the territories, the 10 provinces, the Atlantic Region, and the Prairie Region. Data from the four Atlantic Provinces and the three Prairie Provinces were combined into the Atlantic Region and the Prairie Region, respectively. Details of the interview process are in Appendix K.
Canadian Health Measures Survey
Statistics Canada, in partnership with Health Canada and the Public Health Agency of Canada, has conducted the CHMS every 2 years since 2007. This ongoing, nationally representative survey collects information at 16 randomly selected sites across Canada on nutritional status, fitness, chronic diseases, environmental exposures, and other health measures. Physical measurements such as height, weight, and physical fitness are also collected. The CHMS uses a complex, multistage cluster sampling design and is designed to collect health-related information of the general public. Active members of the military are excluded, as are residents of Indian reserves, Crown lands, and remote regions.
Each survey cycle includes approximately 5,000 Canadians and consists of a detailed health questionnaire administered in the home by a trained interviewer (using the Computer-Assisted Personal Interviewing system), in which participants are asked to provide detailed information on sociodemographic characteristics, dietary supplement use, chronic and infectious disease, nutrition, and environmental factors, as well as a clinic visit in the mobile examination center approximately 1 day to 6 weeks after the in-home interview. Written consent is obtained for all participants and/or their proxies for all procedures carried out by CHMS. The Health Canada Research Ethics Board approves the CHMS protocol. Details of the interview process are in Appendix K.
COMPARISON OF ENERGY INTAKE AND EXPENDITURE AMONG U.S. AND CANADIAN POPULATIONS
Usual Energy Intake Data
The National Cancer Institute (NCI) method (Tooze et al., 2006, 2010) was used to estimate usual energy intakes in both U.S. and Canadian
___________________
4https://www23.statcan.gc.ca/imdb/p2SV.pl?Function=getSurvey&SDDS=5049 (accessed February 8, 2023).
national surveys. The NCI method macros are publicly available. In both countries, these models excluded from the age group estimates pregnant and lactating women as well as infants and young children receiving breast milk (and presents those groups separately) and included day of the week (i.e., weekday and weekend day) and sequence of the recall as covariates. Estimates of usual energy intakes by sex and age are presented in Tables 6-1 and 6-2. Estimates that are considered statistically unreliable, based on the relative standard error, are not presented. To facilitate comparisons between the two countries, Z statistics were computed and significance was assumed at an alpha of 0.05. The complete data tables on dietary intake prepared for the committee by the Centers for Disease Control and Prevention (CDC) and Statistics Canada are provided in supplemental Appendix X.5 Examples of applying the EER equations to exemplar age/sex and life-stage groups are provided in Chapter 7.
Mean usual energy intakes were compared by age and sex groups between the United States and Canada for those ages 4 years and older. For those younger than 30 years, the only significant difference in energy intakes between countries existed for 4-to-8-year-old boys. Among adults, for both men and women, higher usual mean energy intakes were reported among Americans when compared with Canadians. Among children when mean energy intake was compared between age/sex groups by country, boys had higher usual mean energy intakes than girls. A similar significant trend was observed within country and age group by sex among adults. In both countries and across age groups, reported energy intakes were well below the EER.
INDICATORS OF BODY WEIGHT AND ADIPOSITY
Given that self-reported intake data do not accurately reflect recent energy intakes, an alternative approach for estimating long-term energy intakes is to measure body weight and body composition. Higher BMIs and increased adiposity are of public health concern because of their associations with adverse health outcomes (CDC, 2022; Statistics Canada, 2019; WHO, 2021). Nationally representative data on various indicators of body weight and adiposity for the U.S. and Canadian populations from the 2015–2018 NHANES and the 2012–2019 CHMS, respectively, could be used to evaluate energy intake imbalances for EER life-stage groups in the United States and Canada.
___________________
5 Supplemental appendixes are available at https://nap.nationalacademies.org/catalog/26818.
TABLE 6-1 Mean and Percentiles for Usual Daily Intake of Energy (kcal), United States
| Sex | Age or Life Stage | N | Mean | SEM | 5th %tile | SE | 10th %tile | SE | 25th %tile | SE | 50th %tile | SE | 75th %tile | SE | 90th %tile | SE | 95th %tile | SE |
|---|---|---|---|---|---|---|---|---|---|---|---|---|---|---|---|---|---|---|
| Male | 0–6 mo | 182 | 683 | 23 | 377 | 36 | 435 | 32 | 540 | 25 | 666 | 23 | 817 | 31 | 949 | 42 | 1,036 | 51 |
| Female | 0–6 mo | 187 | ** | ** | ** | ** | ** | ** | ** | ** | ||||||||
| Male | 7–12 mo | 141 | ** | ** | ** | ** | ** | ** | 1,126* | 53 | 1,214* | 56 | ||||||
| Female | 7–12 mo | 137 | ** | ** | ** | ** | ** | ** | ** | ** | ||||||||
| Male | 2–3 y | 585 | 1,441 | 44 | 1,006 | 84 | 1,088 | 76 | 1,237 | 65 | 1,424 | 52 | 1,624 | 37 | 1,814 | 45 | 1,946 | 58 |
| Female | 2–3 y | 531 | 1,355 | 61 | 938 | 96 | 1,014 | 87 | 1,165 | 84 | 1,337 | 68 | 1,524 | 45 | 1,716 | 38 | 1,838 | 43 |
| Male | 4–8 y | 720 | 1,853 | 45 | 1,329 | 96 | 1,430 | 90 | 1,613 | 70 | 1,830 | 50 | 2,069 | 34 | 2,304 | 47 | 2,446 | 71 |
| Female | 4–8 y | 731 | 1,650 | 46 | 1,180 | 107 | 1,269 | 98 | 1,438 | 86 | 1,626 | 52 | 1,840 | 26 | 2,054 | 37 | 2,197 | 54 |
| Male | 9–13 y | 740 | 2,043 | 54 | 1,294 | 89 | 1,432 | 82 | 1,691 | 69 | 2,004 | 57 | 2,352 | 53 | 2,696 | 60 | 2,933 | 82 |
| Female | 9–13 y | 770 | 1,895 | 63 | 1,194 | 97 | 1,317 | 95 | 1,558 | 85 | 1,859 | 63 | 2,189 | 56 | 2,518 | 54 | 2,716 | 66 |
| Male | 14–18 y | 715 | 2,344 | 127 | 1,527 | 51 | 1,683 | 63 | 1,956 | 84 | 2,300 | 118 | 2,689 | 164 | 3,066 | 213 | 3,302* | 247 |
| Female | 14–18 y | 706 | 1,793 | 54 | 1,116 | 44 | 1,239 | 40 | 1,469 | 38 | 1,758 | 51 | 2,080 | 80 | 2,396 | 104 | 2,603 | 136 |
| Male | 19–30 y | 919 | 2,463 | 47 | 1,528 | 95 | 1,695 | 84 | 2,017 | 74 | 2,414 | 51 | 2,854 | 43 | 3,293 | 61 | 3,572 | 80 |
| Female | 19–30 y | 904 | 1,823 | 74 | 1,130 | 31 | 1,272 | 29 | 1,515 | 38 | 1,797 | 72 | 2,111 | 103 | 2,404 | 147 | 2,580 | 174 |
| Male | 31–50 y | 1,469 | 2,602 | 77 | 1,630 | 132 | 1,812 | 122 | 2,140 | 104 | 2,548 | 81 | 3,006 | 58 | 3,469 | 59 | 3,754 | 64 |
| Female | 31–50 y | 1,564 | 1,864 | 21 | 1,171 | 64 | 1,305 | 57 | 1,551 | 42 | 1,836 | 21 | 2,150 | 35 | 2,452 | 70 | 2,641 | 96 |
| Male | 51–70 y | 1,700 | 2,379 | 108 | 1,461 | 36 | 1,628 | 42 | 1,938 | 69 | 2,330 | 104 | 2,765 | 150 | 3,195 | 190 | 3,478 | 209 |
| Female | 51–70 y | 1,745 | 1,750 | 73 | 1,081 | 26 | 1,212 | 24 | 1,444 | 36 | 1,724 | 68 | 2,028 | 107 | 2,319 | 148 | 2,510 | 162 |
| Male | > 70 y | 762 | 2,206 | 32 | 1,338 | 82 | 1,505 | 81 | 1,799 | 59 | 2,162 | 32 | 2,562 | 51 | 2,965 | 90 | 3,226 | 116 |
| Female | > 70 y | 750 | 1,621 | 79 | 973 | 31 | 1,104 | 32 | 1,331 | 42 | 1,598 | 76 | 1,883 | 118 | 2,170 | 153 | 2,347 | 171 |
| Male | 19+ | 4,850 | 2,454 | 19 | 1,497 | 63 | 1,674 | 54 | 1,999 | 36 | 2,403 | 19 | 2,853 | 41 | 3,301 | 72 | 3,594 | 83 |
| Female | 19+ | 4,963 | 1,783 | 48 | 1,096 | 30 | 1,230 | 20 | 1,469 | 20 | 1,758 | 42 | 2,068 | 78 | 2,367 | 116 | 2,555 | 137 |
| Female | Lactating | 78 | ** | ** | ** | ** | ** | ** | ** | ** | ||||||||
| Female | Pregnant | 111 | ** | ** | ** | ** | ** | ** | ** | ** | ||||||||
| Female | Pregnant or Lactating | 189 | ** | ** | ** | ** | ** | ** | ** | ** |
NOTES: kcal = kilocalorie; mo = months; %ile = percentile; SE = standard error; SEM = standard error of the mean; y = years. Includes participants with reliable 24-hour dietary recall on day 1 and breastfeeding children with dietary recall status = reported consuming breast milk and have dietary data; estimates other than for pregnant and lactating women adjusted for age, day of the week, and weekend. Selected percentiles are provided in this table, see the Supplemental Appendix Table X-1 for the complete set of percentiles. The expanded set of related tables is also available in Supplemental Appendix X.
* Estimate has a relative standard error greater than 30% but less than 40% and should be used with caution because it does not meet National Center for Health Statistics (NCHS) standards of reliability or precision.
** Estimate has a relative standard error greater than 40% and does not meet NCHS standards of reliability or precision.
SOURCE: National Health and Nutrition Examination Survey (NHANES), 2015–2018.
TABLE 6-2 Total Energy Intake (kcal/d): Usual Intake from Food, Canada, 2015
| Sex | Age or Life Stage | n | Mean | SEM | 5th %tile | SE | 10th %tile | SE | 25th %tile | SE | 50th %tile | SE | 75th %tile | SE | 90th %tile | SE | 95th %tile | SE |
|---|---|---|---|---|---|---|---|---|---|---|---|---|---|---|---|---|---|---|
| Male | 1–3 y | 665 | 1,367 | 25 | 858 | 148* | 954 | 120 | 1,134 | 70 | 1,347 | 26 | 1,578 | 67 | 1,807 | 132 | 1,946 | 172 |
| Female | 1–3 y | 623 | 1,261 | 28 | 766 | 150* | 865 | 121 | 1,038 | 73 | 1,244 | 30 | 1,464 | 61 | 1,675 | 120 | 1,813 | 160 |
| Male | 4–8 y | 590 | 1,739 | 27 | 1,310 | 89 | 1,396 | 75 | 1,546 | 51 | 1,723 | 29 | 1,918 | 39 | 2,097 | 72 | 2,210 | 96 |
| Female | 4–8 y | 609 | 1,602 | 30 | 1,201 | 81 | 1,283 | 68 | 1,418 | 47 | 1,590 | 30 | 1,769 | 44 | 1,944 | 76 | 2,048 | 99 |
| Male | 9–13 y | 1,023 | 2,057 | 34 | 1,340 | 62 | 1,477 | 55 | 1,718 | 44 | 2,014 | 35 | 2,355 | 41 | 2,691 | 61 | 2,908 | 78 |
| Female | 9–13 y | 939 | 1,839 | 31 | 1,246 | 46 | 1,357 | 42 | 1,560 | 35 | 1,810 | 32 | 2,084 | 40 | 2,357 | 54 | 2,538 | 66 |
| Male | 14–18 y | 900 | 2,483 | 51 | 1,527 | 63 | 1,701 | 58 | 2,026 | 52 | 2,422 | 49 | 2,878 | 65 | 3,337 | 98 | 3,654 | 126 |
| Female | 14–18 y | 986 | 1,819 | 39 | 1,083 | 60 | 1,222 | 53 | 1,477 | 44 | 1,785 | 39 | 2,122 | 50 | 2,461 | 73 | 2,678 | 91 |
| Male | 19–30 y | 857 | 2,409 | 71 | 1,507 | 109 | 1,677 | 97 | 1,984 | 78 | 2,367 | 70 | 2,783 | 95 | 3,199 | 139 | 3,472 | 173 |
| Female | 19–30 y | 872 | 1,679 | 45 | 982 | 47 | 1,105 | 45 | 1,336 | 43 | 1,636 | 44 | 1,974 | 55 | 2,306 | 72 | 2,526 | 86 |
| Male | 31–50 y | 2,005 | 2,226 | 34 | 1,313 | 132 | 1,482 | 108 | 1,790 | 67 | 2,177 | 35 | 2,605 | 62 | 3,035 | 122 | 3,314 | 165 |
| Female | 31–50 y | 2,207 | 1,638 | 26 | 1,122 | 91 | 1,221 | 77 | 1,400 | 51 | 1,616 | 28 | 1,852 | 44 | 2,084 | 83 | 2,229 | 111 |
| Male | 51–70 y | 2,151 | 2,070 | 37 | 1,251 | 89 | 1,404 | 75 | 1,686 | 51 | 2,028 | 37 | 2,408 | 56 | 2,783 | 92 | 3,031 | 118 |
| Female | 51–70 y | 2,314 | 1,577 | 21 | 980 | 167* | 1,092 | 135 | 1,297 | 76 | 1,552 | 22 | 1,826 | 59 | 2,093 | 132 | 2,264 | 183 |
| Male | 71 y and over | 1,180 | 1,806 | 27 | 1,076 | 38 | 1,220 | 34 | 1,471 | 29 | 1,775 | 28 | 2,107 | 33 | 2,431 | 45 | 2,635 | 55 |
| Female | 71 y and over | 1,448 | 1,418 | 24 | 876 | 27 | 978 | 25 | 1,162 | 23 | 1,392 | 23 | 1,643 | 31 | 1,892 | 41 | 2,048 | 50 |
| Female | Pregnant | 114 | 1,947 | 77 | 1,344 | 192 | 1,462 | 163 | 1,673 | 115 | 1,918 | 80 | 2,194 | 106 | 2,451 | 172 | 2,649 | 226 |
| Female | Lactating | 187 | 1,927 | 64 | 1,313 | 188 | 1,434 | 158 | 1,657 | 107 | 1,916 | 66 | 2,180 | 96 | 2,430 | 166 | 2,587 | 215 |
| Female | Pregnant or lactating | 301 | 1,935 | 55 | 1,327 | 200 | 1,446 | 167 | 1,663 | 108 | 1,917 | 58 | 2,186 | 90 | 2,438 | 167 | 2,611 | 226 |
| Male | 19 y and over | 6,193 | 2,162 | 23 | 1,242 | 30 | 1,409 | 28 | 1,720 | 24 | 2,110 | 23 | 2,545 | 29 | 2,983 | 41 | 3,260 | 51 |
| Female | 19 y and over | 6,841 | 1,591 | 15 | 980 | 27 | 1,094 | 24 | 1,303 | 19 | 1,562 | 15 | 1,847 | 19 | 2,129 | 30 | 2,306 | 38 |
| Both sexes | 19 y and over | 13,034 | 1,879 | 14 | 1,035 | 17 | 1,182 | 16 | 1,461 | 14 | 1,821 | 14 | 2,233 | 18 | 2,653 | 26 | 2,927 | 32 |
NOTES: d = day; kcal = kilocalorie; SE = standard error; SEM = standard error of the mean; y = years. Excluded from the data set were respondents with null intakes (zero total intake from food) or invalid intakes, breastfed children and pregnant or breastfeeding women. Selected percentiles are provided in this table, see the Supplemental Appendix Table X-8 for the complete set of percentiles. The expanded set of related tables is also available in Supplemental Appendix X.
* Data with a coefficient of variation (CV) from 16.6% to 33.3%; interpret with caution.
SOURCES: Summary data table of estimates of usual intakes for energy, nutrients and other dietary components from food, using data collected from Canadians in the 2015 Canadian Community Health Survey (CCHS) - Nutrition. Health Canada (2019). Usual Intakes from Food for Energy, Nutrients and Other Dietary Components (2004 and 2015 CCHS-Nutrition) derived from Statistics Canada’s 2004 and 2015 Canadian Community Health Survey, Nutrition, Share file. Ottawa. https://open.canada.ca/data/en/dataset/31599960-2c1e-4d90-a9d9-979ad0e1abb4. Statistics Canada, Canadian Community Health Survey (CCHS) - Nutrition 2015 Share File.
Heights and Weights of U.S. and Canadian Populations
Measures of height and weight are values used in equations to estimate EERs and to calculate BMI. The heights and weights for U.S. and Canadian life-stage groups are shown in Tables 6-3 and 6-4. (See Supplemental Appendix Y for weight and height distributions across all age/sex groups and among race/ethnic groups.) Canadian boys 9 to 13 and 14 to 18 were taller than their U.S. counterparts, with differences ranging from 1.4 to 2.0 cm (0.5 to 0.8 in.) for these two groups. Similarly, Canadian girls were taller than their U.S. counterparts except for those 9 to 13 years, with differences ranging from 1.4 to 1.9 cm (0.5 to 0.7 in.). Conversely, Canadian boys aged 4 to 8 and 9 to 13 weighed less than U.S. boys, with differences ranging from 1.2 to 2.5 kg (2.6 to 5.5 lb). Canadian girls 9 to 18 years of age weighed less than U.S. girls, with differences ranging from 3.0 to 4.4 kg (6.6 to 9.7 lb).
For adults, Canadian men 19 years and older were taller than their U.S. counterparts—175.3 versus 176.0 cm, a difference of approximately 0.3 inches. Similarly, Canadian women 19 years and older were taller than their U.S. counterparts by 1 cm (0.4 in.). U.S. men and women 19 years and older weighed more than their Canadian counterparts, with a difference of 4.5 kg (9.9 lb) for men and 5.9 kg (13 lb) for women.
TABLE 6-3 Mean Heights and Weights, U.S. and Canadian Children
| Age (years) | Height (cm) Mean (SE) |
Weight (kg) Mean (SE) |
||
|---|---|---|---|---|
| United States | Canada | United States | Canada | |
| Males | ||||
| 3 | 99.1 (0.4) | 100.1 (0.4) | 16.6 (0.4) | 16.2 (0.2) |
| 4–8 | 119.9 (0.5) | 120.2 (0.4) | 25.0 (0.4) | 23.8 (0.3)* |
| 9–13 | 149.0 (0.5) | 150.4 (0.4)* | 46.7 (0.6) | 44.2 (0.4)* |
| 14–18 | 172.9 (0.3) | 174.9 (0.4)* | 72.1 (1.0) | 72.7 (1.5) |
| Females | ||||
| 3 | 97.5 (0.4) | 99.4 (0.4)* | 15.4 (0.2) | 16.0 (0.2)* |
| 4–8 | 117.5 (0.4) | 118.9 (0.4)* | 24.1 (0.3) | 23.5 (0.2) |
| 9–13 | 148.4 (0.6) | 149.3 (0.4) | 46.5 (0.7) | 43.5 (0.6)* |
| 14–18 | 162.0 (0.4) | 163.6 (0.4)* | 65.4 (0.8) | 61.0 (0.6)* |
NOTES: cm = centimeter; kg = kilogram; SE = standard error. Data are from Appendix Tables L-1, L-2, L-5, L-6 and Supplemental Appendix Tables Y-1 and Y-2. See Supplemental Appendix Y for the expanded set of tables. Because CMHS did not have data on 2-year-olds, the committee excluded 2-year-olds from U.S. data.
*Statistical significance between U.S. and Canadian age/sex groups based on Z-score; value > 1.96 (p < .05).
SOURCES: National Health and Nutrition Examination Survey (NHANES) 2015–2018; Canadian Health Measures Survey (CHMS) Cycles 3 to 6 (2012 to 2019).
TABLE 6-4 Mean Heights and Weights, U.S. and Canadian Adults
| Age (years) | Height (cm) Mean (SE) |
Weight (kg) Mean (SE) |
||
|---|---|---|---|---|
| United States | Canada | United States | Canada | |
| Males | ||||
| 19–30 | 175.8 (0.3) | 178.2 (0.5)* | 86.0 (1.3) | 83.3 (1.1) |
| 31–50 | 176.3 (0.3) | 176.6 (0.2) | 94.1 (0.8) | 87.0 (0.9)* |
| 51–70 | 174.8 (0.3) | 174.7 (0.3) | 91.1 (0.7) | 86.8 (0.6)* |
| > 70 | 172.0 (0.4) | 171.7 (0.4) | 85.1 (0.9) | 83.3 (0.8) |
| 19+ | 175.3 (0.2) | 176.0 (0.2)* | 90.4 (0.6) | 85.9 (0.5)* |
| Females | ||||
| 19–30 | 162.5 (0.3) | 164.0 (0.5)* | 74.7 (1.0) | 69.0 (1.2)* |
| 31–50 | 162.5 (0.3) | 163.7 (0.3)* | 80.7 (1.0) | 72.6 (0.9)* |
| 51–70 | 160.9 (0.3) | 160.6 (0.3) | 78.3 (0.8) | 72.3 (0.7)* |
| > 70 | 157.1 (0.3) | 158.1 (0.3)* | 71.8 (0.8) | 69.3 (0.8)* |
| 19+ | 161.3 (0.2) | 162.3 (0.2)* | 77.5 (0.6) | 71.6 (0.7)* |
NOTES: cm = centimeter; kg = kilogram; SE = standard error. Data are from Appendix Tables L-3, L-4, L-7, and L-8. See Supplemental Appendix Y for the expanded set of tables.
* Statistical significance between U.S. and Canadian age/sex groups based on Z-score; value > 1.96 (p < .05)
SOURCES: National Health and Nutrition Examination Survey (NHANES), 2015–2018; Canadian Health Measures Survey (CHMS) Cycles 3 to 6 (2012 to 2019).
Prevalence of Normal Weight, Overweight, and Obesity in the U.S. and Canadian Populations
As a ratio, BMI can be used to directly compare values across age/sex groups and to classify individuals as underweight, normal weight, overweight, and obese. It is easily measured as it reflects weight (kg) divided by height squared (m2). However, some caution is needed in using BMI values, as they do not measure fat distribution, which is an important predictor of risk of several adverse health outcomes. Similarly, BMI can misclassify highly muscular individuals as overweight. See the supplemental online Appendix Y for the expanded set of survey data on prevalence for all age/sex groups.
Prevalence of normal weight, overweight, and obesity for U.S. and Canadian children are shown in Table 6-5. Prevalence of underweight for U.S. and Canadian children ranged from 2 to 6 percent and from 3 to 5 percent, respectively (see Appendix Tables L-9, L-10a, and L-10b). Prevalence of normal weight exceeds 50 percent for both U.S. and Canadian children, and prevalence of overweight varies from 15 to 20 percent for U.S. children and 10 to 16 percent for Canadian children. Prevalence of obesity varies from
17 to 23 percent for U.S. children and 9 to 18 percent for Canadian children. Prevalence of normal weight was lower in U.S. children compared to Canadian children in all groups except for 14-to-18-year-old boys. Conversely, prevalence of obesity was higher in U.S. children compared to Canadian children in all groups except for 14-to-18-year-old boys.
Table 6-6 presents similar data for adults, with the addition of a measure of abdominal obesity. Prevalence of underweight ranges from less than 1 percent to 4 percent for U.S. adults, and from less than 1 percent to 5 percent for Canadians (See Appendix Tables L-11 and L-12). For both the United States and Canada, prevalence of normal weight is generally less than 50 percent, indicating that more than half of the adult populations have either overweight or obesity. For U.S. adults, 32 to 45 percent are categorized as having obesity. Canadian adults have lower prevalence of obesity, 19 to 31 percent, than their U.S. counterparts. Within each country, the prevalence of normal weight and overweight generally differs between men and women.
TABLE 6-5 Prevalence of Normal Weight, Overweight, and Obesity, U.S. and Canadian Children
| Life-Stage Group | United States | Canada | United States | Canada | United States | Canada |
|---|---|---|---|---|---|---|
| % Normal (SE) | % Overweight (SE) | % Obesity (SE) | ||||
| Males | ||||||
| 4–8 years | 64.2 (2.2) | 74.1 (1.9)* | 15.2 (1.2) | 10.5 (1.1)* | 17.1 (1.7) | 9.1 (1.3)* |
| 9–13 years | 58.2 (1.9) | 69.1 (2.1)* | 15.1 (1.3) | 15.9 (1.4) | 23.4 (1.8) | 11.0 (1.3)* |
| 14–18 years | 57.0 (2.4) | 62.9 (2.6) | 15.8 (1.3) | 13.7 (1.7) | 20.8 (1.9) | 18.4 (2.4) |
| Females | ||||||
| 4–8 years | 64.2 (2.0) | 74.5 (1.6)* | 14.5 (1.2) | 12.9 (1.5) | 18.2 (1.7) | 9.0 (0.9)* |
| 9–13 years | 59.9 (1.9) | 71.3 (2.0)* | 18.9 (1.7) | 15.1 (1.8) | 18.7 (1.6) | 8.9 (1.1)* |
| 14–18 years | 57.4 (2.4) | 73.2 (1.7)* | 20.6 (1.6) | 13.2 (1.5)* | 19.5 (1.6) | 10.0 (1.1)* |
NOTES: SE = standard error. Pregnant and lactating adolescents were excluded from NHANES; pregnant women were excluded from Canadian data. This table does not include % underweight because most of the Canadian estimates for children are unreliable. This table does not include data for 2-to-3 year-old children because Canada has no data for 2-year-olds and most of the available Canadian data are unreliable for the 3-year-old age group. Prevalence values in the table will not add to 100% because the underweight category has not been included in the table. BMI categories for children: underweight: < 5th percentile for age; normal weight: 5th percentile to < 85th percentile; overweight: 85th percentile to < 95th percentile; obesity: ≥ 95th percentile. See Appendix Table L-10b for Canadian data on prevalence of weight categories for children using WHO rather than CDC criteria.
* Statistically significant difference between U.S. and Canadian life-stage groups using Z-statistic; Z-score > 1.96, significant at p < .05.
SOURCE: From Appendix Tables L-9 and L-10a. See Supplemental Appendix Y for expanded tables.
Abdominal obesity is an indicator of excessive visceral fat around the stomach and abdomen and is associated with an increased risk of adverse health effects (Bhupathiraju and Hu, 2016; Piqueras et al., 2021; Powell-Wiley et al., 2021). In Table 6-6, abdominal obesity is defined as a waist circumference greater than 102 cm (40 in.) for men or greater than 88 cm (35 in.) for women. In the United States, 31 to 63 percent of adult males and 51 to 80 percent of females have abdominal obesity. In Canada, the prevalence of abdominal obesity is 19 to 48 percent for males and 31 to 68 percent for females.
Data on the prevalence of obesity by race and ethnicity are also available for U.S. and Canadian populations (See Supplemental Appendix Tables Y-14, Y-15, Y-16, and Y-17). For U.S. males 19 years and older, the prevalence of obesity is 14.1 percent for non-Hispanic Asians, 38.3 percent for non-Hispanic Blacks, 41.4 percent for non-Hispanic Whites, and 44.2 percent for Hispanic adults. For U.S. females 19 years and older, prevalence of obesity is 16.0 percent for non-Hispanic Asians, 39.7 percent for non-Hispanic Whites, 46.3 percent for Hispanic adults, and 55.7 percent for non-Hispanic Blacks. For Canadians, because of small sample sizes for race/ethnicity groups, the available prevalence data were limited to two groups: White and other or multiple origins. For Canadian males 19 years and older, 30.6 percent of Whites and 19.1 percent of adults of other or multiple origins have obesity. For Canadian females 19 years and older, 28.2 percent of Whites have obesity compared to 19.5 percent of adults of other or multiple origins. For both U.S. and Canadian males and females, the prevalence of abdominal obesity is generally similar to or higher than prevalence of obesity. These data are important for assessing the energy balance/imbalance status of EER life-stage groups in these two countries and for providing useful population prevalence and reference data for clinical, educational, public health, and research applications.
Body Measurements
The concurrent availability of data on both prevalence of various BMI categories and prevalence of abdominal obesity in representative U.S. and Canadian populations suggest that the prevalence of abdominal obesity may differ from that of overweight and obesity. Thus, use of measures of visceral adiposity could help minimize misclassification of persons whose body weight is not affected by abdominal adiposity or persons of normal weight who have excessive abdominal obesity. This would result in more accurate identification of individuals at risk of adverse health outcomes associated with abdominal obesity (Piqueras et al., 2021; Shuster et al., 2012). Summary data for several anthropometric body composition measurements—waist circumference, sagittal abdominal diameter, and waist–
TABLE 6-6 Prevalence of Normal Weight, Overweight, Obesity, and Abdominal Obesity, U.S. and Canadian Adults
| Life-Stage Group | United States | Canada | United States | Canada | United States | Canada | United States | Canada |
|---|---|---|---|---|---|---|---|---|
| % Normal (SE) | % Overweight (SE) | % Obesity (SE) | % Abdominal Obesity (SE) | |||||
| Males | ||||||||
| 19–30 years | 37.3 (2.2) | 47.6 (2.7)* | 26.9 (2.3) | 31.1 (2.1) | 32.5 (3.1) | 19.0 (2.0)* | 30.6 (2.9) | 18.8 (2.5)* |
| 31–50 years | 18.1 (1.4) | 30.0 (1.9)* | 37.6 (2.0) | 40.0 (1.9) | 43.7 (2.2) | 29.3 (2.2)* | 48.3 (2.2) | 31.3 (2.2)* |
| 51–70 years | 19.7 (1.9) | 24.4 (1.5) | 36.9 (2.0) | 45.2 (1.8)* | 42.6 (2.3) | 30.2 (1.8)* | 57.3 (2.3) | 44.0 (1.9)* |
| > 70 years | 21.0 (1.7) | 20.2 (2.5) | 41.4 (2.0) | 50.9 (3.3)* | 36.7 (2.7) | 28.4 (2.8)* | 62.7 (2.7) | 47.8 (3.1)* |
| 19+ years | 23.2 (1.1) | 31.1 (1.0)* | 35.4 (1.2) | 40.6 (1.2)* | 40.2 (1.8) | 27.4 (1.3)* | 48.7 (1.7) | 34.1 (1.4)* |
| Females | ||||||||
| 19–30 years | 38.8 (2.6) | 52.6 (3.1)* | 23.4 (1.9) | 23.3 (2.4) | 34.1 (2.3) | 18.7 (2.3)* | 50.9 (2.3) | 31.4 (2.9)* |
| 31–50 years | 28.4 (2.0) | 42.7 (2.2)* | 27.1 (1.6) | 29.1 (1.8) | 43.4 (1.6) | 25.1 (1.9)* | 67.9 (1.7) | 46.2 (2.4)* |
| 51–70 years | 24.8 (1.6) | 35.4 (1.9)* | 28.2 (1.8) | 32.4 (1.6) | 45.4 (2.1) | 30.7 (1.8)* | 76.3 (2.1) | 60.4 (1.8)* |
| > 70 years | 25.8 (1.8) | 28.0 (3.0) | 34.3 (1.7) | 44.6 (3.3)* | 39.1 (1.8) | 26.0 (2.6)* | 80.1 (1.9) | 68.5 (2.9)* |
| 19+ years | 28.8 (1.2) | 41.1 (1.6)* | 27.8 (0.7) | 30.2 (1.1) | 41.7 (1.4) | 25.9 (1.4)* | 69.1 (1.4) | 49.9 (1.7)* |
NOTES: SE = standard error. Prevalence values in table will not add to 100% because the underweight category has not been included in the table (due to low prevalence). BMI categories: underweight < 18.5; normal weight 18.5 to < 25; overweight 25.0 to < 30.0; obese ≥ 30.0. Abdominal obesity: waist circumference > 102 cm for men and > 88 cm for women. Pregnant and lactating women excluded from NHANES; pregnant women excluded from CHMS.
* Statistically significant difference between U.S. and Canadian life-stage groups using Z-statistic; Z-score > 1.96 significant at p < .05
SOURCE: From Appendix Tables L-11 and L-12. See Supplemental Appendix Y for expanded tables.
hip ratio—for U.S. and Canadian children and adults are summarized in Tables 6-7 and 6-8, respectively.6
Waist circumference is a measurement taken around the abdomen at the level of the umbilicus (Piqueras et al., 2021). For adult males, values of less than 94 cm (37 in.) have been suggested as low risk and values greater than 102 cm (40 in.) as substantially increased risk (WHO, 2011). Only men 19 to 30 years of age in both the United States and Canada have mean values close to or less than 94 cm (37 in.) (Table 6-8). Mean values for all U.S. males not 19 to 30 years and for Canadian males older than 70 years are in the substantially increased risk category. Most Canadian males are in the increased risk category (94–102 cm [37–40 in.]). For adult females, values less than 80 cm (31 in.) are described as low risk (WHO, 2011). None of the female life-stage groups in the United States or Canada have a mean value below this cutoff. For adult females, values greater than 88 cm (35 in.) represent substantially increased risk. Mean values among all U.S. and most Canadian women are above this cutoff.
Sagittal abdominal diameter (SAD) was measured in NHANES (see description in Appendix K). Criteria for interpreting these values are not yet available, but they provide comparative information for life-stage groups among BMI, waist circumference, and waist–hip ratio measurements. Tables 6-7 and 6-8 provide estimates of the average SAD for U.S. children and adults.
Waist–hip ratio is an indicator of visceral fat. It is the ratio of the circumference of the waist divided by the circumference of the hips (Piqueras et al., 2021). Higher ratios indicate more fat around the waist. Waist–hip ratio has a strong correlation to type 2 diabetes mellitus (Nicolo et al., 2019). WHO guidelines suggest that for men, moderate risk of obesity-related health outcomes is associated with a waist–hip ratio of 0.96–1.0 and high risk with a ratio equal to or greater than 1.0 (Piqueras et al., 2021). Most of the age groups for adult men have average ratios within the moderate to high-risk ranges, with slightly higher ratios for U.S. than for Canadian men. For women, moderate risk is defined as a waist–hip ratio of 0.81 to 0.85 and high risk as equal to or greater than 0.86. All averages for U.S. and Canadian women are in moderate to high-risk categories, with slightly higher ratios for U.S. than for Canadian women.
Mean BMI values by race/ethnicity for U.S. males 19 years and older are 26.1 for non-Hispanic Asians, 29.1 for non-Hispanic Blacks, 29.4 for
___________________
6 More detailed data on distributions, comparisons among different types of anthropometric variables, and race/ethnicity are available in Appendix L and Supplemental Appendix Y.
non-Hispanic Whites, and 30.1 for Hispanic adults. For U.S. females 19 years and older, mean BMI values are 25.1 for non-Hispanic Asians, 29.4 for non-Hispanic Whites, 30.6 for Hispanic adults, and 32.3 for non-Hispanic Blacks. Mean BMI values for Canadians 19 years and older are 28.0 for White males and 26.8 for males of other or multiple origins, and 27.6 for White females and 25.9 for females of other or multiple origins (see Supplemental Appendix Tables Y-42, Y-48, Y-63, and Y-69 and Supplemental Appendix Y for the expanded data tables).
Mean waist circumference by race/ethnicity for U.S. males 19 years and older is 93.1 cm (37 in.) for non-Hispanic Asians, 98.9 cm (39 in.) for non-Hispanic Blacks, 102.1 cm (40 in.) for Hispanic adults, and 104.0 cm (41 in.) for non-Hispanic Whites. For U.S. females 19 years and older, mean waist circumference is 86.2 cm (34 in.) for non-Hispanic Asians, 98.5 cm (39 in.) for non-Hispanic Whites, 98.6 cm (39 in.) for Hispanic adults, and 102.3 cm (40 in.) for non-Hispanic Blacks. For Canadians 19 years of age, mean waist circumference values are 99.2 cm (39 in.) for White males and 93.6 cm (37 in.) for males of other or multiple origins, and 92.1 cm (36 in.) for White females and 86.8 cm (34 in.) for females of other or multiple origins (see Supplemental Appendix Tables Y-46, Y-51, Y-66, and Y-72).
Dual-Energy X-Ray Absorptiometry Summaries
Dual-energy x-ray absorptiometry (DXA) is a low-dose radiation technique that can provide several measures of adiposity in clinical settings (Messina et al., 2020), although consensus is lacking in terms of interpretive criteria for most of these measures. DXA measures of adiposity that are available from NHANES indicate that total body fat mass, percent body fat, and fat mass index are higher in U.S. females than in U.S. males for all life-stage groups (Table 6-9, Appendix Tables L-13 and L-14, and Supplemental Appendix Tables Y-87 to Y-94). The mean percent body fat for adult males and females exceeds the WHO definition of obesity, which is greater than 25 percent body fat for White men and greater than 35 percent body fat for White women (Piqueras et al., 2021). Visceral adipose tissue—the hormonally active component of total fat—is higher in adult females than in adult males.
DXA measures from NHANES for race/ethnicity groups (see Supplemental Appendix Tables Y-93 and Y-94) indicate that mean percent body fat for U.S. adult males aged 19 to 59 years is 24.8 for non-Hispanic Blacks, 27.0 for non-Hispanic Whites, 27.4 for non-Hispanic Asians, and 28.3 for Hispanic adults. Mean percent body fat for U.S. adult females aged 19 to 59 years is 36.8 for non-Hispanic Asians, 38.3 for non-Hispanic Whites, 38.9 for non-Hispanic Blacks, and 40.0 for Hispanic adults. Mean
TABLE 6-7 Anthropometric Body Composition Measurements, U.S. and Canadian Children, 3–18 Years of Age
| Age | BMI Mean (SE) | Waist Circumference (cm) Mean (SE) |
Average Sagittal Abdominal Diameter (cm) Mean (SE) |
Waist–Hip Ratio Mean (SE) |
||||
|---|---|---|---|---|---|---|---|---|
| Life-Stage Group | United States | Canada | United States | Canada | United States | Canada | United States | Canada |
| Males | ||||||||
| 3 years | 16.8 (0.2) | 16.2 (0.2)* | 51.3 (0.8) | 49.9 (0.3) | --- | --- | --- | 0.91 (0.01) |
| 4–8 years | 17.1 (0.1) | 16.2 (0.1)* | 58.1 (0.4) | 55.2 (0.4)* | --- | --- | --- | 0.87 (0.00) |
| 9–13 years | 20.6 (0.2) | 19.2 (0.1)* | 72.8 (0.6) | 68.4 (0.4)* | 16.3 (0.2) | --- | --- | 0.85 (0.00) |
| 14–18 years | 24.0 (0.3) | 23.7 (0.4) | 83.4 (0.8) | 82.0 (1.1) | 18.5 (0.3) | --- | 0.86 (0.01) | 0.84 (0.00)* |
| Females | ||||||||
| 3 years | 16.2 (0.1) | 16.2 (0.2) | 50.3 (0.3) | 50.4 (0.4) | --- | --- | --- | 0.91 (0.01) |
| 4–8 years | 17.1 (0.1) | 16.3 (0.1)* | 57.8 (0.3) | 55.4 (0.3)* | --- | --- | 0.88 (0.00) | |
| 9–13 years | 20.7 (0.2) | 19.2 (0.2)* | 72.5 (0.5) | 67.5 (0.6)* | 16.2 (0.2) | --- | --- | 0.83 (0.00) |
| 14–18 years | 24.9 (0.3) | 22.8 (0.2)* | 82.5 (0.7) | 77.1 (0.6)* | 18.4 (0.2) | --- | 0.83 (0.01) | 0.81 (0.00)* |
NOTES: BMI = body mass index; cm = centimeter; kg = kilogram; m = meter; SE = standard error. This table does not include 2-year-old children because Canada has no data for this age group. The Canadian surveys did not present data on average sagittal abdominal diameter. Pregnant and lactating adolescents are excluded from NHANES; pregnant adolescents are excluded from CHMS.
* Statistically significant difference between U.S. and Canadian life-stage groups.
SOURCES: From Appendix Tables L-1, L-2, L-5, L-6, and Supplemental Appendix Tables Y-1 and Y-2.
TABLE 6-8 Anthropometric Body Composition Measurements, U.S. and Canadian Adults, 19 Years of Age and Older
| BMI Mean (SE) | Waist Circumference (cm) Mean (SE) |
Average Sagittal Abdominal Diameter (cm) Mean (SE) |
Waist–Hip Ratio Mean (SE) |
|||||
|---|---|---|---|---|---|---|---|---|
| Life-Stage Group | United States | Canada | United States | Canada | United States | Canada | United States | Canada |
| Males | ||||||||
| 19–30 years | 27.8 (0.4) | 26.1 (0.3)* | 94.5 (1.0) | 90.5 (1.0)* | 21.4 (0.2) | --- | 0.91 (0.01) | 0.88 (0.01)* |
| 31–50 years | 30.2 (0.3) | 27.8 (0.3)* | 103.5 (0.6) | 97.2 (0.7)* | 23.6 (0.3) | --- | 0.97 (0.00) | 0.94 (0.00) |
| 51–70 years | 29.7 (0.2) | 28.4 (0.2)* | 106.0 (0.7) | 101.5 (0.5* | 24.2 (0.3) | --- | 1.01 (0.01) | 0.98 (0.00)* |
| > 70 years | 28.7 (0.2) | 28.2 (0.2) | 106.4 (0.7) | 103.1 (0.8)* | 24.4 (0.3) | --- | 1.01 (0.00) | 1.00 (0.01) |
| 19+ years | 29.4 (0.2) | 27.7 (0.1)* | 102.6 (0.5) | 97.6 (0.4)* | 23.4 (0.2) | --- | 0.97 (0.00) | 0.95 (0.00) |
| Females | ||||||||
| 19–30 years | 28.3 (0.4) | 25.6 (0.4)* | 92.5 (0.9) | 84.6 (1.0)* | 20.2 (0.2) | --- | 0.86 (0.01) | 0.83 (0.01)* |
| 31–50 years | 30.5 (0.3) | 27.1 (0.3)* | 98.9 (0.8) | 90.1 (0.9)* | 21.9 (0.2) | --- | 0.88 (0.00) | 0.87 (0.00) |
| 51–70 years | 30.3 (0.3) | 28.0 (0.3)* | 100.7 (0.8) | 94.1 (0.6)* | 23.2 (0.3) | --- | 0.91 (0.01) | 0.89 (0.00)* |
| > 70 years | 29.0 (0.3) | 27.7 (0.3)* | 100.2 (0.6) | 94.2 (0.7)* | 22.8 (0.3) | --- | 0.93 (0.00) | 0.89 (0.00) |
| 19+ years | 29.8 (0.2) | 27.1 (0.2)* | 98.3 (0.6) | 90.7 (0.6)* | 22.1 (0.2) | --- | 0.89 (0.00) | 0.87 (0.00) |
NOTES: BMI = body mass index; cm = centimeter; kg = kilogram; m = meter; SE = standard error. The Canadian surveys do not have data on average sagittal abdominal diameter. Pregnant and lactating women excluded from NHANES; pregnant women excluded from the Canadian Health Measures Survey.
* Statistically significant difference between U.S. and Canadian life-stage groups.
SOURCES: From Appendix Tables L-3, L-4, L-7, and L-8. See Supplemental Appendix Y for the expanded set of tables.
TABLE 6-9 DXA Body Composition Summary Statistics, Ages 8–59 Years, United States
| Age (years) | Total Body Fat Mass (g) Mean (SE) |
Percent Body Fat (%) Mean (SE) |
Lean Mass Index Mean (SE) |
Fat Mass Index Mean (SE) |
Visceral Adipose Tissue (g) Mean (SE) |
|||||
|---|---|---|---|---|---|---|---|---|---|---|
| Males | Females | Males | Females | Males | Females | Males | Females | Males | Females | |
| 8 | 9.5 (0.4) | 10.9 (0.5)* | 28.1 (0.6) | 32.8 (0.7)* | 12.8 (0.1) | 12.3 (0.2)* | --- | --- | 162.9 (4.0) | 133.6 (10.7) |
| 9–13 | 14.4 (0.4) | 15.6 (0.4)* | 29.0 (0.4) | 32.4 (0.3)* | 14.4 (0.1) | 13.7 (0.1)* | --- | --- | 176.9 (2.2) | 169.4 (5.8) |
| 14–18 | 17.6 (0.6) | 23.2 (0.5)* | 23.5 (0.5) | 34.7 (0.4)* | 17.8 (0.2) | 15.8 (0.1)* | --- | --- | 198.4 (2.6) | 218.2 (8.6) |
| 19–30 | 22.5 (0.5) | 28.0 (0.9)* | 25.5 (0.3) | 36.7 (0.5)* | 20.1 (0.2) | 17.2 (0.2)* | 7.4 (0.2) | 10.6 (0.3)* | 238.5 (4.4) | 322.4 (12.2) |
| 31–50 | 25.9 (0.4) | 31.8 (0.5)* | 27.8 (0.2) | 38.9 (0.3)* | 21.1 (0.1) | 18.0 (0.1)* | 8.5 (0.1) | 12.1 (0.2)* | 331.6 (10.8) | 488.0 (13.1) |
| 51–59 | 25.2 (0.6) | 31.8 (0.7)* | 27.9 (0.4) | 40.3 (0.3)* | 20.8 (0.2) | 17.4 (0.2)* | 8.3 (0.2) | 12.2 (0.3)* | 445.0 (25.3) | 596.8 (18.8) |
| 19–59 | 24.7 (0.3) | 30.7 (0.5)* | 27.1 (0.2) | 38.6 (0.3)* | 20.8 (0.1) | 17.6 (0.1)* | 8.1 (0.1) | 11.7 (0.2)* | 310.0 (8.3) | 470.1 (11.0) |
NOTES: DXA = dual-energy x-ray absorptiometry; g = grams; kg = kilogram; m = meter; SE = standard error. DXA results not available from CHMS. Fat mass index calculated as fat mass/height2 and lean mass index as lean mass (including bone mineral content)/height2. No statistical test results are available to compare male and female data for visceral adipose tissue. Pregnant and lactating women excluded.
* Statistically significant difference between U.S. males and females.
SOURCE: NHANES (see Appendix Tables L-13 and L-14). See Supplemental Appendix Tables Y-87 to Y-94 for the expanded set of tables.
visceral adipose tissue for U.S. adult males is 408.3 g (14 oz) for non-Hispanic Blacks, 471.5 g (17 oz) for non-Hispanic Asians, 565.4 g (20 oz) for Hispanic adults, and 565.8 g (20 oz) for non-Hispanic Whites. Similar data for U.S. adult females are 370.5 g (13 oz) for non-Hispanic Asians, 417.3 g (15 oz) for non-Hispanic Blacks, 474.8 g (17 oz) for non-Hispanic Whites, and 516.2 g (18 oz) for Hispanic adults.
The anthropometric and DXA data in conjunction with BMI data provide useful information on the weight status of U.S. and Canadian populations and reference values for multiple research, clinical, and policy applications. Clearly, more research is needed on interpretive criteria for the different indices and, in some cases, for race/ethnicity, age/sex, and other subgroups. Identifying the best indicator or combination of indicators for predicting adverse health outcomes associated with energy intake imbalances and the risk of specific chronic diseases is also needed.
Indicators of Physical Activity
The 2018 Physical Activity Guidelines for Americans recommends that children ages 6 through 17 years get 60 minutes per day of moderate-to-vigorous physical activity (MVPA), to include muscle- and bone-strengthening activities as well as aerobic activity (DHHS, 2018). The target for adults is 150 to 300 minutes per week of moderate-intensity physical activity or an equivalent mix of moderate- and vigorous-intensity aerobic activity as well as muscle-strengthening activities at least twice per week. Data from the National Health Interview Survey and the Youth Risk Behavioral Surveillance System was used to track national health objectives,7 and they showed that in 2020, 25.2 percent of adults met the combined muscle-strengthening and aerobic recommendations, while 47.9 percent met the aerobic activity recommendation alone. Prevalence for males exceeded that for females for the combined (29.0 vs. 21.5 percent) and aerobic measures (52.2 vs. 43.8 percent). In 2019, only 16.5 percent of students in grades 9 through 12 met the combined recommendation for youth. Adolescent males were more likely than females to report meeting the recommendation (23.1 vs. 10.1 percent). As was the case for adults, prevalence was higher for meeting only the aerobic recommendation (23.2 percent), with adolescent males having higher prevalence than adolescent females (30.9 vs. 15.4 percent).
Data from NHANES 2011–2014 collected with wrist-worn accelerometers provide a measure of total physical activity across ages 3 to 80
___________________
7https://health.gov/healthypeople/objectives-and-data/browse-objectives/physical-activity (accessed February 8, 2023).
years and older (Belcher et al., 2021). The Monitor Independent Motion Summary (MIMS) units are not translated into physical activity intensity or energy expenditure, but they show how movement activity varies across age and sex within the United States. Among youth, values for males and females were similar for ages 3 to 5 years, with activity increasing from age 3 to 6 years then declining until age 17 to 18 years. Beginning at age 6 years among youth and among adults, movement activity was generally higher among females than among males. Median values peaked at age 20 years for males and 36 years for females and then decreased with increasing age.
Data from CHMS for 2018 and 2019 indicate that 49 percent of Canadian adults are meeting the 150 minutes per week of moderate to vigorous exercise recommendation with an average of 27 minutes of MVPA per day. The percent meeting the requirement declines with advancing age. Children and youth had a slightly lower percentage (44 percent) of meeting the Canadian physical activity target recommended in the Canadian 24-hour Movement Guidelines during the same time period. These estimates were all measured using a physical activity monitor (Statistics Canada, 2021).
When data from devices are used to assess compliance with recommended amounts of aerobic physical activity, the estimates tend to be lower, but as noted, depend upon criteria used to define moderate- or vigorous-intensity physical activity. Devices generally cannot measure muscle-strengthening physical activity.
A systematic review by Foulds et al. (2013) investigated the question of whether Native American populations in the United States and Canada attained recommended physical activity levels. The review also compared current and past activity levels and assessed the effect of exercise training programs on health outcomes in the population. From among more than 100,000 participants, adults in the population had an average physical activity level (PAL) of 1.48, while children, at age 5 years, had a PAL of 1.42. The study concluded that physical activity levels among Native American adults have decreased since 1990 and that a greater proportion of adults reported being inactive.
FINDINGS AND CONCLUSIONS
Assessment of Energy Intake and Expenditure
Findings
The committee finds that although it is possible to characterize usual energy intakes using statistical methods to account for random error,
self-reported energy intakes for both U.S. and Canadian life-stage groups are still prone to systematic measurement error. In the absence of self-report, tracking indicators of long-term energy intakes that exceed the requirements for maintenance of a healthy weight are used rather than tracking energy intakes for the population.
Conclusions
From the evidence reviewed, the committee concludes that research efforts to improve the accuracy of dietary intake data are needed and that users of these data need to be aware of significant underreporting bias. Alternative approaches to self-report are also needed to assess usual energy intakes in the U.S. and Canadian populations. Additionally, new methods are needed to assess dietary intake of children.
Assessment of Physical Activity
Findings
The committee finds disagreement between measures of physical activity and energy expenditure. This indicates that the terms are not interchangeable. Physical activity is movement, whereas energy expenditure reflects age, sex, body mass, and economy of movement. Further, the committee found substantial discrepancies and low correlations between commonly used indirect and direct methods of assessing physical activity. Total physical activity is a function of movement type and the intensity, duration, and frequency with which it is performed. Methods of assessing physical activity are not interchangeable, as they frequently measure different properties or components.
The committee’s overall examination of self-report measures finds that the vast majority of correlation coefficients are considered poor to moderate. This suggests that most self-report measures may be valid for classifying individuals’ behaviors for the type and intensity, but less useful for estimating total energy expenditure. For device-based measures, Pearson’s correlations ranged from 0.58 to 0.88 for accelerometer-based predictions compared to room and indirect calorimetry, with large variation at the individual level. Wrist-worn and arm-worn research-grade devices were more accurate than commercial devices for estimates of TEE. The committee notes that such devices do not guarantee superior accuracy.
Conclusions
Although no perfect tool exists for examining physical activity, the committee concludes that when examining physical activity in adults in free-living environments, researchers should incorporate appropriate objective measures that are specific to the behaviors of interest. Additionally, although the methodological effectiveness of physical activity measures is well documented, the committee concludes that development of an appropriate, consistent approach to conducting research and reporting findings is necessary to enable cross-instrument findings.
Indicators of Body Weight and Adiposity
Findings
The committee finds that the available NHANES and CHMS data provide a wealth of information on the indicators of long-term energy intakes that exceed the intakes needed to maintain healthy body weight (i.e., weight and body composition status of U.S. and Canadian population groups)—for both EER life-stage groups and race/ethnicity subgroups. Appendix L and Supplemental Appendix Y provide data on both anthropometric and DXA results stratified by weight category, with further stratification for race/ethnicity groups using the DRI life-stage groupings.
Conclusions
The committee concludes that the prevalence of overweight and obesity in the U.S. and Canadian populations is of concern, and that the prevalence is somewhat higher for the U.S. than for Canadian populations. Further, while anthropometric and DXA data require more research to confirm interpretive criteria and to assess their validity as predictors of risk of adverse health outcomes, the reference values suggest that these data could help identify individuals at the greatest risk of energy intakes that exceed intakes required to maintain healthy body weights. Differences related to ancestry support the need for tailored approaches to help these groups maintain or achieve healthy body weights. In total, these results characterize and underscore the seriousness of public health concerns related to overweight and obesity among U.S. and Canadian population groups.
The survey data for U.S. and Canadian populations show differences in the prevalence of high BMI/obesity and high waist circumference by sex and by self-reported race/ethnicity. The committee concludes that these differences
may be a consequence of health disparities, and thus, support the need to tailor programs and interventions to the subgroups of the populations served.
REFERENCES
Adamo, K. B., S. A. Prince, A. C. Tricco, S. Connor-Gorber, and M. Tremblay. 2009. A comparison of indirect versus direct measures for assessing physical activity in the pediatric population: A systematic review. International Journal of Pediatric Obesity 4(1):2-27.
Bailey, R. L. 2021. Overview of dietary assessment methods for measuring intakes of foods, beverages, and dietary supplements in research studies. Current Opinion in Biotechnology 70:91-96.
Basiotis, P. P., S. O. Welsh, F. J. Cronin, J. L. Kelsay, and W. Mertz. 1987. Number of days of food intake records required to estimate individual and group nutrient intakes with defined confidence. Journal of Nutrition 117(9):1638-1641.
Belcher, B. R., D. L. Wolff-Hughes, E. E. Dooley, J. Staudenmayer, D. Berrigan, M. S. Eberhardt, and R. P. Troiano. 2021. US population-referenced percentiles for wrist-worn accelerometer-derived activity. Medicine and Science in Sports and Exercise 53(11):2455-2464.
Bhupathiraju, S. N., and F. B. Hu. 2016. Epidemiology of obesity and diabetes and their cardiovascular complications. Circulation Research 118(11):1723-1735.
Boushey, C. J., M. Spoden, F. M. Zhu, E. J. Delp, and D. A. Kerr. 2017. New mobile methods for dietary assessment: Review of image-assisted and image-based dietary assessment methods. Proceedings of the Nutrition Society 76(3):283-294.
Burrows, T. L., R. J. Martin, and C. E. Collins. 2010. A systematic review of the validity of dietary assessment methods in children when compared with the method of doubly labeled water. Journal of the American Dietetic Association 110(10):1501-1510.
Burrows, T. L., Y. Y. Ho, M. E. Rollo, and C. E. Collins. 2019. Validity of dietary assessment methods when compared to the method of doubly labeled water: A systematic review in adults. Frontiers in Endocrinology 10.
Burrows, T., S. Goldman, and M. Rollo. 2020. A systematic review of the validity of dietary assessment methods in children when compared with the method of doubly labelled water. European Journal of Clinical Nutrition 74(5):669-681.
Capling, L., K. L. Beck, J. A. Gifford, G. Slater, V. M. Flood, and H. O’Connor. 2017. Validity of dietary assessment in athletes: A systematic review. Nutrients 9(12).
CDC (Centers for Disease Control and Prevention). 2022. Adult obesity facts. https://www.cdc.gov/obesity/data/adult.html. (accessed November 24, 2022).
Crouter, S. E., P. R. Hibbing, and S. R. LaMunion. In press. Physical activity assessment. In Health professional’s guide to obesity and weight management. Edited by H. A. Raynor and L. Gigliotti. Chicago, IL: Academy of Nutrition and Dietetics.
DHHS (U.S. Department of Health and Human Services). 2018. Physical activity guidelines for Americans, 2nd ed. Washington, DC: U.S. Department of Health and Human Services.
Dodd, K. W., P. M. Guenther, L. S. Freedman, A. F. Subar, V. Kipnis, D. Midthune, J. A. Tooze, and S. M. Krebs-Smith. 2006. Statistical methods for estimating usual intake of nutrients and foods: A review of the theory. Journal of the American Dietetic Association 106(10):1640-1650.
Dowd, K. P., R. Szeklicki, M. A. Minetto, M. H. Murphy, A. Polito, E. Ghigo, H. van der Ploeg, U. Ekelund, J. Maciaszek, R. Stemplewski, M. Tomczak, and A. E. Donnelly. 2018. A systematic literature review of reviews on techniques for physical activity measurement in adults: A DEDIPAC study. International Journal of Behavioral Nutrition and Physical Activity 15(1):15.
Dwyer, J. T., J. Gardner, K. Halvorsen, E. A. Krall, A. Cohen, and I. Valadian. 1989. Memory of food intake in the distant past. American Journal of Epidemiology 130(5):1033-1046.
Foulds, H. J. A., D. E. R. Warburton, and S. S. D. Bredin. 2013. A systematic review of physical activity levels in Native American populations in Canada and the United States in the last 50 years. Obesity Reviews 14(7):593-603.
Gemming, L., J. Utter, and C. Ni Mhurchu. 2015. Image-assisted dietary assessment: A systematic review of the evidence. Journal of the Academy of Nutrition and Dietetics 115(1):64-77.
Gibson, R. S. 1990. Principles of nutritional assessment. New York: Oxford University.
Helmerhorst, H. J., S. Brage, J. Warren, H. Besson, and U. Ekelund. 2012. A systematic review of reliability and objective criterion-related validity of physical activity questionnaires. International Journal of Behavioral Nutrition & Physical Activity 9:103.
Ho, D. K. N., S. H. Tseng, M. C. Wu, C. K. Shih, A. P. Atika, Y. C. Chen, and J. S. Chang. 2020. Validity of image-based dietary assessment methods: A systematic review and meta-analysis. Clinical Nutrition 39(10):2945-2959.
Kirkpatrick, S. I., A. F. Subar, and J. A. Tooze. 2018. Statistical approaches to mitigate measurement error in dietary intake data collected using 24-hour recalls and food records/diaries. In Advances in the assessment of dietary intake, edited by D. E. Schoeller and M. Westerterp. Boca Raton, FL: CRC Press.
Livingstone, M. B., and P. J. Robson. 2000. Measurement of dietary intake in children. Proceedings of the Nutrition Society 59(2):279-293.
Livingstone, M. B., P. J. Robson, and J. M. Wallace. 2004. Issues in dietary intake assessment of children and adolescents. British Journal of Nutrition 92(Suppl 2):S213-S222.
Macfarlane, D. J. 2017. Open-circuit respirometry: A historical review of portable gas analysis systems. European Journal of Applied Physiology 117(12):2369-2386.
McClung, H. L., L. T. Ptomey, R. P. Shook, A. Aggarwal, A. M. Gorczyca, E. S. Sazonov, K. Becofsky, R. Weiss, and S. K. Das. 2018. Dietary intake and physical activity assessment: Current tools, techniques, and technologies for use in adult populations. American Journal of Preventive Medicine 55(4):e93-e104.
Messina, C., D. Albano, S. Gitto, L. Tofanelli, A. Bazzocchi, F. M. Ulivieri, G. Guglielmi, and L. M. Sconfienza. 2020. Body composition with dual energy x-ray absorptiometry: From basics to new tools. Quantitative Imaging in Medical Surgery 10(8):1687-1698.
Nicolo, M. L., C. W. Compher, P. A. Shewokis, J. I. Boullata, D. Sukumar, S. A. Smith, and S. L. Volpe. 2019. Anthropometric predictors of hemoglobin A1c among adults: NHANES 2003 to 2004 and 2013 to 2014. Translational Journal of the American College of Sports Medicine 4(21):242-247.
NRC (National Research Council). 1986. Nutrient adequacy. Washington, DC: National Academy Press.
Nusser, S. M., A. L. Carriquiry, K. W. Dodd, and W. A. Fuller. 1996. A semiparametric transformation approach to estimating usual daily intake distributions. Journal of the American Statistical Association 91(436):1440-1449.
O’Driscoll, R., J. Turicchi, K. Beaulieu, S. Scott, J. Matu, K. Deighton, G. Finlayson, and J. Stubbs. 2020. How well do activity monitors estimate energy expenditure? A systematic review and meta-analysis of the validity of current technologies. British Journal of Sports Medicine 54(6):332-340.
Overstreet, B. S., D. R. Bassett, Jr., S. E. Crouter, B. C. Rider, and B. B. Parr. 2017. Portable open-circuit spirometry systems. Journal of Sports Medicine and Physical Fitness 57(3):227-237.
Piqueras, P., A. Ballester, J. V. Dura-Gil, S. Martinez-Hervas, J. Redon, and J. T. Real. 2021. Anthropometric indicators as a tool for diagnosis of obesity and other health risk factors: A literature review. Frontiers in Psychology 12:631179.
Powell-Wiley, T. M., P. Poirier, L. E. Burke, J. P. Despres, P. Gordon-Larsen, C. J. Lavie, S. A. Lear, C. E. Ndumele, I. J. Neeland, P. Sanders, M. P. St-Onge, on behalf of the American Heart Association Council on Lifestyle and Cardiometabolic Health, Council on Cardiovascular and Stroke Nursing, Council on Clinical Cardiology, Council on Epidemiology and Prevention, and Stroke Council. 2021. Obesity and cardiovascular disease: A scientific statement from the American Heart Association. Circulation 143(21):e984-e1010.
Schoeller, D. A., and E. van Santen. 1982. Measurement of energy expenditure in humans by doubly labeled water method. Journal of Applied Physiology: Respiratory, Environmental and Exercise Physiology 53(4):955-959.
Schoffelen, P. F. M., M. den Hoed, E. van Breda, and G. Plasqui. 2019. Test-retest variability of VO2max using total-capture indirect calorimetry reveals linear relationship of VO2 and power. Scandinavian Journal of Medicine and Science in Sports 29(2):213-222.
Shuster, A., M. Patlas, J. H. Pinthus, and M. Mourtzakis. 2012. The clinical importance of visceral adiposity: A critical review of methods for visceral adipose tissue analysis. British Journal of Radiology 85(1009):1-10.
Souverein, O. W., A. L. Dekkers, A. Geelen, J. Haubrock, J. H. de Vries, M. C. Ocke, U. Harttig, H. Boeing, P. van ‘t Veer, and E. Consortium. 2011. Comparing four methods to estimate usual intake distributions. European Journal of Clinical Nutrition 65(Suppl 1):S92-S101.
Speakman, J. R. 1998. The history and theory of the doubly labeled water technique. American Journal of Clinical Nutrition 68(4):932S-938S.
Statistics Canada. 2019. Health fact sheets: Overweight and obese adults, 2018. https://www150.statcan.gc.ca/n1/pub/82-625-x/2019001/article/00005-eng.htm (accessed September 30, 2022).
Statistics Canada. 2021. Half of Canadian adults meet the new physical activity recommendation https://www150.statcan.gc.ca/n1/daily-quotidien/210901/dq210901c-eng.htm (accessed November 21, 2022).
Strath, S. J., L. A. Kaminsky, B. E. Ainsworth, U. Ekelund, P. S. Freedson, R. A. Gary, C. R. Richardson, D. T. Smith, A. M. Swartz, on behalf of the American Heart Association Physical Activity Committee of the Council on Lifestyle and Cardiometabolic Health and Cardiovascular, Exercise, Cardiac Rehabilitation and Prevention Committee of the Council on Clinical Cardiology, and Council on Cardiovascular and Stroke Nursing. 2013. Guide to the assessment of physical activity: Clinical and research applications: A scientific statement from the American Heart Association. Circulation 128(20):2259-2279.
Subar, A. F., K. W. Dodd, P. M. Guenther, V. Kipnis, D. Midthune, M. McDowell, J. A. Tooze, L. S. Freedman, and S. M. Krebs-Smith. 2006. The food propensity questionnaire: Concept, development, and validation for use as a covariate in a model to estimate usual food intake. Journal of the American Dietetic Association 106(10):1556-1563.
Sylvia, L. G., E. E. Bernstein, J. L. Hubbard, L. Keating, and E. J. Anderson. 2014. Practical guide to measuring physical activity. Journal of the Academy of Nutrition and Dietetics 114(2):199-208.
Thompson, F. E., S. I. Kirkpatrick, A. F. Subar, J. Reedy, T. E. Schap, M. M. Wilson, and S. M. Krebs-Smith. 2015. The National Cancer Institute’s dietary assessment primer: A resource for diet research. Journal of the Academy of Nutrition and Dietetics 115(12):1986-1995.
Tooze, J. A., D. Midthune, K. W. Dodd, L. S. Freedman, S. M. Krebs-Smith, A. F. Subar, P. M. Guenther, R. J. Carroll, and V. Kipnis. 2006. A new statistical method for estimating the usual intake of episodically consumed foods with application to their distribution. Journal of the American Dietetic Association 106(10):1575-1587.
Tooze, J. A., V. Kipnis, D. W. Buckman, R. J. Carroll, L. S. Freedman, P. M. Guenther, S. M. Krebs-Smith, A. F. Subar, and K. W. Dodd. 2010. A mixed-effects model approach for estimating the distribution of usual intake of nutrients: The NCI method. Statistics in Medicine 29(27):2857-2868.
Tudor-Locke, C., J. E. Williams, J. P. Reis, and D. Pluto. 2002. Utility of pedometers for assessing physical activity: Convergent validity. Sports Medicine 32(12):795-808.
Tugault-Lafleur, C. N., J. L. Black, and S. I. Barr. 2017. A systematic review of methods to assess children’s diets in the school context. Advances in Nutrition 8(1):63-79.
Wehling, H., and J. Lusher. 2019. People with a body mass index 30 under-report their dietary intake: A systematic review. Journal of Health Psychology 24(14):2042-2059.
WHO (World Health Organization). 2011. Waist circumference and waist–hip ratio: Report of a WHO expert consultation, Geneva, 8–11 December 2008. Geneva: World Health Organization.
WHO. 2021. Obesity and overweight. https://www.who.int/news-room/fact-sheets/detail/obesity-and-overweight (accessed November 24, 2022).
This page intentionally left blank.


