

APPENDIX A
Case Studies
Introduction
The research team conducted five case studies selected from the alternative services of the 18 transit agencies participating in the survey.
Selecting the case studies started with transit agencies that agreed to be a case study as reported in their survey response, then looked to identify different service designs, availability of data for the alternative service, and diversity of community size and geographic location. The process resulted with the following alternative service programs selected as case studies, listed by location:
- Boston, MA: Massachusetts Bay Transportation Authority’s On-Demand/The RIDE Flex
- Broward County, FL: Broward County Transit’s Rider’s Choice
- Flagstaff, AZ: Northern Arizona Intergovernmental Public Transportation Authority (dba Mountain Line)’s Paratransit Taxi Program
- Richmond, VA: Greater Richmond Transit Company’s CARE On-Demand
- San Antonio, TX: VIA Metropolitan Transit’s taxi subsidy program
The case studies were conducted from November 2021 through January 2022. The continuing pandemic complicated on-site visits, so the case studies were conducted virtually. Input and feedback from users of the alternative services were obtained for four of the alternative services—through focus groups at two of the transit agencies, interviews at a third, and a brief survey of selected users at the fourth transit agency.
Write-ups of the case studies were prepared and shared with the respective transit agencies. With their comments and review, revisions were made and shared again with the transit agencies as final drafts.
Case Studies
Boston, MA: MBTA The RIDE Flex
Background of the Transit Agency
The Massachusetts Bay Transportation Authority (MBTA) is the public transit agency that serves the Greater Boston region. Public transit services for the general public include a regional commuter rail system, a subway system with heavy rail and light rail trains, an electric trolley line, electric trolley buses, bus rapid transit, local bus service, and ferry boats.
One-way fares on the subway and local bus are $2.40 and $1.70 respectively, payable by a reloadable CharlieCard, a printed, readable Charlie ticket, or cash. One-way commuter rail fares
range from $2.40 to $13.25, and one-way ferry ride fares range from $3.70-$9.50. Various passes are also available.
The MBTA also provides ADA paratransit service—The RIDE—one of the largest in the United States. In 2016, the MBTA introduced a TNC-based alternative service, called the on-demand program for The RIDE customers. In 2020, the MBTA launched a provider options pilot (POP) which, with a rider opt-in, allows the MBTA to assign a RIDE trip to a TNC. In 2021, POP was rolled into the on-demand program using a common rider opt-in agreement and rebranded The RIDE Flex.
ADA Paratransit Service—The RIDE
The RIDE is the MBTA’s ADA paratransit service, providing shared-ride door-to-door transit service to persons with disabilities who are unable to access or use the MBTA’s fixed route system. Since it began operation in 1977, the service has grown from a relatively small operation serving a 12-square-mile area in Brookline, Cambridge, and parts of Boston to serving a 712-square-mile area, including 58 cities and towns with a combined population of 2.5 million.
Several different service models have been used to provide The RIDE service. In its infancy, it was provided via a turnkey contract with THEM, a local private nonprofit carrier. Other service models over the years have included brokerages with providers assigned to certain zones and zoned turnkey contracts with different contractors assigned to specific zones and with overlapping responsibilities in the core area (that included the City of Boston).
In 2017, The RIDE service model transitioned to a call and control center contractor model that involved a third-party organization responsible for reservations, scheduling and dispatching at TRAC (The RIDE Access Center), a facility leased by the MBTA, with three and now two providers operating mostly dedicated service.
The RIDE service providers operate service with a fleet of MBTA-supplied dedicated lift-equipped vehicles and sedans (Figure A-1). For most of the last decade, The RIDE was supported by StrataGen’s ADEPT scheduling systems. Also, the MBTA contracts with an entity that provides eligibility certification services out of TREC (The RIDE Eligibility Center), another facility leased by the MBTA.
The RIDE has similar operating hours to the MBTA’s transit services—generally 5 to 1 a.m. daily.
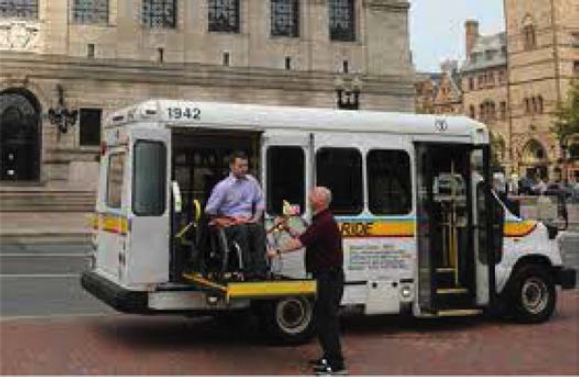
Figure A-1. MBTA ADA paratransit vehicle.
The service area includes that required by the ADA and an area minimally beyond that. Service to and from and within this latter area is called “premium” service.
A one-way ADA paratransit fare is $3.35. The premium service fare is $5.60. All fares are cashless, handled through a centralized fare account, where fares are deducted (within ADEPT) at booking and credited back in the event a trip was not completed for whatever reason.
In FY19, The RIDE provided approximately 1.8 million trips to registered customers and 2.1 million total trips (including personal care assistants—PCAs—and companions). The average cost per trip in FY19 was $63.86.
Background, Planning, and Implementation
Planning for the alternative service began in 2016 and stemmed from both a study on cost-reducing strategies conducted for the MBTA and the Governor’s office, which was advocating for ways that the MBTA could use TNCs as a way to upgrade mobility options for The RIDE customers (Figure A-2). In a January 2017 presentation, the pilot purposes and benefits were described:
- To improve flexibility and mobility for paratransit customers
- To provide equal or better levels of service at a lower cost
- To identify the financial and operational feasibility of the new model
- To identify paratransit customers that could be more effectively served by on-demand transit options
- To test how trips can be converted from The RIDE to on-demand options on a longer-term basis
In forming the on-demand paratransit program, the MBTA began discussions with both Uber and Lyft to gauge their interest in the program and to discuss how the program might work with their involvement, and what kind of data the MBTA would need to be able to monitor performance. The program was initially designed as a pilot. The original contracts were based in part on other similar contracts from other transit agencies and were tailored based on discussions with the TNCs.
The RFP was issued in the summer of 2016. Both Uber and Lyft responded. There was substantial negotiation on insurance coverage, data collection, and how trips requiring WAVs would be accommodated. Regarding insurance, both TNCs agreed to pay the MBTA-required increased

Figure A-2. MBTA passenger using a TNC.
insurance for their participating drivers. Once the contracts were executed, the six-month pilot program was launched in September 2016 and extended to March 2017.
Design Elements of the Pilot
Important design elements of the pilot included:
- A focus on providing on-demand service.
- Trips can be made only within The RIDE service area.
- Trips can be made only during The RIDE service hours.
- The MBTA needed to have at least two providers, enabling user choice, to take advantage of the FTA’s taxicab exception (not requiring driver drug and alcohol testing).
- While there is user choice, a non-WAV rider is required to choose one provider at a time, i.e., a rider can only be registered for Uber or Lyft. If a rider wishes to switch providers, they need to contact the MBTA to do so; in the life of the program, only 3% of riders have requested a switch. WAV riders, in contrast, are granted access to both Uber and Lyft.
- Each TNC under contract was required to provide a call-in option for riders without a smartphone or access to the Internet. Lyft met this requirement. Uber did not (and to date has not). However, the MBTA accepted Uber’s work-around, which was to provide smartphones to several individuals.
The MBTA limited the pilot program to the first 400 customers of The RIDE who signed up for the program. The pilot was designed with a rider paying the first $2.00 of the trip; the MBTA paying up to the next $13.00 of the fare being charged by the TNC; the rider paying any overage (above $15.00); and the TNCs billing the MBTA for its share of the fare. The customer fare would be paid by a credit card or debit card; neither Uber nor Lyft accepts cash. Unbanked riders could also use cash to buy gift/cash cards which could then be loaded onto the apps. Trip limits were imposed: 20 trips per month for all riders. On-demand trips were booked primarily via special Uber and Lyft apps, but as mentioned above, a call-in option was available but only from Lyft; see Figure A-3.
During the pilot period, WAV service was provided through subcontractors. Uber used accessible taxis through its UberACCESS program, with Uber incentivizing drivers of accessible taxicabs to participate in the program, while Lyft used a third-party WAV carrier.
The Lyft subcontract was interesting in that the subcontractor, an NEMT provider, made WAVs available but on a dedicated basis and was paid by the hour. This proved to be very expensive for Lyft given the payment it was getting from the MBTA and so Lyft eventually got out of the contract and found other arrangements, with the MBTA providing a contractual incentive to encourage an increase in the WAV supply for Lyft.
Also during the pilot period, the MBTA streamlined the sign-up process, simplified the way riders could contact Uber and Lyft, while customizing customer communication and messaging to include in-person, email, app-based, and web-based options as well as automated call-outs.
Approximately 13,000 total trips were served on the TNCs through mid-March 2017. Less than 1% of the trips required WAVs. The average subsidy per trip (the MBTA’s share of the fare) was $9.00. The average amount of the customer fare (plus overage) was $4.50 indicating that many of the trips were longer than the $15.00 (and $13.00 subsidy) allowed. And response times were as low as 5 minutes in The RIDE’s Core Area compared to the 30-minute pickup window of The RIDE.
In addition to the rave reviews (see the Rider Feedback section below), two major accomplishments of the pilot prompted the MBTA board to authorize the conversion of the pilot to an on-going program:
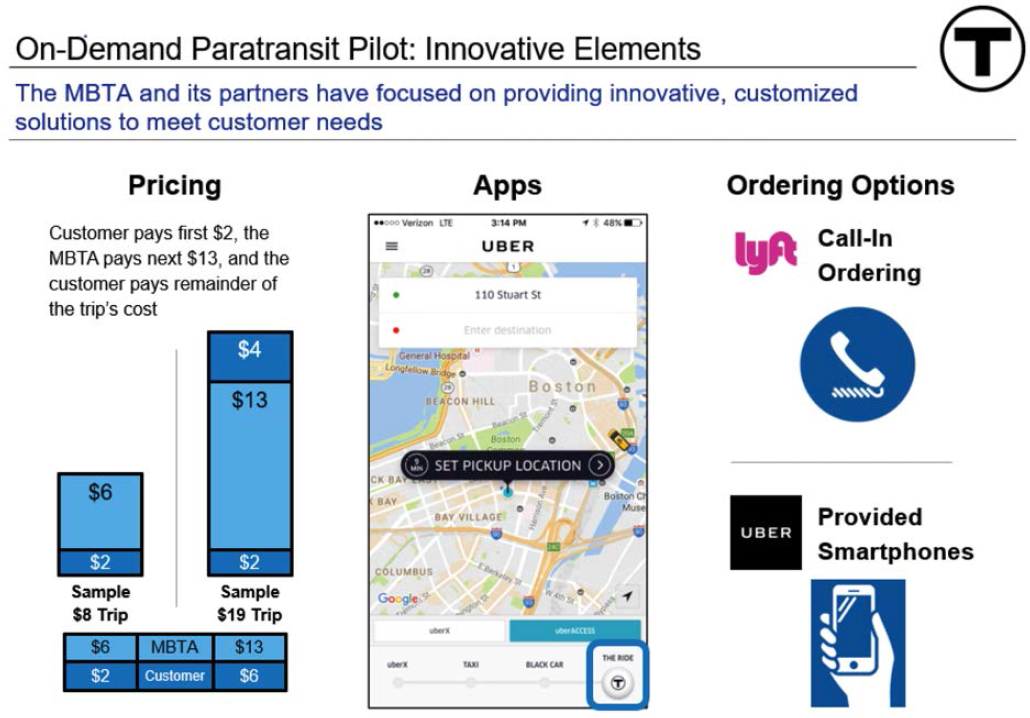
Figure A-3. Elements of the on-demand paratransit pilot.
- The average use of The RIDE by program participants decreased by 20%.
- There was 6% reduction on the cost per trip when considering all participants’ trips (on The RIDE and on the On-Demand program); the fact that there was only a 6% cost reduction was explained as a direct result of the trip cap.
However, the board also made some changes.
Evolution of the On-Demand Program
In May 2017, the MBTA’s board of directors approved expanding eligibility for the on-demand pilot program to all customers of The RIDE. This led to an influx of hundreds of new customers registering for the program.
Along with expanding eligibility, the MBTA concurrently changed the ground rules for limiting the number of trips per month. Instead of allowing a blanket 20 trips month for each program registrant, the MBTA limited trips based on a rider’s history of using The RIDE. The concept underlying this new strategy was to not subsidize the (non-MBTA) TNC trips that the riders were probably already making on TNCs and to limit subsidy of “new” trips versus trips that would otherwise have been made on The RIDE. By doing this, the MBTA would have a better likelihood of reducing the overall unit cost of transporting its RIDE customers and using these cost savings to be able to better address the growing demand for services and rising costs. So initially, riders who barely used The RIDE (if at all) were limited to two trips per month, while heavy users of The RIDE were allowed to make 20 trips per month. These monthly limits were later expanded to a larger, more graduated set of limits: 2, 10, 20, 30 and 40, again based on the rider’s use of The RIDE.
The board also approved a concurrent increase in the maximum subsidy per trip. In addition to the base rider fare, the MBTA originally subsidized the rest of the fare up to $15. This was increased to up to $40, again requiring that for longer trips, the rider was responsible for any fare overage. This increase in the subsidy opened up mobility opportunities for program registrants; now there are over 5,000 registrants signed up for the program.
In addition, a shared-ride option, UberPool, was introduced as an option at a lower rate – where a rider could wind up sharing the ride with a non-MBTA-sponsored rider.
A year later, in May 2018, a third provider option, Curb, was added to Uber and Lyft. Curb is a taxi broker app with access to taxi companies, some of which had wheelchair-accessible taxicabs. Curb basically gets paid via a portion of the fare payment made to the participating taxi company.
However, with the advent of COVID, demand for On-Demand taxi trips decreased; it was never substantial to begin with, possibly because riders were already used to trips with Uber and Lyft. As a result, the portion of the fare from the reduced number of trips was not enough to cover Curb’s costs, and Curb pulled out of the program in March 2020.
Provision of Wheelchair-Accessible Service
Over time, Uber and Lyft also changed the way they made WAV service available. In 2019, both Uber and Lyft had entered into contracts with two national operations/management companies (neither of which were involved in providing service for The RIDE). These contracts involved a combination of service paid by the hour and by the mile, where the subcontractors were “on-call” for Uber and Lyft. But in 2020, with the advent of COVID, both subcontractors ended their contracts. Since then, Uber and Lyft have taken different approaches to meet their WAV responsibilities. Uber entered into a contract with an NEMT provider; however, this did not work out, and Uber has since entered into a new subcontract with another NEMT provider. Meanwhile, Lyft has been partnering with individual WAV providers. Currently, approximately 1,000 hours of WAV service through Lyft and Uber is provided per week.
Rolling New Provider Options Pilot into the On-Demand Program
In April 2019, the MBTA launched another program involving Lyft and Curb. With this program, called the provider options pilot (or POP), a rider, via a separate rider opt-in agreement, would allow the TRAC staff to either schedule the rider’s ADA paratransit trip in the usual fashion (on a RIDE vehicle) or to assign the rider’s trip to an Uber or Lyft vehicle instead. In doing so, the rider is giving permission to the MBTA to convert the trip from an ADA paratransit trip to a non-ADA paratransit trip. Either way, the rider’s fare is same as the one-way fare for The RIDE, at time of writing $3.35 or $5.60 for a premium trip, with the fare deducted from the customer’s fare account in the booking process. Uber and Lyft then bill the MBTA for the full amount of the TNC fare, recognizing that the MBTA has already collected the rider fare. Hence, the subsidy that the MBTA is responsible for is the TNC fare minus the rider prepaid fare.
This program was consistent with the MBTA’s long-term cost reduction strategies for The RIDE—using nondedicated service to better cover certain trips, such as trips during peak times and during low-demand periods, and reemerging no-show trips that would adversely impact the dedicated fleets’ productivity. And key to this strategy was to establish a third-party call center as this could be done objectively compared to the preceding model for The RIDE where scheduling and dispatching was the province of zoned carriers.
POP was piloted from April 2019 through March 2020, after which the program was dormant until it was rolled into the on-demand program via The RIDE Flex.
That same month, in March 2020, the MBTA issued an RFP for the two programs: on-demand and POP. The contract term would begin June 1, 2020, and end on June 30, 2023, with two 1-year
options, running from July 1, 2023, to June 30, 2025, each to be exercised separately at the sole discretion of the MBTA.
Interestingly, the concept of retaining nondedicated service providers to provide both services by way of a single contract was accompanied by one rider opt-in agreement also covering both elements (on-demand and POP). The combined program was rebranded as The RIDE Flex. In addition, with these two programs combined and one rider opt-in agreement covering both elements, a rider could continue to access Uber or Lyft for on-demand trips through their apps and through Lyft’s call center.
And a new policy was added: a rider reserves the right to opt out for any given trip. If a rider opts out, the trip is scheduled onto a RIDE vehicle (and remains an ADA paratransit trip). Thus, if a rider was not interested in this “reassignment” onto a TNC, they would have to opt out for each trip. That said, the MBTA reports that since most riders who sign the agreement are used to riding TNCs for their on-demand trips, they are comfortable with these reassignments.
Current Design: The RIDE Flex—RFP, Contract, and Trip Reporting Details
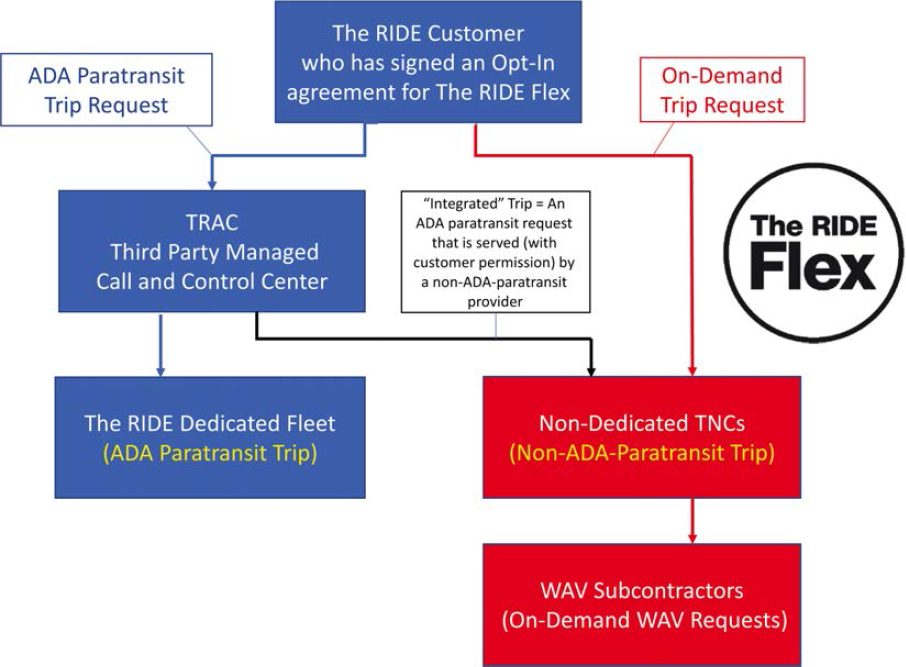
The March 2020 RFP for the two services and the rider opt-in agreement are in Appendix B. In the RFP, the MBTA identifies alternative service trips (booked directly with the TNCs) as “on-demand” trips and trips assigned by TRAC to TNCs as “integrated” trips, as depicted in Figure A-4.
In the RFP, the MBTA requires (at least) monthly reporting of on-demand trips for performance monitoring purposes. These requirements included the following data for each on-demand trip:
- Unique RIDE customer identification number (assigned by MBTA)
- Pickup location (specified to, at a minimum, five-digit latitude/longitude and zip code)
- Drop-off location (specified to, at a minimum, five-digit latitude/longitude and zip code)
- ETA (specified as the estimated elapsed time between RIDE customer submitting the request for an on-demand trip and the anticipated pickup time, to the nearest minute)
- Actual pickup time (specified as the time of vehicle arrival at pickup location, to, at a minimum, hours and minutes local time)
- Actual drop-off time (specified as the time of vehicle arrival at drop-off location, to, at a minimum, hours and minutes local time)
- Whether trip was booked as a shared trip or unshared trip
- Vehicle type (e.g., sedan, WAV)
- Total on-demand trip cost
- Any fees (if applicable), including cancellation fees, no-show fees, wait fees, etc., or any tips paid by RIDE customer, that make up any part of the total on-demand trip cost
- Total on-demand trip mileage (specified to the nearest 0.1 miles)
- Total on-demand trip duration (specified to the nearest minute)
- MBTA subsidy amount
- Co-pay amount
In addition, on-demand trip reporting was also to include total cancellations by vehicle type.
In the RFP, the MBTA also requires (at least) weekly reporting of the integrated trips. These requirements included the following data for each integrated trip:
- Unique trip identification number (initially assigned by TRAC)
- Pickup location (specified to, at a minimum, the pickup zip code)
- Drop-off location (specified to, at a minimum, the drop-off zip code)
- Dispatch time (the hour and minute when the vehicle was assigned the trip)
- Actual pickup time (specified as the time of vehicle arrival at pickup location, to, at a minimum, hours and minutes local time)
- Actual drop-off time (specified as the time of vehicle arrival at drop-off location, to, at a minimum, hours and minutes local time)
- Whether trip was booked as a shared trip or unshared trip
- Vehicle type (e.g., standard sedan, WAV)
- Trip outcome (e.g., completed, RIDE customer no-show)
- Total accepted trip cost
- Any trip fees (if applicable), including cancellation fees, no-show fees, wait fees, etc. that make up any part of the total accepted trip cost
- Total accepted trip mileage (specified to the nearest 0.1 miles)
- Total accepted trip duration (specified to the nearest minute)
However, in the eventual contracts, both Uber and Lyft refused to provide exact origin and destination information, the duration of each trip, and the data from which a response time could be calculated, according to MBTA staff. Also, in the interview with the MBTA staff, it was stated that the contracts have evolved over time to meet certain needs. For example, to meet its service equivalency responsibility, the MBTA pays for a certain number of WAV service hours, whether or not the vehicle is in actual service or available to a nonambulatory customer and whether or not the rider is an MBTA paratransit customer. This hourly payment takes the place of subsidy payments for MBTA-sponsored trips (for trips from both programs). This WAV service is invoiced separately.
Operating Data, Service Equivalency, and Financial Data
In 2019, when only the on-demand service was complementing The RIDE, the on-demand service providers (Uber and Lyft, and to a much smaller extent Curb) provided 260,914 trips. Over the years, the split between Uber and Lyft was essentially even, ranging between 45% and 55%.
Of the 260,914 trips in 2019, 241,741 trips (92.7%) were served in sedans and 19,173 (7.3%) were served in WAVs, with Uber serving slightly more WAV trips than Lyft.
To be able to gauge service equivalency, the TNCs report on WAV performance, providing average response times for WAV trips. The data reported to the MBTA has consistently shown the average WAV response times to range between 10 and 15 minutes. Based on discussions the MBTA has had with the FTA, this met the comparability definition of service equivalency.
The MBTA’s total subsidy for 2019 was $4,019,914 which equated to $15.41 per trip.
Of the 35,000 active customers of The RIDE (which the MBTA defines as having taken a trip in the last two years), approximately 5,000 riders are now registered for The RIDE Flex. MBTA staff also reports that approximately half of those 5,000 riders avail themselves of the on-demand program in any given month.
Achievement of Goals and Objectives
As discussed previously, the MBTA’s stated goals for its alternative service were to reduce demand for The RIDE, to reduce the overall cost of transporting paratransit customers, and to provide more mobility for paratransit customers.
To assess whether the transit agency’s goals have been achieved, the MBTA provided Figure A-5, which was presented to the MBTA board in November 2020, comparing the baseline prepilot annual ridership and cost figures with similar statistics from the on-demand pilot years. The takeaways from Figure A-5 are (1) the comparative operational per trip costs between The RIDE dedicated service versus the on-demand program were $56.62 per trip versus $15.92 per trip; (2) more customers were taking trips (1.07 million trips versus 710,000 trips per year) thanks to the alternative service; and (3) total costs were reduced by $1.1 million. Hence, there was a 3.3% reduction in operational costs while total ridership increased by over 50%.
Additionally, the MBTA calculates mode shift from The RIDE to the TNCs participating in The RIDE Flex in order to calculate cost reduction. The mode shift and therefore the cost reduction
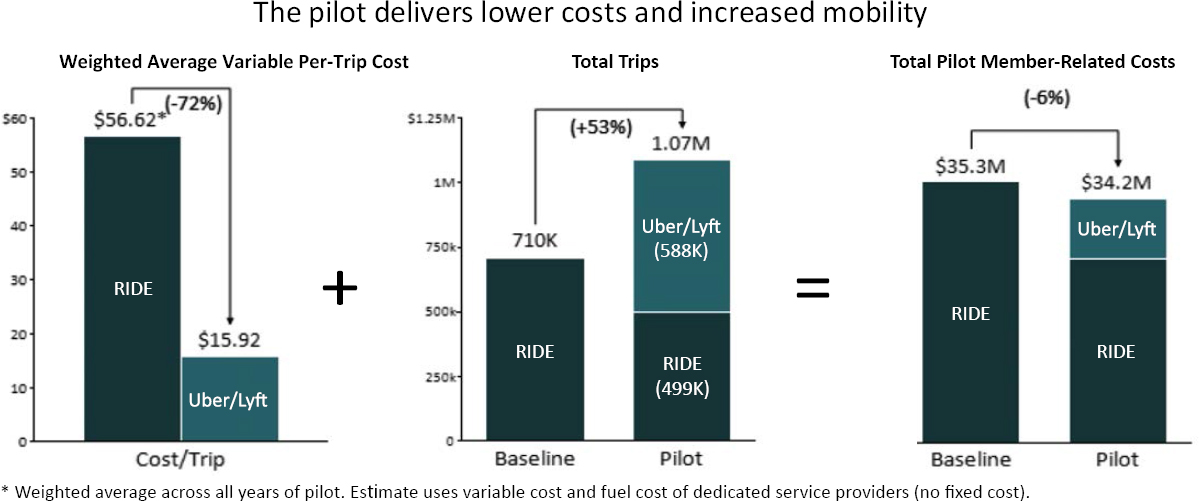
Figure A-5. Comparative ridership and cost.
associated with the “integrated” trips is a fairly easy calculation because both the trips shifted by TRAC and the resulting TNC costs of those trips are known.
The mode shift and cost reduction associated with the on-demand service is more complicated because it first must be determined how many of the on-demand trips would have been taken on The RIDE versus “induced demand” of other trips that would not have been taken on The RIDE, such as trips triggered by needs that emerge on the day of travel. To do this, the MBTA staff first projects out what program registrants’ future usage of The RIDE would have been if The RIDE Flex and its on-demand program did not exist. The projections reflect what the MBTA calls a “fade rate” which reflects the average decrease in an individual’s use of the ADA paratransit service.
The MBTA’s analysis of ridership data for The RIDE indicated that an average rider’s use of The RIDE decreases by 17% from year 1 to year 2, by 7% from year 2 to year 3, by 4% from year 3 to year 4, and by 0% thereafter.
The MBTA’s method to estimate cost savings is:
Step 1: As a baseline, calculate for each participant what would have been their “future” use of The RIDE, using the fade rate (see above), and starting at the point where each rider signed up for the on-demand program.
Step 2: For each participant and per year, calculate the difference between total trips taken on The RIDE + on-demand and the future estimated use of The RIDE. This difference equates to the number of induced trips on on-demand.
Step 3: Subtract the number of induced trips from the total on-demand trips. This difference equates to the number of “mode shift” trips.
Step 4: Calculate the difference between The RIDE’s average cost per trip and the on-demand service’s cost per trip and multiply that by the number of mode-shift trips (from Step 3). This estimates the cost savings from the mode shift.
Step 5: Calculate the additional subsidy associated with the induced trips by multiplying the on-demand’s average cost per trip by the number of induced trips (from Step 2).
Step 6: Calculate the net cost decrease or increase by comparing the cost savings from the mode shift (from Step 4) with the additional subsidy (from Step 5). This unveils whether there has been a reduction or an increase in costs.
The MBTA does this calculation for each registrant. On average, and consistent with the statistics in Figure A-5, the MBTA found that the on-demand registrants were taking approximately 50% more trips in total, compared to the forecast number. The MBTA further calculated that overall impact for just the On-Demand program, using the method above, was an overall savings of 3%. For the MBTA, this was a win because the MBTA was able to offer an on-demand mobility to its ADA paratransit customers at no additional cost; and in fact, it slightly reduced the overall cost.
As of March 2022 when this case study was completed, the MBTA had not yet done a similar analysis on the results of shifting the “integrated” trips to TNCs, but for these trips, there clearly will be an additional cost reduction.
Rider Feedback: Testimonials and Interviews
Feedback from riders participating in the initial on-demand pilot was overwhelmingly positive:
- “My experiences have been great. The drivers are pleasant, friendly, helpful (I use a rollator), and are excellent, safe and considerate people.”
- “The on-demand feature eliminates having to schedule a day ahead. Not to mention the price is very affordable. I am on a fixed income and could never afford to take a cab every time I need to travel.”
- “The best parts of the program are flexibility (go when I want to go), convenience (no cash needed), speed (short wait time compared to taxi), and cost (most of my trips have been quite local, so I paid only $21).”
- “I am participating in the [on-demand paratransit] pilot program. I cannot begin to describe how thrilled I am with this service. It has given me back something I lost a couple of years ago and thought I would never have again—a sense of independence.”
- “[Due to my disease, I can] no longer drive or use public transportation. I have been using The RIDE for a couple of years but have only been going out for medical appointments because it is so time consuming and exhausting due to my medical issues. For all intents and purposes, I have pretty much been housebound due to the constraints of The RIDE.”
- “The last trip I took using the regular RIDE service was for a 10-minute doctor’s appointment, but the traditional RIDE service requires you to stay at your destination for one hour. The RIDE scheduled me for a 3:01 p.m. pickup and it arrived at 3:17 p.m. It made several other pickups and drop-offs while I was on the van and I arrived home at 4:30 p.m. So a 10-minute doctor appointment took almost four hours roundtrip on The RIDE. With the pilot, that same trip and appointment took less than one hour from the time I left my house until I arrived home.”
- “The great thing about the program is if I feel well enough to go out to a store on the spur of the moment, I can go within minutes. I do not have to plan ahead. This is especially helpful when I have urgent doctor visits that cannot be scheduled a day in advance. I am able to go pick up prescriptions in a matter of minutes instead of scheduling a day ahead and spending hours on that errand using The RIDE.”
- “I just want to thank you for allowing me to use this pilot program and I hope it becomes available to all RIDE clients. It has improved my quality of life and given me back some of the autonomy and freedom that my disease took from me. Thank you!”
- “Since signing up for the pilot, it has bettered my life. It has given me the chance to get out and do things I couldn’t before. My world has expanded. I can run errands on a moment’s notice, visit friends more, and can be flexible with appointment changes.”
For our research project, the MBTA attempted to recruit participants for focus groups; however, the efforts resulted in only two participants, who were interviewed separately. One of the riders had participated in the on-demand program since 2017 after the eligibility had been expanded—he had previously been on the waiting list. The second rider joined the on-demand program in the summer of 2020 before it was combined with POP to become The RIDE Flex. Both riders use Uber. One of the riders is legally blind and ambulatory. The second rider, a teacher, registered for the service after a car crash that left him disabled and temporarily needing a wheelchair for about 10% of his trips.
Neither of the two riders use The RIDE at all, so their usage of the on-demand program is quite limited, and they thus have not experienced the POP element of The RIDE Flex at all. The first rider primarily doesn’t use The RIDE because he prefers to use fixed-route transit, but since the frequency of the routes serving his area are 1 hour, he will supplement that service with the on-demand program, mostly using it for shopping or to visit friends, either from his home or from a bus stop or T station (to lessen the Uber fare). The second, younger rider, chooses to use the on-demand element of The RIDE Flex because he was used to doing things on the spur of the moment before his accident and had used Uber before. For a while, he was using the on-demand service to get to work. For him, relying on a service that required a next-day booking was unthinkable; he would find a resource other than The RIDE if the on-demand program did not exist. And so, for both of these riders, all their trips are induced and do not reflect a modal shift.
There was a mixed response to the onboarding process. While both had smartphones, the rider with the vision disability experienced some difficulties but eventually got the hang of it. This rider also mentioned challenges when the design of the app changes. This rider also noted that Uber does not have a call center as a backup, which was confirmed by the MBTA. This rider also was unaware that Lyft has a call center—he believed they did not—so did not view switching to Lyft as an option. The second rider had an easier experience in downloading and using the app.
For both riders, the best attribute of the program was the ability to make an immediate-response trip, both stating they felt more independent. The rider with the vision disability specifically mentioned that the service offered the nearest thing to being able to drive and gaining the independence that offers. Both mentioned common response times of 5–10 minutes; anything longer was very rare.
Lessons Learned and Ongoing Challenges
- Get involved with your rider advocacy groups early and often as you begin to think about these sorts of service—it’s not useful if it’s not something customers want.
- Have a firm idea of what you are trying to get out of the program and who you are trying to support by implementing a program of this type.
- Be open to revising contracts as the need arises; this was exemplified by the ongoing challenge of providing WAV service which has been a priority for the MBTA and has been illustrated by putting pressure on the TNC contractors to be opportunistic in the way they provide WAV service.
- Don’t be particularly exclusive when it comes to using nondedicated service providers. In the case of the MBTA, it put out the RFP to any nondedicated service provider and for a while used Curb.
- It’s okay to compromise on data requirements, if you feel that you have what you need in the way of data to be able to monitor the performance of your alternative service.
- If you wish to use Lyft and Uber, the taxi exemption provides a way to do this; however, you must have choice for all eligible and registered riders who wish to use the alternative service.
- Regarding the trip request process, in the case of the MBTA, this has been a challenge as only one of its TNCs (Lyft) has had a backup call center, noting that Uber is currently planning to provide this service through a new subcontractor.
- It’s okay if your required levels of vehicle insurance coverage limits are higher than what is required of drivers or independent contractors. The MBTA did require higher insurance levels of its TNC contractors, with the MBTA named as additional insured, and both of the TNCs rose to the occasion here by supplementing their drivers’ insurance coverage for MBTA-sponsored trips.
- Be open to innovation and trying new things to reach your objectives. Innovation led the MBTA to developing the joint opt-in agreement and joint contract covering both the On-Demand element and POP. The MBTA also developed what is probably the most accurate cost reduction estimation methodology for alternative services through ADA paratransit trip forecasting.
Contact
Massachusetts Bay Transportation Authority (MBTA)
10 Park Plaza
Suite 5610
Boston, MA 02116
(617) 222-3200
Broward County, FL: BCT Rider’s Choice Program
Background on the Transit Agency
Broward County Transit (BCT), a division of Broward County, Florida, serves a 410-square-mile area that includes Fort Lauderdale, the rest of Broward County and portions of Palm Beach County to the north and Miami-Dade County to the south, where it connects with Palm Tran and Miami-Dade Transit, respectively. BCT’s service area population in FY2019 was almost two million.
BCT’s services include:
- A 36-route local fixed-route bus network
- Two limited-stop fixed routes called The Breeze
- Five commuter express routes
- The Transportation Options (TOPS) service that provides both ADA paratransit trips and paratransit trips funded by Florida’s Transportation Disadvantaged (TD) program
- Rider’s Choice alternative service, which is offered to eligible ADA paratransit customers
In addition, BCT funds 18 community shuttles that provide neighborhood-based route-type service and connect to local fixed routes. These community shuttles are operated by local cities in partnership with BCT.
On the fixed-route service, the one-way adult cash fare is $2.00; pass options include 1-day, 3-day, 7-day, 10-ride, and 31-day passes. The premium express one-way cash fare is $2.65. Discounted Medicare/disability/youth/student/veteran fares are available. BCT also sells paper tickets and passes via its mobile ticketing app.
In FY 2019, the system transported 27.3 million riders. The fixed-route services accounted for 26.4 million of these trips, while the demand-responsive services accounted for 929,000 trips. In terms of ridership, BCT is the second largest transit system in Florida after Miami-Dade Transit.
BCT’s Transportation Options Service (TOPS)
BCT’s TOPS paratransit service provides shared-ride services to both ADA paratransit customers and to customers whose trips are sponsored by BCT’s state-funded Transportation Disadvantaged paratransit door-to-door program (TD program).
The state-funded TD program is a last resort program for individuals who do not have access to any other transportation resource. Florida Statute 427.011 defines the transportation disadvantaged population as “persons who because of physical or mental disability, income status, or age are unable to transport themselves or to purchase transportation and are, therefore, dependent upon others to obtain access to healthcare, employment, education, shopping, social activities, or other life-sustaining activities, or children who are handicapped or high-risk or at-risk as defined in s. 411.202.”
ADA paratransit trips and TD-funded paratransit trips are commingled on TOPS vehicles. Also, there are some ADA paratransit-eligible customers who are dually eligible for the TD program due to low income and not being able to afford the ADA paratransit fare.
TOPS is provided throughout Broward County, with connecting service to neighboring Palm Beach County and Miami-Dade paratransit systems. In addition to providing paratransit service within the ¾-mile fixed-route transit corridors, premium service is provided beyond these corridors. All trips outside the ¾-mile corridors are considered TD trips. Hence, ADA customers and TD customers may travel anywhere in Broward County. All customers may also be taken to paratransit transfer points to continue traveling on paratransit in neighboring counties.
BCT contracts out for its call and control center and operations functions. Reservations and scheduling are performed by a contracted call center management firm. Through January 7, 2022, payment to the call center contractor was based on a flat per-service-hour rate. The current contract has a fixed administrative fee plus a per-hour rate for variable costs. Formerly provided by two contractors, service delivery now is provided separately by one private carrier operating dedicated vehicles. The service provider is paid based on a per-completed-customer-trip rate covering variable costs, with fixed costs paid separately from variable costs and split into equal monthly payments.
The providers’ payment is also tied to performance incentives and disincentives. Service assets are split between the BCT and the contractor, with BCT providing the scheduling software (StrataGen’s ADEPT system), fuel, and the vehicles for the contractor. While dispatch is handled by the service provider contractors, the call center contractor provides some dispatching oversight and assistance, further allowing them access to vehicle location to assist with same-day issues.
TOPS service is provided Monday through Saturday 4:40–12:40 a.m., and Sunday 6:45 a.m.–10:15 p.m.; customers may contact the call center during the same time period. Advance reservations can be made from one to three days in advance; next-day reservations must be completed before 5 p.m. Same-day service is also available but on a space-available basis only and is not guaranteed. Also accepted are subscription trips, defined as two or more trips per week to the same location, and the same time, for a minimum four consecutive week period. While most customers choose to call the TOPS call center to book their trips, approximately 10% book their trips through the TOPS online trip scheduling portal.
Through an interactive voice response system, confirmation calls with specific 30-minute pickup windows are placed to customers the evening before the trip (typically between 5 and 9 p.m.). The pickup window for determining when a vehicle is on time is 0/+30. Additionally, an imminent-arrival call is placed to customers when the vehicle is approximately 10 minutes away from the pickup location. Door-to-door driver assistance is the standard level of driver assistance.
Standard ADA paratransit rider fares on TOPS are $3.50. ADA paratransit customers who are also honorably discharged veterans are charged half-fares of $1.75, but only to VA clinics in Broward County. In addition, other veterans may take trips on TOPS to the VA’s Kling Clinic at half fare.
As of 2019, there were approximately 16,000 customers determined eligible for TOPS, including 7,700 who were considered active riders, which for BCT was defined as taking at least one trip during the last 12 months.
As shown in Table A-1, TOPS FY 2019 ridership totaled 814,372 trips at a cost of $27.95 per trip. Its productivity was 1.57 trips per revenue vehicle hour (RVH). During the pandemic, direct
Table A-1. TOPS ridership, per-trip cost and productivity, FY 2019–FY 2021.
| Fiscal Year | Ridership | Cost per Trip | Productivity (Trips/RVH) |
|---|---|---|---|
| 2019 | 814,372 | $27.95 | 1.57 |
| 2020 | 525,244 | $34.95 | 1.36 |
| 2021 | 505,020 | $41.74 | 1.32 |
(exclusive ride) trips were instituted to promote safety through social distancing, which is the reason for the decrease in productivity.
Background and Planning of Rider’s Choice Pilot Program
In April 2016, the Board of County Commissioners directed BCT staff to explore the feasibility of using taxi services to provide supplemental on-demand transportation for ADA paratransit customers and to scan the industry for similar programs in assessing that facility.
Staff then investigated various models for an on-demand alternative service. This included reviewing the ADA for compliance issues for taxi subsidy programs, reviewing scopes of service from agreements used by other transit agencies with alternative service programs, and contacting those agencies to learn from their experiences. BCT staff also held a public meeting with local providers in July 2016.
In the end, staff concluded that a taxi subsidy program would be in the best interests of BCT and the best model to provide additional flexibility and mobility options to its TOPS customers at an equal or better level of service and a lower cost. It would also provide a source of demand for the vehicle-for-hire companies serving Broward County. To gauge interest in an alternative program, BCT staff identified customers that could be more effectively served by this type of service, while also evaluating the financial and operational feasibility of this particular model.
Key to the decision of using taxis for BCT’s alternative service was that the taxi industry was already providing wheelchair-accessible service. Broward County regulations (Section 22½-4 of the Code) state that the number of taxi certificates issued be based on population and that 3.5% of the total be WAV vehicles. Also, in May 2017, the county passed an ordinance to allow 50 wheelchair-accessible vehicle taxicab Certificates of Public Convenience and Necessity and an additional 50 regular, bonus certificates to be issued outside of the current ratio provided in Section 22½-4(b), and to implement procedures to ensure that the additional wheelchair-accessible vehicles would be available for passengers who require wheelchair-accessible vehicles throughout Broward County.
The Code also states that should the total number of taxicab certificates be increased to 914, then 32 wheelchair-accessible taxicab certificates would be made available. However, these 32 certificates are still outstanding, indicating that no new wheelchair-accessible taxicab certificates are necessary.
In April 2017, one year after the first directive, the board approved a plan to implement the Paratransit Rider’s Choice Pilot Program as a 12-month pilot. As part of this approved plan:
- ADA paratransit customers with the highest paratransit ridership were invited to participate, noting that the pilot program was limited to the first 150 ADA paratransit customers to apply.
- Pilot program registrants would be given a fare payment card and a list of contact numbers for local taxi companies and TNCs.
- Riders would book their trips trip directly with a taxi company or TNC of choice by calling or using a provider app.
- Riders would be able to book and take their on-demand trips 24/7. They could also access a taxi at a taxi stand or by hailing.
- Riders could also book advance trips if permitted by the taxi company or TNC app.
- Trip origins and destinations would be limited to Broward County.
- For all trips, there would be no base fare. BCT would pay the provider up to $15 per trip, with the rider responsible for any fare overage which could be paid in cash or by personal credit/debit card.
- There would be a limit of two trips per day per rider.
As part of the pilot program design, it was necessary to identify a vendor that could provide riders a fare payment card system with the necessary security and administrative control features to make the program a success. BCT’s required capabilities included:
- Limiting the card to transactions for a merchant code specific to taxis and TNCs and disallowing cash withdrawals.
- Limiting the transaction subsidy amount to a maximum per ride (in this case $15).
- Limiting the number of transactions allowed per day (or other time period) or limiting the aggregate number of transactions to a maximum per month (or other time period).
To find such a vendor, BCT issued a request for letters of interest (RLI) in June 2017 for payment card services. The purpose of this solicitation was to engage the services that would allow issuance of open-ended payment cards for the purchase of transportation services from the local taxi and transportation network company industry. Qualified paratransit program participants would be issued subsidized transportation payment cards as an incentive to reduce the use of the more costly paratransit service by using alternative vehicle-for-hire transportation services. Participants would be allowed to charge a maximum of $15 per single transaction.
This RLI was primarily aimed at banks who would issue limited-use credit cards, i.e., limited to vendors with taxi/limousine MCC codes. However, no banks responded to the RLI. As a result, BCT staff then investigated closed-loop payment solutions.
The investigation led to discussions with CabConnect, Inc., which had experience with taxi-based user-side subsidy programs. BCT’s board approved the contract with CabConnect in December 2017, and in January 2018, BCT entered into a contract with the company (see Appendix B). After CabConnect performed the appropriate mobilization efforts, and with the 150 riders in place and with fare payment cards, the pilot was launched in February 2018.
The CabConnect system is a payment system that works though an API link with backseat credit card processing technology companies, such as Verifone that have point-of-sale (POS) devices in the backseat; see Figure A-6.
As part of this service model, BCT has no contracts with the transportation providers; instead, BCT has one contract with CabConnect. CabConnect invoices BCT using trip data for the cost
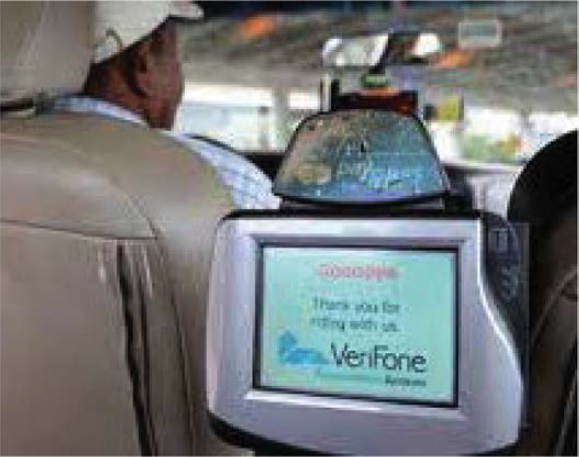
Figure A-6. Backseat point-of-sale device.
of each trip (not to exceed subsidy limit). BCT then pays CabConnect, and CabConnect pays the transportation companies.
Note that CabConnect actually has two types of fare payment systems: one that supports more traditional user-side subsidy programs, and another that supports the service model described above. With the Broward County model, the card identifies the card holder as an eligible rider when the fare payment card is swiped at the end of the trip, and CabConnect then takes over, interacting with the taxi provider’s backseat POS device to track the trip and the fare transaction, and where BCT currently pays up to the first $18.00 of the fare and the customer paying any overage.
The card also recognizes how many trips riders have already taken versus the allotted two trips per day; as a result, at the end of third trip, the rider would be required to pay the full fare.
While invited by BCT to participate, no TNCs opted to join the pilot program, and so the only transportation providers that participated in the pilot were taxi companies.
Evolution of the Rider’s Choice Program: The Current System
The pilot program was originally meant to be 12 months, but at the January 2019 meeting, BCT’s board approved the continuation of the pilot for an additional 2 years. During this extension, staff looked to expand the program by increasing enrollment; the per-trip subsidy was increased from $15 to $18 (that took effect in April 2019; see Figure A-7); and staff was to evaluate the feasibility of using the payment card system to collect paratransit fares in addition to cash payment. The agreement with CabConnect, Inc. was subsequently extended.
All the other program’s ground rules from the pilot remained in place, except for one having to do with eligibility. In January 2019, the 150-enrollee cap was eliminated and the program was opened up to all ADA paratransit-eligible customers. In addition, once enrolled, there is no minimum trip requirement on TOPS needed to maintain Rider’s Choice eligibility; a rider need only remain ADA paratransit-eligible. In January 2021, the pilot became a permanent program.
As listed on BCT’s website, there are 17 taxi companies in Broward County, and all but four have WAVs. However, virtually all of these companies have been affected by COVID in terms of number of drivers available, leaving only the larger companies with the capacity to service most of the trips.
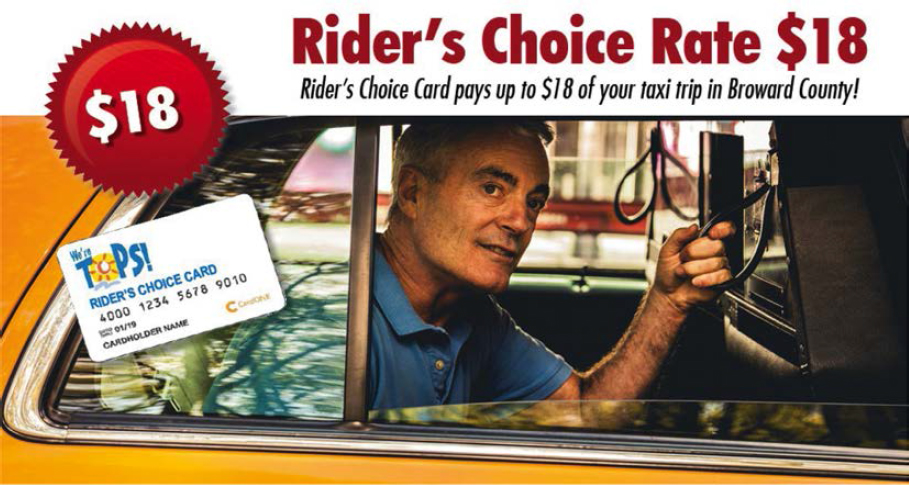
Figure A-7. Marketing for BCT’s Rider’s Choice Program.
The new agreement with CabConnect will include approximately $180,000 paid to CabConnect for administration and cashiering services, and a potential pass-through amount of close to $3,000,000 to be paid to the participating taxicabs and TNCs in Broward County who provide the trips. CabConnect provides an open interface for any taxi company or TNC who wish to use the card processing solution to accept the Rider’s Choice payment card.
BCT staff also indicated Uber has a new interest in being able to transport Rider’s Choice participants. BCT referred Uber to CabConnect to certify its system compatibility with CabConnect’s system.
Operating and Financial Data (2018–2021 Program Years)
As part of preparing this case study, operating and financial data was collected for the last four program years, beginning in February 2018, and noting that the expanded eligibility took place in the second year of the program.
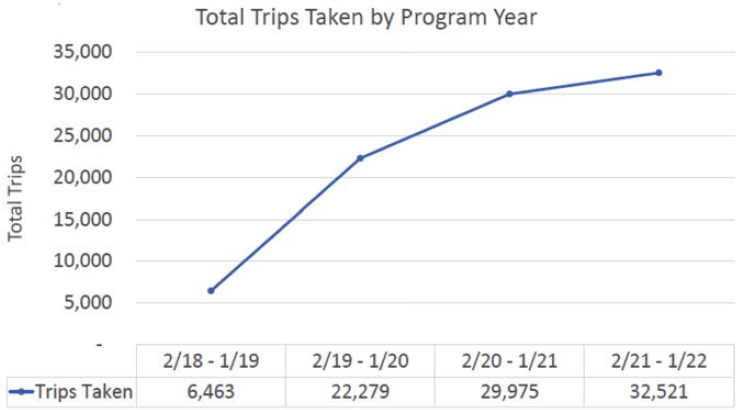
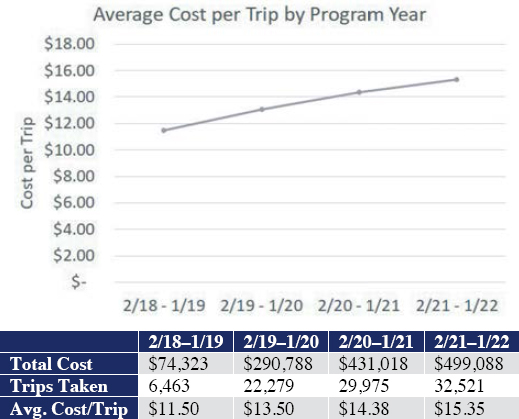
Figure A-8 shows the annual ridership for each of the last four program years of Rider’s Choice. The first-year ridership of approximately 6,500 trips was a result of slow enrollment in the pilot program. Ridership then quadrupled to nearly 22,300 trips. From there, ridership has steadily increased as both the number of participants and trips per registrant climbed. For example, from the 2019 to 2020 program years, the number of clients increased by 17% while ridership increased by 34%. A more modest increase is seen in year 4.
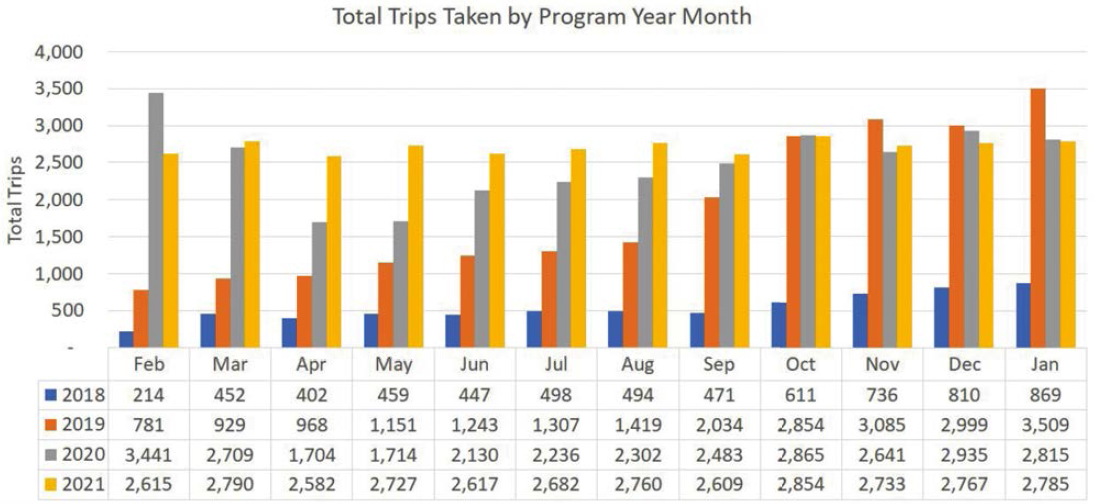
Figure A-9 shows the month-by-month ridership for the last four program years, noting again that enrollment in Rider’s Choice opened up in January of 2019. There was also a significant ridership reduction in April and May 2020 undoubtedly due to the reduced trip-making related to the COVID-19 pandemic. But that steadily rebounded, somewhat leveling off in 2021 between 2,582 and 2,854 trips per month.
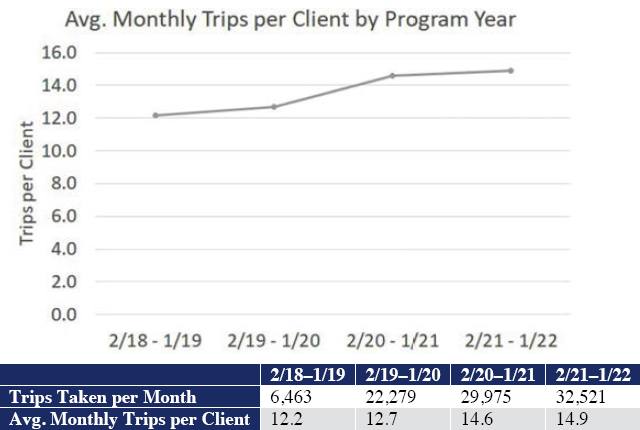
Figure A-10 shows average monthly trip-making per participating rider. This graph shows a steady increase in trip-making, ranging between 12.2 trips per month in the first year of the program and 14.9 trips per month in the last year. This averages out to about a 7% annual increase in trip-making.
Figure A-11 shows average subsidy per trip. The cost increase from year to year, averaging about a 10% annual increase, suggests that either the average trip length (not tracked) is increasing or the fare rate is increasing or both. Note that the maximum subsidy increase from $15 to $18 took place in April 2019.
Achievement of Goals and Objectives
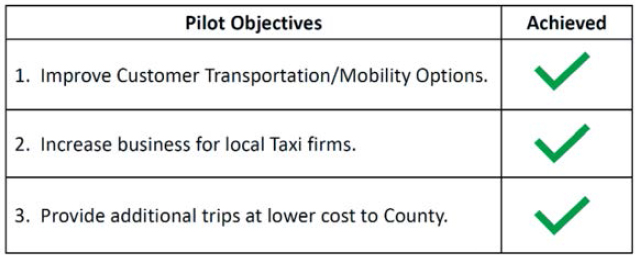
BCT’s stated goals for Rider’s Choice were (1) to provide an on-demand/same-day mobility option for paratransit customers, (2) to increase business for local taxi companies, and (3) to reduce overall cost and/or unit cost per trip of transporting paratransit customers. From BCT’s perspective, all three goals have been achieved (see Figure A-12).
As part of the board’s initial approval and extension, BCT staff was required to perform a comprehensive review of the program at regular intervals to assess the program. This review included an evaluation of program participation, its impact on paratransit usage, level of administrative effort required, customer satisfaction, and cost effectiveness. The evaluation also included an analysis of each participant’s paratransit service use prior to and during the pilot to determine the extent to which the participant’s ongoing use of TOPS was reduced. The results of this review include:
- The number of program participants increased from 144 to 575 during the extension period. During the entire 3-year pilot period, 398 of the 575 participants have taken trips.
- Ridership for the 398 participants totaled 50,311 trips at a cost of $682,500, an average trip cost of $13.56.
- The TOPS system average cost per trip for the same 3-year period is approximately $26.03.
- This amounted to an average cost savings of $12.47 per trip for a total savings of approximately $627,378 for the 50,311 trips taken, assuming the trips would otherwise have been taken on TOPS.
As noted in the fourth bullet above, the savings are calculated by determining an equivalent cost if all Rider’s Choice trips had been made on TOPS. However, this may not be an accurate accounting of true savings because:
- The input from the focus groups (see the Rider Feedback section below) suggests some of the Rider’s Choice trips would not have been made on TOPS if the Rider’s Choice program did not exist; many of these trips stem from same-day needs (TOPS reservations must be made by at least 5 p.m. the day before the trip).
- The Rider’s Choice program allows for 24/7 service, i.e., the program offers service at times when TOPS is not operating.
To get an accurate accounting of savings, BCT would need to weigh the additional subsidies associated with these induced trips.
Rider Feedback
For this case study, BCT staff invited all Rider’s Choice customers via email or letter to participate in the virtual focus groups with the understanding that space was limited and the customer had to opt in by contacting BCT to participate.
BCT staff coordinated four focus groups with a collective 23 riders who had a Rider’s Choice card. The first two sessions, with 7 and 5 participants respectively, were held January 20, 2022, at 2 and 6:30 p.m. local time for riders who had taken 28–1,555 trips, while the second two, with 4 and 7 participants respectively, were held January 25, 2022, also at 2 p.m. (riders who had taken 0–7 trips) and 6:30 p.m. (riders who had taken 0–639 trips). The evening sessions were designed to get the input of riders who worked or were not available during the day.
There was a wide range of participation in Rider’s Choice among the 23 participants, some joining the program at its inception and others joining the program only recently. Several of the 23 participants are blind or have visual impairments. Two participants require WAV service. Most stated that they had been in the program for 1–2 years. There was also a wide variety of program usage: some had not taken any trips while others had taken hundreds, some making only a few round trips in a month and others making up to 20 round trips per month, remembering that Rider’s Choice has a 2-trip daily limit.
The following is a synthesis of the focus group discussion:
- All but one of the focus group participants were very appreciative of the Rider’s Choice program and BCT’s program management. The most mentioned reasons were (1) the convenience/independence of being able to make spur-of-the-moment trips, (2) when there were more taxis around, they wound up waiting less versus TOPS, i.e., it was comparatively more convenient, and (3) being able to make the shorter (under $18) trips for no fare. The one participant who had a difficult time with the program was the participant who required WAV service.
- One participant indicated that she preferred the Rider’s Choice program to TOPS because she cannot afford the $3.50 TOPS fare for all her trips and because she perceives that TOPS service has reliability issues. Most of the participants also preferred the comfort of the taxicab sedans over the seats in the TOPS vehicles.
- Most of the participants indicated that any differences between the TOPS drivers and the taxi drivers were negligible. One participant noted that there was a wide range of good and not-so-good TOPS and taxi drivers.
- One participant who is blind commented that the most discernible difference between the two services’ drivers was that taxi drivers rarely get out of their taxicab to identify the rider and assist them to and into the vehicle, although the participant added that this is not a deterrent to his using the Rider’s Choice program.
- A few of the participants indicated there have been language barriers with some taxi drivers. A few of the participants also mentioned a common driver excuse for being late, that the rider was “not at the pickup location,” when the rider was present the whole time waiting. Some riders who have had bad experiences with drivers have called the company to request that those drivers not be dispatched to serve their trips.
- Another participant, who requires a WAV, gave up on the program because she was unable to book WAV service when she needed it. She mentioned that a taxi dispatcher told her that to get WAV service she would need to book a trip with 24 hours’ notice, which defeated the purpose of an on-demand program.
- Most of the participants indicated that if Rider’s Choice didn’t exist, they would probably have used TOPS for many of their trips, but also indicated that their spontaneous trips would likely not have been taken at all or would have used another resource. Two of the riders specifically mentioned a related altruistic reason for using Rider’s Choice: they didn’t wish to “divert” a TOPS WAV from somebody who needs it more when they can use a sedan just fine, noting that only one of the focus group participants required a WAV.
- Most of the riders use the program for shorter trips (under the $18 limit). Several wished the limit could be higher. Trips where there was an overage were less common.
- Several of the participants indicated that they use Rider’s Choice when TOPS is really late or when they have missed their TOPS return trip from the doctor’s because of appointment delays. Others would preemptively use TOPS to get to a doctor’s appointment and not book a return, and then use Rider’s Choice or self-pay Uber for the return trip. Several participants indicated they would use the Rider’s Choice program when they had forgotten to book a next-day trip. Many of the participants who also use Uber or Lyft occasionally (on an unsubsidized basis) as a mobility option wondered why Uber and Lyft weren’t participating in the program.
- There is a mixture of how the riders book their trips. While a few always call the taxi company dispatcher, most of the participants used different ways to access the program depending on the circumstances. They might call their favorite driver directly, or call the taxi company dispatcher, or use the taxicab company’s app. Several of the riders have been experiencing longer and longer hold times when calling the dispatcher and have consequently turned to the app to save time.
- A few of the riders reported that when booking a trip through the Yellow Cab dispatcher, the dispatcher asked them if they use the Rider’s Choice card. The riders felt this was inappropriate and they are being discriminated against. Their conclusion was that (some) drivers don’t like to serve these trips based on the following four possible reasons: (1) the drivers are not paid for the subsidized portion of the trip until the taxi company is paid; (2) the technology when swiping the card often does not work, which then requires the driver to call the dispatcher, a time-consuming process; (3) drivers have told riders that the drivers are charged a “processing fee” by the company for these trips; and (4) drivers have told riders that Rider’s Choice riders do not tip as well as nonsubsidized customers. Whatever the reason or reasons, several riders indicated that some drivers complain to them about the program and would prefer not to take these trips. Moreover, many participants felt that the dispatcher knowing that a request is coming from a Rider’s Choice rider may limit the dispatcher’s ability to dispatch the trip to certain drivers, which further exacerbates the response time issues.
- Most participants used Yellow Cab exclusively, because of the brand, because they were unsuccessful in booking other taxi companies (because they were unavailable when the rider wanted to travel) or because they were willing to serve a trip that originated at a location on the outskirts of the county.
- For most of the participants, response times have increased from 15–20 minutes pre-COVID to 30–60+ minutes. For participants living in Fort Lauderdale, the response time has consistently been 5–10 minutes. But those living farther away indicated response times as high as 2–3½ hours. Most of the participants indicated that they have placed single and multiple “where’s my ride?” calls 50% to 100% of the time. Most of the participants understood that COVID and other factors that have decimated the taxi industry are the root cause of the increase. The response times for riders on the outskirts of Broward County have incurred the more significant increases in response times, especially since, according to the focus group participants, there is only one company (Yellow Cab) now that truly serves the entire county. As a result of the increased wait times, riders indicated that they have been placing where’s-my-ride calls on a high percentage of their trips.
- In the face of longer response times for on-demand trips, some riders have experimented with booking trips the day before, but with mixed results in terms of the taxi arriving in a timely fashion.
- While the two-trips-per-day limit wasn’t terribly limiting for most, one of the riders came up with an idea of shifting the daily limit to a weekly limit at the same rate (14 trips per week). This would enable them to take multiple trips on a single day without increasing the budget. Most of the participants liked this idea.
- A few participants indicated that increasing the maximum per-trip subsidy would also help.
Lessons Learned and Ongoing Challenges
Rider’s Choice has been a win-win for Broward County and its ADA paratransit customers who have elected to use the program. It has met its goal of providing more mobility options for its ADA paratransit customers while reducing costs and giving taxi companies more business.
One of the lessons learned in Broward County was that when a transit agency elects to offer an optional taxi-based alternative service without any contractual controls over service quality, the success of the program is highly dependent on outside market forces that impact the quality of taxi service delivery. Such forces might contribute to a robust taxi industry, resulting in good service, or might lead to a taxi industry suffering from driver shortages, resulting in poor service. While taxis in Broward County are required to provide countywide service as a consumer protection provision tied to maintaining their certificate, the focus group responses seem to indicate that many of the taxi companies, because of driver ranks being depleted due to COVID, are unable to provide countywide service, or perhaps can provide countywide service but at response times that are unacceptable to many riders.
Based on rider feedback, there may only be one taxi company that chooses to respond in a reasonable time to an on-demand request for WAV service in the western part of the county.
To monitor these issues as the taxi industry rebounds from COVID and to monitor the impacts of Uber joining the program (if it does), the challenge will be to get the needed data.
Contact
Broward County Transit
1 N. University Drive, Suite 3100A
Plantation, FL 33324
(954) 357-8400
www.broward.org/BCT/Pages/default.aspx
www.broward.org/BCT/Pages/Paratransit.aspx
www.broward.org/BCT/Pages/RidersChoice.aspx
Flagstaff, AZ: Mountain Line
Background of Transit Agency
Established in 2001, the Northern Arizona Intergovernmental Public Transportation Authority (NAIPTA), branded as Mountain Line, is the transit agency serving Flagstaff and a portion of Coconino County in northern Arizona. The Mountain Line family of services includes fixed-route transit service, a ski express bus (called Mountain Express) to the Arizona Snowbowl during the winter, an ADA complementary paratransit service, an alternative service for ADA paratransit customers, and a vanpool program. Mountain Line also coordinates with campus shuttle service at Northern Arizona University. In FY 2019, the system transported 2.54 million riders, a growth of 250% since Mountain Line was formed as a regional transportation authority.
Mountain Line Paratransit (ADA Paratransit Service)
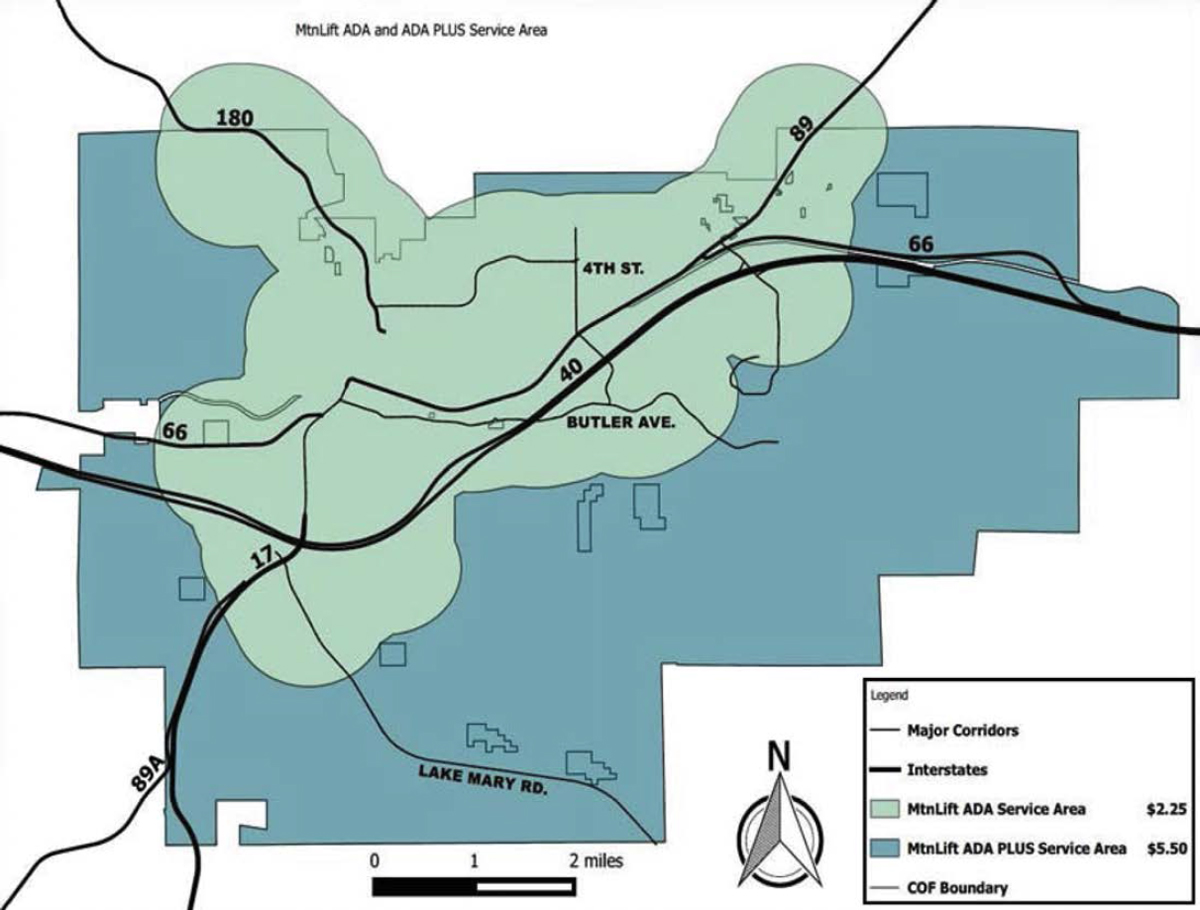
Mountain Line Paratransit (formerly known as Mountain Lift) is Mountain Line’s ADA paratransit service and is operated in-house with an eight-vehicle fleet and a peak pullout of seven vehicles (Figure A-13). Mountain Line Paratransit’s service days and hours mirror the service days and hours of the fixed route transit system. The one-way trip fare is $2.25.
Premium service (called ADA Plus service) is available outside the ADA paratransit service area to the city limits (see Figure A-14). The one-way fare for ADA Plus is $5.50. Punch cards of 10–20 rides on Mountain Line Paratransit are available. A 10-ride punch-card pass for ADA Plus is also available.
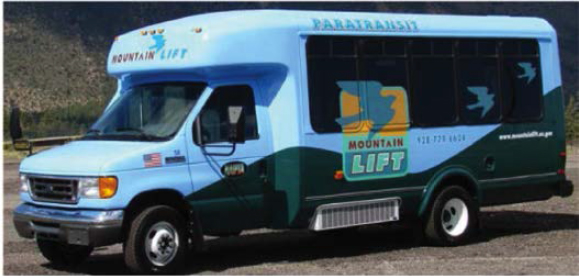
Figure A-13. Mountain Line Paratransit vehicle.
Advance reservations can made from 1 to 14 days in advance. There is also same-day service at no additional cost but on a space-available basis only. Up until September 2021, Mountain Line’s reservation agents, schedulers, and dispatchers had been using Routematch to perform daily functions, with service data collected and dispatcher-driver communication via driver tablets.
In September 2021, Mountain Line began using Spare Labs technology to support its ADA paratransit system. This was part of a larger effort that involved implementing a microtransit pilot in November 2021 and the use of Spare Labs’ technology to support both the ADA paratransit and the microtransit service.
Mountain Line Paratransit’s FY 2019 ridership totaled 19,765 trips; its productivity was 3.02 trips per revenue vehicle hour (RVH). At that time, there were approximately 426 registered customers, 200 of which were active riders, which Mountain Line defines as taking two or more trips per day.
Background, Planning, and Implementation
The origins of Mountain Line’s current alternative service, called the Paratransit Taxi Program, began with planning the Taxi Voucher Program for its ADA paratransit customers in 2006. There were two motivations for the service: (1) to reduce the overall cost of transporting ADA paratransit customers, and (2) to provide an on-demand mobility option to ADA paratransit customers that was flexible, relatively affordable, and within their control, so they could
- Make same-day trips not possible with the advance-reservation restriction of ADA paratransit
- Take trips beyond the ADA paratransit service area (and throughout Coconino County)
- Have a transportation option available 24/7
Mountain Line was the champion behind planning and implementing this program. The Coconino County Board of Supervisors was very supportive of the program since there were few transportation options beyond Flagstaff.
With funding from the Arizona DOT, planning efforts began with Mountain Line’s Paratransit Manager conducting research of other taxi-based programs with a survey (results are shown in Appendix B). Ultimately, the planning team settled on the Taxi Voucher Program. Findings from the survey were instrumental in the design of the pilot program.
Important considerations behind choosing the Taxi Voucher Program included Mountain Line’s desire to have a program where (1) customer participation is voluntary; (2) the number of trips was not limited by an arbitrary monthly limit (although trip-making in general was somewhat limited by the maximum of subsidy per rider per month); (3) all communication, including booking the trip, would be between the rider and the service provider, including the stipulation that riders be able to hail a taxi or access one from a taxi stand, and (4) the providers need only follow the State Taxi Code and would enter into a contract with Mountain Line, agreeing to provide trips to participating riders, collect vouchers, and redeem the collected vouchers from Mountain Line.
Voucher Program Design
The program was designed so that participating ADA paratransit customers could purchase $10.00 or $20.00 vouchers. Participants paid 20% of the value of a voucher, so $2.00 for a $10 voucher and $4.00 for a $20 voucher. Mountain Line would contribute 80% for each voucher purchased, so $8.00 of subsidy for a $10.00 voucher and $16.00 of subsidy for a $20 voucher.
The maximum subsidy per month was set at $240. Thus, a rider could purchase vouchers collectively worth up to $300 of taxi service for any given month, with the vouchers expiring at the end of the month of purchase. Riders would pay the first $2.00 of the meter fare (just as they
would if they were riding Mountain Line’s ADA paratransit service) and use the voucher to pay for the rest of meter fare up to the face value of the voucher. The rider would then be responsible for any overage.
The funding for this program was FTA Section 5310 funding. The local 50% match for the subsidies for riders living in the City of Flagstaff came from the city.
Mountain Line’s ADA eligibility specialist (who would provide oversight of this program) and the Finance Department developed the contracts that would be used to engage local taxi companies to participate in the program (see Appendix B). Other than processing vouchers and related invoicing, there were no special service requirements beyond what was required by Arizona taxi regulations. For example, no additional insurance was required, no additional special training was required, and no additional drug and alcohol testing for drivers was required. The idea was to use existing private-sector resources to provide a non-ADA paratransit on-demand option for Mountain Line’s ADA paratransit customers. If a higher-level service is required, the fallback option, albeit a next-day service versus an on-demand service, would be Mountain Line Paratransit.
In the program’s early years, riders could call any one of six taxi companies who agreed to accept these vouchers. During this period, there was at least one and sometimes two taxi companies that had WAVs.
Mountain Line staff designed the vouchers (Figure A-15), taking inspiration from some of the taxi-based programs surveyed. The name and client ID of the rider, pickup address (and sometimes drop-off address), client fare ($2.00), voucher expiration date (on the first day of the following month), and maximum value ($10.00 or $20.00) were preprinted on the voucher. Fields to be completed included the trip date and pickup time, and then at the destination, the meter fare and the difference (the subsidy to be reimbursed by Mountain Line). There were also signature fields for the rider and the taxi driver.
Taxi drivers would honor the face value of the voucher toward the metered or zone fare of the trip. However, no change was provided to the rider; many riders considered the “lost change” as a tip. Tipping in cash was optional. The drivers would then turn in the collected vouchers to their taxi company for reimbursement. The taxi company would then submit the vouchers to Mountain Line for payment, typically on a weekly basis. From Mountain Line’s perspective, the subsidy for each trip equated to the payment to each taxi company for each trip, minus revenue received when the voucher was purchased.
Taxi Voucher Program Ridership and Challenges, 2007–2017
The program was launched as a pilot in February 2007 with 15 riders; use of the taxi vouchers increased from eight vouchers in February to 62 vouchers in May. In a report to Mountain Line’s board, staff stated that riders had gained a more flexible mobility option and were using the program for grocery shopping, to go to the doctor or pharmacy, and to work. Some riders apparently had work hours that started before and ended after Mountain Line’s ADA paratransit service hours.
Staff also noted that the overall unit cost of transporting its ADA paratransit customers had been reduced. Based on the success of the pilot, Mountain Line’s board converted the Taxi Voucher Program to a permanent program in May 2007 while expanding eligibility for the program to all Mountain Line’s ADA paratransit riders.
Prior to the first trips taken that month, Mountain Line conducted a marketing campaign that included targeted telephone calls and direct mailings to ADA paratransit customers and flyers to advertise the new program. Mountain Line eligibility staff also made it a point to discuss the new
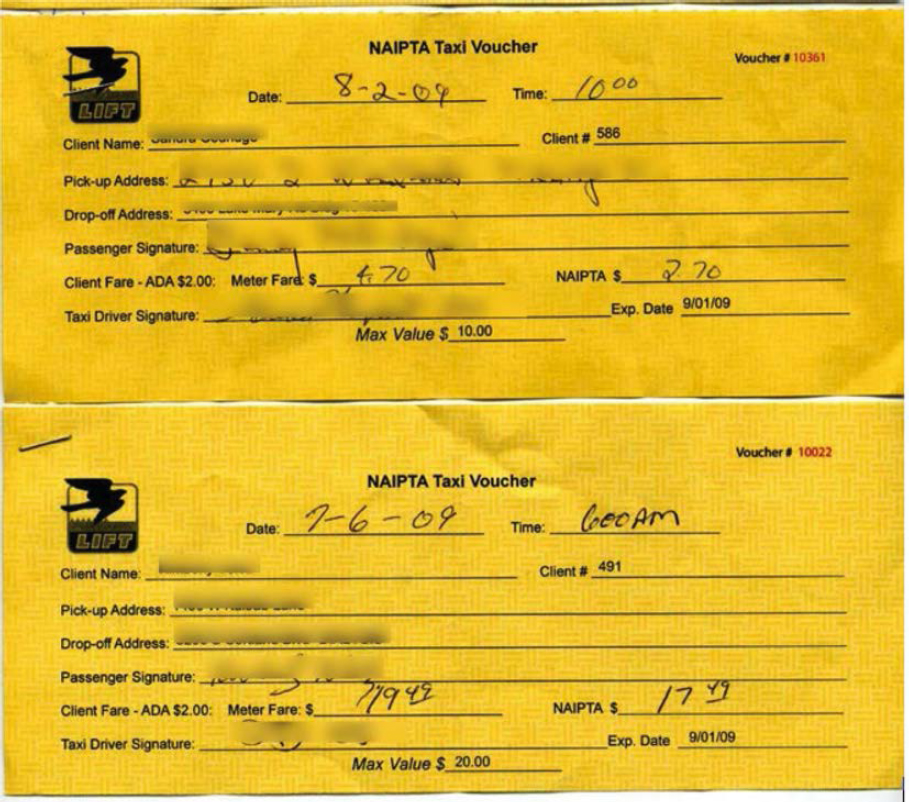
Figure A-15. Mountain Line taxi vouchers, used 2007–2017.
program as a regular part of the eligibility process; this included signing a rider agreement. Use of the program took off; by the end of August 2007, program use had doubled.
Coconino County Joins the Program
The county component of the Taxi Voucher Program began in 2011 with a grant from Coconino County that 50% matched FTA Section 5310 funding from ADOT. This was used to subsidize trips for riders living outside the City of Flagstaff. Originally, because of funding limitations, a 12-trip limit per rider per month was imposed for the county program.
In 2015, demand for the program significantly increased to the point where the program budget was exceeded. This was partially due to one-way trips from the outskirts of the County exceeding 40 miles. As a result, the program monthly limit was halved to six trips per month for six months before funding could be reestablished. In the following year (2016), Mountain Line was able to bring the program back up to full levels when new Section 5310 funding was available.
Use of the Voucher Program
Mountain Line provided reports with passenger trip data going back to June 2010. Researchers first analyzed passenger trip data prior to November 2017, reviewing data from June 2010 to October 2017. Passenger trip data was available for trips cofunded by the City of Flagstaff
(referenced as “City” in the following tables and figures) and trips cofunded by Coconino County (referenced as “County”). Figure A-16 depicts the calendar year annual passenger trips by City, County, and total trips prior to November 2017.
Generally, passenger trips totaled between 4,800 to 5,500 per month between 2011 and 2015. In 2012, there was a higher number of city trips which resulted in a higher passenger trip total of around 6,700. Overall trips increased in 2016, when County trips doubled from the previous year; this was a result of the reinstatement of 12-trip per rider limit. Because only 10 months of data were included for 2017, it is unclear whether trips would have continued at this increasing level prior to introduction of the taxi payment card (discussed later in the case study).
Figure A-17 depicts monthly passenger trips by City and County during the same period (June 2010 to October 2017). Passenger trips by City were at their highest from late 2011 to mid-2013 at around 400–500 trips per month. Total passenger trips from both City and County hit unusual lows for June and July 2013 due to two wildfires in the area: the Doce fire that began June 18, 2013, and the Yarnell Hill Fire, which occurred from June 28 to July 10, 2013. After that dip in monthly ridership, City passenger trips were typically around 300+ per month, but County trips began to increase, up to nearly 200–300 trips per month through most of 2017.
Researchers also looked at the average trips by month during the same period to look for any trends in seasonality of trip demand year over year. Figure A-18 depicts the average City, County, and total trips each month over an approximately 7-year span, 2010–2017 (2010 and 2017 are partial-year data). During this period, total trips were highest on average in March and April (over 500 trips), with the next highest averages in October and December. Average trips by City and County appear to mostly follow the same trends as total trip averages by month.
A spreadsheet tool that Mountain Line staff used to track trip numbers and subsidy is shown in Appendix B.
A qualifier regarding the trip characteristics and trip counts during the 2010–2017 period in Figures A-16 through A-18 when vouchers were used: Mountain Line staff reported that most trips within Flagstaff would only require one voucher, but longer trips beyond Flagstaff often required two vouchers. Thus, the reported trip data in Figure A-18 under the voucher program was really based on the number of vouchers redeemed and hence do not always represent the
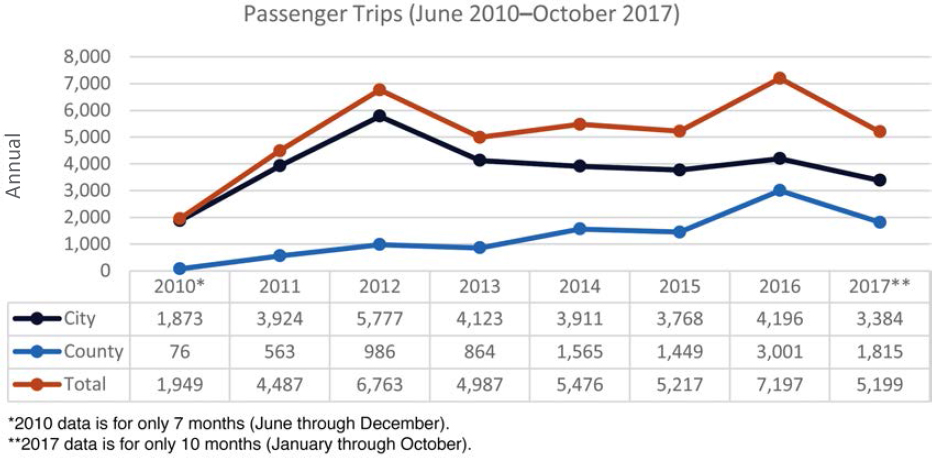
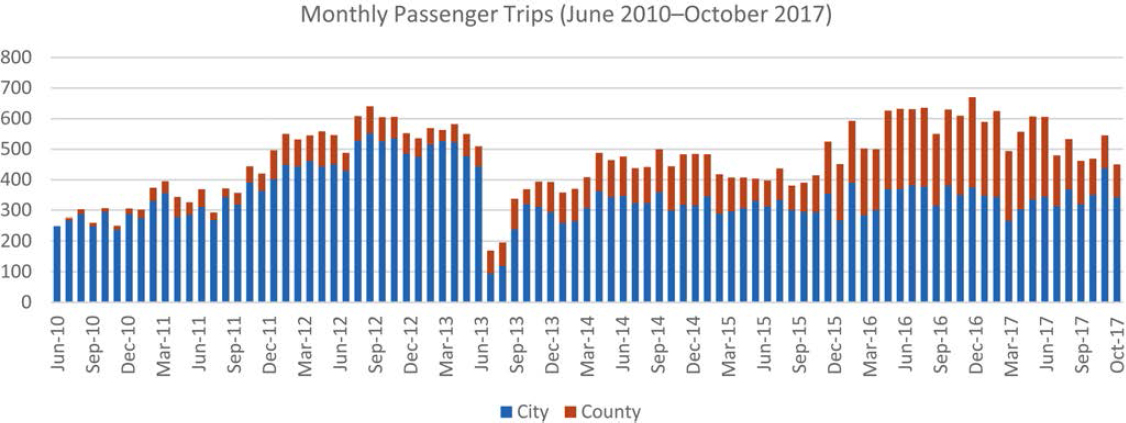
number of passenger trips. Therefore, during this period and before transitioning to a payment card system, the number of trips may have been overcounted.
As previously mentioned, the Taxi Voucher Program was administered by Mountain Line’s ADA eligibility specialist, requiring 50% of her time. Approximately 10% of the business manager’s time was also required.
Some of the challenges involved in implementing the program were:
- Ensuring the safety of the riders. The safety concerns focused on how Mountain Line could account for the condition of the providers’ vehicles and drivers’ lack of specialized training, because under the contract, there were no special provisions beyond what was required under state taxi regulations.
- Ensuring accessibility. Mountain Line also recognized that only a few of the taxi companies in the Flagstaff area had WAVs and that some might be reluctant to serve out-of-area trips. Indeed, access to WAV taxicabs has been an ongoing issue. In addition, using paper vouchers could be problematic for riders with visual impairments.
- Ensuring coverage for trips outside the City of Flagstaff. Mountain Line felt strongly that it wanted to enable its ADA paratransit customers to make trips via the Taxi Voucher Program to locations beyond Flagstaff, and thanks to funding from Coconino County, this was part of
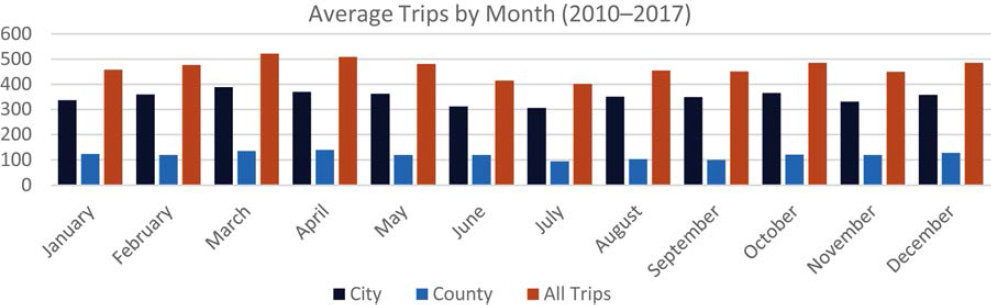
the original design; riders could make trips to/from outer parts of the county. However, these longer trips resulted in the program going over budget, and as a result the outer boundary was scaled back in 2016 from countywide to the Mountain Line (NAIPTA) service area (see Figure A-19).
In addition, many riders found the vouchers’ expiration dates to be not only an inconvenience but a financial loss if purchased vouchers expired.
Current Design and Service Parameters
Evolution from Paper Vouchers to a Taxi Payment Card System and Expansion of Providers
In November 2017, Mountain Line transitioned its alternative service from a voucher program to a taxi payment card system. At the same time, Mountain Line renamed the program the Mountain Line Paratransit Taxi Program.
The impetus to convert to taxi payment cards was largely based on Mountain Line wishing to:
- Reduce the administrative labor needed to sell and process vouchers and provider invoices, and to eliminate the financial relationships with the participating providers
- Reduce the opportunities for fraud
- Broaden the set of providers customers could choose from (specifically, Uber and Lyft)
- Prevent riders losing money due to monthly expiration dates
Partnership with Alliance Bank for Taxi Payment Cards.
Alliance Bank in Flagstaff agreed to partner with Mountain Line to provide the taxi payment cards, noting that there is no formal agreement between Mountain Line and Alliance Bank. Customers wishing to get a taxi payment card must complete a Mountain Line Paratransit Taxi Program Rider Agreement (Appendix B),
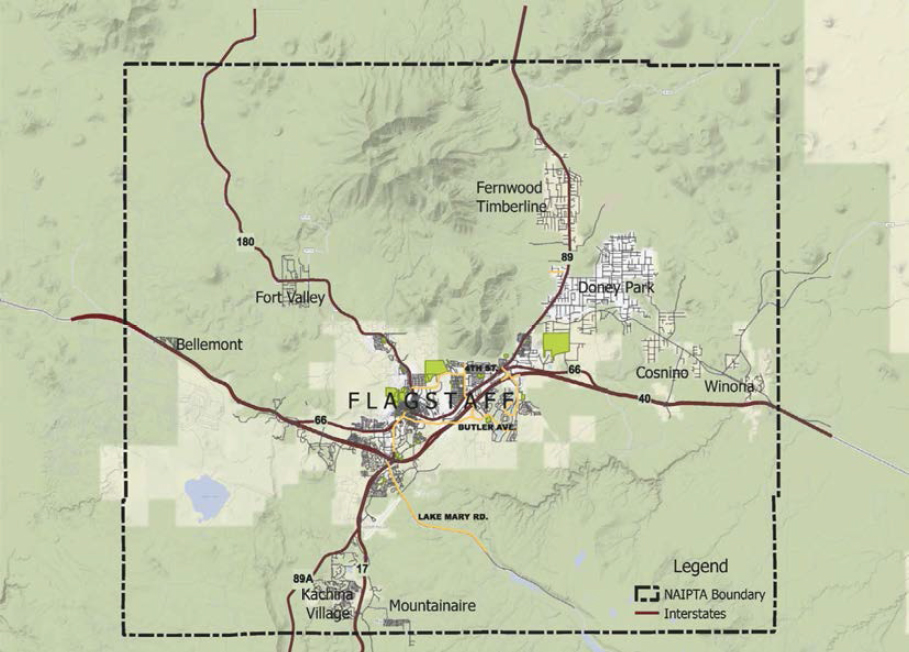
Figure A-19. Mountain Line (NAIPTA) service area.
plus a personal bank card authorization if the rider wishes to pay for their 20% portion with a credit or debit card. Alliance Bank issues the taxi payment cards to Mountain Line, which then provides one to each participating rider. The cards are Visa but are restricted to the merchant category code (MCC) 4121 for taxi or limousine transportation, and Mountain Line staff control the credit limits. This MCC code 4121 also includes TNCs (Uber and Lyft) and one airport shuttle service.
Participating Providers.
With the introduction of the payment card, the number of taxi companies used by taxi program riders grew to 10 in 2018 and 21 in 2019. There was dip in 2020, undoubtedly due to COVID, with riders using only 15 companies, but use of different companies rebounded in 2021 with riders using 23 companies.
With most of these taxi companies and certainly with Lyft and Uber, riders can book on-demand (immediate fulfillment) trips. At least one (Swwoop) requires next-day booking. Taxi rides are booked by calling either the dispatcher or a customer’s favorite driver; for some companies, dispatcher and driver are one and the same. Some taxi companies also allow booking through their website. Uber and Lyft allow both on-demand and advance booking through their apps.
There are no contracts or agreements between the participating providers and Mountain Line, and no reporting of service data comes from the providers. All data on ridership and cost comes from Alliance Bank.
Riders can check their available credit from an Alliance Bank automated system (calling only). Riders can also contact Mountain Line’s program manager who can check their available credit online.
Riders’ Subsidy on the Taxi Payment Card.
Once a month, riders may request that the transit agency load its subsidy onto their taxi payment card account; in effect, this is paying for their share of the cost of future trips. This can be done regularly by setting up an autopay with debiting from a credit or debit card, or by calling Mountain Line staff and using a credit/debit card at any time. Riders can also come to the Mountain Line office and provide their share with cash. The customer pays 20% of the funds and Mountain Line pays the remaining 80%. For example, if a customer pays $20, Mountain Line pays $80 for a total of $100 worth of rides for the month.
Under the new taxi payment card system, the maximum value per person per month started out at $250 for both City- and County-sponsored trips, so the 12-trip monthly limit for County riders was eliminated. The monthly limit was increased from $250 to $300 in 2018, where it has remained. At the end of the month, unused funds can be rolled over to the following month, but the value on the fare payment card account cannot exceed $300.
With the taxi payment cards, riders can pay for a taxi or TNC fare by swiping the card (or giving the card to the driver) at the end of the trip. A tip may be paid in cash or added to the taxi payment card. Knowing the total amount in their taxi payment card account, a rider could make several shorter trips or fewer longer trips. There is no limit to the number of trips a rider may take per day, week, or month; the only limit is how much money is in their taxi payment card account.
Uber and Lyft are the only participating providers that have a rider app. With these apps, Uber and Lyft can (1) automatically send customers trip reservation confirmations; (2) allow customers to cancel a reservation; (3) provide ETAs, pre- and post-pickup vehicle locations, and arrival notices on the day of service; (4) allow customers to communicate with a driver if a vehicle is late; and (5) provide ways to rate service and provide feedback. According to Mountain Line, these apps are fully accessible. None of the participating taxi companies have apps.
Transitioning Riders to the Taxi Payment Card System.
The transition of vouchers to a card-based system took more time than anticipated. This included training the riders and making
them comfortable with a card-based system. It took more staff time than anticipated to answer questions and to set up riders’ cards. Staff also ended up going to the houses of many of the riders to set up the card and explain the program.
Similar to the marketing activities that preceded the launch of the program in 2007, Mountain Line conducted a telephone- and letter-based campaign to instruct voucher program participants on how the new system would work. This included giving the riders the taxi program guidelines and an agreement they had to sign before using the taxi payment card (there was never an Alliance Bank agreement between the participant and the bank). In addition, the program continues to be advertised on Mountain Line’s website (see Figure A-20).
Providers’ Perspective on the New Payment System.
The participating taxi companies favored the new system as it eliminated collecting and redeeming paper vouchers. A particular advantage with the taxi payment card was instantaneous payment to the companies. Some taxi providers that previously did not accept credit cards did have to get Square devices to process the cards, but this was viewed as progress. Uber and Lyft looked on the change as favorable because it allowed them to participate in the program.
Operating and Financial Data with Payment Card, November 2017–September 2021
Alliance Bank makes available to Mountain Line ridership and fare data for each trip. Data for each trip includes the client (rider) name and ID, the provider, date and pickup time of the trip, and total amount of the fare. While the data does not include specific pickup and drop-off locations, it is categorized by City versus County trips (based on the residence of the client) as that is needed for accounting purposes, with the City and County respectively providing the local match for their trips.
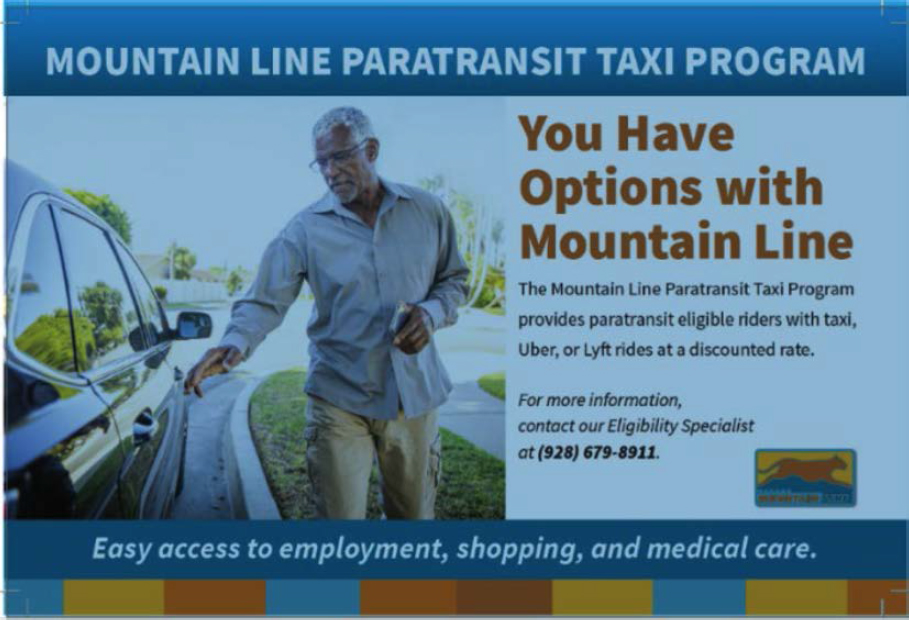
Figure A-20. 2019 advertisement for the Mountain Line Paratransit Taxi Program.
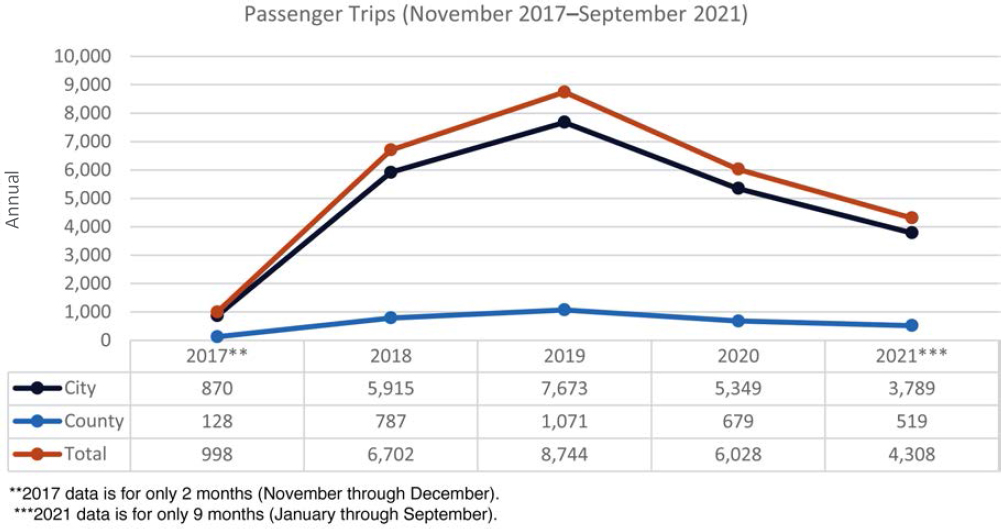
Researchers reviewed passenger trip reports (with annual data) provided by Mountain Line, from implementation of the taxi payment card in November 2017 through September 2021. In 2018, the total passenger trips were comparable to the previous two years, but City trips constituted a higher proportion of the total relative to the previous period. County trips, previously over 3,000 trips in 2016, were around 1,000 lower each year after the taxi payment card was implemented. Figure A-21 shows annual passenger trips from November 2017 through September 2021.
Figure A-22 depicts monthly passenger trips by City and County during the same period. Passenger trips by City were 400–600 trips per month prior to the emergence of the COVID-19 pandemic in March 2020; trips by City grew to around 600–700 per month from January 2019 to February 2020. Total passenger trips by County were typically 50–100 trips per month before March 2020. Since March 2020, monthly passenger trips have gradually increased back to around 500 total trips, near levels seen during the first few months of 2018.
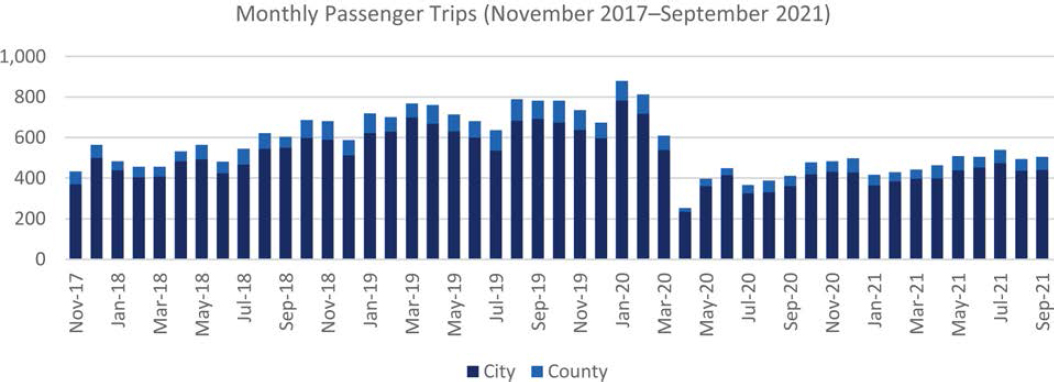
The research team again looked at the average trips by month during the same period to identify any seasonal trends. Figure A-23 depicts the average City, County, and total trips each month, with data from November 2017 through September 2021. During this period, total trips were higher on average in January and October (over 600 trips), with the next highest average months occurring in February, November, and December. The lower average monthly trips in April were influenced by the drop in trips at the start of COVID-19, though the average in March is not as low. Average trips by City and County appear to mostly follow the same trends for total trip averages by month.
Data from Payment Card System
Mountain Line gave the research team reports with taxi payment card transaction data from December 2018 through October 2021. The transactional amount is the fare charged by the provider. The team analyzed these transactions for trends by trip area (City or County) and by transportation provider/vendor. The team also cross-checked the number of annual trips in 2019 and 2020 against the passenger trip report data, verifying a match in passenger trip numbers between the two report types.
Figure A-24 shows the average transaction (fare) per trip for City, County, and total trips by calendar year. During this period, the average fare for all trips rose from around $13 in 2019 to above $17 through most of 2021. This increase appears to be driven by similar increases for City trips over the same period (from below $12 to over $16). The average fare for County trips—typically around $25 per trip—did not influence the total subsidy for the program as significantly due to the lower proportion of County trips in the total.
The research team also looked at average fare by month over the same period; see Figure A-25. The average fare for City trips was fairly consistent from December 2018 to March 2020—between $11.50 and $12.50 per trip. Following the start of the pandemic, the average fare for City trips has increased and consistently stayed above $15 per trip. This could be due to riders taking longer trips or meter rate increases. The average fare for County trips had significantly more variability by month and did not appear to have a similarly increasing cost trend around March 2020,
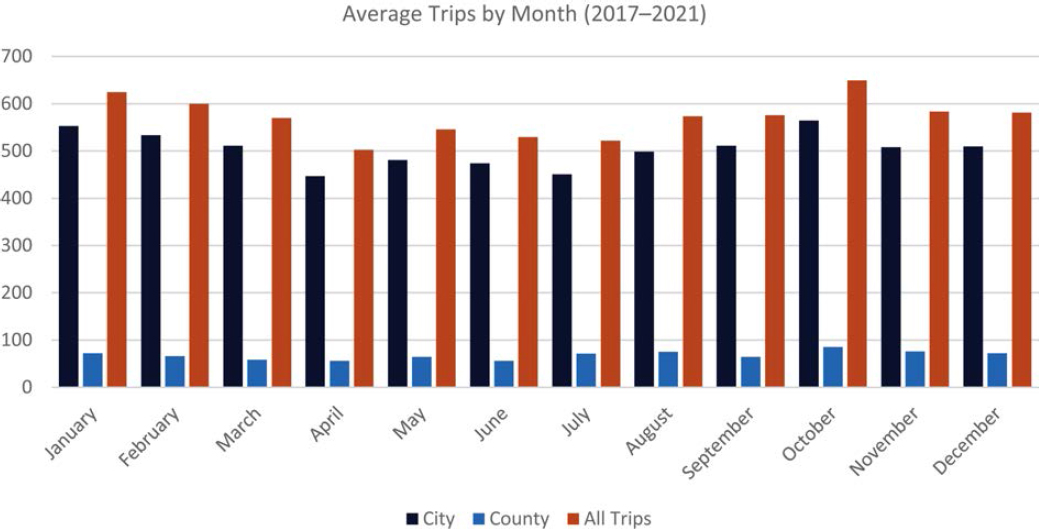
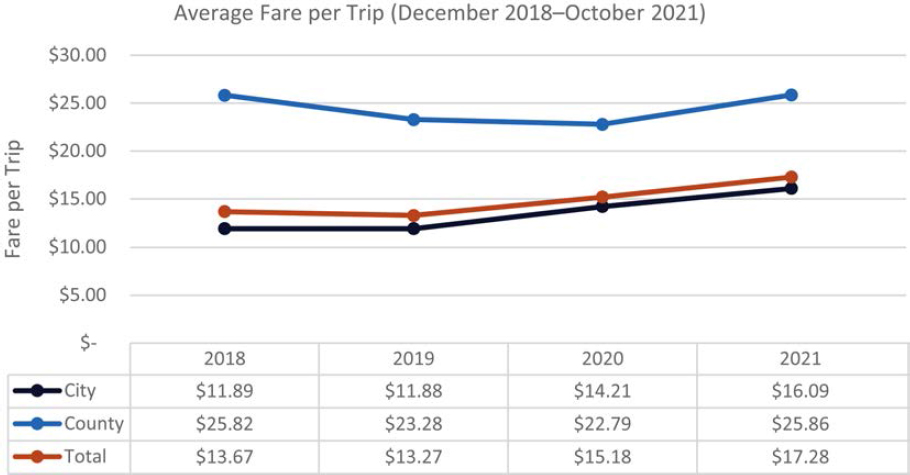
though the average fare for County trips averaged higher, between $25 and $30 per trip from June through October 2021. It is also important to recognize that Mountain Line’s subsidy per trip is 80% of these figures.
Provider Usage, December 2018 to October 2021
Based on the payment card system, Table A-2 shows the total trips, total transaction amounts (fares), and average fare per trip by provider from December 2018 through October 2021. During this period, riders used 35 different providers. The two vendors with the highest number of trips were Lyft and Apex Taxi, both with over 4,000 trips. Interestingly, Lyft had a lower average fare per trip ($12.40) than Apex Taxi ($14.23), though Alliance Bank does not capture any trip length data, so it is unclear whether the Lyft trips were just shorter. In addition, from the rider focus group (detailed later in this case study), several participants stated that Lyft often used promotional discounts and this could have impacted the average fare as well.
The other four vendors with more than 1,000 trips provided during that span were Top Hat Taxi & Tours (now Northern AZ Taxi), Uber, Sun Taxi Flagstaff, and Rob Glover. Uber had an
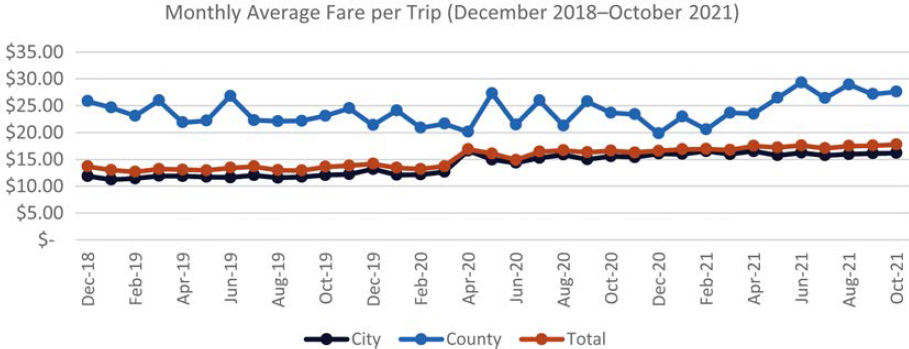
Table A-2. Mountain Line Taxi Program ridership, total fares, and average fare by provider, December 2018–October 2021.
| Provider | Trips | Total Fares | Average Fare |
|---|---|---|---|
| Lyft | 4,462 | $55,322.64 | $12.40 |
| Apex Taxi | 4,069 | $57,919.26 | $14.23 |
| Top Hat Taxi & Tours | 2,795 | $44,303.46 | $15.85 |
| Uber | 2,250 | $25,086.51 | $11.15 |
| Sun Taxi Flagstaff | 2,147 | $32,679.30 | $15.22 |
| Rob Glover | 1,116 | $17,681.41 | $15.84 |
| All other providers (29 subtotal) | 3,327 | $65,668.66 | $19.74 |
| Grand Total (35 providers) | 20,166 | $298,661.24 | $14.81 |
average fare of $11.15 per trip, while the others were between $15 and $16 per trip. Most providers with a significant number of trips had an average fare per trip somewhere between $11 and $21. There were some outliers; an extreme outlier was Arizona Shuttle at $120.67 per trip, reflecting airport shuttle trips to Phoenix (only six trips were taken on Arizona Shuttle during this period).
Table A-3 disaggregates the data from Table A-2 to show the annual average fare by provider for the same time period of December 2018 through October 2021. Average fares by provider were fairly comparable between December 2018 and the combined 2019 calendar year. In the following 2 years, average fares increased for providers across the board; the change from 2019 to 2021 was a 30% increase for all providers. This was primarily due to taxi meter fare increases.
Between December 2018 and October 2021, Mountain Line Taxi Program had a total of 35 providers, but the totals varied by year as providers joined or left the program.
Figure A-26 shows the number of providers in the program by calendar year. During 2019, the total number of providers increased from 10 to 21. By the end of 2020, the number of providers had decreased to 15, which may have been caused by business conditions of the pandemic. Subsequently, total providers increased in 2021 to 23 providers.
Achievement of Goals and Objectives
One of the initial goals of implementing the program was to lower the overall cost per trip of transporting ADA paratransit customers. For the period between December 2018 and June 2019, the subsidy per trip of the Paratransit Taxi Program was $10.50 (80% of the average fare). In comparison, Mountain Line Paratransit cost per trip for FY 2019 was $46.05. This represents a savings of $35.55 for each trip that otherwise would have been taken on Mountain Line Paratransit. However, there is no hard data to prove which taxi program trips would have been taken on Mountain Line Paratransit and which would not.
Table A-3. Mountain Line Taxi Program average fare by provider, December 2018–October 2021.
| 2018 | 2019 | 2020 | 2021 | % Change (’21–’19) | |
|---|---|---|---|---|---|
| Lyft | $10.21 | $11.89 | $11.04 | $14.71 | 24% |
| Apex Taxi | $13.33 | $12.98 | $14.50 | $16.13 | 24% |
| Top Hat Taxi & Tours | $12.93 | $13.70 | $20.21 | $19.97 | 46% |
| Uber | $10.38 | $9.47 | $11.76 | $13.01 | 37% |
| Sun Taxi Flagstaff | $13.13 | $11.04 | $16.76 | $22.04 | 100% |
| Rob Glover | $13.20 | $16.92 | $18.40 | 39% | |
| All other providers | 20.31 | $18.73 | $19.44 | $22.09 | 18% |
| Grand Total | $13.67 | $13.27 | $15.18 | $17.28 | 30% |
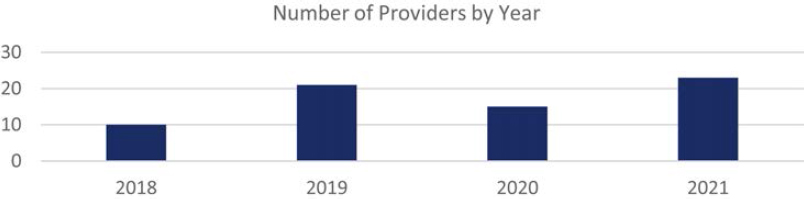
When the focus group participants were asked whether they would have taken their taxi program trips on Mountain Line Paratransit if the taxi program did not exist, the feedback was split. Approximately half of the participants said they would have used Mountain Line Paratransit for all their trips, while the other half stated that they rarely use Mountain Line Paratransit and would not have taken those trips at all. For the former, there is substantial savings. For the latter, there is not only no savings, there is an additional cost.
The other primary goal was to provide an on-demand, alternative service for ADA paratransit customers that would not only allow these riders to make same-day if not immediate-response trips but also allow them to make trips beyond the ADA paratransit service area and at times beyond the ADA paratransit service span. These goals were met, however the service area for the Paratransit Taxi Program was scaled back from allowing trips that extended to the county border to a smaller service area defined by Mountain Line’s service area, which included all of the ADA paratransit service area and closer-in parts of the county. Scaling down the service area was due to the program’s popularity and the County’s program budget being exceeded.
Other goals realized in transitioning to the card payment system were reduction of administrative labor, a paperless payment procedure for riders, and eliminating the monthly expiration date associated with each voucher.
Otherwise, Mountain Line staff reports that ridership keeps increasing and, since the transition to the fare payment card, the program has been easy to manage. The only challenge voiced by staff has been the difficulty of estimating the unit cost reduction due to the limited data provided by the bank.
Rider Feedback
Rider Survey
From 2010 through 2018, Mountain Line conducted annual rider surveys of its ADA paratransit customers. These were administered as both a direct-mail survey and a telephone survey.
Of the 576 surveys mailed out to customers in 2018, 209 valid responses were received. Of the respondents, 42% indicated they had tried the Mountain Line Paratransit Taxi Program, using the service to make trips to medical appointments (71%), shopping (57%), other appointments (27%), recreation (19%), and social engagements (16%). Trips to work comprised 7% and to school 1%. In addition, 1% of the respondents indicated using the service to get to senior centers or adult day programs.
According to the survey ratings, riders have been generally pleased with the Paratransit Taxi Program. For example, in 2018, 72% of respondents were very satisfied and 11% were somewhat satisfied versus 9% who were somewhat dissatisfied and 8% who were very dissatisfied. Interestingly, the percentage of respondents who were somewhat dissatisfied or very dissatisfied, while still low, nearly doubled after the conversion to taxi payment card.
Additional rider comments from the survey were both positive and negative. One rider stated that they liked the new debit card system, while another indicated that they were “very pleased overall and eternally grateful for the excellent service.” Yet another rider wished the taxi drivers and dispatchers had better sensitivity training for people with disabilities.
Mountain Line intended to conduct another rider survey in 2020, but this has been delayed because of the COVID pandemic.
Focus Groups
As part of this research study, two rider focus groups were held in January and February 2022 to elicit feedback. All the participants were users of the Paratransit Taxi Program. Nine riders participated in the first focus group and six in the second. Several riders had visual impairments. None of the participants required a WAV.
Their experiences and input are summarized here.
Use of the Paratransit Taxi Program
- There was a mixture of use: some of the participants had used the program since its inception, most had used the program for 3 to 5 years, and a few joined the program within the last year.
- The participants included some heavy users (18–30 round trips per month), moderate users (3–8 round trips per month), and occasional riders (1–2 round trips per month).
- Most riders use the taxi program for medical and grocery trips. One rider used the taxi program to get to/from a class.
- Most of the focus group participants used the taxi program to make round trips, while a few used it to make one-way trips, and especially the return trip home.
- Most of the participants booked both advance trips and same-day/immediate response trips, depending on trip needs. They felt that the advance reservation option was important because on-demand trips cannot always be fulfilled because of the driver shortage.
- The use of taxis versus TNCs seemed to be split evenly, and Lyft appeared to be the TNC of choice, in part because of promotional fares. Most of the participants used either taxis or a TNC, while a few taxi users relied on Lyft or Uber as a backup only. Several participants indicated switching to Lyft as the local taxi companies have struggled to keep drivers.
Use of Paratransit Taxi Program versus Mountain Line Paratransit (ADA paratransit)
- Several riders voiced that to preserve their monthly allotment, they would use the taxi program for shorter trips and Mountain Line Paratransit for longer trips.
- Several riders use Mountain Line Paratransit for outbound medical trips and other trips that require an appointment, and use the taxi program for the return trips.
- Approximately half the participants indicated they do not use Mountain Line Paratransit at all or seldomly, preferring the taxi program primarily due to its promptness.
- Participants were asked whether they would have taken their taxi program trips on Mountain Line Paratransit if the taxi program didn’t exist. Approximately half the participants said they would have used Mountain Line Paratransit for all their trips, while the other half stated that they rarely use Mountain Line Paratransit and would not have taken those trips at all.
- One rider indicated that she also used a senior transportation program because of the free fare, but that that program was to be temporarily suspended, at which point she would resume using the taxi program.
Participants Like the Paratransit Taxi Program
- Virtually all participants, regardless of usage, were highly complimentary of the taxi program, several stating that it was a lifesaver and pointing to the on-demand nature of the service
- Most riders said they were happy with on-time performance, which varied from 5–15 minutes, and sometimes 20 minutes for return trips. A few participants, in contrast, noted that response times and timeliness of advance reservation trip arrivals have dropped significantly, from 40 to 60 minutes; riders speculated that the reduction in drivers is at the heart of the resulting slide in responsiveness, as well as the more remote locations of their residences.
- Many users preferred the Taxi Program to Mountain Line Paratransit because of (1) more timely responsiveness, (2) shorter onboard travel time (owing to single-ride trips), and (3) the comfort of the sedans versus the cutaway vehicles used for the ADA paratransit service. For some riders, it’s their only option to make out-of-area trips.
- When comparing the quality of service provided by the drivers, focus groups participants were equally complimentary. Unlike many taxi-based alternative programs, it would seem the taxi drivers in Flagstaff often go beyond the typical level of driver assistance, accompanying the riders to/from the door and helping with bags. Several riders said the taxi drivers did this to make their service more attractive and encourage the riders to call them specifically the next time they needed a ride. Virtually all focus group participants, whether they used taxis or TNCs or both, felt secure and safe while riding.
- Most participants couldn’t think of any improvements that were necessary. Only a few mentioned that the maximum subsidy per month was limiting.
especially for return trips from the grocery store or doctor’s office) and the 80% subsidy as the most attractive elements. All participants were also highly complimentary of the Mountain Line Taxi Program manager.
Lessons Learned
- Understand the objectives of the alternative service and potential provider partnerships. Mountain Line’s advice to transit agencies considering an alternative service for ADA paratransit riders is to understand the type of transportation gaps you are trying to fill and understand what types of transportation partnerships you can establish for an alternative service.
- Advantages of a card payment system. Mountain Line indicated that transitioning to the payment card was an important improvement that lessened administrative labor. The card payment system is not as labor-intensive and is more user-friendly than the paper vouchers. The fare payment card has also proven less stressful for riders because they know that, unlike the voucher program, they will not lose their credit if they don’t use it by the end of the month. This is also important since transportation needs may fluctuate from month to month. Mountain Line’s program manager recalls one rider who had been in rehab for 3 months and still had taxi credit available to get a ride home when she was discharged.
- Coordinate plans for a card payment system with your financial partner. A related lesson learned is to talk with your current bank (or card payment vendor) and see if they can handle this type of program. Mountain Line initially used a different financial provider but there was a conflict of interest, so the agency switched to Alliance Bank. It’s also important to make sure the annual program expenditures will exceed the threshold needed to avoid fees (this was set at $75,000 for this program).
Contact
Northern Arizona Intergovernmental Public Transportation Authority (NAIPTA), dba Mountain Line
3773 N Kaspar Dr.
Flagstaff, AZ 86004
Phone: (928) 779-6624
Richmond, VA: GRTC CARE On-Demand
Background of Transit Agency
The Greater Richmond Transit Company (GRTC) is a public transit agency owned jointly by the City of Richmond and Chesterfield County in central Virginia. The transit system was founded more than 160 years ago, in 1860, and has operated consistently since, with one temporary suspension during the Civil War.
GRTC operates fixed-route and express bus services as well as specialized services including ADA paratransit, branded as CARE: community-assisted ride enterprise. In FY 2019, GRTC’s fixed-route ridership totaled 8.6 million (bus and bus rapid transit); ADA paratransit ridership was almost 310,000.
CARE provides service to individuals with disabilities certified as ADA paratransit-eligible and people aged 80 and older. Service is provided within the ADA required ¾-mile corridors of fixed routes as well as an extended area beyond the required area encompassing the City of Richmond, Henrico County, and portions of Chesterfield County (see Figure A-27; the colors differentiate the three jurisdictions served, with the City of Richmond in orange).
In the CARE program, the trips are distinguished as CARE trips (those within the ¾-mile corridors of GRTC fixed routes) or CARE Plus trips (those that have an origin or destination outside the required ADA paratransit service area). CARE Plus trips are considered premium trips as they are not required by the ADA. Starting in August 2017, GRTC introduced a pilot same-day on-demand service for its ADA paratransit riders known as CARE On-Demand. The transit agency is initiating efforts to formalize the service from its pilot status.
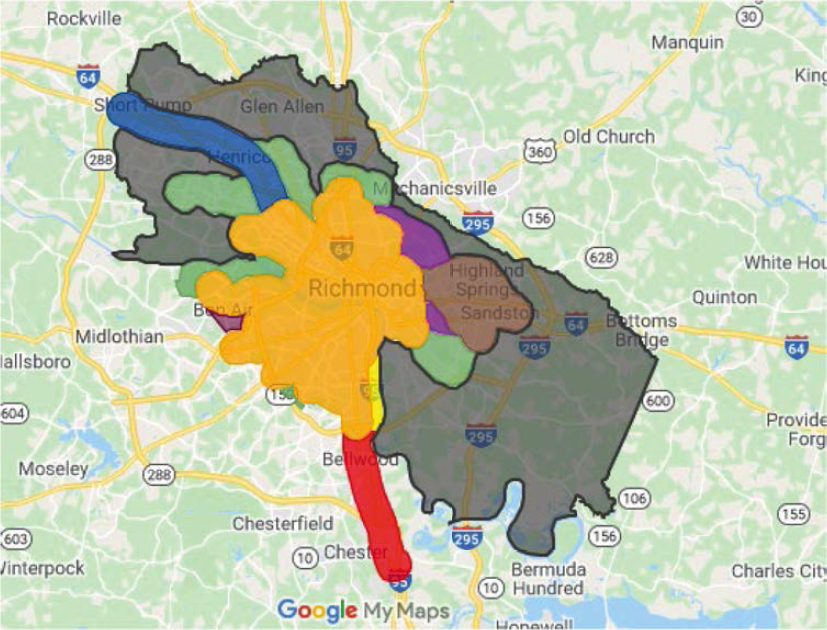
Figure A-27. CARE and CARE On-Demand service area.
ADA Paratransit Service: CARE
In FY 2019, GRTC reported 5,306 individuals registered as ADA paratransit-eligible. Of these, approximately 3,000 were considered active riders, defined as taking two trips per month. According to NTD data, total CARE passenger trips in FY 2019 equaled 309,927, with an average operating cost per passenger trip of $20.51. CARE service is provided by one private contractor with dedicated vehicles—88 cutaway vans and eight sedans. The fare for CARE trips is $3, which is twice the regular fare for fixed-route service, and $6 for CARE Plus trips.
Since the beginning of the pandemic, no fares have been charged for CARE and CARE Plus trips, in keeping with GRTC’s free service on fixed-route. In the fall of 2021, the private contractor added nondedicated ADA paratransit service to supplement its dedicated fleet. For this supplemental service, the contractor partnered with UZURV, the same provider that operates part of the CARE On-Demand service. Reportedly, the ADA paratransit contractor has had some performance issues meeting demand for service, which has been increasing in recent months toward prepandemic levels.
Background, Planning, and Implementation
The early impetus for the alternative service came from a senior GRTC manager who had prior experience with a same-day service for ADA paratransit riders in Baltimore. By 2015, GRTC was dealing with increasing demand and increasing costs for its ADA paratransit service and saw a same-day service as a way to address both issues. A same-day alternative for ADA paratransit riders would not only help shift demand to a more cost-effective service but would also provide a same-day mobility option for ADA paratransit riders, a higher level of service than next-day paratransit.
Planning the Alternative Service
Planning efforts were conducted by senior GRTC staff, including the chief of transit operations, the CEO, and the COO, with support from the Procurement and Legal Departments. As part of its planning efforts, GRTC reached out to several other transit agencies that had implemented ADA paratransit alternatives, particularly those using TNCs, to learn about their experience.
In developing its pilot, GRTC was very focused on ensuring compliance with ADA and Title VI requirements, in keeping with the Dear Colleague letter issued by the then-U.S. DOT secretary (Foxx 2016). This letter addressed transit agencies’ partnerships with TNCs and emphasized that civil rights principles of equity and accessibility inherent in providing public transit service apply regardless of whether federal funding is involved.
The letter reminded transit agencies that they are obligated under Title VI to ensure individuals without a smartphone, credit card, and/or bank account have access to transit agency-provided TNC service. Additionally, the letter stated that WAVs must be available and that such service must meet the ADA’s seven service equivalency criteria, which include equivalent response time for riders needing an accessible vehicle. In addition to carefully reading the letter, the transit agency contacted its FTA regional office for further guidance.
Planning efforts explored use of taxis as well as TNCs for the same-day service. GRTC spoke with several local taxi companies, a local NEMT provider, and at least one of the major TNCs. Taxis did not seem a feasible option given the local taxi industry, and the TNC was more focused on its app and did not seem interested in providing a call center, a feature GRTC specifically required.
Procurement/Contracting Process
GRTC issued an RFP in October 2016 for a Third-Party Transportation Voucher Pilot Program for seniors and people with disabilities (see copy in Appendix B). This document envisioned CARE On-Demand as a voucher program, with serialized vouchers provided to drivers with space for the rider’s information to be entered. The vouchers were also to be signed by the rider. The RFP noted that other methods of trip verification could be submitted.
The RFP spelled out requirements, including:
- Vehicle requirements, including that they must meet or exceed requirements for the approval of vehicles for taxi service in the City of Richmond and Henrico County
- Fleet information, including total number of WAVs available and number of wheelchair positions in each vehicle
- Driver training, including passenger sensitivity, defensive driving, and passenger assistance
- That riders contact the provider directly for trips
- Origin to destination service—curb-to-curb and door-to-door
- Same-day direct/nonstop service
- A list of data to be reported and submitted
UZURV, which is based in Richmond, responded to the RFP, as did a local NEMT provider. Negotiations proceeded with UZURV, with GRTC specifically requiring a call center.

GRTC signed a contract with UZURV in July 2017, becoming UZURV’s first public transit agency client. CARE On-Demand was then implemented on August 1, 2017, as a 1-year pilot.
GRTC added a second provider for CARE On-Demand, Roundtrip, 5 months later, in December 2017.
Current Design and Service Parameters
Service Framework
GRTC currently has contracts with two private companies—UZURV and Roundtrip—to provide the same-day on-demand service (Figure A-28).
UZURV calls itself an adaptive TNC, differentiating itself from other TNCs by drug and alcohol testing its drivers within FTA guidelines. UZURV has agreements with a network of transportation providers, including private drivers with vehicles that meet the company’s standards. To provide wheelchair-accessible service, UZURV has agreements with NEMT providers, whose drivers provide trips for UZURV on a nondedicated basis.
Roundtrip, which began by providing healthcare transportation with a web-based reservation service, also has agreements with a network of transportation providers, including those with accessible vehicles. The addition of Roundtrip expanded the service hours for CARE On-Demand particularly in the early months of the service, offering trips later in the evening than UZURV.
Figure A-28. CARE On-Demand uses two providers.
GRTC’s contract with the CARE On-Demand providers requires:
- Insurance. Business automobile liability policy of $1 million each occurrence; commercial liability policy of $1 million; umbrella liability policy of $1 million.
- Drivers. Training for drivers is to include passenger sensitivity, defensive driving, and passenger assistance. Drug and alcohol testing for drivers was not a contract requirement, however UZURV does provide this testing for its CARE On-Demand drivers.
-
Data. The contractor is to submit these data in order to receive reimbursement:
- Date of trip
- Passenger name and GRTC client ID number
- Number of companions
- Full pickup address with phone number
- Destination address
- Starting and ending mileage
- Money collected from the rider and total trip cost
Additionally, the contract requires the provider to submit a daily dispatch log on a fortnightly basis and complaint log on a monthly basis. GRTC reports that the providers submit all the required data other than a complaint log. GRTC receives any complaints about CARE On-Demand and forwards them to the providers for follow-up and resolution.
Service Parameters
- Eligibility. CARE On-Demand is available to individuals who are certified as eligible for CARE. Service is provided in the same area as CARE and CARE Plus.
- Service span. Service days and hours vary somewhat between the two providers. UZURV operates 7 days per week: Monday–Friday 5:30 a.m.–10 p.m., Saturday–Sunday 7:30 a.m.–7:30 p.m. Roundtrip also operated 7 days per week, 7 a.m.–11 p.m. The service hours for CARE On-Demand are somewhat less than those for CARE, where hours match those for GRTC’s fixed routes as required by the ADA.
- Trip characteristics. Trips are direct, with no shared riding. If needed, door-to-door service is provided. Riders can bring a PCA or service animal and guest(s), the latter space permitting, without an extra charge. Riders can also request their favorite driver(s).
- Trip booking and scheduling procedures. Trips are scheduled 2 hours in advance and 30 to 90 days in advance (the longer advance scheduling depends on the specific provider in the providers’ network). For both providers, riders can book trips via the provider’s app or by telephone. Roundtrip gives a 15% trip discount if the trip is booked by app. UZURV’s app is accessible, specifically meeting the ADA’s web content accessibility guidelines (WCAG) 2.1 AA standards. Subscription trips can be provided.
- Fare structure and methods of payment. For each one-way trip the rider pays a $6 fare, with GRTC paying up to an additional $15 subsidy toward the cost of the trip. Should the trip cost more than $21, the rider is responsible for the overage. Riders are informed of the full cost of the trip in advance. Trip costs are based on mileage and may be subject to peak time-of-day charges. Round trips include a $1 surcharge for trips that begin between 8 p.m. and 6:30 a.m. Fares are paid by credit or debit card, which are on file for the riders. Cash is not accepted.
- Service-day issues. The providers handle service-day issues. UZURV, for example, has a designated team that monitors trips to ensure they are on time according to the particular contract.
Data
GRTC reports that obtaining data needed to monitor and assess the service has not been an issue. The transit agency tracks the following data for CARE On-Demand:
- Total passenger trips provided/subsidized
- Number of unique customers
- Total fare revenues collected by providers
- Total cost (subsidy)
- Total revenue vehicle miles
- Total passenger miles
- Total passenger trips by provider
- Total passenger trips by vehicle type (e.g., sedan versus WAV)
- Total passenger trips by trip origin and destination (e.g., by zip code)
- Total passenger trips by day and time of day (e.g., hour by hour)
- On-time performance (OTP) for immediate-fulfillment trips (e.g., response time versus established standard)
- Number and/or percentage of on-time completed trips versus late completed trips. OTP is provided by UZURV but not by the second provider.
Performance Metrics for Monitoring Service
GRTC reports that it reviews the following metrics to monitor CARE On-Demand:
- Overall cost (combined cost of the ADA paratransit service and the alternative service)
- Cost per passenger trip (combined cost of the ADA paratransit service and the alternative service)
- Overall customer ridership
- OTP/response time
- Number of passenger trips requiring a WAV
- Mode shift among participants (e.g., from ADA paratransit to the alternative service)
Operating and Financial Data for the Alternative Service
GRTC collects comprehensive data about CARE On-Demand. Details on each of the two providers’ service are reported and documented separately and then combined in one report, with data reported month by month, an annual total, and where appropriate, an average for the year.
Table A-4 summarizes data for calendar years 2018, 2019, 2020 and ten months of 2021. Data for CARE On-Demand’s first five months in 2017 are not included given that those were start-up months.
As shown in Figure A-29, trips are predominately single-ride, with average passengers per trip ranging from 1.05 to 1.07. Trips increased by more than one-third from 2018 to 2019 (36%) and, with the pandemic, decreased 26% from 2019 to 2020. More recent trends in 2021 show that demand is increasing. The monthly average trips in 2021 was 2,321 compared to 1,851 in 2020.
Average trip distance and average trip times are relatively consistent over the 4-year period shown. Of the two providers, UZURV is the predominate one.
For 2018, 2019, and 2020, data show that ambulatory trips comprise about 91–92% of trips and wheelchair trips about 8–9% of trips. This changes in 2021, with the first 10 months of data showing a notable increase in the proportion of wheelchair trips to 14% of all trips.
Data on rider payment is interesting. Riders pay a fare of $6 plus any amount over $21. The data show that significant numbers of riders are paying more than the base fare—so taking trips that cost more than $21. In 2019, for example, the average CARE On-Demand fare is $26.05. This means that, on average, riders are paying $11.05 per one-way trip: $6 fare plus $5.05 ($26.05− $21.00).
The cost data also show that larger proportions of riders are paying more than $21 per trip in 2021. This could be riders choosing the service that has no shared riding, given pandemic-related concerns.
Table A-4. CARE On-Demand, 2018–partial 2021.
| 2018 | 2019 | 2020 | 2021 (10 mos.) | |
|---|---|---|---|---|
| CARE versus CARE On-Demand Trips | ||||
| Total CARE Trips | 222,639 | 225,856 | 165,073 | 160,819 |
| Total CARE On-Demand Trips | 21,921 | 29,909 | 22,208 | 23,207 |
| Total CARE On-Demand Ridership (Passenger Trips) | 22,945 | 30,535 | 23,625 | 24,596 |
| CARE On-Demand | ||||
| Avg. Trip Distance (miles) | 6.4 | 6.5 | 6.3 | 6.3 |
| Avg. Travel Time (minutes) | 16.1 | 15.9 | 15.8 | 15.9 |
| Avg. Passengers per Trip | 1.05 | 1.05 | 1.06 | 1.07 |
| % Ambulatory Trips | 91% | 92% | 92% | 86% |
| % Wheelchair Trips | 9% | 8% | 9% | 14% |
| % UZURV Trips | 68% | 65% | 69% | 70% |
| % Round Trips | 32% | 35% | 31% | 30% |
| OTP, measured at 0/+15 min. (UZURV only) | 99.4% | 98.6% | 99.2% | 94.7% |
| Operating Costs | ||||
| Avg. Cost per CARE On-Demand Trip | $25.29 | $26.05 | $26.32 | $27.24 |
| % Trips > $21.00 ($6 fare + $15 GRTC subsidy): | ||||
| UZURV | 59% | 73% | 85% | 99.30% |
| Round Trip | 99% | 100% | 98% | 100% |
| Combined | 71% | 82% | 89% | 99.50% |
Note: All CARE data includes CARE and CARE Plus trips.
Beginning with the pandemic in March 2020, GRTC eliminated fares on fixed-route and ADA paratransit travel, in keeping with ADA regulations. Despite free fares on CARE, many riders elect to use CARE On-Demand, which is not free.
Data for the first 10 months of 2021 show a total of 23,207 trips on CARE On-Demand, with riders paying the fare and for virtually all the trips, an excess amount over $21.00. If these trips were on CARE, they would have been free. It is likely that the pandemic has impacted this trend: with CARE On-Demand, riders receive a direct, nonstop, unshared ride, and reliable service. GRTC reports that some riders have developed a comfort level with the same-day service and may not want to return to traditional ADA paratransit service.
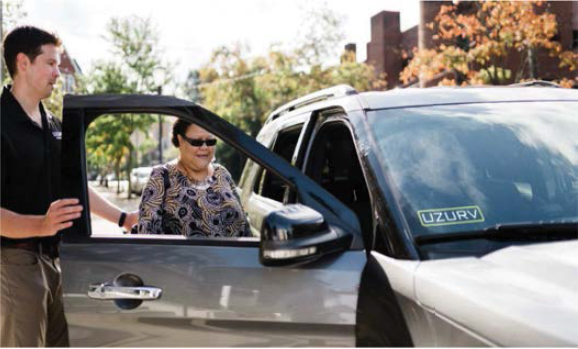
Figure A-29. TNC driver helping passenger into vehicle.
Table A-5. Proportion of CARE On-Demand trips to CARE trips.
| Trips | |||
|---|---|---|---|
| Total CARE | Total CARE On Demand | % CARE On Demand of CARE | |
| 2017 (5 mos. Aug-Dec) |
97,845 | 3,691 | 3.8% |
| 2018 | 222,639 | 21,921 | 9.8% |
| 2019 | 225,856 | 29,090 | 12.9% |
| 2020 | 165,073 | 22,208 | 13.5% |
| 2021 (10 mos. Jan-Oct) |
160,819 | 23,207 | 14.4% |
Note: CARE trips include CARE Plus trips.
Source: GRTC CARE On-Demand Trip Comparison—Annually.
Method to Determine Cost Savings from Trips Shifting to the Alternative Service?
GRTC uses two key metrics to determine the extent to which CARE On-Demand provides cost savings for its ADA paratransit service. The first is the relative proportion of CARE On-Demand trips to total CARE trips. At the start of the service, the transit agency had targeted 10%. As shown in Table A-5, the proportion of CARE On-Demand trips achieved this objective by the first full year of service. The proportion then increased and in 2021, trips on CARE On-Demand comprised 14.4% of total CARE trips.
The second key metric is the savings to GRTC if those CARE On-Demand trips had been provided as ADA paratransit. GRTC calculates the cost of the CARE On-Demand trips if provided as CARE trips and from this subtracts the actual cost of the CARE On-Demand trips. This calculation for 2018 through 2020 in shown in Table A-6. Preliminary data are also shown for 2021. In FY 2019, for example, this metric showed savings of 47%.
GRTC recognizes that the methodology assumes that the CARE On-Demand trips would have been taken on CARE. The transit agency realizes that some of the CARE On-Demand trips could be new trips and thus its calculation may not represent actual savings. However, GRTC has set the subsidy limit for CARE On-Demand at a modest level, roughly half of what its ADA paratransit trips cost, which helps protect the transit agency from potential “new” costs for the alternative service.
Achievement of Goals and Objectives
GRTC believes that CARE On-Demand has achieved its objectives for the service. Within the first full year of the alternative service, trips on CARE On-Demand had achieved the 10%-of-CARE-trips objective.
Table A-6. Savings to GRTC from CARE On-Demand.
| 2018 | 2019 | 2020 | 2021 (10 mos.) | |
|---|---|---|---|---|
| Total Cost to GRTC for CARE On-Demand Trips | $319,270 | $433,241 | $331,482 | $347,946* |
| Cost per ADA Paratransit Trip | $28.21 | $28.19 | $32.71 | $36.39* |
| Total Cost If CARE On-Demand Trips Were Provided by ADA Paratransit | $617,911 | $819,791 | $720,457 | $844,503* |
| Savings to GRTC | $298,641 | $386,550 | $388,974 | $496,557* |
* Preliminary cost figures.
CARE On-Demand has also served as an effective alternative for ADA paratransit riders in the Richmond area, not only as an option for more spontaneous trips than available with ADA paratransit, but also an effective option during the pandemic with solo rides, and more recently as an option while the ADA paratransit contractor has built up capacity to meet the demand re-emerging from the low levels of the earlier months of the pandemic.
Rider Feedback
Rider feedback on CARE On-Demand was obtained through a brief online survey of a small, selected number of riders in January 2022. These individuals were identified and contacted by the GRTC Eligibility Coordinator, with an objective of selecting a small number of riders who use the on-demand service and of riders who do not. Responses were received from nine ADA paratransit riders who use CARE On-Demand and four who do not.
Riders Who Use CARE On-Demand
- Most of the riders who use CARE On-Demand use the service frequently, three days per week or more. Two were only occasional users—with trips just several times per month.
- About half have switched all their trip-making and use only CARE On-Demand. The other half still take some trips on CARE.
- Five of the riders indicated that if the on-demand service was not available, they would instead have used CARE. For those riders and their trips, GRTC is saving costs due to the more cost-effective trips on CARE On-Demand. This conforms with GRTC’s method for calculating the operating cost savings through CARE On-Demand.
- All but one of the riders book their trips by phone (booking can also be done online or by app).
- Of the two providers serving CARE On-Demand trips, UZURV is somewhat favored; one rider has no preference.
- The three characteristics most liked by the riders are:
- The trip is direct, no stops for other passengers.
- The trip can be booked on the same day as the trip is needed.
- Rides are not shared.
- The added comments were generally positive:
- “CARE On-Demand is an amazing service that allows me to be independent and safe.”
- “My daughter feels very independent and [the service] allows her greater freedom to get where she needs to be.”
- A couple of comments asked for changes or reported issues:
- Extend the hours so riders can “go out at night”
- Problems ordering rides online with the GRTC CARE card.
Riders Who Do Not Use CARE On-Demand
- The riders who do not use the on-demand service indicated that they either do not know about the service or do not want to pay the higher fare for the trips.
- These riders are a mix of very frequent and only occasional users of CARE.
- There were only a few comments regarding CARE; one rider commented that the service is a great asset and two others voiced some issues with CARE, e.g., late trips.
Lessons Learned
GRTC reports the following:
- Deliberate and careful planning of an alternative service will help lead to a successful implementation and resulting service. In planning its pilot, GRTC researched ADA and Title VI compliance requirements and took time with the procurement and contracting process.
- Start the service slowly, allowing a gradual buildup of use by riders; a gradual buildup helps ensure the provider is not overwhelmed.
- If the cost of trips includes surge pricing, be sure to educate riders. GRTC reports some confusion in the early months of the pilot about the cost of trips, as riders did not understand that cost for the same trip could vary.
Contact
GRTC Transit System Corporate Office
301 East Belt Boulevard
Richmond, VA 23224
(804) 358-3871
http://ridegrtc.com/services/specialized-transportation/care/
http://ridegrtc.com/services/specialized-transportation/care-on-demand/
San Antonio, TX: VIA Taxi Subsidy Program
Background of Transit Agency
VIA Metropolitan Transit (VIA) is a public transportation authority serving 14 member cities and the unincorporated portion of Bexar County in South Texas, encompassing 1,208 square miles and a population close to two million. Based in San Antonio (Figure A-30), VIA operates fixed-route and express bus service, a general public on-demand service in northeast San Antonio, vanpool service, and ADA paratransit service known as VIAtrans.
VIAtrans: ADA Paratransit
VIAtrans is provided directly by VIA (Figure A-31) with supplemental service from two private contractors. Service is provided only to individuals who are certified as ADA paratransit-eligible. The VIAtrans service area conforms to ADA requirements—operating within the ¾-mile corridors of VIA’s fixed routes and within the service hours of specific fixed routes. This means VIAtrans is not available on the days and times or at locations where the corresponding fixed-route service is not operating.
The fare for a one-way trip is $2, which is less than twice the regular undiscounted one-way fare on fixed route ($1.30). The fare can be paid by cash or ticket which has the fare value.
According to prepandemic data, VIA had about 17,000 individuals registered as ADA paratransit eligible with approximately 8,000 identified as active riders (defined as taking at least two trips per week). And before the pandemic, VIAtrans was providing about 1 M trips per year.
Figure A-30. VIA Headquarters, San Antonio.
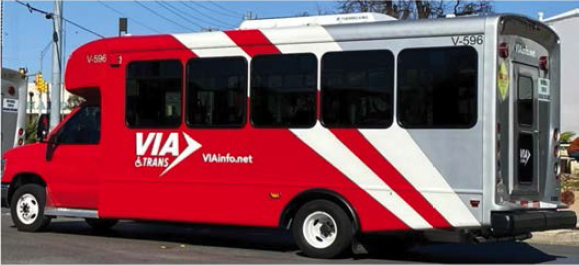
Figure A-31. VIAtrans vehicle.
Based on 2019 NTD data, VIAtrans carried 1,048,871 passenger trips of which 3% were operated by taxi. Cost per passenger trip for VIA-operation was $41.47 with $15.78 reported for taxi-based trips.
In addition to VIAtrans, VIA operates a same-day, on-demand taxi subsidy program for ADA paratransit riders. This taxi subsidy program was operated by a local taxi company—Yellow Cab—until August 2021, when the company went out of business and was purchased by another transportation company. This case study builds on information provided by VIA while the taxi subsidy program was operated by the taxi company (as provided through the research study’s survey in April 2021) and is supplemented with more recent information through discussions with VIA staff and the new transportation company.
Background, Planning, and Implementation
Background
The taxi subsidy program grew out of the efforts of disability community advocates who wanted a more spontaneous transportation option than next-day ADA paratransit. VIA had used taxis for various services in the past, before starting the taxi subsidy program.
One such service was known as Life Line and began about 2005 when VIA pulled back the ADA paratransit service area to the required ¾-mile corridors of fixed routes. Taxis were used to provide trips for the approximate 400 to 500 ADA paratransit-certified riders living outside the newly configured service area. Over the next several years as use and demand declined, the service was ended.
In response to the disability community’s request for a same-day service, VIA tried twice from 2014 to 2015 to implement a taxi-based same-day service. The transit agency received no fully responsive bids from its first or second RFP. The required insurance level was apparently an issue for the local taxi companies.
In 2016, VIA issued another RFP and received a responsive bid from Yellow Cab, which then had new management that understood the same-day taxi service for VIA represented a good business opportunity. Yellow Cab (Figure A-32) was the provider until it went out of business and was purchased in 2021.
Planning the Alternative Service
As reported by VIA in this study’s survey, the objectives of the taxi subsidy program included:
- Reduce demand for paratransit service
- Reduce overall cost and/or unit cost of transporting paratransit customers
- Provide an on-demand/same-day mobility option for paratransit customers
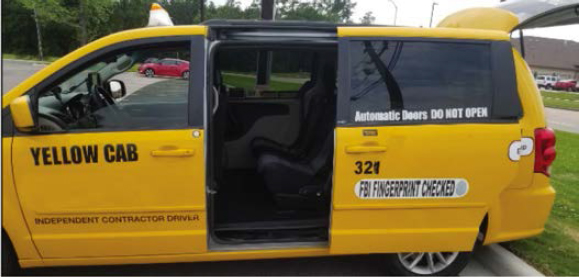
Figure A-32. Yellow Cab vehicle.
- Provide a mobility option that allows paratransit customers to travel beyond the ADA paratransit service area and service hours
During the case study interview, VIA staff added that there are many short VIAtrans trips, particularly going to nearby medical appointments, to Walmart, and work trips to daycare programs. Many of these trips seem more suited for a same-day on-demand service than for next-day ADA paratransit. Thus, the taxi subsidy program has provided a way to take some pressure off VIAtrans.
According to the survey response, VIA faced the following issues and challenges in planning and implementing the program:
- Providing equivalent service, including service response times, to customers requiring WAVs
- Limited number of taxi companies in the area
- Limited number of taxi companies in the area with WAVs
- Limited number of local taxi companies willing to participate in the program, e.g., reluctance due to high insurance coverage requirements or other transit agency requirements or issues
- Concerns about data collection for NTD reporting or transit agency performance monitoring
The issues revolving around accessible service were a particular concern for VIA, including whether the taxi-based service could provide equivalent response times for riders needing a WAV. VIA included language in the RFP that the provider was to submit data on response times so this aspect of service could be assessed.
Procurement/Contracting Process
VIA’s most recent procurement involved with the taxi subsidy program was initiated in December 2020. Titled “VIAtrans Supplemental Taxicab Services,” the RFP set out three scopes of work: (1) ADA paratransit service, (2) will-call on-demand service to supplement ADA paratransit, and (3) the same-day subsidy program. The RFP required proposers to submit a proposal for all three types of service and stated that an award would be made for all three services or none.
A number of companies responded to the RFP but only Yellow Cab was fully qualified, bringing experience from providing service for VIA for a number of years.
Yellow Cab was awarded a contract through the procurement, with a 3-year term and an option for an additional 2-year term.
Based on the contract, the three service types are:
ADA Paratransit Service
Service is provided on a dedicated basis, with payment by revenue hour. VIA schedules and assigns to the contractor peak-period overflow trips, trips in low-demand areas and at
low-demand times, and long out-of-the-way trips. Trips for the overflow and other real-time trips are estimated at 50 to 100 per day. The will-call trips are estimated at 50 to 75 per day.
The contractor is to ensure that 10% of its fleet for the service is wheelchair accessible. VIA provides DriverMate tablets for vehicles assigned to the ADA paratransit service. VIA sends the dedicated routes to the contractor the evening before for the next morning’s service and the morning of for the afternoon service. The contract details the requirements to ensure service is compliant with the ADA and with VIA policies for VIAtrans, including service within a 30-minute window. Drivers must have a criminal background check and submit to the FTA’s drug and alcohol testing requirements. The service span is 6 a.m.–6 p.m. on weekdays.
Will-Call On-Demand Service to Supplement ADA Paratransit Service
Service is provided on a nondedicated basis, with payment by the trip. The contractor is to respond to VIA dispatchers to serve trips in real time to address late-running vehicles, rider delays, vehicle breakdowns, and other service interruptions. This also involves responding to VIA dispatchers to serve return trips from medical appointments. VIA estimates about 50 to 100 trips per weekday. The contractor is to ensure that 10% of its fleet for the service is wheelchair accessible. The contract stipulates that VIA can assign trips the day before service for peak-period overflow trips, on the day of service to maintain VIAtrans on-time performance, and will-call trips on the day of service. The service span is 6 a.m.–6 p.m. on weekdays.
Same-Day Subsidy
This is an alternative service for VIAtrans taxi subsidy program riders, whose stated purpose is “to enhance quality of service for ADA paratransit-eligible customers by providing VIAtrans-eligible customers the option to travel same-day.” The RFP stated that transportation providers for the service may include taxis, TNCs, and private transportation providers, and that the FTA’s taxicab exception would not apply. Drivers for the same-day subsidy must meet FTA drug and alcohol testing requirements. The contractor is to ensure that 10% of its fleet for the service is wheelchair accessible.
Riders pay an initial fare of $2. For ambulatory trips, VIA subsidizes the trip up to $9 on the meter. For wheelchair trips, VIA subsidizes the trip up to $11 on the meter. The higher subsidy for wheelchair trips, according to the contract, is “to incentivize trips for customers in wheelchairs.” When the meter fare exceeds the subsidized amount, the rider is responsible for the overage. The contract specifies that VIA will not pay for rider no-shows.
VIA has set trip limits for weekdays and weekend days. The contract specifies that the contractor is to give trip requests from eligible riders the same attention and priority as any other request received from a nonsubsidized rider.
The contract includes requirements for equity under the heading “Service Requirements.” In this clause, VIA states: “VIA desires that ambulatory and nonambulatory VIA Subsidy Program customers receive the same quality of service. . . . To determine the Contractor’s performance in this regard, with particular attention to response time issues, the Contractor shall provide monthly data as described [later in the contract]. The data to be provided includes details on trip timeliness and trip type—ambulatory or wheelchair.”

Yellow Cab Purchased by zTrip
In August 2021, Yellow Cab was purchased by zTrip, a hybrid taxi-TNC transportation company based in Kansas City.
zTrip took over the Yellow Cab contract with VIA with no changes in requirements or service. VIA has been pleased thus far with zTrip’s performance.
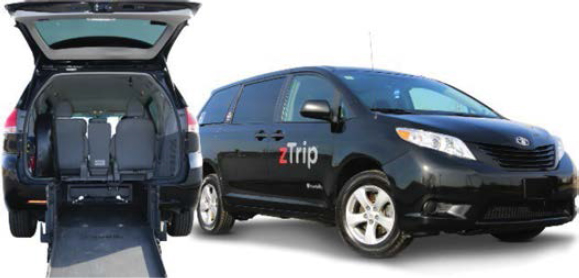
Figure A-33. zTrip vehicles.
VIA reported that zTrip will be upgrading the trip reservation system and dispatch technology used by Yellow Cab. zTrip will also provide an app that can be used to book trips (Figure A-34). Trip booking by phone will continue as well as trip payment by cash. Additionally, zTrip drivers will be using new vehicles. According to zTrip, efforts are well underway to implement the technology enhancements.
While VIA requires zTrip to use white vehicles branded with the VIA logo for the ADA paratransit service, zTrip has already introduced some of its zTrip branded vehicles (Figure A-33) for its other services, including the taxi subsidy program.
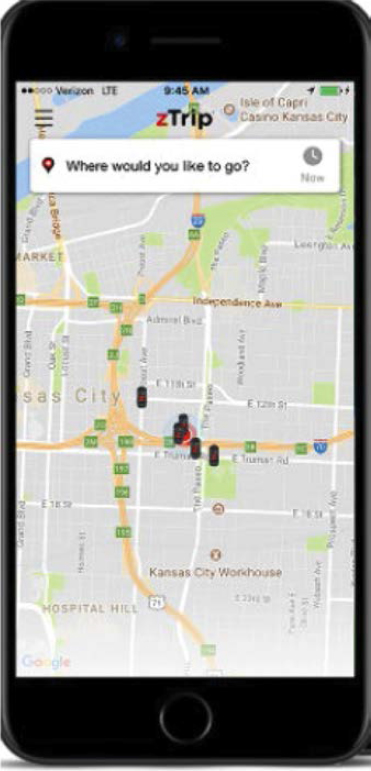
Figure A-34. Trip booking on a smartphone.
Current Design and Service Parameters
Service Framework
VIA’s taxi subsidy program began in 2016 as an ongoing program. It is now provided by one transportation company, zTrip.
Contract provisions address the following:
- Insurance. Among the insurance requirements is $1 million for commercial auto liability coverage. According to VIA’s response to the research study’s survey, this is a higher level than required by the local regulatory body.
- Drivers. The taxi drivers undergo fingerprint background checks and participate in drug and alcohol testing according to FTA regulations. Driver training includes that required by the city and state as well as by contract. WAV drivers are required to have passenger-assistance training.
- Data requirements. The contract requires submission of data for NTD reporting purposes, which includes vehicle and operations data. According to VIA’s response to the research study survey, it includes data for the taxi subsidy program in its NTD reports.
The contract also requires a weekly trip report in Excel with the following data:
- Trip date
- Time requested
- Trip time assigned
- Pickup time actual
- Pickup address
- Drop-off time
- Drop-off address
- Operator ID number
- Operator name
- Vehicle ID (and whether vehicle is wheelchair accessible)
- Customer ID number and name
- Trip miles
- Trip unique ID
- Passenger by type: customer, PCA, companion(s)
- Fare
Also required per the contract is a report that compares riders who use the taxi subsidy program with riders who do not use the taxi subsidy program on the following factors, with the data disaggregated by weekday versus weekend day and by time period (5–9 a.m.; 9 a.m.–3 p.m.; 3–6:30 p.m.; 6:30 p.m.–12:30 a.m.):
- Trip request time and assigned times (time to respond to request)
- Trip requested and pickup time (time to pick up customer—response time)
- Trip requests for customers using a wheelchair
This report is interesting: VIA wants to ensure its riders using the taxi subsidy program are served in a similar manner as the taxi company’s general public, private-pay passengers. The report’s data is intended to review the extent to which VIA’s riders (the subsidized ADA paratransit riders) receive service at the same level as the taxi company’s unsubsidized general-public riders.
This assessment is a variant of reviewing the difference in service levels for ADA paratransit riders who use a taxi sedan versus those ADA paratransit riders who need a wheelchair-accessible vehicle, and in particular, any differences in response time. It is this latter assessment that would review whether the taxi subsidy program meets ADA’s service equivalency requirements for response time.
- Liquidated damages. The contract includes liquidated damages to be assessed to the contractor if a customer exceeds the 20 trips allowed per calendar month. The assessment is $20 per trip over the limit.
Service Parameters
- Eligibility. Individuals who are ADA paratransit eligible. Riders who are eligible have a VIA-issued ID card.
- Service area. Trips are provided within VIA’s service area.
- Service span. Service is available Monday through Friday from 4 to 1 a.m. and Saturday, Sunday, and holidays from 6 a.m. to 8 p.m. The call center is to be open during those hours for trip requests. Initially, the taxi subsidy program was available only on weekdays.
- Trip characteristics. Trips are direct, origin to destination, with no shared riding. Service is curb-to-curb. There is a trip response time requirement of 20 minutes. A no-show for a taxi subsidy trip counts as a no-show for VIAtrans and therefore is subject to the VIAtrans no-show policy and suspension if excessive no-shows. No-show data are collected by the contractor and reported to VIA. Trip denials are rare. VIA reports that about 10–15% of the trips are wheelchair trips.
- Trip booking and scheduling procedures. Trips are booked by phone directly with zTrip by phone and eventually with the app. Riders can book a same-day trip or an advance reservation trip.
-
Fare structure and methods of payment. Riders pay $2 at the start of the trip (this is the same fare as for a VIAtrans trip), either in cash or with a $2 value VIAtrans ticket. A PCA is not charged a fare, but companions are.
- VIA pays the next $9 of the trip’s meter fare. For riders who use wheelchairs and need an accessible taxi, VIA pays up to $11 of the meter cost. If the meter fare is greater than $11, or $13 for a rider using a wheelchair, the rider pays the overage. Each eligible rider may take up to 20 trips per month.
- VIA pays a flat rate of $7 for all trips with a meter rate of $9 or less.
- Drivers are not to solicit tips.
-
Trip limits. The subsidy program is structured with a limit of 250 trips on weekdays, 150 trips on Saturdays, and 100 trips on Sundays. In practice, if the number of trip requests exceeds the daily cap, those extra trips are carried over to the next day’s total; trip limits are actually implemented as a monthly tally. Pre-COVID, the soft cap of 250 trips a day, 150 on Saturdays and 100 on Sundays was reached regularly. During COVID, these caps were not being met, as trip levels reduced to 60% of pre-COVID.
- Riders are limited to 20 trips per month. The contractor is required to keep track of the number of trips per rider. Liquidated damages may be assessed if a rider exceeds their trip limit. The contract specifies that the contractor must have technology that can track the number of trips per customer per month.
- The trip limits were established soon after the taxi subsidy program began because of increasing demand.
- Vehicles. During service hours, 10% of the vehicle fleet is to be wheelchair accessible.
- Driver availability. It is reported that drivers are generally available for VIA’s taxi subsidy program trips; these are trips with guaranteed payment. It may sometimes be an issue for a rider to get a trip during peak hours, but there is invariably another driver willing to respond.
Data
In the research project’s survey, VIA reported that a number of data elements are tracked, including:
- Total passenger trips provided
- Total fare revenue collected
- Total cost to provide the program
- Total passenger miles
- Total passenger trips by trip origin and trip destinations
- Total passenger trips by day and time of day
- Total passenger trips requested/provided for each rider
Performance Metrics for Monitoring Service
Through the research project’s survey, VIA reported that it reviews the following metrics to evaluate the taxi subsidy program:
- Overall cost (combined cost of the ADA paratransit service and the alternative service)
- Cost per passenger trip (combined cost of the ADA paratransit service and the alternative service)
- Overall customer ridership
- Number of passenger trips requiring a WAV
- Customer satisfaction/complaint frequency ratio
The transit agency reports that an emphasis for data monitoring is the division of trips between ambulatory and wheelchair and differences in response times.
Overall, the taxi subsidy program is a relatively small component of VIA’s services for its ADA paratransit riders without a major impact on VIAtrans, the ADA paratransit service. Some of the riders feel more comfortable using and relying on VIAtrans, however, the transit agency is trying to educate riders about the taxi subsidy option.
Operating and Financial Data for the Alternative Service
Summary Data for Fiscal Years 2019 to 2021
For FY 2019, 2020, and 2021, VIA provided summary cost and operating data for its taxi subsidy program; see Table A-7.
Total passenger trips is the total number of passengers given transportation for the year; categorization by ambulatory versus wheelchair trips was not available. The decrease in use after 2019 is a result of the pandemic. The total fare revenue collected represents the $2 fare paid by each rider when using the taxi subsidy program. Total program cost is the amount paid to the contractor, while the total cost to VIA represents the total cost minus the federal Section 5310 grant funds used for the program. Total miles represent the equivalent of total revenue miles, as the taxi meter computes miles from pickup to drop off. The taxi subsidy program is very cost-effective even without the grant support. The cost per passenger trip ranged from $7.83 in 2019 to $8.04 in 2021. Calculated with the grant support, the cost per passenger trip ranged from $3.91 in 2019 to $4.03 in 2021.
These costs can be compared to the cost data given to the NTD. For report year 2019, VIA reported that cost per demand-response trip was $41.47 (which did not include its ADA paratransit taxi subcontracted service). For report year 2020, the reported cost per passenger trip was
Table A-7. VIA’s taxi subsidy program, FY 2019–2021.
| Taxi Subsidy Program | 2019 | 2020 | 2021 |
|---|---|---|---|
| Total Passenger Trips | 67,553 | 48,432 | 30,377 |
| Total Fare Collected | $146,928.00 | $118,634.00 | $73,662.00 |
| Total Program Costs | $528,637.83 | $407,048.81 | $244,170.69 |
| Total cost to VIA | $264,337.79 | $204,795.37 | $122,547.15 |
| Total Miles | 146,246 | 105,724 | 83,500 |
$48.36, which seems to incorporate the cost for the ADA taxi subcontracted service, as the cost for the taxi component is not reported separately as it was in 2019.
Operating Data: August 2019 versus August 2021
Using detailed data submitted to VIA by the taxi contractor for 2 sample months, data on response time, trip length, and meter cost have been calculated; see Table A-8.
Monthly ridership reflects the decrease in use with the pandemic. Response time, based on the monthly average, is still within the 20-minute standard in the contract. Very small numbers of trips show response times of one hour or more. Trip distances, again based on averages, have increased, suggesting that riders may have shifted some of their longer trips previously taken on VIAtrans’s shared ride service to the taxi program. The monthly meter cost averages align with the longer trip distances.
Achievement of Goals and Objectives
VIA’s objectives for its on-demand program are modest, and the transit agency says they have been achieved. The taxi subsidy program is a small but nonetheless important and beneficial component of VIA’s services for its ADA paratransit riders.
VIA reports that should use of the program rebound to levels pre-pandemic and begin consistently reaching the daily trip caps and if funding is available, the transit agency could consider plans for its expansion.
Method to Determine Cost Savings from Trips Shifting to the Alternative Service?
According to the research project’s survey, VIA does not have a method to estimate or determine cost savings from the shifting of trips to the taxi subsidy program.
Lessons Learned
VIA suggested that it will make some minor changes to the taxi subsidy program to enhance the service related to trip limits, specifically to formalize their implementation with flexibility. Rather than treating the daily caps as a hard rule, VIA would use them as a monthly total. That means, for example, trip requests on a particular weekday could exceed the daily cap of 250, but over the month, trip volumes would need to be adjusted to stay within the monthly total. Similarly, if a daily trip limit was not reached on a particular day, the unused trips could be used on subsequent days.
VIA also reported that it learned the importance of building a strong relationship with the contractor. Such a relationship helps ensure the contractor understands what the transit agency is seeking and expects from the program.
Table A-8. VIA’s taxi subsidy program, August 2019 versus August 2021.
| August 2019 | August 2021 | |
|---|---|---|
| Total Trips | 6,045 | 974 |
| Response Time | ||
| -Average | 12 min. | 18 min. |
| -Number trips 1 hr. or more | 9 trips | 24 trips |
| (0.1% of total) | (2.5% of total) | |
| Trip Distance | ||
| -Average | 2.3 miles | 9.7 miles |
| Meter Cost | ||
| -Average | $9.42 | $25.65 |
Advice to Other Transit Agencies
- Ensure adequate funding for the program before implementation.
- Know the contractor you are working with and forge a good working relationship—ensure the contractor understands what you need from the program.
- Carry over your agency’s standards for service to the subsidy program’s service.
- Monitor the service carefully and particularly watch for driver fraud; include in the agreement the ability to remove a driver from the program. VIA compares trip vouchers submitted by drivers with actual invoices, which has caught fraud in the past.
- Ensure there are guardrails for drivers. This requires close monitoring of service and invoices. VIA reviews invoices to look for anomalies. VIA’s advice is to do that for the first few invoices to get the contractor’s attention.
Contact
VIA Metropolitan Transit
800. W. Myrtle St.
San Antonio, TX 78212
(210) 362-2000
This page intentionally left blank.


