

CHAPTER 6
ASET Data Tool
This chapter presents the data tool developed for this project, called the alternative services estimation tool or ASET. The tool has been designed for planning the parameters of a new alternative service as well as estimating the cost savings from an existing alternative service. Step-by-step instructions for using the Excel-based tool are provided.
Background
ASET is built in an Excel workbook and divided into two sections: (1) the planning calculator and (2) the cost savings calculator. ASET is intended as a planning and evaluation tool to estimate results from alternative service parameters as well as costs and ridership.
The planning calculator is built using examples of alternative services and subsequent paratransit service demand growth rates calculated from researched transit agencies with alternative services in this project. Your agency’s alternative service may have lower or higher rates of passenger demand for your service depending on local conditions in your service area.
The cost savings calculator is built on a method developed by the MBTA to estimate the cost savings (if any) from an alternative service in comparison to the estimated paratransit trips that would have occurred without the alternative service.
Both ASET calculator tabs require assembling data and parameter information to produce accurate results.
Starting Out in ASET
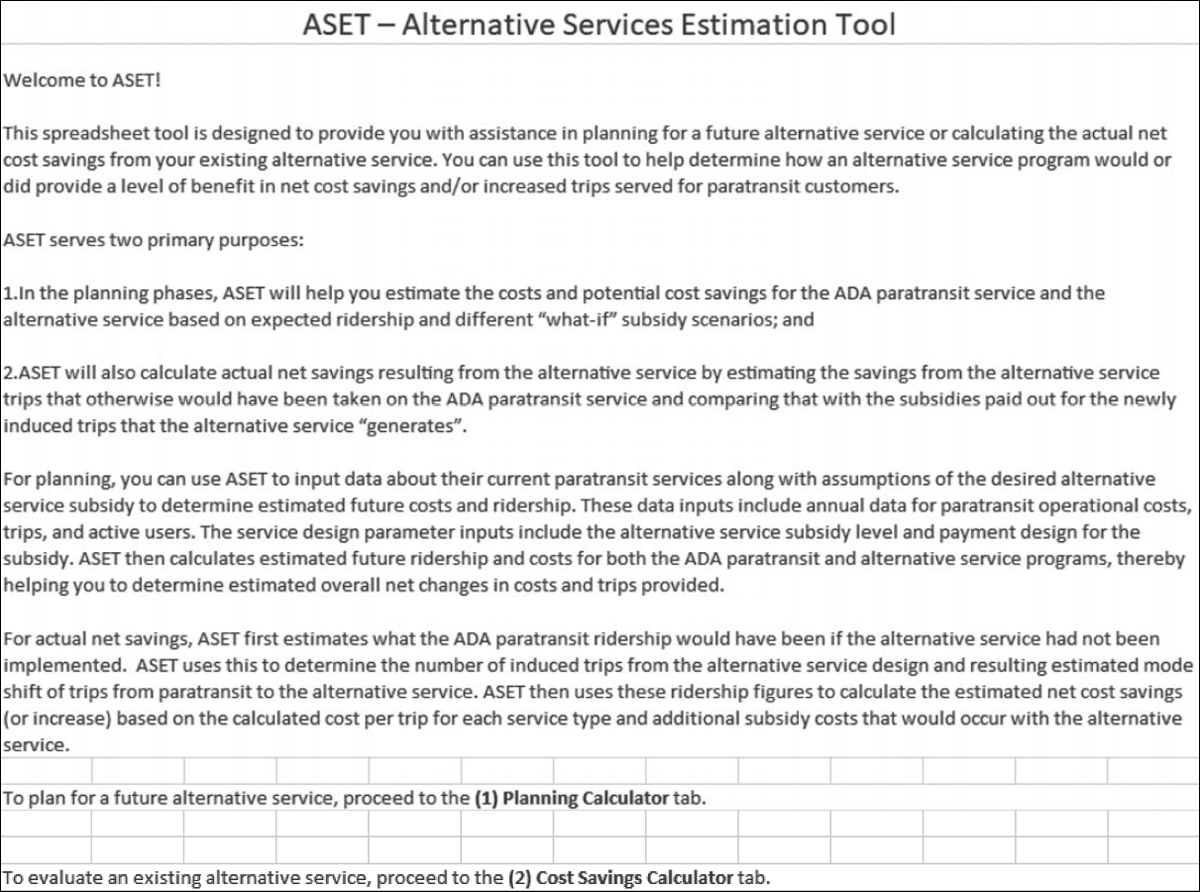
When you first open the ASET Excel workbook, you will see the welcome tab with a description of the tool as shown in Figure 6-1.
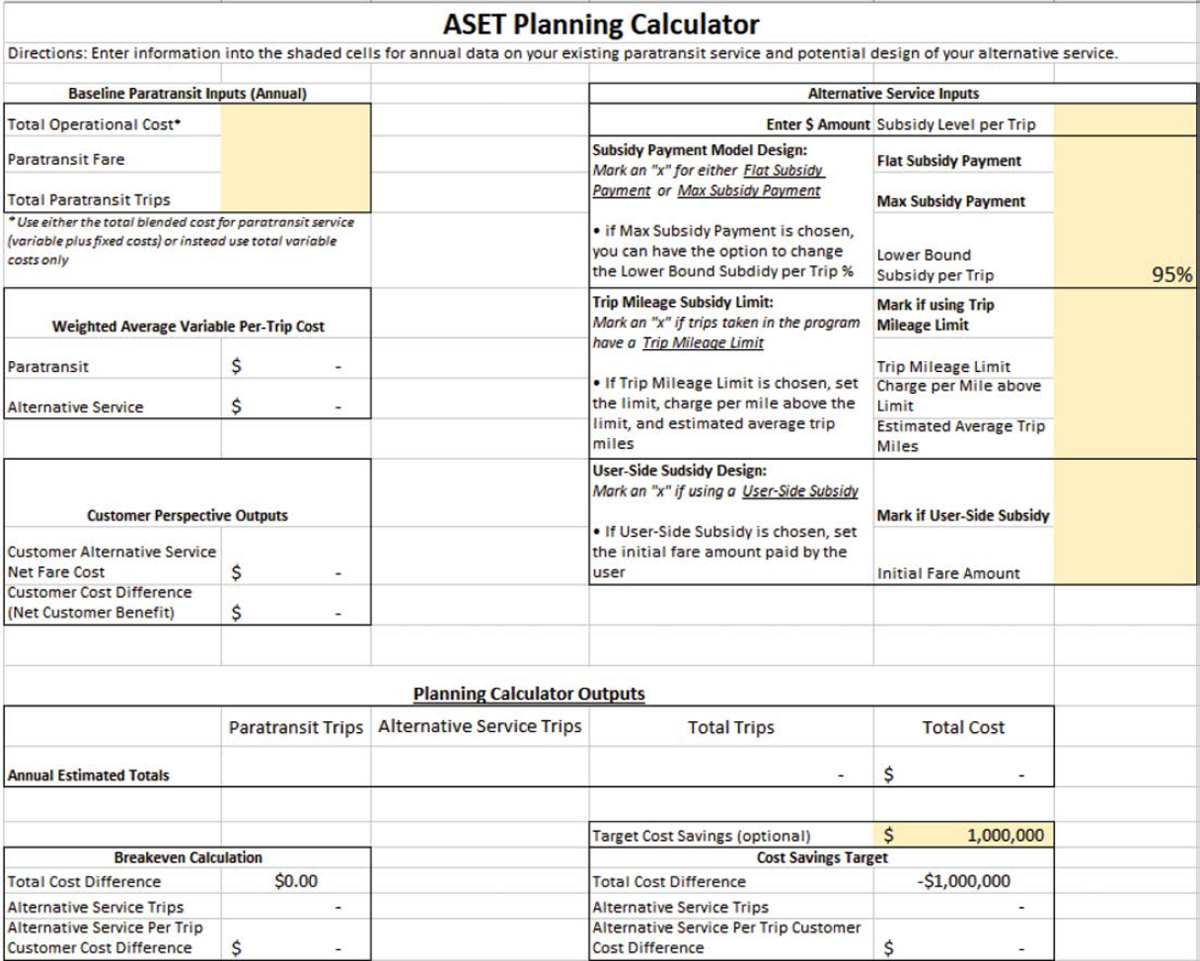
Next, you can click over to either the planning calculator or the cost savings calculator tab. The planning calculator requires three annual data items for your existing paratransit service: total operational cost, paratransit fare, and total paratransit trips. For total operational cost, you may use either the total blended cost for paratransit service (variable plus fixed costs) or total variable costs only. For the alternative service, you will need to provide information on the desired subsidy level per trip, whether the service will use a flat or maximum subsidy payment structure, whether the service will have a trip mileage limit for subsidized trips, and whether the service will have a user-side subsidy. You will also have the option to enter a desired annual cost savings target based on the results of your alternative service design parameters.
The planning calculator tab will appear as shown in Figure 6-2 when opened for the first time.
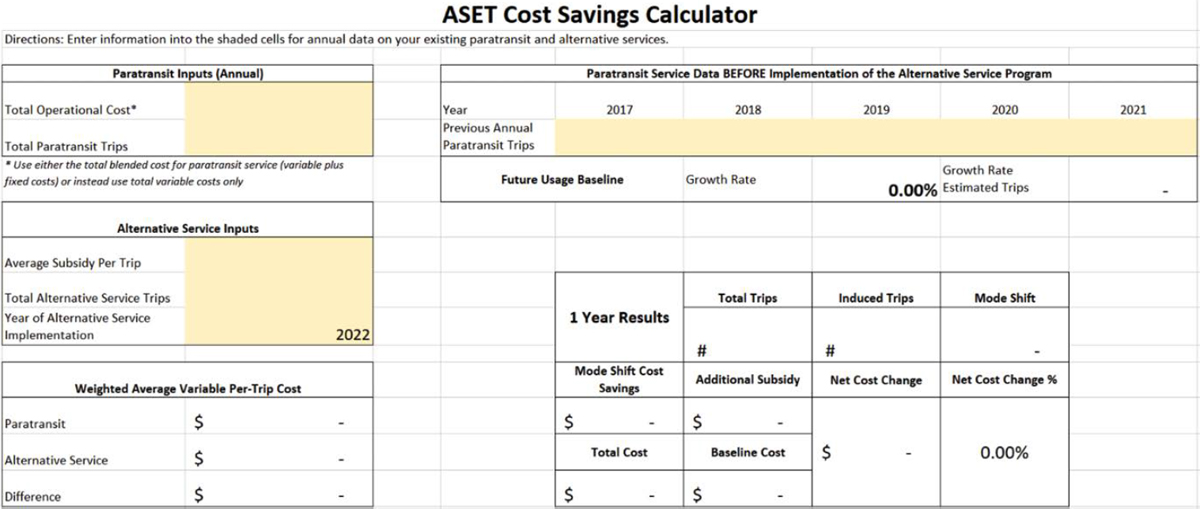
The cost savings calculator requires annual data for actual trip demand and costs observed for both your paratransit and alternative services. For the alternative service, you will need data for the average subsidy per trip (based on agency cost), the total number of trips, and the year the alternative service was implemented. For your paratransit service, you will need the total operational cost and trips from the past year as well as the annual paratransit trips for the previous five years before the alternative service was implemented. For total operational cost, you may use either the total blended cost for paratransit service (variable plus fixed costs) or total variable costs only.
The cost savings calculator tab will appear as shown in Figure 6-3 when opened for the first time.
Planning Calculator
This section discusses the data input and results for each step of the planning calculator tab.
Baseline Paratransit Inputs (Annual)
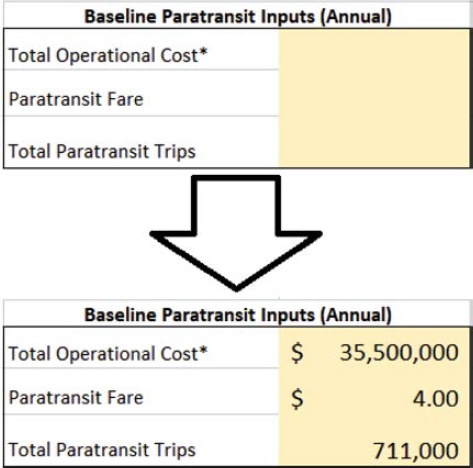
There are three data inputs for your existing paratransit service (Figure 6-4):
- Total operational cost: enter the total dollar amount for the cumulative operational costs of your paratransit service over the last fiscal year or the last twelve months of service. You can use either the total blended cost for paratransit service (variable plus fixed costs) or total variable costs only.
- Paratransit fare: enter the standard fare for your paratransit service; do not use discounted fare rates.
- Total paratransit trips: enter the total trips for your paratransit service over the last fiscal year or the last twelve months of service (the same period you used for total operational cost).
Alternative Service Inputs
For alternative service inputs, you will enter information on the subsidy payment model design as well as the user-side subsidy design, if applicable (Figure 6-5).
Subsidy Payment Model Design
First, enter the planned subsidy level for each alternative service trip:
- Subsidy level per trip: enter a dollar amount.
Next, choose one of the following:
- Flat subsidy payment: type “x” in the cell to indicate that your agency will pay the full subsidy level per trip amount to the alternative service provider(s) for each trip taken. This will use the full subsidy level per trip amount as the cost for each alternative service trip.
- Max subsidy payment: type “x” in the cell to indicate that your agency will pay up to the subsidy level per trip amount to the alternative service provider(s) for each trip taken. This will use a percentage of the subsidy level per trip amount as the cost for each alternative service trip.
If you indicate planning a max subsidy payment design for the alternative service, you will have the option to set the percentage threshold for the subsidy per trip that would be taken on average by customers.
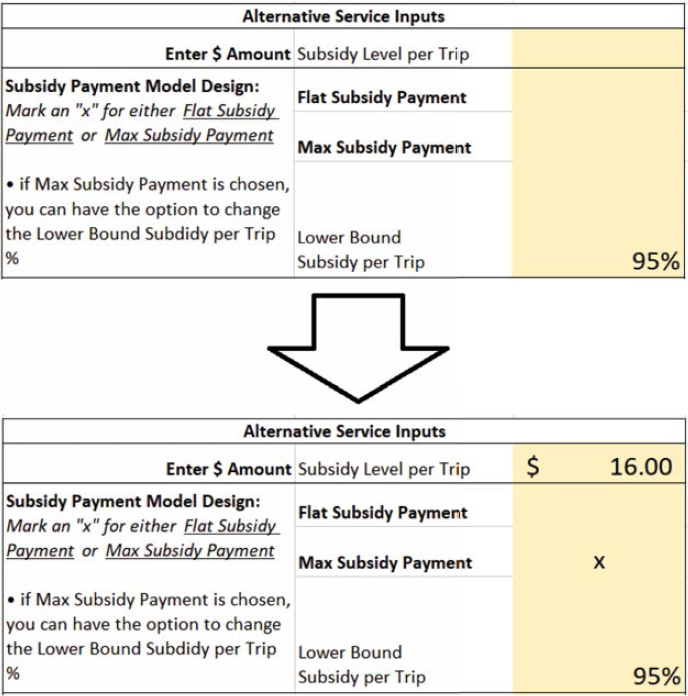
- Lower bound subsidy per trip: enter the percentage for the average portion of the available subsidy per trip that you estimate will be used by customers. This cell is prepopulated using a 95% threshold.
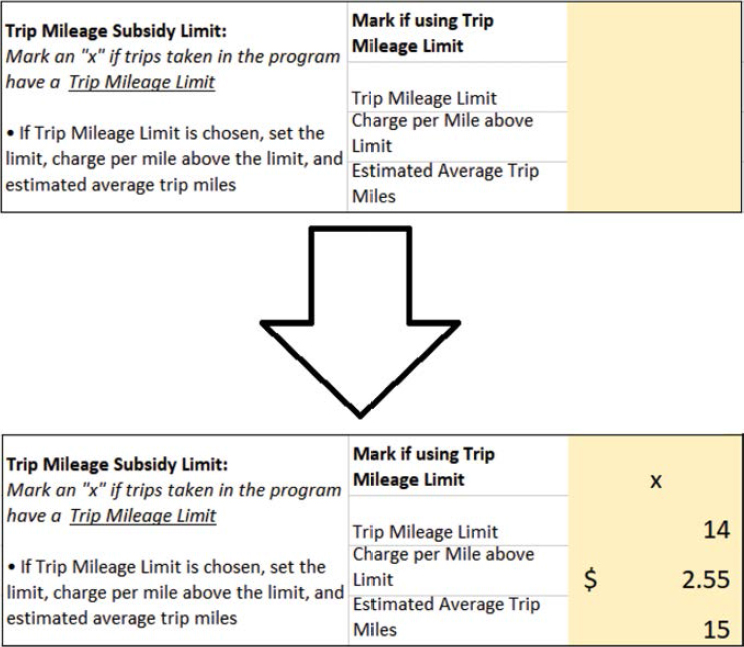
Trip Mileage Subsidy Limit
Indicate if the alternative service will have a mileage limit for subsidized trips, and if so, what the mileage limit is, the charge per mile above the limit, and the estimated average trip miles for alternative service customers (Figure 6-6):
- If using trip mileage subsidy limit: type “x” in the cell to indicate that the customer will pay a charge for trips that surpass a set trip mileage limit.
- Trip mileage limit: enter the number of subsidized miles alternative service trips will be limited to.
- Charge per mile above limit: enter a dollar amount the customer will pay per mile of the alternative service trip over the trip mileage limit.
- Estimated average trip miles: enter the number of estimated miles per trip that customers will take on the alternative service.
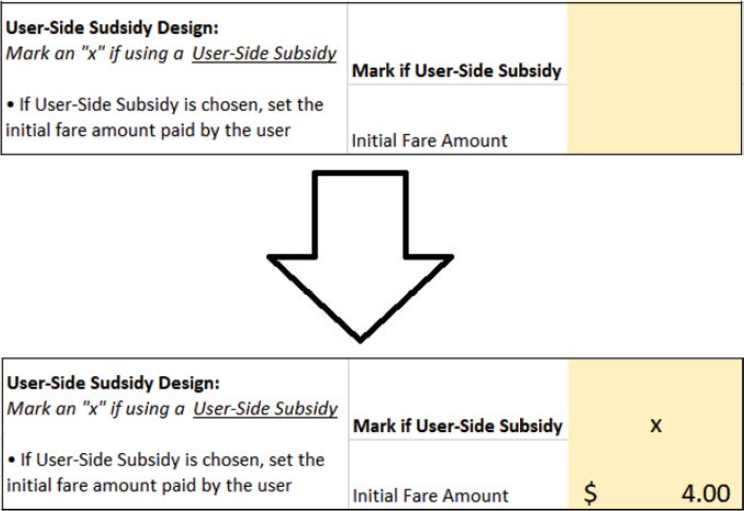
User-Side Subsidy Design
Indicate if the alternative service will have a user-side subsidy, and if so, what initial fare amount will the customer pay (Figure 6-7):
- If user-side subsidy: type “x” in the cell to indicate that the customer will pay an initial fare or subsequent charge beyond a mileage limit for each trip taken.
- Initial fare amount: enter a dollar amount for the initial customer fare on the alternative service.
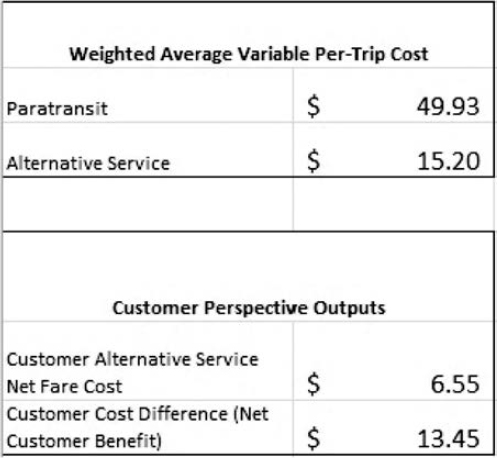
Calculated Per-Trip Cost and Customer Perspective Outputs
The planning calculator tab calculates the paratransit per-trip cost and the estimated alternative service per-trip cost based on the data inputs in the previous sections. It also calculates the net fare cost for the alternative service and the cost difference to the customer of paying a paratransit fare versus using the alternative service (Figure 6-8).
- Paratransit: total operational cost divided by total paratransit trips
- Alternative service: calculated subsidy level per trip (based on either a flat subsidy payment or max subsidy payment design) minus initial fare amount for a user-side subsidy program, if applicable
- Customer alternative service net fare cost: initial fare amount plus charge per mile above limit multiplied by average trip miles minus mileage limit
- Customer cost difference (net customer benefit): subsidy level per trip plus paratransit fare minus customer alternative service net fare cost
Planning Calculator Outputs
Based on the current paratransit service data and the planning parameters for the future alternative service, the planning calculator (Figure 6-9) produces the following outputs for estimating the number of trips on each service and the total cumulative service cost:
- Paratransit trips: estimated annual paratransit trips after the new alternative service is implemented
- Alternative service trips: estimated annual alternative service trips based on the service design parameters and current paratransit demand
- Total trips: estimated paratransit trips plus alternative service trips
- Total cost: estimated paratransit trips multiplied by paratransit per-trip cost plus estimated alternative service trips multiplied by alternative service per-trip cost
The planning calculator also automatically calculates the alternative service trips and customer cost difference targets for the agency to either break even or hit a cost savings target with the future alternative service.
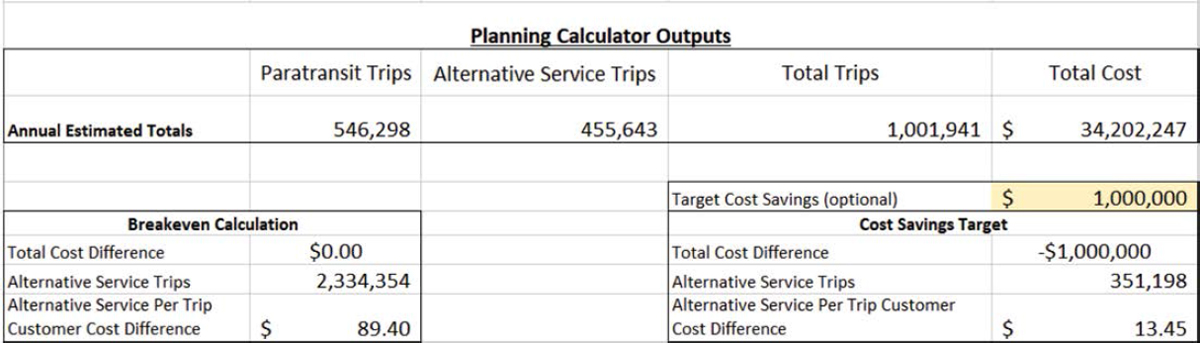
Breakeven Calculation
The breakeven calculation finds the number of trips and level of customer cost difference needed for the total cost output to equal the total operational cost of current paratransit service. The results for all three fields in this section are automatically calculated:
- Total cost difference: set at $0
- Alternative service trips: target of alternative service trips for the agency to break even
- Alternative service per trip customer cost difference: target of customer cost difference for the agency to break even
Cost Savings Target
The cost savings target finds the number of trips and level of customer cost difference needed for the total cost output to be less than the total operational cost of current paratransit service according to a set target.
- Target cost savings (optional): enter a dollar amount for the target annual cost savings.
The results for the remaining three fields in this section are automatically calculated:
- Total cost difference: set at $0
- Alternative service trips: target of alternative service trips for the agency to hit the target cost savings
- Alternative service per trip customer cost difference: target of customer cost difference for the agency to hit the target cost savings
Cost Savings Calculator
This section discusses the data input and results for each step of the cost savings calculator tab.
Paratransit Inputs (Annual)
There are two data inputs for the paratransit service over the last year (Figure 6-10):
- Total operational cost: enter the total dollar amount for the cumulative operational costs of your paratransit service over the last fiscal year or the last twelve months of service.
- Total paratransit trips: enter the total trips for your paratransit service over the last fiscal year or the last twelve months of service (the same period you used for total operational cost).
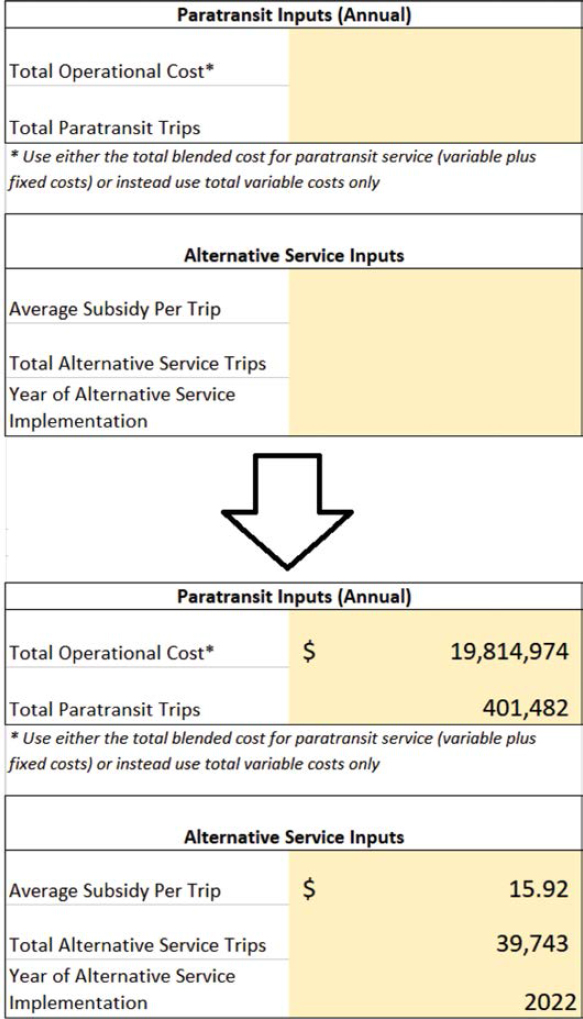
Alternative Service Inputs
There are three data inputs for alternative service over the last year (Figure 6-10):
- Average subsidy per trip: enter the calculated dollar amount of the subsidy cost per alternative service trip paid by your agency to the provider(s) over the last fiscal year or the last twelve months of service (the same period you used for paratransit inputs data); subtract the initial fare amount paid by customers for a user-side subsidy program (if applicable).
- Total alternative service trips: enter the total trips for your alternative service over the last annual fiscal year period or the last twelve months of service (the same period you used for paratransit inputs data).
- Year of alternative service implementation: enter the calendar year the alternative service was implemented (which should cover the same twelve-month period as the fields above).
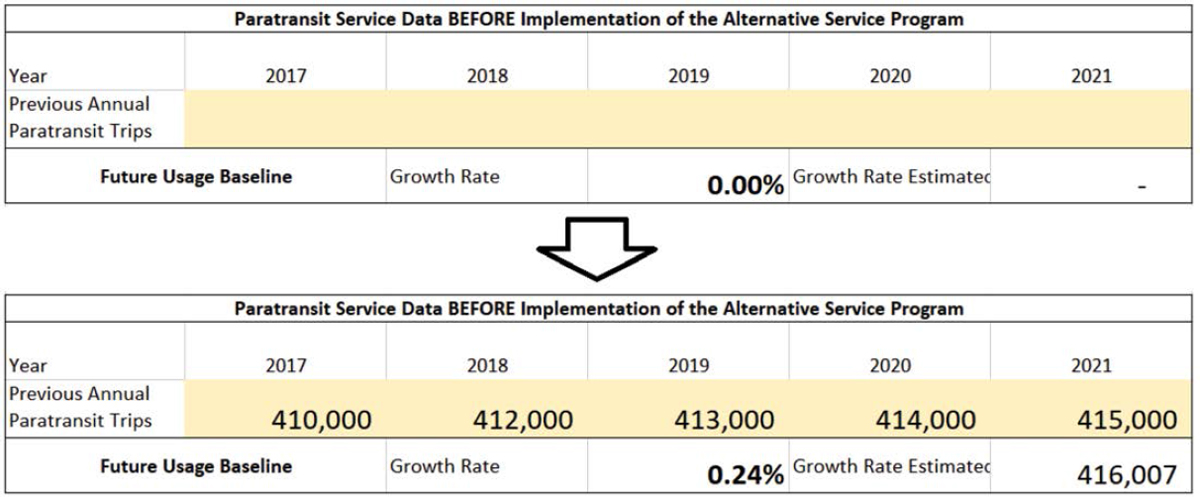
Paratransit Service Data before Implementation
Based on the number entered for year of alternative service implementation in the previous section, provide the data for annual paratransit trips in the preceding five annual service periods (calendar years are automatically generated based on the year of alternative service implementation; Figure 6-11):
- Previous annual paratransit trips: enter the number of annual paratransit trips in each of the five shaded cells below the year labels
- Growth rate: calculated percentage of growth between year 1 and year 5 in the 5-year period before alternative service implementation
- Growth rate estimated trips: estimated number of paratransit trips that would have occurred without the implementation of the alternative service based on the growth rate
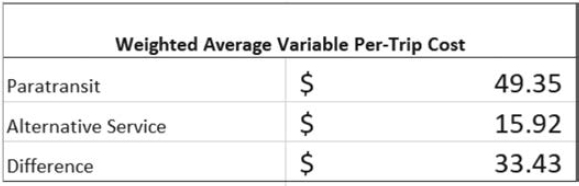
Weighted-Average Variable Per-Trip Cost
The cost savings calculator tab calculates the paratransit and alternative service per-trip costs based on the data inputs in the previous sections (Figure 6-12).
- Paratransit: total operational cost divided by total paratransit trips
- Alternative Service: equal to average subsidy per trip
- Difference: paratransit minus alternative service per-trip costs
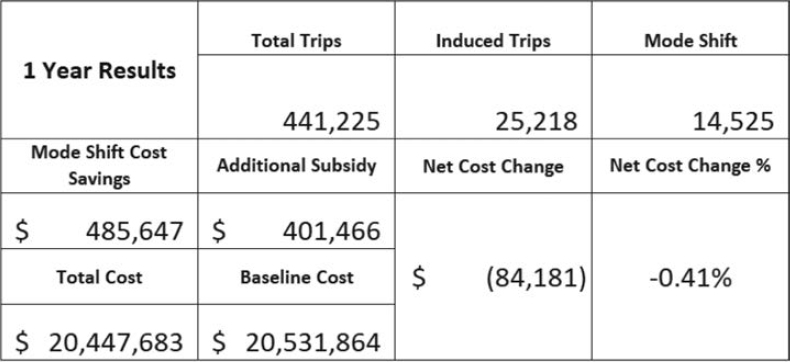
1-Year Results
The cost savings calculator tab calculates the estimated cost savings for 1 year of the alternative service using a method that compares the number of alternative service trips to the estimated number of paratransit trips that would have occurred if the alternative service were not available (Figure 6-13).
- Total trips: total paratransit trips plus total alternative service trips
- Induced trips: total trips minus growth rate estimated trips
- Mode shift: total alternative service trips minus induced trips
- Mode-shift cost savings: mode shift trips multiplied by difference in per-trip costs
- Additional subsidy: induced trips multiplied by alternative service per-trip cost
- Total cost: total paratransit trips multiplied by paratransit per-trip cost plus estimated total alternative service trips multiplied by alternative service per-trip cost
- Baseline cost: growth rate estimated trips multiplied by paratransit per-trip cost
- Net cost change: additional subsidy minus mode-shift cost savings; equal to baseline cost minus total cost
- Net cost change %: net cost change divided by total cost
Checklist
□ Determine the parameters of your prospective alternative service, including whether it will use a provider- or user-side subsidy model, any imposed trip mileage limits, and the subsidy levels.
□ Determine any cost savings goals for your alternative service (if desired).
□ Assemble the annual cost and ridership data for your paratransit service; to estimate cost savings, this includes ridership over the 5 years of service before your alternative service.
□ For planning, determine whether the provider-side subsidy program will provide a flat or maximum subsidy payment for customer trips; if maximum, estimate the average percentage of the entire subsidy amount available for the lower bound percentage.
□ For planning a user-side subsidy program, determine the mileage limit for user trips without additional customer cost and the charge per mile above the mileage limit to be paid by customers.
□ Use the breakeven and cost-savings targets as needed to help plan and budget for the alternative service.
□ Evaluate cost savings of an existing alternative service using service-cost and historical ridership data.


