
3
Materials Characterization
SECOND-DAY MORNING SESSION
A brief recap of the previous day’s discussions by Saryu Fensin, Los Alamos National Laboratory, was followed by an introduction of the second day’s panel by Thomas A. Witten, University of Chicago. It featured four speakers: Gregory B. Thompson, University of Alabama; Elizabeth Rasmussen, National Institute of Standards and Technology (NIST); Dana D. Dlott, University of Illinois at Urbana-Champaign; and Aeriel D.M. Leonard, The Ohio State University. A brief discussion period followed each presentation.
Thermo-Mechanical Testing and Characterization in Extreme Environments
Gregory B. Thompson, University of Alabama, began by speaking about the importance of characterizing materials in extreme environments, such as at extreme temperatures, under high strains, or under irradiation. It is important to test under these conditions because they are the conditions that materials are exposed to in such uses as hypersonic vehicles or fusion reactors. Ultimately, he said, the goal is to learn enough about how materials behave in these environments to be able to understand the fundamental mechanisms shaping their properties under these conditions.
Thompson focused on thermo-mechanical testing of materials—that is, testing under extreme temperatures and mechanical strain. To illustrate the sorts of
problems one encounters in thermo-mechanical testing at high temperatures, he showed a diagram of a typical device with a graphite furnace in which a sample is put under a mechanical load. One of the problems, he said, is materials compatibility. For instance, placing one material on top of another at high temperature can produce a eutectic—a compound material with a melting point lower than the melting points of any of its individual components. Furthermore, the graphite furnace will produce carbon, which may interact with the sample in various ways, perhaps changing the sample’s properties. Oxidation of the sample is also a concern. The combination of these factors limits testing temperatures in conventional devices to about 2,000°C, he said, which is much lower than researchers need for their study of materials in extreme environments.
Many of these issues can be alleviated by testing devices that use some form of non-contact loading and measurement, Thompson said, offering two examples of how this can work. The first was some work done in mid-2000s at the NASA Marshall Space Flight Center in Huntsville, Alabama (Lee et al. 2007). The researchers used electrostatic levitation to keep a niobium metal sample floating as it was being tested, using a laser to heat the sample (Figure 3-1). If the laser was slightly off-center, the laser’s photons transferred more momentum to one side of the sample than the other, causing the sample to spin. With this method the researchers were able to spin the sample at up to thousands of revolutions per second, which in turn caused the sample to deform under the resulting centrifugal force. The researchers used a high-speed camera to capture the deformation and calculate the creep ratio. They were able to determine the value of the creep at temperatures as high as 2,300°C—much higher than conventional devices could accomplish.
This technique has at least two advantages as a testing method, Thompson said. The first is that it uses small sample sizes, which is advantageous for many of the materials designed for extreme environments, as they can be very expensive to produce. The second is that the technique has the potential to study a reasonably broad range of materials.
Among the technique’s disadvantages is that the small sample size can be a limitation since a small sample may not be representative of a larger component. Also, the stress on the sample is radially distributed, so the stress varies as a function of the distance from the axis of rotation; this is different from typical test where a fixed area of a sample is placed under a fixed load. And in the original study, the researchers ran the experiment in a vacuum to avoid oxidation of the sample, but then they lost more than 6 percent of the niobium sample to evaporation, which changed the geometry of the sample.
Thompson next described a second non-contact testing method, this one that uses magnets and an electric current to create a Lorenz force that bends the sample. The technique was originally developed by John Halloran of the University of Michigan and colleagues (Gangireddy et al. 2010) and later modified by
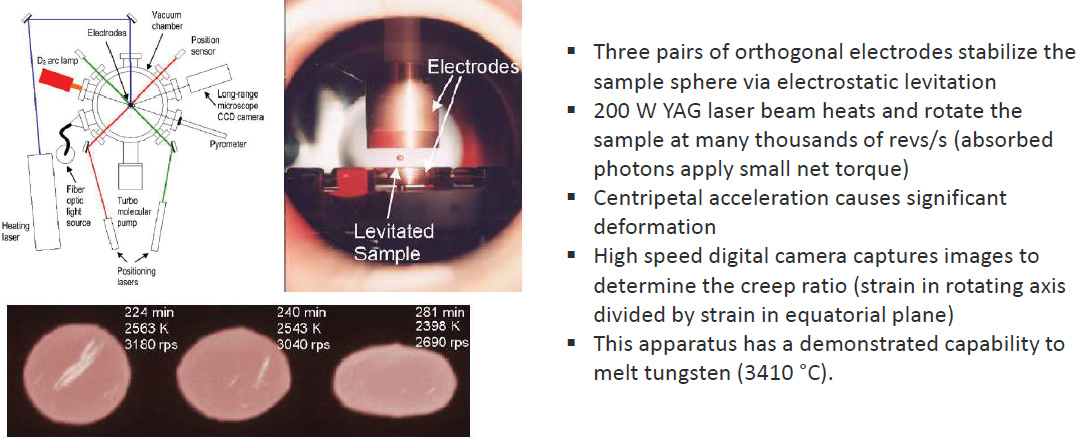
SOURCES: Gregory Thompson, University of Alabama, presentation to the workshop, October 6, 2022. Images from J. Lee, R.C. Bradshaw, R.W. Hyers, et al., 2007, “Non-Contact Measurement of Creep Resistance of Ultra-High Temperature Materials,” Materials Science and Engineering: A 463(1–2):185–196; Copyright 2007, with permission from Elsevier.
Thompson’s team (Morris et al. 2013). In Thompson’s method, an electromagnet is used so that the magnetic field can be varied to create isoloading conditions. The team also used an environmental chamber to control the conditions the sample was exposed to. This was important, for instance, in understanding how a tantalum carbide sample would lose significant amounts of carbon when the sample was heated, even when the heating was done in an inert atmosphere. So, the team flowed methane over the sample, which allowed them to add carbon to the sample and, with the right conditions, to keep the sample’s composition and phase stable over the course of an experiment.
Using that experimental setup, Thompson’s team was able to carry out some remarkable property measurements at ultra-high temperatures. For instance, they measured how much a tantalum carbide rod bent under force at various temperatures up to 2,900°C, showing that the bending increased with increasing temperature (Smith et al. 2018). The bending was particularly interesting because tantalum carbide is a ceramic and is stiff at lower temperatures. It was also possible to use the apparatus to measure creep, he added.
Thompson noted that in these examples he wanted to show the ability to access extremely high temperature regimes and to do so in a way that relieved some of these problems of touching. These non-contact methods have their own challenges because they are using a lot of current, and so for example electromigration becomes an issue, and researchers must consider the effect that might have on a material’s properties.
Switching gears from extreme temperatures to extreme loading, Thompson next described shock testing of nanocrystalline metals carried out at the U.S. Army Research Laboratory (Hornbuckle et al. 2021). The material they tested was a copper-tantalum alloy that had been ball-milled and put into solution, where the tantalum precipitates out, pinning the grains. The result is a very stable grain structure, with no apparent grain growth even at temperatures up to 95 percent of the melting temperature of copper. They tested the grains with a large mechanical shock and found significant damage to the grains, including dislocation and grain growth, but when they added back tantalum to bring the alloy up to 3 percent tantalum, they found that the grains were remarkably stable when exposed to shock—the grains did not grow, and there were no noticeable dislocations.
It is also possible to test materials at extreme temperatures and extreme mechanical properties at the same time, Thompson said, describing as an example a tool developed at Sandia National Laboratory. The tool is based on a transmission electron microscope (TEM), but it has 27 different holders attached that make it possible to do different things with the sample, such as cryogenic testing, high-temperature testing, and mechanical testing. The tool, called the in situ ion irradiation TEM (I3TEM), has been used to run a variety of tests, including testing
samples under a mechanical load that are simultaneously being heated up by a laser (Parrish et al. 2021).
Among the challenges of this sort of experiment with a mechanical load applied to the sample is how to make an indenter that can be pushed into the sample to get data on how the sample responds. The Sandia team used an yttrium-oxide single crystal as its indenter, chosen because it had thermal properties similar to the sample and the tip and sample need to be at the same temperature so as to not have a thermal gradient when they touch each other. The drawback of that choice, Thompson said, was that the indenter and sample also had similar elastic compliance and strength, while one normally wants the indenter to be made from a material harder than the sample. This is typical, he said, in that there are always pros and cons to be weighed and compromises to be made.
Another challenge is how to prepare a sample for testing under extreme conditions, such as high temperatures. Thompson described several issues that his team has encountered with their samples. In one case, the platinum in welds used to hold a sample in place interacted with copper in the sample once the temperature reached 300°C, forming copper-platinum intermetallics. And when the team put down a copper-carbon film to keep atoms from migrating from the sample, the combination delaminated once the temperature was raised.
Thompson then moved on to describing various methods for measuring temperatures in testing systems. Each has its strengths and weaknesses. For example, the Sandia group used parallel beam electron diffraction (Niekiel et al. 2017), but the beam alignment is critical, he said, and “as you heat up the sample, the sample will move out of eutectic, and that changes the accuracy of your measurement, so you have to be really careful.” Another technique uses a scanning tunneling electron microscope (STEM) probe to examine convergent beam electron diffraction (CBED) patterns, which makes it possible to achieve high spatial resolution (Wehmeyer et al. 2018). A third also uses a STEM probe, but in this case, it is paired with electron energy loss spectroscopy (EELS) (Mecklenburg et al. 2015). These are all clever ways of making property measurements in a non-contact way, he said.
Besides measurements at high temperatures, it is also possible to measure material properties at low temperatures, Thompson said, briefly describing some work his team did on thermo-mechanical testing at −150°C. It turned out to be quite difficult, he said, but ultimately his team was successful.
In summary, he said that in situ electron microscopy offer unique capabilities for probing phase stability, deformation mechanisms, and other properties, but developing measurement methods and specimen preparation is challenging. And, looking to the future, he noted that extreme environments offer a rich-realm of experimental opportunities in instrumentation development, measurement science, and, ultimately, materials development.
Status and Gaps in Thermodynamic Metrology of Materials in Extreme Environments
Elizabeth Rasmussen, NIST, offered a broad overview of the status of measuring thermodynamic properties of materials in extreme environments, including experimental techniques, data availability, and data-driven models; then offered a description of her own work in the field; and ended up with a discussion of gaps and opportunities in the field as well as open questions.
Thermodynamics properties, she elaborated, include such things as temperature, pressure, volume, and entropy, and these properties are interrelated with well-known formulae expressing those relationships among the different variables.
Concerning thermodynamic metrology, she continued, an important thing to keep in mind is that the features of measurement technique influence the uncertainty of the measurement. The key features include the size of the sample (larger samples lead to less uncertainty), the measurement of sample conditions during the experiment (direct measure leads to lower uncertainty than indirect measure), the time that the sample is in the experimental conditions (longer times lead to smaller uncertainties), the measurement of the property (absolute measures produce lower uncertainties than relative measures), and the uncertainty in the state variables (lower uncertainties in temperature, pressure, volume, etc., lead to lower uncertainties in the measurement of the property of interest).
Noting that previous workshop speakers had discussed a lack of temperature standards in extreme environments, Rasmussen said that there are temperature standards, but people often do not use them. For example, she said, nearly a dozen international metrology institutes, including NIST in the United States, have recommended using the values of the melting points of several eutectic alloys (rhenium-carbon, platinum-carbon, and cobalt-carbon) as the basis of thermodynamic temperature measurements at high temperatures above 1,000°C.
With that in mind, she offered several best practices that will help improve the state of the field: regularly calibrate thermocouples and other temperature-measuring equipment; keep abreast of standards activities and apply the most current standards; and pass along important knowledge—such as how to calibrate a thermocouple—on to the next generation of scientists. “If you’re not giving students those skills,” she said, “how can you expect anything from them?”
Continuing with her discussion of experimental metrology techniques, she briefly discussed two types of methods for measuring the speed of sound in materials. The first type was pulse techniques. A common example is the pulse-echo method, in which mechanical pulses are sent through a buffer rod and into a materials sample, and then one detects the resulting echo. Knowing the size of the sample (and of the buffer rod) and the time it takes for the pulse to return,
one can calculate the speed of sound in the sample. This method has been used at temperatures up to about 1,625°C, but only at atmospheric pressure.
The key features of the technique are that the sample size is generally large, there is direct measurement of the sample conditions (temperature and pressure), the time the sample is at experimental conditions is at least a number of minutes and often a couple of hours, and the measurement of the property is via a relative technique. The uncertainty of the state variables is where much of the uncertainty in the measurement arises, and the overall uncertainty is relatively low.
Next, she discussed measuring the speed of sound in diamond anvil cells, which allow higher temperatures and higher pressures. Researchers have produced conditions of nearly 6,000°C and up to 500 gigapascals in these cells, although uncertainty in the measurements is increased at these more extreme conditions. The key features of this technique are that the measurement of the sample conditions is mainly indirect, the time the sample is at experimental conditions is somewhat long, the measurement of the property is via a relative technique, and the uncertainty of the state variables is pretty high. Thus, the overall uncertainty of speed-of-sound measurements in diamond anvil cells is greater than with pulse techniques.
Moving on to data availability, Rasmussen said that it is important to understand the differences between collected data sets, calculated data sets, and curated data sets. A collected data set is a repository where the burden of growth is on the community, there is minimal oversight of data quality, and missing data are okay. Calculated data come from density functional theory, machine learning, artificial intelligence, CALPHAD methods, or simulations. And curated databases have a focus on experimental data, assigned uncertainties are associated with the data, and measured data are differentiated from calculated data.
Many materials databases exist, she said, but most are collections or calculated databases. There are few curated ones. Examples of curated databases include the NIST Alloy Database, the NIST Structural Ceramics Database, and the NIST Phase Equilibrium Diagrams Database.
Using the NIST Alloy Database to illustrate current data availability, she noted that there are many areas with relatively little data. For speed-of-sound measurements, for example, most of the data are from relatively low pressures, and more than a third of all speed-of-sound measurements in metals were in pure mercury.
Concerning the reporting of data for materials in extreme environments, she said that the field is in the early stages. However, as data availability grows, it will be important to hold authors accountable for good publishing practices, such as providing detailed information on what, where, and how. She pointed to the Journal of Chemical and Engineering Data as offering a good example of the sorts of publishing requirements that will help the field grow. The end goal of such requirements, she said, is to publish “accurate, precise, reproducible, and consequential data that will have a greater impact.”
Switching to the topic of data-driven models, she first emphasized the importance of good, reliable data for use in the models. As an example, she spoke of equation-of-state modeling, which captures algebraic relationships between pressure, temperature, and volume. The simplest form is the Ideal Gas Law, PV = nRT, where P = pressure, V = volume, n = amount of gas, R = the ideal gas constant, and T = temperature. There are more complex versions of the law that have increased accuracy over larger ranges of temperature and pressure, she noted. Similarly, an equation of state for solid phases can be expressed in terms of temperature, pressure, and the Gibbs energy.
Equations of state are empirical, data-driven models for thermodynamic properties. Advances in equation-of-state modeling are only possible with the collection of more reference-quality experimental data, Rasmussen said.
Her own work, she said, is in accumulating speed-of-sound data for various materials at a range of temperatures and pressure. The goal is to provide data that can be used in modeling thermodynamic equations of states, filling in gaps in the existing data by gathering speed-of-sound data on more elements and pure phase fluids. Her group has developed an automated instrument that can take speed-of-sound data at temperatures up to about 1,425°C and at pressures up to 2 gigapascals with about 0.1 percent uncertainty. It will run for days without human interaction, she said, and it should be operational for at least 10 years.
This instrument will make it possible to create new reference data for liquid elements with melting points over −75°C. With this data and given “anchor points” of density and specific heat capacity as a function of temperature from the literature, it will be possible to calculate all thermodynamic properties in the form of an equation of state. Currently, she noted, few equations of state exist for elements and even fewer for multi-component materials such as alloys and ceramics.
In the last part of her presentation, Rasmussen spoke of gaps, consequences, and opportunities. The first gap she identified concerns data and experimental methods. There are few measurement techniques or facilities for generating reference-quality data on materials in extreme conditions. There is also a lack of innovation in methods to measure these properties. A result of this gap is that there is a lack of accurate data available. There is also a mindset that the limits of experimental availability have been reached, so researchers must generate properties with just simulations. This can be dangerous, she said. So, there is an opportunity here—an opportunity to encourage reference-quality experimental pursuits by, for example, rewarding high-quality experimental pursuits with citations, awards, money, promotions, and so on. She emphasized to researchers to not just cite the equation-of-state papers, but also to cite the data that supported the equation of state.
A second gap is the failure to use standards in extreme conditions and a lack of understanding of the implications of uncertainties. A result of this gap is that there is increased uncertainty in the data, making them less useful for theoretical
computations. Opportunities for action include using standards where they exist, supporting the creation of standards at extreme conditions, and holding one another accountable for uncertainty reporting, calibration, and consideration in computations.
The third gap she identified is a lack of reference thermodynamic (equation of state) models for condensed matter at extreme conditions, which leads to less accurate simulation and models and a failure to translate simulations to real-world environments. The opportunity is to use advanced thermodynamic theory and modeling from reliable experimental data and to create data-driven simulations to guide the design and synthesis of systems in extreme environments.
In conclusion, Rasmussen offered a list of open questions concerning the thermo-physical properties of materials in extreme environments:
- To what extent do computations based on data with over 5 percent uncertainty affect advances in extreme environments?
- How does one prioritize materials to analyze for curated databases, calculated databases, and data measurements?
- How will we hold the community accountable to using standards in materials experiments, dissemination, collection, calculation, and curation?
- How can we eliminate creating (and funding) parallel programs, or programs that claim have a novel standalone product, when it would in reality it be more appropriate to collaborate with established programs?
In the discussion period following her presentation, Rasmussen addressed a question about the trade-off between accuracy and throughput in experiments that produce measurements of fundamental thermodynamic properties. High-throughput, lesser-accuracy experiments are more important when identifying what the materials of interest are, she said, at which point one can then focus on low-throughput, high-accuracy measurements on the few materials that have been picked out as, for instance, being of most value to industry. In response to another question about how to encourage greater focus on standards, she offered several thoughts. First, it is important to pass down knowledge and expertise to coming generations so that it is not lost; mentorships could play an important role here. Industry should be doing its part to encourage the development of standards, and the federal government should “just take pride in standards,” she said.
Tabletop Hypervelocity Launcher for Studying Extreme Materials
Following Rasmussen, Dana D. Dlott, University of Illinois at Urbana-Champaign, described how he studies materials under extreme conditions that he creates by using a pulsed laser to launch “little bullets” into the material. It is a technique
that can be used for studying almost anything, he said. Furthermore, the experiments are easy to perform, extremely reproducible, and create extreme dynamic conditions with nanosecond timing. He uses velocimetry to get absolute pressure measurements, while temperatures are determined via advanced pyrometry and hyperspatial imaging.
As an example, he first showed a short video of an experiment at the Massachusetts Institute of Technology where a laser is used to launch steel balls at tin. The material of the target is not important. He noted that once you have this technique, you can use it to shoot it at pretty much anything.
After a brief overview of planar shockwaves, Dlott described his team’s experimental setup. The general idea is that they glue some metal foil onto a piece of glass and shoot a laser at it, which causes a bit of the metal foil, called a “flyer plate,” to detach and zoom through the air. The foils can be of various materials, including metals and plastics, and of different thicknesses. What this does, he continued, “is you can get really quite high velocities, and you make this planar impact, and you can put a huge amount of energy into a sample without ionizing inlet lasers or ionization.” A photon Doppler velocimeter is used to determine the velocity of the flyer plate during each run.
The current setup, which uses a tabletop YAG laser, can get the flyer plates to a velocity of 6 km/s when very thin foil is used. The team is installing a new laser that is 10 joules—four times the energy of the existing laser—and they hope to be able to reach 10–12 km/s with the flyer plates. The velocity is very consistent from shot to shot.
After moving a short distance, the flyer plate hits a target, which was glass in the experiments Dlott described. When it hits the target, the velocity of the plate drops sharply but does not go to zero since it imparts some momentum to the target. The drop in velocity takes place over a very brief period, typically 1–2 nanoseconds for a thin film and on the order of 12 nanoseconds for a thick, 70-micron film. From those velocity and deceleration period measurements it is possible to calculate the pressure exerted by the impact as well as other variables.
When shooting aluminum foil at water with this setup, it is possible to get pressures of up to 25 gigapascals, Dlott said, which is approximately 250,000 atmospheres. The resulting temperature in this situation will be 2,200 K or 1,925°C. “Water is a low-density compressible material,” he commented, “and if you shoot this at plastic or if you shoot it at metal, you’re not going to get that temperature.”
The key feature here is that shockwave created by shooting a flyer plate into a target creates extreme conditions as the shock goes through the sample. “If you use a sample that’s 10 microns thick,” he said, “then you can get a couple nanoseconds you’re at thousands of degrees and many gigapascals.”
Dlott’s team will typically fabricate an array of 50 to 200 samples, take a couple of hours to fire shots into the samples, and then spend a week analyzing the result-
ing data. Much of that data are collected by an optical pyrometer which uses a prism to separate visible light into 32 different wavelengths and determine the intensity of each. The data can be used to determine the temperature of a sample, but there are several difficulties with the technique that must first be overcome.
Other techniques can also be used to analyze the impact of the flyer plate on a target. Dlott mentioned hyperspectral imaging, which relies on a high-speed color camera that detects red, green, and blue wavelengths separately, and stimulated Raman scattering, which can also be used to determine the temperature of an object. The stimulated Raman spectroscopy temperatures are particularly useful, he said, in cases where a sample is burning or blowing up and emitting a lot of light, so one must analyze an intense coherent beam.
As an example of how the team’s shockwave analysis methods can be put to work on a practical problem, he described work studying the detonation of plastic-bonded explosives. The simplest plastic-bonded explosive has three parts: the explosive, which is some kind of organic powder, a polymer binder, and then a collection of voids scattered throughout the material. The voids are an inevitable part of the mixture, he said, and you cannot get rid of them.
The team studies the plastic-bonded explosives by sending flyer plates into targets containing an array of tiny “bombs,” each one weighing only about 100 micrograms (Figure 3-2). “When it blows up, you hear a little pop,” he said, and then they study the material with an X-ray microscope and pyrometry. They are most interested in what they call hot spots. “When you put a shockwave into one of these materials,” he explained, “there are some regions where the energy of the shockwave gets concentrated and causes the explosive to ignite, and those are called hot spots.”
Work at national laboratories has shown that when a shockwave travels through a plastic-bonded explosive, the hot spots develop behind the shockwave and then coalesce, leading to a detonation. He noted that understanding hot spots is very important not only for safety, but also for measuring how explosives work. “What matters is the microstructure, so there is a lot of interest in controlling the microstructure.”
His team developed a method of finding the hot spots in a plastic-bonded explosive. They are usually difficult to see because the material itself is opaque. The team got around this problem by fabricating thin wafers of plastic-bonded explosive that are about the thickness of a single crystal of the explosive, roughly 30 microns, and then shooting a flyer plate at the wafer, creating a shockwave that traveled through the wafer, detonating the explosive within it. They then use pyrometry to observe, on a scale of nanoseconds, the thermal emissions from each of the individual crystals of explosive within the wafer. The resulting patterns of thermal emission are like fingerprints of the individual detonations, depending on the material, the shockwave, the microstructure, and so on.
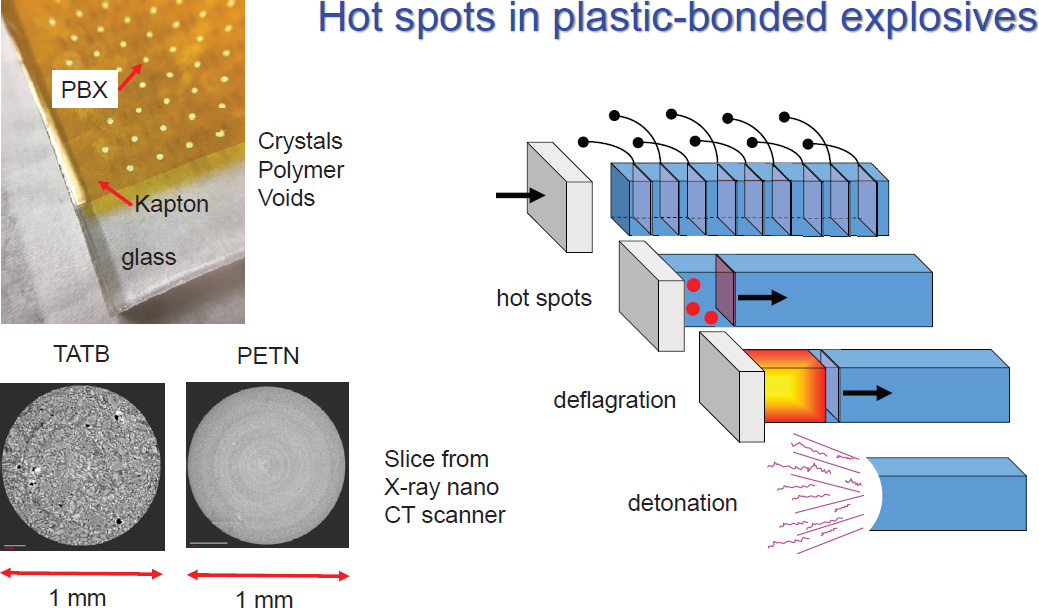
SOURCES: Dana Dlott, University of Illinois at Urbana-Champaign, presentation to the workshop, October 6, 2022. “Crystals Polymer Voids” and “Slice from X-ray nano CT scanner” images are reprinted from Li and Dlott, 2022, “High Throughput Tabletop Shock Techniques and Measurements,” Journal of Applied Physics 131(7):075901, with the permission of AIP Publishing.
What they have found by examining the detonations is that when a shockwave hits it squeezes the voids in the materials, igniting hot spots. Then you end up with an ensemble of hot spots that have different sizes and temperatures. The gas in those little pores has a low thermal mass, so it does not really do much, but it makes a lot of light. After a while, all of the hot spots die off except for the largest, hottest ones, which they call the “critical hot spots.” And those cause a reaction that spreads through the material, creating the explosion.
Dlott’s team uses a high-throughput technique, doing 50 shots a day and accumulating a large amount of data. He noted that this would be a job for machine learning, so the machine can figure out where the hot spots are coming from.
Finally, Dlott mentioned several other potential applications for this shockwave analysis technique. One is understanding what happens in a pulsed detonation engine, where small fuel droplets are detonated in a chamber all at once, creating a shockwave. He stated that the Air Force has posed the question, “What happens to the fuel droplets when the shockwave goes by?” Another question is what happens when a water droplet in the atmosphere encounters the shockwave associated with a hypersonic missile? It is not known what shape a water droplet is when it hits a hypersonic missile, which is an important question because water hit by a shockwave is extremely reactive.
Dlott closed by listing additional areas related to the effects of shockwaves on materials that offer interesting open questions. These included the role of interfaces in shocked materials, the dynamics of detonations, shock transient metallization, the chemistry of shocked water, and the chemistry of shocked biological systems.
Advanced Microscopy Techniques for Understanding Dislocation Interactions and Damage in Complex Microstructures
Aeriel D.M. Leonard, The Ohio State University, began her talk with some brief context about the history of materials development from the Stone Age to present. At each point in time the availability of certain materials drove both the economy and the culture. In the future, however, the needs of the planet—and the need to reduce humanity’s ecological footprint—may shape the development of materials. “In my opinion we’re really looking at living in the ‘sustainability age,’” she said. Thus, while looking for materials with greater performance, it will also be important to think about the demand for the metals and goods needed to create this performance and to consider how that will affect humanity’s ecological footprint. “So how,” she asked, “do we balance that demand for materials and goods … with the Earth’s carrying capacity?”
Leonard noted there are several strategies that can be used to improve materials while also reducing their ecological footprint. One is finding substitute materials that have a smaller footprint, such as lighter materials for cars and airplanes, which will reduce fuel usage. Another is creating materials with longer lifetimes so that they do not need to be replaced as often and fewer materials end up as trash. A third is developing new manufacturing methods, such as additive manufacturing, that yield less waste and require less power and materials. A fourth is designing objects so that they either can be reused or recycled or else that they do not damage the environment so much when they are disposed of. All of these strategies require understanding materials’ properties at the micro and macro levels in order to design optimum materials for different uses.
With this introduction, she said that the focus of her presentation would be the task of finding complex metal alloys as well as modifications to mature materials systems that would increase sustainability.
“To me,” she explained, “complex metals are things that are microstructurally and compositionally complex alloys.” In particular, she studies an alloy, nickel-aluminum-bronze, which fits the definition of a microstructurally and compositionally complex alloy (MCCA). It contains various kappa phases with different morphologies and compositions, which leads to the different phases interacting with dislocations in very different ways. This is very important because dislocations drive mechanical behavior.
As a result, the nickel-aluminum-bronze alloys that she studies can have complex deformation behavior, and it is this behavior that she studies. The question driving much of her work is: How do dislocation interactions within MCCAs influence deformation and damage behavior when the material is subjected to a mechanical load?
For the rest of her presentation, Leonard described one project she is working on that is aimed at illuminating this question. The project is focused on dislocation interactions in wire-arc additively manufactured (WAAM) nickel-aluminum-bronze. This material is important because it has good strength and ductility, has excellent corrosion resistance, and is used in ship propellers, which she believes makes it important to the U.S. Navy. The material is complex and contains several kappa phases with varying compositions and morphologies. Wire-arc additive manufacturing makes it possible to manufacture large structures relatively quickly, even on a ship away from land-based manufacturing facilities.
But the method also leads to varying solidification rates across the component being manufactured (due to the re-melting and re-heating of layers during the process), which leads to the creation of very different microstructures at different points in the component. Traditionally propellers and other objects made from the nickel-aluminum-bronze alloy are cast, so the WAAM materials will differ from the traditional versions in their microstructures, and the question Leonard is asking is whether and how these different microstructures—the kappa phases—change the material’s fatigue behavior.
Scanning electron microscopes (SEMs) show that when the alloy is formed by casting and hot rolling it has a much different microstructure than the WAAM alloy (Figure 3-3). The WAAM structure is much finer, with coarser precipitates than the cast and hot-rolled material. The WAAM material has four kappa phases, κ1, κ2, κ3, and κ4, although only the first three phases can be seen in the SEM image, as the fourth is very tiny. The different phases have varying compositions, varying morphologies, and different sizes.
The question Leonard addressed in her research was whether she could link dislocation interactions within the precipitates of the different phases to the tensile behavior of the entire alloy. Because the kappa phases have varying sizes, answering the question requires studying the material at different scales, and she used SEM, TEM, and micro-computed tomography. She noted that one of the big takeaways was that as length scale decreases, the sample size decreases. So, the statistics that we can gain decreases. While SEM allows the probing of many grains, with TEM the image is of only a grain or two.
Different imaging techniques provide different information. For instance, electron backscatter diffraction (EBSD), an SEM-based technique, provides information on crystallographic orientation, which can be related to lattice distortions, where strain in the alloy has been localized. Energy-dispersive spectroscopy (EDS),
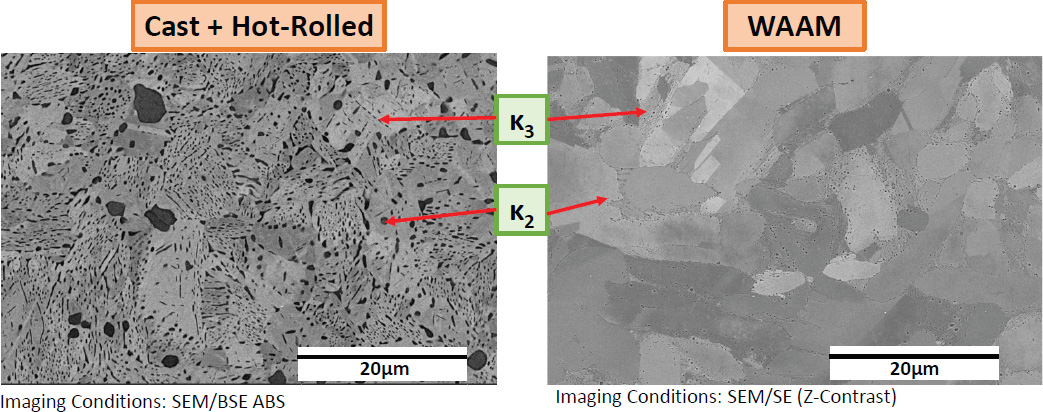
SOURCE: Aeriel D.M. Leonard, The Ohio State University, presentation to the workshop, October 6, 2022.
which can be used with either SEM or TEM, provides information about chemical composition.
Leonard went into detail on what she learned about the various microstructures in WAAM nickel-aluminum-bronze as well as dislocation behavior and what it meant for the alloy’s properties. For instance, SEM-EBSD revealed strain localization around the grain boundaries of the κ3 phase. Electron-channeling contrast imaging (ECCI), which is an SEM technique, showed high dislocation density within α-grains. In her studies, she moves back and forth between scales. The SEM shows where there is strain localization, but it does not reveal the dislocation interactions with the specific precipitates, for which TEM is needed.
Specifically, she is looking for hot spots which would be the places where a crack would start when the material was put under stress. By finding places where there is a high localization of strain and zooming in to examine spots in detail, she gains understanding of the material’s tensile strength and its limits.
In closing, Leonard emphasized, “What I really want you to understand and take away from this is we can use complex materials to really understand how we can increase sustainability, balancing the demand for goods and services with understanding the Earth’s carrying capacity.”
SECOND-DAY AFTERNOON SESSION
The second day’s afternoon session was chaired by Condensed Matter and Materials Research Committee member Raymundo Arroyave, Texas A&M University, who introduced the three speakers. Maria K. Chan, Argonne National Laboratory;
Scott T. Misture, Alfred University; and Joshua C. Agar, Drexel University. A discussion period followed the three presentations.
Where Are the Atoms?: Toward Real-Time Inversion of Characterization Data
Maria K. Chan, Argonne National Laboratory, explained that her work in energy materials, such as those found in batteries and solar cells, did not require extreme conditions. “Extreme conditions for a photovoltaic cell are 85°C and 85 percent humidity,” she said. “So 3,000°C is completely brand new to me.” Still, she explained, she believed that her work in determining the structures of materials from observational data such as X-ray absorption spectra could be applied in the area of extreme materials.
The focus of Chan’s group is on the inversion of characterization data to get structures, using theoretical modeling as guidance and constraints—in other words, using information from such instruments as electron microscopes, atomic probes, and synchrotrons to determine the atomic structure of the material under study. A similar approach could be used to determine microstructures, she said, but the tools her group uses are most suited for understanding structure at the atomic level, so that is where their focus is.
The first step in her process, Chan explained, is to make sure that she can do “forward simulation.” That is, she needs to be able to start with an atomic structure and simulate, for example, an X-ray absorption spectrum that would be generated from that material. Her group spent a great deal of time simulating experimental measurements of all kinds, such TEM images and electron energy loss spectroscopy (EELS) images, which she described as the most difficult to get right. In some cases, such as for the STEM, the results were too good, she said. In that case the group ended up adding realistic levels of noise into the simulations to make them closer to how experimental data would appear. They later posted a collection of simulated images in a data set that is available online.1 These images are simulated high-angle annular dark field (HAADF) STEM images, and there are more than 200,000 in the data set.
Next Chan’s team worked to learn how to move backwards from information gathered by imaging devices to atomic structure. The first example she described was of data from four-dimensional STEM (4D-STEM), which involves conversion beam electron diffraction (CBED) patterns. The goal was to convert the data from CBED patterns into Bragg disk positions, which would make it possible to deter-
___________________
1 MaterialEyes, “atomagined: A Simulated Atomic-Resolution HAADF STEM Imaging Dataset Containing Unique ICSD Structure Prototypes,” database, last update March 9, 2020, http://www.github.com/MaterialEyes/atomagined.
mine crystal orientation, crystal structure, strain, and other information about a material. To do that the team used simulated CBED patterns from a wide variety of structures to train a convoluted neural network (CNN). Fourier complex U-net was trained on approximately 200,000 simulated diffraction images from more than 1,000 distinct crystal structures. After training, the CNN was able to deduce Bragg disc positions from the CBED images. The resulting Bragg disc positions were significantly more accurate than those determined by a more traditional technique, template matching correlation.
The bottom line, Chan said, is “Using computer vision deep learning, we can process electron microscopy data and extract information from it, sometimes thinking about the physics of the problem a little bit.”
As a second example, Chan talked about using data from X-ray absorption near-edge spectroscopy (XANES) to determine structural and electronic descriptors, specifically the coordination numbers, of materials. In this case the approach the team used was to apply density functional theory (DFT) to compute the configurations of the materials of interest, then calculate the X-ray absorption and emission spectra using various first principles and multiplet-based approaches and codes, and then use those spectra to train a machine learning model to move backward from the spectra to the atomic structure. They find X-ray absorption spectra particularly useful, she said, because it is possible to pick out signals from very dilute components at the level of 1 part per million or less. “In most other techniques it will be really tough for you to see anything on such a minority participant,” she said.
Comparing the coordination numbers predicted by this approach for various materials with the “ground truth” coordination numbers, Chan’s team found that that they agreed very well, within about 5–10 percent, which she noted is very hard to get from conventional spectroscopy intuitions.
Next Chan described a way of determining approximate atomic structures from STEM and scanning tunneling microscope (STM) images. In this case, the approach involved simulating STEM and STM images for various structures and then comparing the experimental image with the simulated images to find a match. The difficulty in the seemingly simple approach is that the simulated image is strongly dependent on the simulation parameters, which makes it challenging to find a match. Her team addressed this challenge by carrying out an automated search using a computer vision measure for image similarity. The tool they used is called Ingrained, and it was recently used to determine the structure of borophane, a recently isolated material that is of interest to materials scientists because of its electronic properties (Li et al. 2021).
Finally, Chan moved to what she called the “Holy Grail”—being able to determine detailed atomic structures from imaging data in a way that is as automated as possible. The approach her team has developed is called FANTASTX, for Fully
Automated Nanoscale to Atomistic Structure from Theory and Experiment. Acknowledging that the “fully automated” part of the name is mainly aspiration at this point, she explained that the idea behind FANTASTX is to use characterization data from as many different types of imaging techniques as possible to determine a material’s atomic structure. It works by taking whatever characterization data are available, generating possible atomic structures with machine learning, then simulating the experimental signals from those candidate atomic structures and looking for a match. DFT is used to constrain the solutions to those that are physically reasonable.
For example, her team has used FANTASTX to map out the atom-by-atom structure of grain boundaries in real materials. Showing an image of a particular boundary she commented that it did not match up with the neat boundaries that materials scientists usually think about. “It’s messy, and it’s real,” she said. “I think that is the point—real systems are messy. Theorists work hard, but we start with simple things. In order to get actual messy things, I think we need a combination.”
Having a precise atomic structure can be valuable in a number of ways, Chan said. It can help, for instance, in designing materials with specific properties, such as materials in which defects are pinned. It could also help researchers get a better understanding of physical observations in a particular sample. And while her work is not in extreme materials, this approach should be equally valuable to those whose interests lie in that area.
In the discussion following her presentation Chan was asked about the challenges related to the fact that different characterization tools often have different length scales. She claims it is hard to bridge the length scale and even harder is to bridge the timescale if you want any dynamic simulations. Then she expanded on the problems related to bridging across different length scales. “It is a big problem in the modeling world to try to step up the length scale. It is sort of you lose physics at every step, and it doesn’t go back. The propagate forward is definitive; backwards is information poor. So, I can use the coarse-grain molecular dynamics to make a phase field microstructure simulation, but the reverse is not true. It’s a big problem.”
Understanding Dynamics Over Large Length Scales
Scott T. Misture, Alfred University, began his presentation by saying that he would not be spending much time discussing his own work, but would speak in general about characterizing ultra-high-temperature ceramics under operating conditions and the challenges associated with that. In particular, he listed six challenges that, in his view, are particularly important:
- Understanding the effects of defects on properties, both point and extended properties, especially in multi-principal-component materials.
- Understanding stacking faults, especially in silicon carbide, ultrahard tantalum carbides, and MAX phases2 of titanium-silicon-carbides and titanium-aluminum-carbides.
- Understanding how to optimize chemical short-range order.
- Controlling the formation of surface corrosion products (i.e., protection against oxidation and ablation).
- Controlling reduction reactions for alloy synthesis, especially in multiprincipal-component materials.
- Controlling reduction to manufacture ceramic matrix composites with metallic inclusions.
The first four of these challenges relate to the ultra-high-temperature regime, that is, above around 2,000°C, while for the last two, even data are lower temperatures are important.
After a brief overview of the state of the art in situ characterization of materials in extreme environments, Misture raised the question of what researchers should do with their data once they have collected information from various sources about a material at extreme conditions. Many of the materials of interest are disordered, he said, “and the challenge is, okay, we can solve a crystal structure, but over broader length scales where the defects become important—and in many cases become defining in terms of materials behavior—what do we do?”
To illustrate the problem, Misture showed diagrams of two solid solutions, one in which the two elements were randomly arranged and one in which there was a clear ordering (Figure 3-4). The two were visually distinct and would probably have different properties, but the Bragg diffraction data for the two were indistinguishable—one could not tell the two apart simply by using Bragg diffraction. “Of course,” he said, “if you’ve got a good electron microscopist, they can often image this, and then the problem is solved.” That is not always possible, he said, but the point is that “we can get some information about these materials if we choose the right tools.”
Misture spent much of the rest of his presentation offering technical details about the sorts of tools that could provide this sort of information. One approach to probing nanodomain structure, for example, is to use X-ray diffuse scattering in total analysis scattering and fit “large box” models to the data. This is relatively easy using reverse Monte Carlo calculations. The problem is that large-box models do not provide unique solutions. The question then becomes: Is there an average overall ensemble that is correct?
___________________
2 A MAX phase is a layered carbide or nitride of the form Mn+1AXn, where M is an early transition metal, A is an element in the A group of the periodic table, generally IIIA or IVA, and X refers to carbon or nitrogen.
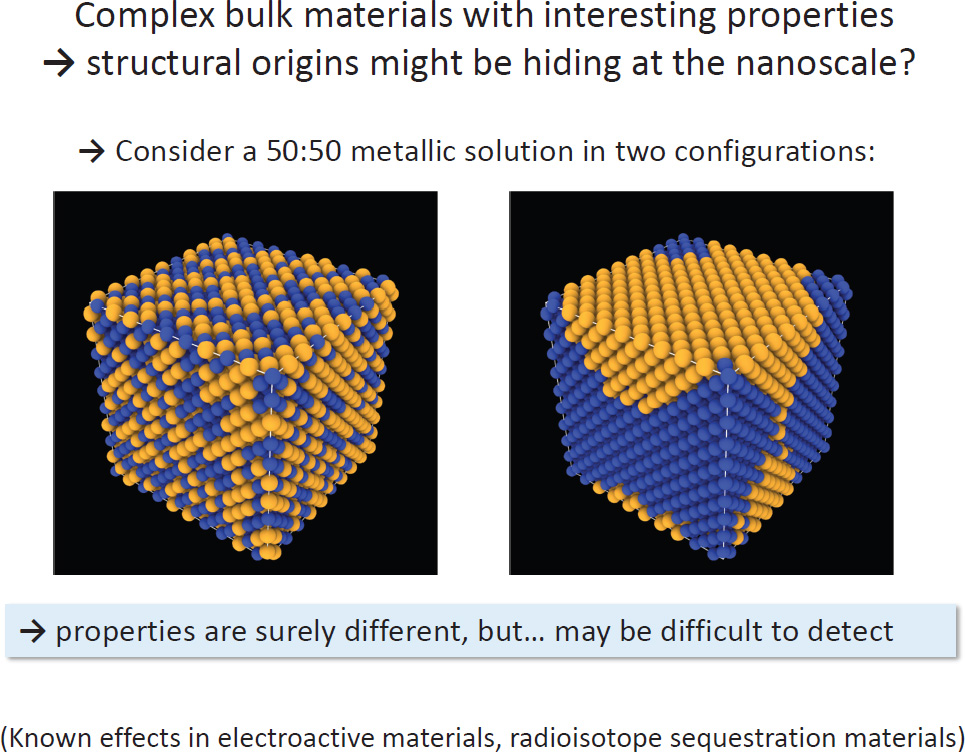
SOURCE: Scott Misture, Alfred University, presentation to the workshop, October 6, 2022.
Looking to the future, Misture said that new types of experiments—particularly new in situ property measurements and improved characterization capabilities—will be important in advancing the field. As examples, he pointed to current efforts on non-contact studies over 1,600–2,000°C in oxidizing environments with atmospheres that minimize vaporization (using X-ray, neutron, optical, and electron imaging) as well as current efforts in dual-laser systems to accommodate variations in emissivity up to 4,000°C. The next generation of experiments will include experiments run in high-temperature and high-pressure gas environments; new approaches to mechanical testing at temperatures over 2,000°C; integrated methods, especially non-contact methods (luminescence, positron annihilation, Raman spectroscopy, etc.); and access to new and improved beamlines for in situ studies under extreme environments (such as the beamlines that will be available after the planned upgrade of the Advanced Photon Source).
Improvements in handling data will also be an important part of coming advances, he predicted. At present correlating observables with structural features can become an intractable problem, especially in nanomaterials and nanoscale
surface reaction products. It will be useful to be able to combine different types of data into single databases, he said, but that raises several issues such as how to weight the data, and the problems of measurement statistics and variable correlations in complex models to fit multiple data sets. Integrating computational tools is another issue.
“It is really a challenge,” he emphasized, “but we’re getting there in bits and pieces.” The key will be to continue trying different things and communicating what works. He noted that he thinks we are on a path to get there.
Putting Machine Learning into Practice
Joshua C. Agar, Drexel University, began his presentation by saying he would be talking about the research that he and his group do. He began doing epitaxial synthesis of complex oxides and applying multidimensional spectroscopy of various sorts, but mostly work on scanning probe microscopies and other areas of advanced spectroscopy. The need to deal with all the data he was generating and extracting information from it led him to develop various machine learning approaches. He explained that a lot of what the group has focused on is how to make machine learning models and machine learning tools usable and practical for the applications that they have.
He listed several challenges facing researchers who use machine learning to deal with their data. One challenge is how to deal with—store, search, and share—the tremendous amounts of data generated. The analysis of all that data offers another challenge; analyzing the data takes far longer than acquiring it. Sharing data with and acquiring data from other researchers is another challenge, as data are seldom kept in a form that makes it easy for others to acquire and use.
“Another key problem,” he continued, “is that universities and even national laboratories don’t really have the infrastructure that’s required to manage data. There is no good networking for actually moving large volumes of data.” Furthermore, principal investigators are generally responsible for managing data, and few of them have the expertise to do that, nor do universities generally offer such expertise to their researchers. The poor infrastructure for moving data around increases the amount of time spent computing with the data. For instance, he said, it takes about 2.5 hours to move a terabyte of data with the standard internet speeds at universities. This is particularly a problem for researcher who want to collect data and analyze it in real time.
Indeed, conducting analyses in real time imposes several challenges. Agar explained that real time can mean a lot of different things. “It can be fast enough to guide experiments on the order of seconds,” he continued, “be fast enough for closed-loop control, which is seconds to milliseconds, or fast enough to apply on-the-fly-data compression, which I think is one of the most important things and
the most overlooked, where you’re talking about milliseconds to nanoseconds that you need to do the actual data analysis.” To do such real-time analyses requires careful consideration of the hardware being used, he added.
Agar then discussed discovering correlations in large unstructured data—in particular, the issue of using machine learning to examine large data sets and to look for groups of objects that are similar in some respect. Machine learning, he noted, has been used to create algorithms that can group two-dimensional images into useful categories, such as distinguishing photos of people from photos of various inanimate objects. When he applied that sort of machine learning to a data set of 25,000 random piezoresponse force microscopy images taken with an atomic force microscope, he found that the machine learning software ended up grouping images together of things that had similar microstructures. “This is really useful if you want to discover data in a collection of raw data sets,” he said. And, further, it was possible to refine the results by identifying areas of interest and recursively teaching the machine which were the most useful results. Ultimately it will be most valuable if the various pieces involved in such image searches could be automated, he said.
After that, Agar switched gears to what he called “parsimonious machine learning,” which is a form of machine learning that is used to not just fit data and make predictions but also to discover physical laws that describe the phenomenon being studied. The machine learning is done with neural networks combined with evolutionary optimization in a way that weighs accuracy against parsimony in the development of a model. In the first example of how this works, he described modeling data from a technique called band-excitation piezoresponse force spectroscopy, which was developed at Oak Ridge National Laboratory. The model produced by the machine learning approach gave results that were very similar to least-squares fitting when the data were relatively clean, but when noise was added to the data, the least-squares method became much less accurate. The neural network approach, by contrast, was much more resilient to the noise in the data. “This means you can deal with much lower signal-to-noise ratios by using neural networks in creative ways,” he said.
Using the same machine learning approach to data from a 4D-STEM was equally successful, producing more accurate models than a more traditional approach. A clear lesson from the work, he said, is “as you include more and more physics in the model, you’re going to get much better results.”
Agar’s last subject was the use of machine learning tools to perform real-time data reduction as a way of dealing with the vast amounts of data being generated by model physics experiments. As an example of why data reduction is needed, he pointed to the Large Hadron Collider, which collects data at a rate that is on the order of petabytes per second. Large amounts of those data are “useless,” he said—they are not anything interesting—and so there is no reason to keep them.
But figuring out which data are important on the fly required the physicists running the Large Hadron Collider to build an effective—and fast—machine learning data-reduction model.
“The question is,” he said, “how do you do this, and can we translate this to materials science?” Although materials science does not generate quite the volume of data that the Large Hadron Collider does, it is not that far off. Electron microscopes produce data at rates up to 200 terabytes per hour, a point at which the data rates are challenging networks’ abilities to transmit them, and the data-production rates are only going to keep increasing sharply in the future. So, materials scientists need to be thinking about how to develop their own data-reduction strategies.
Agar’s team uses a toolkit called HLS4ML, while compresses and converts data into what is known as a high-level synthesis (HLS). “It really enables us to do more complex experiments,” he said. “It opens new windows into how you can conduct the experiment.” For example, his laboratory performs reflection high-energy electron diffraction to look at surface crystallography while they are doing pulse laser deposition, and this produces tremendous amounts of data which the tool allows them to reduce in real time to a form that is manageable.
He described a second example of this sort of data reduction going on in his laboratory, where his team uses a camera that images at 10 million frames per second to measure plume dynamics during pulse laser deposition. They are working to understand these plume dynamics and learn the underlying governing equations because they want to be able to control and stabilize the process. “We know that during growth, our growth properties change,” he said. “We see our plume changing, all these things changing, but we have no control over anything, because we don’t know how to adjust it, we don’t have any eyes on the actual plume dynamics.” So, they are working on building a closed-loop control system to stabilize our growth dynamics during the process. “That’s a first step before we can then start to automate and do more complex things,” he said. “But if we want to actually program a synthesis process where you need to change parameters during the synthesis itself, you need these sort of control systems. You need to be able to visualize the dynamics of the system.” And that in turn requires reducing the amount of data they are dealing with in real time in a way that still allows them to capture the important aspects of the dynamics.
In the discussion period following the presentation, Agar responded to a question about how easy it is to integrate the electron microscope with the data reduction tool. That is perhaps the biggest pain point, he said, because instruments generally have proprietary data acquisition systems, and it can be difficult to tap into the data streams. “We need to push on the vendors to open up the raw data streams,” he said.
SECOND-DAY PANEL
The penultimate activity of the second day was a panel discussion with three participants who each gave a 15-minute presentation and then answered questions as a group. The three panel members were Mathew J. Cherukara, Argonne National Laboratory; Jessica A. Krogstad, University of Illinois at Urbana-Champaign; and Blas P. Uberuaga, Los Alamos National Laboratory.
The Use of Artificial Intelligence at the Advanced Photon Source
Mathew J. Cherukara, Argonne National Laboratory, began by explaining that his group develops the computational tools, algorithms, and machine learning methods that the users of the Advanced Photon Source (APS) use when they analyze the data. He noted that if researchers have come to APS to take data or run analysis, they are likely using some of the software developed by his group.
There are three ways in which artificial intelligence is used at the APS, he said. The first is in analysis. This is necessary because the APS produces so much data that the conventional means of computing just cannot keep up. “And through AI [artificial intelligence], we can not only keep up but also do real-time feedback analysis,” he added. The second way AI is used is to steer the complex equipment used at APS to target the aspects of an experiment that a user is interested in. And the third, which is now mainly nascent, but which hold great promise over the long run, is to use AI to learn physics directly from the data that are being measured. The rest of his presentation was devoted to these three uses of AI at APS.
As context, he said that the APS has about 70 different beam lines, which can each have its own set of instruments operating independently from all the others. “The important thing I want to point out here is you need unique workflows and compute solutions for each of these bespoke instruments,” he said. Before the pandemic the facility had nearly 6,000 researchers from academia, industry, and government from all over the world, although primarily the United States.
With the X-ray microscopy at the APS, one can get images over five to six orders of magnitude in length scale from a single instrument while simultaneously imaging several different properties, such as composition, structure, oxidation state, defects, strain, and photovoltaic response. It is also possible to do much of this imaging in various environments, such as at cryogenic temperatures, under pressure, under a magnetic field, and so on. “Whatever you can think of, you can potentially do it,” Cherukara said.
But this creates a massive data-handling and data-analysis problem. “We have many types of data, multi-modal in nature, and we have dynamic data because the experiment can change very fast,” he said. And the amount of data generating keeps increasing. After an upgrade in 2023, the APS will go from generating data
on the order of 10 petabytes a year to hundreds of petabytes a year. He claimed in 5 or 10 years from now, as instruments get better and as detectors get better, we will fall further and further behind. So, AI is a necessity for us to fully exploit the APS’s instrument capabilities.
To illustrate the potential of AI, Cherukara offered a couple of examples from work at APS. The first involved ptychography, which combines coherent interference patterns created by passing X rays or other focused radiation through an object to create an image of that object. It is very computation-intensive, but it is also the technique that provides the best resolution currently available from X-ray microscopes and from electron microscopes. At this point, he said, ptychography makes it possible for researchers at APS to image a 1-mm2 object with 10-nm resolution in a few hours. “This is equivalent to mapping the entirety of the United States in few meter resolution,” he said, “except instead of just taking snapshots you have to solve a complex computationally expensive inverse problem from what you measure to what the sample looks like.”
The amount of data streaming from such an imaging experiment is enormous—the equivalent of streaming thousands of high-definition movies simultaneously—and typical computation tools are too slow to deal with all this information nearly as quickly as researchers would like. By using a neural network that has been trained to generate the desired images from the data, researchers can not only speed up the production of the images, but the images can be produced with significantly fewer data. In one case that Cherukara described, the AI method was able to accurately produce images with only 4 percent of the data that had nearly the same fidelity as images made with 100 percent of the data. This ability to get acceptable images with only 4 percent of the data points means that researchers could speed up their data acquisition by a factor of 25 and lessen beam damage of the sample by a factor of 25, he said.
The bottom line, Cherukara said, is that the use of these AI techniques decreases the time necessary for creating an image through ptychography from days to weeks with traditional computing, or from minutes to hours with a supercomputer, to just a few milliseconds. Furthermore, significantly fewer data are needed to produce the images.
His final example was of work in which a neural network had been trained to control a X-ray microscope, scanning a sample in order to decide which parts of the sample needed to be scanned in more detail because, for example, a crack was forming. The goal of the technique is to create an image with the necessary detail in as short a time as possible. The system “reconstructs the entire image using about a fifth of the amount of data that is currently used,” he said.
Indirectly Tracking Point Defect Accumulation and Transport in Ceramics
Following Cherukara, Jessica A. Krogstad, University of Illinois at Urbana-Champaign, spoke about a different way in which AI can be used to improve imaging. Her subject was in situ TEM and how it can be used in conjunction with AI to study the behavior of point defects in ceramics. In particular, she said that the main message of her talk would be that it is possible to infer a tremendous amount about the defects that are responsible for changes observed in a material without the need to image the defects themselves. The goal of her talk, she added, was to illuminate some of the ways in which the value of in situ TEM observations can be enhanced through improved imaging processing and coupling the observations to modeling.
She offered two case studies, the first of which involved the radiation-induced sintering of ceramic nanoparticles. After irradiating ceramic nanoparticles in situ, the researchers used image analysis to track the densification of particle aggregates in real time. “The nice thing about this,” Krogstad said, “is we can learn something about the sintering behavior and the diffusion without actually requiring the use of tracers.” They were able to do this at a range of temperatures, she added, “so it is highly flexible.”
In particular, she said, they used a trainable segmentation algorithm, “something that was accessible enough for even me to work with,” and it allowed them to “efficiently track and correlate the evolution of these nanoparticle aggregates to the actual radiation dose.” They were able to watch how the size of the nanoparticles grew over time and could see how the rate of growth was dependent on the temperature.
Next, they applied a simple two-particle sintering model, which allowed them to correlate the observed changes in the sizes of the nanoparticles with physical terms that described their defect-mediated diffusion behavior. This in turn allowed them to observe changes in diffusion behavior with temperature. For instance, at lower temperatures there was sink-limited behavior, but as the temperature increased there was a recombination regime and then finally a regime with Arrhenius diffusion behavior. She said that this was a totally nonintuitive type of behavior, but it is something that they can now extract rigorously.
This is not something that could be done by hand, she noted. It required automated image analysis, the ability to track the particle centers, and the ability to track the edges of these types of particles and their conglomerates. “This is a place where I think we see a tremendous amount of advancement.”
There are two notable limitations to this method, she said. The first is that there is only indirect observation of the point defect, and indirect observations are only as good as the available model. Direct observations of point defects have
improved through the application of deep learning approaches, she added, but it is not yet time-resolved.
The second limitation is that bright-field imaging contrast is still challenging to automatically segment—it is currently limited to particle agglomerates. However, the use of scanning nanobeam diffraction may improve the segmentation issues and provide localized information.
The second case study that Krogstad described involved tracking radiation-induced point defect accumulation using nanobeam diffraction techniques. “In this particular case we are looking at gadolinium titanate,” she said, “and we were curious about the relative efficacy of different types of microstructures in terms of defects efficiency.” To make that comparison they created a sample configuration where they could simultaneously irradiate a single crystal, a nanocrystal, and a nanoporous microstructure under the same field of view and under the same beam conditions. They found that all of the different regions experienced some disorder after the radiation exposure, but the porous region was the last to display evidence of crystallinity.
One issue was the degree of subjectivity in determining an amorphization threshold. For instance, experiments in which a sample was recrystallized after it had been amorphized with radiation indicated that some local structure remained even when the sample appeared to be amorphous. They were able to access more localized information using 4D-STEM, but they cannot yet do it quickly enough to understand the dynamics they are interested in, but noted she thinks that they are getting very close.
In summarizing, Krogstad said that in situ transmission electron microscopy is a highly effective tool for tracking and understanding mechanisms driven by point defects even if the point defects are not directly observed, and that the capacity of this technique has been significantly expanded through the incorporation of machine learning-assisted image processing methods. Advances in detector resolution and speed have enabled the adoption of scanning nanobeam diffraction techniques that provide more localized information, she said, and interrogation of diffuse scattering provides even greater potential for understanding localized defects. And finally, most data processing is still performed after the fact, so real-time information about where to probe is not available.
She ended her presentation with three outstanding questions:
- Interpretation of in situ observations is still heavily predicated upon the existence and limitations of physical models. How can these methods be fully taken advantage of to discover new phenomenon?
- Substantial amounts of the information collected during in situ experiments remain unused, especially in diffraction patterns. How can we more
- In situ observation is prone to artifacts that may be exacerbated by the small sample volumes. How can we more effectively couple experiments at different length scales to overcome these limitations?
efficiently access information embedded in diffuse scattering and enable real-time analysis?
Novel Capabilities for Studying Irradiated Materials
In the panel’s final presentation, Blas P. Uberuaga, Los Alamos National Laboratory, spoke about capabilities for doing in situ characterization of radiation damage as well as for studying damage caused by exposure to both to radiation and other extreme environments, such as corrosion.
In studying radiation damage, it is important to carry out the studies in situ, he explained, because the defects in a material will change quickly after the radiation exposure stops. To illustrate, he showed a graph created from cluster dynamic simulations done at Los Alamos National Laboratory. After the beam is turned off, it can no longer generate defects, and the simulation showed that the defect content drops by a factor of five within about 10 seconds and drops by another factor of five after 20 minutes. “And it’s not only the defect content that changed as a function of this,” he said, “but it’s also the nature of the defects that are present in the material.” The fast-moving defects that drive the mesoscale evolution of the material disappear quickly. These transient defects are responsible for the major radiation-induced changes in the material, he said, but they disappear so quickly that they cannot be observed without measurements carried out as the radiation is hitting the material. What we really need are in situ probes and in situ characterization to understand radiation damage, he concluded.
There are various techniques that have been used for in situ studies of radiation damage, including Rutherford backscattering spectrometry, X-ray diffraction, X-ray photoelectron spectroscopy, and Raman spectroscopy, but the most used technique is in situ TEM. The in situ TEM technique has a number of advantages, Uberuaga said, including the ability to do a direct visualization of damage, to do spatial correlations with the material’s microstructure, and to follow the evolution of larger-scale defects, but there are also some limitations. The need to use thin samples means that there will be surface effects, for instance, and the technique is blind to atomic-scale defects, which can be very important to a material’s properties.
So, Los Alamos researchers, in conjunction with collaborators at Bowling Green State University, have been developing in situ positron annihilation spectroscopy (PAS). “This would be the first in-situ positron capability with a pulsed positron beam coupled to a heavy ion beam in the world,” Uberuaga said, explaining that the reason for working with positrons is that they are very sensitive to atomic-scale
defects. Furthermore, with the right analysis tools, it is also possible to get some information about the chemical environment of the defects in the material.
In the first, proof-of-principle experiment carried out with the positron device, researchers showed that they could indeed observe radiation-induced changes in the behavior of a material as it was being irradiated. One important finding was that a parameter referred to as S, which correlates with the annihilations of positrons with valence electrons in the material, increases linearly with dose. “So, we get a sensitive response to the material that’s directly proportional to the defect content,” he said. And one of the implications of the data they have seen from these experiments is that when the beam is on, the number of defects is changing, but the nature of the defects remains very similar. By contrast, when the beam is turned off, the behavior of the defects changes, and there is some kind of coarsening mechanism leading to an evolution in the defects. “So that means,” he said, “that we’re most likely probing the transient defects that are responsible for that mesoscale evolution during that time when we have the beam on that we would never be able to see if the beam is off.”
To add another capability to the technique, the team is building an in situ electrochemical impedance spectroscopy system that will make it possible to measure the conductivity of a material as it is being irradiated. In a proof-of-principle experiment done with yttria stabilized zirconia irradiated with helium, they showed they could monitor that conductivity as the zirconia was being irradiated. They found that irradiating the material caused its conductivity to shoot up to a new steady-state value, but within minutes of turning off the beam, the conductivity returned to its pre-irradiation value. This means, Uberuaga said, that no ex situ experiment could measure this change in conductivity. “So, we’re sensitive again to fast-moving defects that you can only see when you’re actually irradiating the material, again emphasizing the need for in situ probes.”
Switching gears, he then spoke about experiments involving irradiation coupled with other extreme environments. The reason for doing such experiments, he explained, is that in real applications irradiation is rarely encountered in isolation. There may be high temperatures, for instance, or high pressure or plasma present, but the most common scenario is probably radiation plus corrosion, which is the sort of environment one encounters in, for instance, fission reactors. To study irradiation coupled with corrosion, Los Alamos has been running its Irradiation Corrosion Experiment (ICE) in various stages since 2008. Other institutes have experiments with similar goals, such as the University of Michigan and the Massachusetts Institute of Technology.
In the ICE experiments, there are generally two samples, one that is exposed to both radiation (from a proton beam) and corrosion and another, which serves as a control, that is exposed only to corrosion. When the protons hit a sample they
generate proton-induced X-ray emission, which can be monitored to provide an in situ probe of what is happening to the material.
Because ICE is not very high throughput, the team is exploring an alternative called Tiny ICE, which is a much simpler concept. “Rather than a chamber,” he explained, “we just have a simple metal cube where we have drilled a hole. We fill that with our corrosive medium … and then we just grow a film on top of it. The advantage here is we can grow any kind of a film on top and look at the corrosive response of that material. We then irradiate it.”
The two techniques each have their own pros and cons. With ICE, any material can be explored, and it is possible to monitor the effects of the irradiation and corrosion over long periods of time. However, it does not have high throughput, making it difficult to look at a large number of materials, and it uses higher proton energies, meaning that the samples can be left with high levels of radioactivity. Tiny ICE is high throughput with lower local beam heating effects, but there are no in situ diagnostics.
The ICE method can be combined with post-mortem characterization such as TEM to get further insight into a material, he said. Indeed, “the more probes that we throw at our material, the more we’re going to learn.” In recent work looking at defects in chromium oxide, they used TEM, Raman spectroscopy, electrochemical impedance spectroscopy, and PAS. And as more probes are used to examine complex responses, he said, artificial intelligence and machine learning will be able to help synthesize all those data.
He concluded with a list of open questions:
- How do we deconvolute the complex information inherent to in situ probes of radiation damage?
- How can we integrate multiple modes of characterization into one comprehensive picture?
- Can modeling and simulation—including artificial intelligence and machine learning—be directly integrated with an experiment to help interpret complex responses?
- When combining extremes, how can we minimize artifacts (e.g., beam heating) and focus on the specific coupling of interest?
- Can these approaches be extended beyond laboratory-scale experiments to real-world systems?
Discussion
The discussion period following the presentations kicked off with Krogstad answering a question about the use of models in interpreting data and how that might affect the discovery of new phenomena and the development of new physi-
cal explanations for what is taking place. “I think it is a real chicken and the egg type of situation,” Krogstad said. “The models are necessary to interpret the data, but there’s a lot in the data that we might be overlooking by oversimplifying our model or picking the wrong model.” There is not an easy best answer, but one route may lie in comparing different models. She stated that we’re not quite to the point where we can use these automated tools to find new things just yet. But if we can use them to compare more models, we may gain a deeper insight about the complexity of what’s going on or expanding and finding where our assumptions about our models may fall through.
Cherukara said he had a different perspective on models. “We do a lot of ion beam irradiations with the goal of understanding materials that are destined for reactors,” he said, “and so from my perspective what I want is a physics-based model that I can then use to extrapolate. If I can validate [the model] against ion beam data, then I have some confidence it will extrapolate to reactor conditions.”
Arroyave brought up the issue of where the large data sets holding materials science data will be physically located. Is there some current effort to develop an infrastructure for storing all these data and making them available to the community? Cherukara commented that according to a memo from the White House, the expectation is that by 2026 data from all federally funded research will have to be made available by the investigators, and Uberuaga said that at Los Alamos National Laboratory researchers “need to write a data management plan with pretty much every proposal now.” Unfortunately, Los Alamos National Laboratory does not provide a resource to help its scientists manage their data or make it available, he said, “so I feel like we’re all scrambling to figure out a way to do that on our own, without the right expertise or resources to be able to do that in the way that it should be done.”
Joshua Agar, Drexel University, said that there are various ways that scientists are rewarded for supplying their data to others or putting them in a database, but there are various challenges related to data storage and sharing. “I was lucky recently and got awarded enough money to buy about one and a half petabytes of data storage,” he said, “but it is really challenging, and I think we have to push on our institutions to support it as part of our overhead costs.” Right now, he said, if he generates two terabytes of data, he has no good way to send those data to another institution. “Currently there is no real good way to do it. Usually, it’s putting it on a hard drive, mailing it, and sending it. And if you want to make your data accessible and sharable and hostable, that’s not viable.”
One participant suggested that Globus offers a feasible means to share data among institutions. “We are distributing multi-terabyte data sets using Globus,” the participant said, “and a lot of universities do have storage and Globus nodes to be able to put stuff…. And the nice thing about Globus is it guarantees that the data that you download at one place is the data that you get at the next.”
One question concerned the temperatures and pressures that the Advanced Photon Source can operate at. Cherukara answered that it depends on the beam lines and the instruments. There are 70 different beam lines, and each of them does different things, he said. “There are beamlines where you can do high T and high P. There are other beamlines where you can do very low temperature measurements, especially those looking at magnetic materials for example. It is very instrument specific.” Kogstad added, “As a user of the facility, if you can build it and you can integrate it with the APS line, then you can do it. So I don’t think there are limitations there unless it’s not physically possible to build the system.”


