
7
PROFILES OF THE LAND GRANT COLLEGES OF AGRICULTURE: Comparisons of Structure, Focus, and Funding
This chapter takes a more disaggregated view of the college of agriculture research system. Its purpose is to allow the reader to see the land grant agricultural research system as a network of individual institutions with important similarities and differences. The chapter compares college names, administrative and organizational structures, emphases of research programs, and approaches to funding research. The system-wide organization of livestock and crops research is also explored; one reason is to determine whether institutions in close geographical proximity share research interests that relate to their region's farm economy.
PROFILES-PART A The Colleges' Changing Names
-
Thirty years ago all agriculture colleges at 1862 institutions were either "colleges of agriculture" or "colleges of agriculture and home economics" (Table 7-1). Today, fewer than one-half have retained these names. At a some institutions, home economics departments are now separate colleges with names such as "College of Applied Human Sciences" at Colorado State U., "College of Human Resources" at the University of Delaware, and ''College of Human Ecology" at Kansas State U.
-
After "college of agriculture" or "college of agricultural sciences," the most common name is "college of agriculture and life sciences," reflecting an increased orientation toward the basic sciences. Since 1988, the most popular new college name, as resource and environmental issues have gained prominence, has been "college of agriculture and natural resources." Another fast-growing category is names without "agriculture'' in the title at all. This increasing diversity of names of colleges of agriculture is one sign of change in the land grant college system.
Fewer than one-half of the 1862 colleges retain the name "College of Agriculture" or "College of Agricultural Sciences."
TABLE 7-1
Changing Names of 1862 Colleges (percent)
|
|
Year |
|||
|
Name |
1962 |
1974 |
1988 |
1993 |
|
Agriculturea |
86 |
64 |
58 |
45 |
|
and Home Economics |
14 |
8 |
8 |
7 |
|
and Natural Resources |
0 |
6 |
8 |
13 |
|
and Life Sciences |
0 |
14 |
14 |
15 |
|
and Environment |
0 |
4 |
2 |
4 |
|
"Agriculture" not part of title |
0 |
2 |
6 |
9 |
|
Other |
0 |
2 |
4 |
7 |
|
a Of 25 colleges called either "College of Agriculture" or "College of Agricultural Sciences," 7 (28 percent) are called the latter. SOURCES: Data for 1962, 1974, and 1988 are from Myers, J. H. 1991. Rethinking the Outlook of Colleges Whose Roots Have Been in Agriculture. Davis: University of California. Data for 1993 are from USDA Food and Agricultural Education Information System (FAEIS). |
||||
Despite differences in college names, administration, and organization, the majority of faculty and staff at colleges of agriculture work in academic departments with a production-agriculture focus.
-
Veterinary medicine, forestry, and home economics are sometimes programs within the college of agriculture and sometimes separate administrative units. Some colleges have interdisciplinary centers and others are moving toward multidisciplinary clustering of departments. Cooperative extension functions are sometimes administered by the dean of the college of agriculture (who typically administers the experiment station) and sometimes by another university administrator. (For example, at the University of Wisconsin, extension is a separate "campus" with university-wide functions.) For some colleges of agriculture, the office of academic affairs is under the administration of a university-wide official (see box copy, p. 85).
-
Despite differences in college organization and administration, at most 1862 colleges a large number of faculty and staff work in academic areas that, by department name, imply a production-agriculture focus—for example, agricultural engineering, agronomy and soil science, animal sciences, entomology, plant pathology, and other specific plant sciences. In a 1993 survey of resident-instruction faculty in land grant colleges of agriculture, natural resources, and forestry, it was estimated that
-
about 47 percent of faculty taught general agriculture, animal sciences, plant science, soil sciences, or agricultural engineering/mechanization;
-
less than 19 percent taught agricultural business and management (including agricultural economics) and education, communication, and social sciences;
-
17 percent taught natural resources and forest sciences;
-
11 percent taught related biological or physical sciences; and
-
slightly more than 5 percent taught food science and human nutrition (Table 7-2).
-
Including faculty and staff without resident-instruction appointments would put an even higher percentage in production-agriculture fields.
|
Five Profiles Colleges administer somewhat differently the three functions of teaching, research, and extension, as differently as they configure their academic programs and departments. Five profiles are given here—four colleges and one university agriculture system—to illustrate the variety. ADMINISTRATIVE STRUCTURES AND DEPARTMENTAL CONFIGURATION AT FIVE SELECTED 1862 "COLLEGES OF AGRICULTURE" University of California The university's Division of Agriculture and Natural Resources is the university system's administrative umbrella for the agricultural experiment station, cooperative extension, and the College of Natural Resources at Berkeley; the College of Agriculture and Environmental Sciences and the School of Veterinary Medicine at Davis; and the College of Natural and Agricultural Sciences at Riverside. The division is directed by a university vice president who also directs the experiment station and cooperative extension. Each of the three campus-based colleges has a dean who also serves as an associate director of the experiment station. There are also four regional program directors who oversee regional research and extension programs of the state-wide field offices. Berkeley Berkeley's College of Natural Resources has melded four of its seven departments—plant pathology, soil science, entomology, and forestry—into one department of environmental science, policy, and management. Other departments include agricultural and resource economics, nutritional sciences, and plant biology. Davis Davis' College of Agriculture and Environmental Sciences is the largest of the three campus-based colleges and is self-contained, encompassing traditional production agriculture departments in plant sciences and animal biology, human health and development departments, and environmental and natural resource science and policy departments. Faculty of the Division of Biological Sciences also have experiment station appointments, making for strong links to basic science. Riverside Riverside's College of Natural and Agricultural Resources includes biochemistry, biology, botany, earth sciences, entomology, nematology, plant pathology, soil and environmental sciences, and statistics. University of Connecticut The University of Connecticut's College of Agriculture and Natural Resources is headed by a dean who also directs the college's experiment station and cooperative extension. There are three associate deans, one each |
|
administering the experiment station, cooperative extension, and the college. The college has departments of agricultural and resource economics, animal science, natural resources management and engineering, nutritional sciences, pathobiology, and plant science. It also has a school of family studies; interdisciplinary centers for environmental health, food marketing policy, and wildlife disease; and an institute of water resources (staffed by faculty and staff of disciplinary departments). The state also has a second experiment station, located in New Haven, not affiliated with a university and with a separate administration. Scientists have station research appointments only—in chemistry, biochemistry and genetics, entomology, forestry and horticulture, plant pathology and ecology, and soil and water. University of Missouri The University of Missouri's College of Agriculture, Food, and Natural Resources is headed by a dean who also directs the experiment station. There are also colleges of human environmental sciences and veterinary medicine. Assistant directors of the experiment station head these latter units. A university vice provost oversees extension, and an associate dean of the college is extension's associate director. The college has an associate dean as the administrative head of academic programs. Separate departments specific to each discipline have been largely eliminated. Experiment station researchers and extension specialists are clustered in several large units: agricultural information, animal science, biochemistry, food science and engineering, the school of natural resources, plant sciences, and social sciences. New Mexico State University New Mexico State U.'s College of Agriculture and Home Economics has a dean who also serves as the chief administrative officer. There are three associate deans who serve as, respectively, the director of the experiment station, the director of cooperative extension, and the director of academic programs. Departments include agricultural economics and business; agronomy and horticulture; animal and range sciences; entomology, plant pathology, and weed science; experimental statistics; fishery and wildlife sciences; and home economics. There is also a school for hospitality and tourism services, a plant genetic engineering laboratory, and a number of off-campus agricultural science centers. North Carolina State University North Carolina State University's (NSCU's) College of Agriculture and Life Sciences (CALS) has three divisions: academic programs, research, and extension. CALS's North Carolina Agricultural Research Service (NCARS) is the state's primary agency for research in agriculture, life sciences, forestry, and home economics; it is also North Carolina's agricultural experiment station. NCARS research is conducted in CALS and in the colleges of Forest Resources and |
|
Veterinary Medicine at NCSU and in the School of Human Environmental Sciences at U. North Carolina at Greensboro. Within CALS, NCARS coordinates research in 19 academic departments, working in partnership with extension and teaching. Departments include agricultural communications, animal science, biochemistry, botany, crop science, economics and business, engineering, entomology, food science, horticultural science, human environmental sciences, microbiology, plant pathology, poultry science, sociology and anthropology, soil science, statistics, toxicology, and zoology. STAFF PROFILE The table below shows the number of staff with doctorate degrees, by appointment type, at the five colleges. At all five, the most common appointment type combines research and teaching. Among these five colleges, research-only appointments are common only at the U. of Connecticut, largely because of the presence of Connecticut's second state experiment station located away from the university; but the U. of Connecticut also has the highest portion of three-way appointments—extension, teaching, and research. Extension-only appointments are more common at New Mexico State U. than in the other four states.
|
||||||||||||||||||||||||||||||||||||||||||||||||
TABLE 7-2
Number of Resident Instruction Faculty in Land Grant Colleges of Agriculture, Natural Resources, and Forestry by Academic Rank, 1993
|
Academic Rank |
General Agriculture |
Animal Science |
Plant Science |
Soil Science |
Agricultural Business and Management |
Education, Communication, Soil Sciences |
|
Professor |
31 |
446 |
602 |
148 |
568 |
105 |
|
Associate professor |
11 |
246 |
374 |
66 |
175 |
77 |
|
Assistant professor |
5 |
149 |
232 |
34 |
88 |
42 |
|
Instructor |
9 |
22 |
21 |
0 |
13 |
5 |
|
Totals |
56 |
863 |
1,229 |
248 |
844 |
229 |
|
SOURCE: Data are from USDA Food and Agricultural Education Information System (FAEIS). |
||||||
-
Schools such as the University of Kentucky, which is located in a state where 6 percent of jobs are in farm production and 21 percent are in farm-related industries, are traditionally production oriented. At Kentucky's college of agriculture
-
200-plus nonadministrative professional staff (with teaching, research, or extension appointments) are in departments of agronomy, animal science, agricultural engineering, entomology, horticulture, and plant pathology;
-
17 are in forestry;
-
30 are in the college of human environmental sciences;
-
49 are in agricultural economics and sociology; and
-
42 in veterinary sciences (U.S. Department of Agriculture, 1993b).
-
-
At the University of Connecticut, located in a state where less than 0.5 percent of jobs are on farms and only 11 percent are in farm-related business, there is less emphasis on production agriculture and staff are far fewer and configured differently:
-
53 nonadministrative staff are in animal sciences, plant sciences, and pathobiology;
-
29 are in the school of family studies and the department of nutritional sciences;
-
11 are in natural resources management and engineering; and
-
11 are in agricultural and resource economics (U.S. Department of Agriculture, 1993b).
-
The structure of staff responsibility for teaching, research, and extension also differs across the system, but the most common appointment type combines research and teaching.
|
Academic Rank |
Natural Resources |
Forest Sciences |
Food Science/Human Nutrition |
Agricultural Engineering/Mechanization |
Related Biological/Physical Sciences |
Total Across Area |
|
Professor |
254 |
225 |
143 |
177 |
373 |
3,072 |
|
Associate Professor |
143 |
155 |
91 |
81 |
155 |
1,574 |
|
Assistant Professor |
94 |
83 |
60 |
70 |
91 |
948 |
|
Instructor |
13 |
17 |
8 |
11 |
11 |
130 |
|
Totals |
504 |
480 |
302 |
339 |
630 |
5,724 |
TABLE 7-3
Agriculture and Natural Resources and Forestry Faculty and Graduate Assistants Employed in Resident Instruction, Cooperative Extension, and Research in Land Grant Institutions, Fall 1993 (full-time equivalents)
|
Discipline |
Faculty |
Graduate Assistants |
|
Agriculture and Natural Resources |
||
|
Resident instruction |
2,537 |
613 |
|
Cooperative extension (campus based) |
2,241 |
295 |
|
Research |
4,693 |
1,821 |
|
Agricultural experiment station |
3,913 |
1,573 |
|
Other research |
780 |
248 |
|
Subtotal |
9,471 |
2,729 |
|
Forestry |
||
|
Resident instruction |
228 |
61 |
|
Cooperative extension (campus based) |
122 |
4 |
|
Research |
538 |
388 |
|
Agricultural experiment station |
334 |
242 |
|
Other research |
204 |
146 |
|
Subtotal |
888 |
452 |
|
Total |
10,359 |
3,181 |
|
SOURCE: Data are from USDA Food and Agricultural Education Information System (FAEIS). |
||
-
Colleges of agriculture have developed a variety of strategies for meeting their responsibilities for research, teaching, and extension activities. A recent survey indicates that, system wide, one-half of the time of faculty in agriculture and natural resources is formally allocated to research, while the other one-half is split almost evenly between teaching and cooperative extension activities. (Of course, functional responsibilities of individual faculty do not necessarily match this aggregate norm.) The distribution of forestry faculty's time is more heavily oriented toward research (60 percent) and less oriented toward extension (only 14 percent) (Table 7-3).
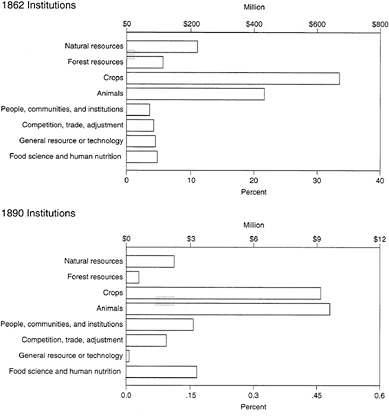
FIGURE 7-1
The four graphs show the 1992 allocation of research expenditures among CRIS research program groups by 1862s (89 percent of total expenditures), 1890s (2 percent of total expenditures), forestry schools (3 percent of total expenditures), and schools of veterinary medicine (6 percent of total expenditures).
PROFILES-PART B Similarities and Differences in Research Emphasis
-
The CRIS reporting system asks researchers to assign each of their research projects to one of eight "research program groups" (RPGs). These RPGs include natural resources; forest resources; crops; animals; people, communities, and institutions; competition, trade, and policy; general resource or technology; and food science and human nutrition.
-
The story that emerges from the allocation of research projects to these program areas is similar to that told earlier based on ESCOP program groups. System wide, research dollars are allocated first to crops, second to animals, and third to natural resources. These three program groups account for three-quarters of research expenditures by all reporting institutions, or $1.5 billion of $2 billion in total research expenditures (Figure 7-1; see also Appendix Table 4).1

FIGURE 7-1
-
System-wide averages may mask significant differences across individual institutions. Forestry schools are, of course, focused on forest resources research; and veterinary medicine schools are predominately conducting animals research. Among the 1862s there are some differences that make good geographic sense, but the few states that have allocations significantly different than the average are exceptions.
-
Alaska's experiment station, for example, invests more in natural resources research than in animal research; Connecticut invests more in food science and human nutrition than in crops; and Vermont invests more in food and nutrition than in animals. Rhode Island puts more research money into natural resources than either crops or animals research; and West Virginia puts more into both forest and natural resources research than into crops. Cornell U. spreads research dollars more evenly than many others, but the three program groups that receive the most—crops, animals, and natural resources—are the same as the average top three (and the Geneva AES devotes most of its research to crops) (see Appendix Table 4).

FIGURE 7-2
The graph shows that most forest resources research expenditures in 1992 by 1862 institutions and forestry schools went to timber management; harvesting, processing, and marketing; and forest protection.
-
More in-depth study of individual projects is needed before it can be determined how research within a research program group differs across institutions with respect to specific focus or goal. The CRIS classification system does provide some additional breakdown. For example, when "forest resources" research is examined more closely, we can see that timber management is the primary focus and harvesting, processing, and marketing forest products is the secondary focus. These two areas of research accounted for more than 50 percent of all forest resources research in 1992 (Figure 7-2; see also Appendix Table 5).
-
Some schools had a different forestry research orientation, however. For example, Vermont's forestry school focuses on forest watersheds, soils and pollution, while the universities of New Hampshire, Wyoming, and Florida, among others, devote significant shares of research dollars to the study of forest, range, wildlife, and fisheries habitat development (see Appendix Table 5).
COLLEGES CLUSTERED ACCORDING TO COMMODITY RESEARCH
-
Research on crops and livestock comprises the majority of research at 1862s, but the specific commodities studied at an institution are determined by the characteristics of the state's farm production. Figure 7-3 shows the system's allocation of commodity research expenditures in 1992 among specific commodities or commodity groupings. It also shows the percentage contribution of each commodity group to total cash receipts from farm sales.
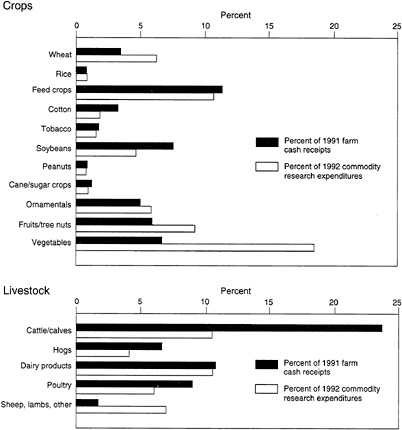
FIGURE 7-3
The graphic presentation of the amounts (as percentage) of commodity research expenditures allocated to specific crops and animals research by 1862 institutions in 1992 indicates that vegetables account for a large share. Dairy and beef cattle combined, however, account for more than 20 percent.
TABLE 7-4
Classification of 1862 State Agricultural Experiment Stations as Commodity Research Clusters
-
Appendix Table 6 shows the amount of commodity research expenditures for each of the 58 SAESs and the percentage allocations to each commodity for 1992. For example, in 1992 the University of Texas spent the most on commodity-specific research, and 20 percent of those expenditures went to beef cattle research. (Note: research that is not commodity specific, usually basic research applicable to multiple crops, is not included in Appendix Table 6.)
-
Using a statistical procedure called cluster analysis (analysis of groups having similar patterns or profiles), the SAESs can be arranged into 9 research clusters. Table 7-4 lists the clusters by commodity research emphasis and the institutions in each cluster; Figure 7-4 shows the inclusion of each state in a commodity research cluster. Some geographic patterns emerge, such as for the ''corn belt'' (cluster 4), the wheat-producing states (cluster 5), and the rice producing states (cluster 6). In addition, six states across the south are similar in their research emphases on cattle, vegetables, and cotton (cluster 1). Oregon and Washington also share research profiles (cluster 8); as do North Carolina, South Carolina, Tennessee, and Kentucky (cluster 3).
-
The percentage of research funds each of the nine clusters allocates to specific commodities or commodity groups is shown Table 7-5. For example, institutions in cluster 4 conduct their commodity-specific research primarily on corn (18 percent), soybeans (12 percent), and swine (15 percent), with a considerable percentage also going to research on beef (11 percent) and dairy (10 percent) cattle. Cluster 6, on the other hand, is oriented toward rice, soybeans, cattle, and poultry research; and cluster 2 focuses its research on vegetables and fruits.
For some commodities, research is concentrated at a few colleges.
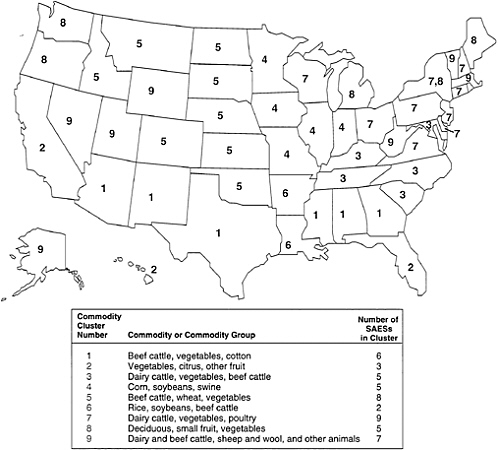
FIGURE 7-4
The map shows emergent geographic patterns of commodity research at colleges of agriculture. States are identified by number indicating the profile of commodity research at their state agricultural experiment station in 1992.
-
Another way to assess the system's organization of research is to look at how expenditures for research on specific commodities are distributed among the SAESs. Table 7-6 shows that for six commodities or commodity groups—citrus and tropical fruits, cotton, peanuts, rice, sugar, and tobacco—five colleges account for more than one-half of all research expenditures. For each of these except sugar, 10 colleges perform almost all of the research.
-
Crop research tends to be more concentrated than animal research; this may be because animal production is less site-specific—that is, less sensitive to climatic and geographic conditions—than crop production. Commodities for which research is least concentrated include vegetables (although research on specific vegetables may be more concentrated), poultry, dairy cattle, beef cattle, and pasture and forage crops. As a point of contrast, the five states leading dairy research account for less than 30 percent of dairy research, while the five states leading in milk production account for more than 50 percent of milk production (U.S. Department of Agriculture, 1992). Similarly, the five states leading in poultry research account for 30 percent of poultry research, while the five states leading in broiler production account for about 60 percent of the value of broiler production (U.S. Department of Agriculture, 1992).
TABLE 7-5
Commodity-Specific Research Funds (percent) as Allocated by the Nine Commodity Research Clusters
|
|
Commodity Research Cluster |
||||||||
|
Specific Commodity |
1 |
2 |
3 |
4 |
5 |
6 |
7 |
8 |
9 |
|
Beef cattle |
15 |
7 |
10 |
11 |
25 |
12 |
5 |
4 |
16 |
|
Citrus and tropical/subtropical fruit |
0 |
17 |
0 |
0 |
0 |
1 |
0 |
0 |
0 |
|
Corn and grain sorghum |
6 |
2 |
5 |
18 |
6 |
3 |
6 |
1 |
1 |
|
Cotton and cotton seed |
10 |
1 |
2 |
0 |
1 |
9 |
0 |
0 |
0 |
|
Dairy cattle |
6 |
5 |
12 |
10 |
5 |
8 |
20 |
9 |
23 |
|
Deciduous and small fruits and edible tree nuts |
6 |
10 |
6 |
2 |
2 |
5 |
8 |
29 |
9 |
|
Miscellaneous and new crops |
2 |
3 |
0 |
1 |
1 |
1 |
1 |
4 |
0 |
|
Vegetables and potatoes |
12 |
22 |
11 |
6 |
10 |
8 |
14 |
28 |
6 |
|
Ornamentals and turf |
5 |
9 |
6 |
3 |
2 |
2 |
7 |
3 |
4 |
|
Rice |
1 |
1 |
0 |
1 |
0 |
13 |
0 |
0 |
0 |
|
Wheat and other small grains |
3 |
4 |
4 |
5 |
22 |
4 |
2 |
8 |
5 |
|
Pasture and forage crops |
9 |
4 |
7 |
5 |
5 |
5 |
3 |
2 |
11 |
|
Soybeans and other oilseed and oil crops |
6 |
1 |
7 |
12 |
7 |
13 |
4 |
1 |
0 |
|
Peanuts |
4 |
1 |
1 |
0 |
1 |
0 |
0 |
0 |
0 |
|
Tobacco |
1 |
0 |
8 |
0 |
0 |
0 |
1 |
0 |
0 |
|
Sugar crops |
1 |
1 |
0 |
1 |
1 |
4 |
0 |
0 |
0 |
|
Poultry |
7 |
3 |
9 |
5 |
1 |
11 |
14 |
3 |
5 |
|
Swine |
3 |
1 |
5 |
15 |
6 |
2 |
5 |
2 |
2 |
|
Sheep and wool, other animals, bees and honey, etc. |
4 |
5 |
6 |
4 |
7 |
3 |
9 |
4 |
15 |
-
In Table 7-6, the five SAESs listed as the leading researchers for each commodity represent states that are either primary producers of the commodity or for which the commodity is an important agricultural product. It is perhaps not surprising that several large colleges appear often among the five leading SAESs listed for each commodity. For example, Texas A&M U. is among the leading five for 13 of 19 commodity research groups; the University of Florida appears 8 times; North Carolina State 7 times; and the University of California system 5 times.
PROFILES-PART C Comparisons of Research Funding Mechanisms
-
Federal funding by formula coupled with state matching grants characterizes the history of funding for each 1862 college's SAES. Today, however, the agricultural college research system encompasses a broader array of funding mechanisms. For some SAESs the private sector partners, such as commodity groups that fund research through "check-off" programs, have a growing influence over the allocation of research dollars. For others, the federal partner is increasingly Congress or a non-USDA agency.
TABLE 7-6
The Five 1862 State Agricultural Experiment Stations Conducting the Highest Percentages of Research, by Commodity or Commodity Group, 1992
|
|
|
Percent of Research Conducted |
|
|
Commodity or Commodity Group |
Five SAESs (by state)a Conducting the Most Research |
By First SAES |
By All Five SAESs |
|
Beef cattle |
TX, NE, FL, KS, GA |
11 |
35 |
|
Citrus and tropical/subtropical fruit |
FL, CA, HI, PR, TX |
40 |
96 |
|
Corn and grain sorghum |
IA, TX, IN, IL, NC |
11 |
43 |
|
Cotton and cotton seed |
TX, AZ, AR, LA, MS |
26 |
66 |
|
Dairy cattle |
WI, PA, NYC, TX, FL |
10 |
28 |
|
Deciduous and small fruits and edible tree nuts |
CA, WA, NYG, OR, NC |
15 |
42 |
|
Miscellaneous and new crops |
MI, WA, PR, HI, OR |
15 |
47 |
|
Ornamentals and turf |
FL, TX, CA, NC, GA |
13 |
34 |
|
Pasture and forage crops |
FL, TX, GA, MI, LA |
8 |
27 |
|
Peanuts |
GA, NC, TX, FL, AL |
31 |
84 |
|
Poultry |
NC, AR, AL, TX, GA |
7 |
30 |
|
Rice |
AR, LA, TX, NC, FL |
27 |
72 |
|
Sheep and wool, other animals, bees and honey, etc. |
CA, TX, KY, OR, NE |
10 |
34 |
|
Soybeans and other oilseed and oil crops |
IA, AR, IL, LA, GA |
10 |
34 |
|
Sugar Crops |
LA, PR, TX, FL, ID |
20 |
66 |
|
Swine |
IA, MN, IL, NE, IN |
14 |
42 |
|
Tobacco |
NC, KY, SC, TN, CTH |
42 |
74 |
|
Vegetables and potatoes |
FL, CA, NYC, WA, NC |
10 |
32 |
|
Wheat and other small grains |
KS, ND, WA, TX, OR |
13 |
40 |
|
Abbreviations: NYC, Cornell University; NYG, Geneva Agricultural Experiment Station; CTH, New Haven Agricultural Experiment Station. All other institutions are identified by the U.S. postal code state abbreviations. a The five SAESs are ordered based on which conducts the highest percentage of research for the commodity or commodity group, the second highest, etc. SOURCE: Data are from USDA Current Research Information System (CRIS). |
|||
-
Table 7-7 ranks SAESs at 1862 colleges of agriculture by amount of their total research expenditures and provides a breakdown of funding sources for 1992 (see also Figure 7-5). Colleges with the largest research programs tend to be the recipients of the largest amount of formula funds. But it is not so much the amount received in formula-based grants that sets them apart from the smaller colleges in the system as it is the amounts they receive in other types of funding. For example, the amount of formula funds received by Texas A&M U. is only 3 times greater than the amount received by the University of Massachusetts, however, "other federal funds" are 26 times greater, state appropriations are 15 times greater, and private funds are 4 times greater.
-
Thus although "big" colleges of agriculture (measured by research expenditures) get the most in formula funds, they rely on them the least. Texas A&M U. draws on formula funds for less than 7 percent of its research expenditures, while the University of Massachusetts counts on them to fund 19 percent of research. Schools that do the most research (in absolute terms) also tend to have generally more diversified funding portfolios, although there are exceptions.
TABLE 7-7
Total Research Expenditures (thousands of dollars) of State Agricultural Experiment Stations, by Institution and Funding Mechanism, 1992
|
|
Funding Mechanism |
||||||
|
Institution |
Formula Fundsa |
Competitive Research Grantsa |
Special Research Grantsa |
Other Federal Funds |
State Appropriations |
Private Funds |
Total Expenditures |
|
U. of California |
5,348 (3.6) |
8,604 (5.8) |
3,905 (2.6) |
20,928 (14.1) |
93,530 (63.1) |
15,899 (10.7) |
148,214 |
|
Texas A&M U. |
6,379 (6.8) |
2,860 (3.0) |
1,835 (2.0) |
13,973 (14.9) |
50,138 (53.4) |
18,724 (19.9) |
93,910 |
|
U. of Florida |
3,272 (3.7) |
1,549 (1.7) |
2,036 (2.3) |
9,235 (10.4) |
59,748 (67.1) |
13,241 (14.9) |
89,081 |
|
U. of Wisconsin |
5,223 (7.9) |
4,024 (6.1) |
770 (1.2) |
19,361 (29.2) |
26,183 (39.5) |
10,650 (16.1) |
66,210 |
|
Cornell U. |
4,266 (6.6) |
2,761 (4.3) |
1,877 (2.9) |
13,016 (20.1) |
19,789 (30.6) |
22,953 (35.5) |
64,662 |
|
North Carolina State U. |
6,042 (9.6) |
1,623 (2.6) |
708 (1.1) |
9,541 (15.1) |
34,205 (54.3) |
10,925 (17.3) |
63,044 |
|
Michigan State U. |
4,825 (8.0) |
2,148 (3.6) |
6,573 (10.9) |
13,335 (22.1) |
22,962 (38.1) |
10,462 (17.3) |
60,304 |
|
Iowa State U. |
5,613 (9.4) |
1,406 (2.4) |
6,485 (10.9) |
9,329 (15.7) |
21,957 (36.8) |
14,799 (24.8) |
59,588 |
|
U. of Minnesota |
5,062 (8.7) |
1,325 (2.3) |
1,530 (2.6) |
3,959 (6.8) |
32,519 (55.9) |
13,826 (23.7) |
58,221 |
|
U. of Nebraska |
3,347 (6.5) |
1,055 (2.0) |
2,914 (5.6) |
5,035 (9.7) |
23,311 (45.0) |
16,195 (31.2) |
51,858 |
|
Purdue U. |
4,939 (9.6) |
1,670 (3.3) |
2,887 (5.6) |
8,150 (15.9) |
21,557 (42.0) |
12,079 (23.6) |
51,281 |
|
U. of Georgia |
4,949 (9.9) |
695 (1.4) |
1,768 (3.5) |
2,797 (5.6) |
35,941 (71.7) |
3,969 (7.9) |
50,119 |
|
Virginia Polytechnic Institute and State U. |
4,383 (10.1) |
833 (1.9) |
358 (0.8) |
7,325 (16.8) |
22,183 (51.0) |
8,448 (19.4) |
43,530 |
|
Oregon State U. |
2,661 (6.3) |
1,951 (4.6) |
2,774 (6.6) |
8,953 (21.3) |
18,047 (42.9) |
7,699 (18.3) |
42,085 |
|
Kansas State U. |
3,451 (8.3) |
1,274 (3.1) |
1,383 (3.3) |
4,853 (11.7) |
20,854 (50.2) |
9,725 (23.4) |
41,540 |
|
U. of Arizona |
1,955 (4.9) |
2,022 (5.1) |
378 (1.0) |
9,864 (24.8) |
19,943 (50.2) |
5,569 (14.0) |
39,731 |
|
Louisiana State U. |
3,332 (8.8) |
162 (0.4) |
2,587 (6.8) |
992 (2.6) |
22,769 (59.9) |
8,173 (21.5) |
38,014 |
|
U. of Illinois |
5,303 (14.1) |
1,877 (5.0) |
733 (1.9) |
3,365 (8.9) |
14,114 (37.4) |
12,319 (32.7) |
37,711 |
|
Ohio State U. |
5,678 (15.1) |
685 (1.8) |
1,411 (3.7) |
2,168 (5.8) |
20,885 (55.5) |
6,809 (18.1) |
37,636 |
|
Pennsylvania State U. |
6,091 (16.6) |
566 (1.5) |
2,140 (5.8) |
2,891 (7.9) |
19,111 (52.0) |
5,968 (16.2) |
36,767 |
|
Washington State U. |
3,759 (10.2) |
640 (1.7) |
2,527 (6.9) |
3,916 (10.7) |
17,284 (47.1) |
8,608 (23.4) |
36,735 |
|
Mississippi State U. |
4,368 (12.3) |
280 (0.8) |
3,543 (10.0) |
2,801 (7.9) |
16,165 (45.6) |
8,304 (23.4) |
35,462 |
|
U. of Missouri |
4,778 (14.1) |
2,193 (6.5) |
1,699 (5.0) |
2,055 (6.0) |
16,876 (49.6) |
6,393 (18.8) |
33,993 |
|
Auburn U. |
4,268 (13.2) |
792 (2.4) |
799 (2.5) |
1,840 (5.7) |
17,183 (53.0) |
7,568 (23.3) |
32,451 |
|
U. of Arkansas |
3,728 (11.5) |
506 (1.6) |
2,789 (8.6) |
1,791 (5.5) |
18,124 (56.1) |
5,377 (16.6) |
32,315 |
|
Colorado State U. |
2,728 (9.1) |
1,170 (3.9) |
2,197 (7.3) |
10,788 (36.1) |
7,709 (25.8) |
5,299 (17.7) |
29,892 |
|
Clemson U. |
3,138 (11.0) |
478 (1.7) |
837 (2.9) |
1,617 (5.6) |
19,085 (66.6) |
3,489 (12.2) |
28,644 |
|
Oklahoma State U. |
3,247 (11.5) |
866 (3.1) |
862 (3.1) |
1,683 (6.0) |
16,276 (57.7) |
5,258 (18.7) |
28,192 |
|
North Dakota State U. |
2,308 (8.8) |
472 (1.8) |
2,511 (9.5) |
2,296 (8.7) |
12,981 (49.3) |
5,766 (21.9) |
26,334 |
|
U. of Kentucky |
4,997 (19.5) |
651 (2.5) |
597 (2.3) |
0 (0.0) |
18,374 (71.5) |
1,064 (4.1) |
25,682 |
|
U. of Tennessee |
4,861 (19.3) |
994 (4.0) |
138 (0.5) |
836 (3.3) |
14,013 (55.7) |
4,295 (17.1) |
25,137 |
|
|
Funding Mechanism |
||||||
|
Institution |
Formula Fundsa |
Competitive Research Grantsa |
Special Research Grantsa |
Other Federal Funds |
State Appropriations |
Private Funds |
Total Expenditures |
|
Rutgers—The State U., Cook College |
2,762 (11.0) |
1,502 (6.0) |
1,324 (5.3) |
2,475 (9.9) |
12,985 (51.8) |
3,998 (16.0) |
25,046 |
|
U. of Hawaii |
1,309 (5.6) |
311 (1.3) |
3,061 (13.2) |
2,881 (12.4) |
12,897 (55.5) |
2,765 (11.9) |
23,224 |
|
U. of Maryland |
2,504 (12.0) |
666 (3.2) |
568 (2.7) |
3,058 (14.6) |
12,797 (61.3) |
1,282 (6.1) |
20,875 |
|
U. of Idaho |
1,965 (10.8) |
495 (2.7) |
1,000 (5.5) |
2,117 (11.6) |
10,258 (56.4) |
2,356 (13.0) |
18,191 |
|
Utah State U. |
1,818 (10.7) |
613 (3.6) |
138 (0.8) |
3,736 (22.0) |
7,294 (42.9) |
3,402 (20.0) |
17,002 |
|
Montana State U. |
1,980 (12.4) |
288 (1.8) |
468 (2.9) |
2,754 (17.2) |
7,502 (47.0) |
2,978 (18.6) |
15,971 |
|
South Dakota State U. |
2,452 (16.9) |
657 (4.5) |
82 (0.6) |
355 (2.4) |
6,457 (44.6) |
4,477 (30.9) |
14,480 |
|
New Mexico State U. |
1,724 (13.3) |
460 (3.5) |
1,243 (9.6) |
1,350 (10.4) |
7,414 (57.1) |
790 (6.1) |
12,981 |
|
U. of Maine |
2,233 (18.1) |
378 (3.1) |
673 (5.5) |
1,281 (10.4) |
5,715 (46.3) |
2,050 (16.6) |
12,331 |
|
U. of Massachusetts |
2,259 (19.5) |
429 (3.7) |
485 (4.2) |
522 (4.5) |
3,180 (27.4) |
4,727 (40.7) |
11,602 |
|
U. of Puerto Rico |
3,872 (34.1) |
0 (0.0) |
332 (2.9) |
0 (0.0) |
6,397 (56.3) |
752 (6.6) |
11,353 |
|
Geneva AES |
864 (7.8) |
284 (2.5) |
659 (5.9) |
726 (6.5) |
6,269 (56.3) |
2,341 (21.0) |
11,143 |
|
U. of Delaware |
1,299 (13.8) |
250 (2.6) |
5 (0.1) |
408 (4.3) |
4,968 (52.6) |
2,516 (26.6) |
9,445 |
|
West Virginia U. |
2,824 (34.3) |
198 (2.4) |
45 (0.5) |
1,015 (12.3) |
3,258 (39.6) |
885 (10.8) |
8,226 |
|
U. of Nevada |
1,192 (15.8) |
0 (0.0) |
5 (0.1) |
1,033 (13.7) |
4,014 (53.3) |
1,282 (17.0) |
7,526 |
|
U. of Vermont |
1,322 (18.4) |
42 (0.6) |
1,814 (25.2) |
1,267 (17.6) |
1,924 (26.8) |
819 (11.4) |
7,187 |
|
U. of Wyoming |
1,670 (26.7) |
361 (5.8) |
29 (0.5) |
340 (5.4) |
3,591 (57.4) |
269 (4.3) |
6,260 |
|
U. of Connecticut |
1,005 (16.7) |
233 (3.9) |
378 (6.3) |
934 (15.5) |
2,312 (38.5) |
1,151 (19.1) |
6,011 |
|
U. of Alaska |
1,269 (22.3) |
19 (0.3) |
5 (0.1) |
512 (9.0) |
3,473 (61.1) |
407 (7.2) |
5,685 |
|
New Haven AES |
872 (16.9) |
172 (3.3) |
114 (2.2) |
192 (3.7) |
3,743 (72.4) |
76 (1.5) |
5,170 |
|
U. of New Hampshire |
1,619 (34.6) |
204 (4.4) |
101 (2.2) |
0 (0.0) |
2,468 (52.7) |
289 (6.2) |
4,681 |
|
U. of Rhode Island |
1,237 (34.6) |
50 (1.4) |
166 (4.6) |
390 (10.9) |
1,663 (46.5) |
71 (2.0) |
3,577 |
|
U. of Guam |
781 (28.7) |
0 (0.0) |
279 (10.2) |
0 (0.0) |
1,664 (61.1) |
0 (0.0) |
2,724 |
|
U. of the Virgin Islands |
735 (52.0) |
0 (0.0) |
214 (15.1) |
0 (0.0) |
464 (32.8) |
0 (0.0) |
1,413 |
|
U. of the District of Columbia |
498 (61.8) |
0 (0.0) |
0 (0.0) |
0 (0.0) |
307 (38.2) |
0 (0.0) |
805 |
|
American Samoa Community College |
641 (100.0) |
0 (0.0) |
0 (0.0) |
0 (0.0) |
0 (0.0) |
0 (0.0) |
641 |
|
Northern Marianas College |
454 (79.1) |
0 (0.0) |
0 (0.0) |
0 (0.0) |
0 (0.0) |
120 (20.9) |
575 |
|
Total |
177,459 (18.0) |
55,745 (2.9) |
76,742 (4.8) |
226,037 (10.2) |
906,830 (48.5) |
329,655 (16.2) |
1,772,467 |
|
NOTE: Some SAESs may have incompletely reported research expenditures to CRIS, which would affect the accuracy of this table. For example, in 1992 University of Kentucky's SAES received $725,000 from "other federal funds," which was not reported to CRIS because of university reporting procedures in that year (James A. Boling, University of Kentucky, personal communication, 1995). Number in parentheses is percent of total research expenditures. a Grant programs administered by USDA Cooperative State Research, Education, and Extension Service. SOURCE: Data are from USDA Current Research Information System (CRIS). |
|||||||
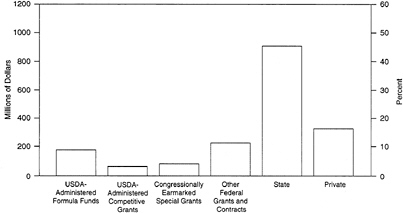
FIGURE 7-5
In 1992 more than 40 percent of total research expenditures by state agricultural experiment stations was provided by the states.
-
Even colleges that have research programs similar in size have taken different funding paths. For example, the University of Missouri and Mississippi State U. had similar research expenditures in 1992; their levels of support from formula funds, other federal funds, and state appropriations were extremely close. However, Mississippi had more private support and nearly twice as much as Missouri in congressionally earmarked grants; Missouri, on the other hand, received significantly more in USDA competitive grants than did Mississippi.
COLLEGES CLUSTERED ACCORDING TO RESEARCH FUNDING MECHANISMS
-
Cluster analysis can also be used to group SAESs according to their funding profile. Funding profiles derived here are based on an institution's portfolio of nonstate funding sources—formula funds, USDA competitive grants, special grants, other federal grants, and private funds—and the percentage of total nonstate funding each source represents in just a single year—1992. Clusters, then, are determined on the basis of the prominence of a particular funding mechanism, such as formula funding, in that year. Table 7-8 classifies 1862 SAESs according to five research funding clusters. Table 7-9 provides a breakdown, in percent, of federal and private funding sources to each of the five funding clusters.
-
Colleges in cluster 1 depended, on average, on traditional formula funds for only 17 percent of their nonstate funds. They received significant funding from other federal funds and private funds. The major land grant research universities are in this group. The funding portfolio for cluster 2 (the largest group) is also quite diversified—on average, formula funds accounted for only 26 percent of nonstate funds—but cluster 2 received more from private funds and less from other federal funds than cluster 1. In other words, cluster 2 colleges appear to be slightly less oriented toward participation in the competitive grant programs of federal agencies and slightly more oriented toward commercial sales of products and licenses and private-sector partnerships.
-
In 1992 colleges in cluster 3 received, on average, more than 40 percent of their nonstate funding from formula grants but also received more than 25 percent of their nonstate funds in the form of special grants—that is, research grants earmarked by Congress. Clusters 4 and 5 rely more on formula funds, although colleges in cluster 4 received relatively more funding through competitive grants than did those in cluster 5.
TABLE 7-8
Classification of 1862 State Agricultural Experiment Stations as Research Funding Clusters, 1992
TABLE 7-9
Breakdown (percent) of Total Federal and Private Research Funding to 1862 State Agricultural Experiment Funding Clusters
|
|
Percent Provided by Funding Mechanisms |
|||||
|
Cluster No. |
Formula Fundinga |
Competitive Grantsa |
USDA Special Grantsa |
Other Federal Grants |
Private Funds |
Total |
|
1 |
17 |
7 |
6 |
36 |
35 |
101 |
|
2 |
26 |
6 |
10 |
15 |
43 |
100 |
|
3 |
44 |
2 |
27 |
15 |
11 |
99 |
|
4 |
66 |
11 |
6 |
7 |
11 |
101 |
|
5 |
77 |
1 |
2 |
9 |
11 |
100 |
|
NOTE: Totals may not equal 100 because of rounding. a Grant programs administered by USDA Cooperative State Research, Education, and Extension Service. SOURCE: Data are from USDA Current Information Research System (CRIS). |
||||||
-
In 1991 28 land grant universities were among the leading 100 university recipients of federal funds for research and development. These are ranked, along with each university's three primary federal funding sources in Table 7-10. The table indicates how far from their agriculture roots some of the land grant universities have come. For only 4 of the 28—North Carolina State U., Iowa State U., Virginia Polytechnic Institute and State U., and the University of Nebraska—is USDA the primary federal funding agency. However, at these schools, USDA funding still accounts for more than 20 percent of federal research and development funds.
TABLE 7-10
Amount (percent) of Funds Received for Research and Development by 1862 Land Grant Universities from Their Three Primary Federal Funding Agencies, 1991
-
The university-wide research environment may be very important to the research funding prospects of the university's college of agriculture. Note that 13 of the 17 colleges in cluster 1 in Table 7-7—the cluster least reliant on USDA formula funding and most diversified toward a combination of other federal funds and USDA competitive grants—are found at land grant universities that receive large percentages of federal research and development funding.
ISSUES FOR DISCUSSION
-
Colleges of agriculture are changing their names at a rapid pace. To what extent do the name changes reflect significant changes in college programs? To what extent does the growing diversity of college names reflect real differences among individual colleges?
-
Do differences in colleges' administrative structure, and how these structures interface with the university-wide administration, make a difference to college performance?
-
Most colleges direct a majority of their research expenditures to plant and animal systems research, but the specific crops and animals of most interest vary regionally. Often, several colleges in the same geographic region share similar commodity research profiles. How does the system avoid redundancy of research effort? Are there opportunities for additional regional research collaboration? What are the advantages and disadvantages of the "regionalization" of research?
-
Some commodity research is highly concentrated at a small number of colleges, but for a number of commodities research is still significantly more diffused than production of the same commodity. Does formula funding provide continued support for smaller, state-based commodity research programs that might not otherwise survive? What would be the benefits and costs of greater specialization in commodity-specific research within the college system?
-
Traditional formula funding has decreased in importance to the large research colleges in the system, but it is still considerably important to many of the smaller ones. How would changes in the formula, or changes in the overall percentage of support through formula funds, affect the distribution of funds among colleges and the viability of smaller institutions?


